Article

A Data-Driven Digital Twin of Electric Vehicle Li-Ion Battery State-of-Charge Estimation Enabled by Driving Behavior Application Programming Interfaces

1
Research and Innovation Center, Arab Academy for Science, Technology and Maritime Transport, Alamein 51718, Egypt
2
Department of Mechatronics Engineering, Alexandria Higher Institute of Engineering and Technology, Alexandria 21311, Egypt
3
College of Artificial Intelligence, Arab Academy for Science, Technology and Maritime Transport, Alexandria 1029, Egypt
4
Department of Marine Engineering Technology, Arab Academy for Science, Technology and Maritime Transport, Alexandria 1029, Egypt
5
Department of Electrical Engineering, Faculty of Engineering, Alexandria University, Alexandria 21544, Egypt
6
CEMSE Division, King Abdullah University of Science and Technology, Thuwal 23955, Saudi Arabia
7
Department of Electrical Power Engineering, Faculty of Engineering, Damanhour University, Damanhour 22511, Egypt
*
Author to whom correspondence should be addressed.
Batteries 2023, 9(10), 521; https://doi.org/10.3390/batteries9100521
Submission received: 15 July 2023 / Revised: 9 October 2023 / Accepted: 10 October 2023 / Published: 23 October 2023

Abstract

:
Accurately estimating the state-of-charge (SOC) of lithium-ion batteries (LIBs) in electric vehicles is a challenging task due to the complex dynamics of the battery and the varying operating conditions. To address this, this paper proposes the establishment of an Industrial Internet-of-Things (IIoT)-based digital twin (DT) through the Microsoft Azure services, incorporating components for data collection, time synchronization, processing, modeling, and decision visualization. Within this framework, the readily available measurements in the LIB module, including voltage, current, and operating temperature, are utilized, providing advanced information about the LIBs’ SOC and facilitating accurate determination of the electric vehicle (EV) range. This proposed data-driven SOC-estimation-based DT framework was developed with a supervised voting ensemble regression machine learning (ML) approach using the Azure ML service. To facilitate a more comprehensive understanding of historical driving cycles and ensure the SOC-estimation-based DT framework is accurate, this study used three application programming interfaces (APIs), namely Google Directions API, Google Elevation API, and OpenWeatherMap API, to collect the data and information necessary for analyzing and interpreting historical driving patterns, for the reference EV model, which closely emulates the dynamics of a real-world battery electric vehicle (BEV). Notably, the findings demonstrate that the proposed strategy achieves a normalized root mean square error (NRMSE) of 1.1446 and 0.02385 through simulation and experimental studies, respectively. The study’s results offer valuable insights that can inform further research on developing estimation and predictive maintenance systems for industrial applications.

Graphical Abstract

1. Introduction

Currently, lithium (li)-ion batteries (LIBs) are considered a viable solution for electric vehicles, including battery, hybrid, plug-in hybrid, and fuel cell electric vehicles [1,2], thanks to their benefits [2,3], including a broad temperature operational range (−20∼60 °C), rapid charge capability, relatively long cycle life, and low self-discharge rate compared to various chemistry-based batteries like lead–acid and nickel-based batteries. However, as LIBs have complex electrochemical systems with strong nonlinearity, LIBs are sensitive to over-charge and over-discharge. If over-charge or over-discharge occurs, the battery’s cycle life could be dramatically reduced, leading to accelerated aging, with a high possibility of fire or even explosion [4,5,6,7]. To avoid such situations, measures should be taken in battery management systems (BMSs) regarding charging and discharging control, battery cell voltage monitoring and balancing, state estimation, temperature control, fault diagnosis and assessment, and so on, to prolong the battery lifetime and ensure an uninterrupted power supply during EV driving.
In a BMS, state-of-charge (SOC) estimation is one of the key functions that quantifies the remaining capacity of a battery at the present cycle and indicates how long the battery can function before a recharge is needed, helping to protect the battery from destructive operating regions (e.g., over-charge and over-discharge) and to determine the EV range and plan trips in advance. However, the direct measurement of the SOC is not feasible, it can only be inferred from measurable battery parameters such as voltage and current. Accurately estimating the SOC remains a challenging task, primarily due to the intricate nature of battery dynamics and the fluctuating operational conditions, which encompass factors like ambient temperature, self-discharge rate, hysteresis, and battery aging [1,3,5,7,8]. Although several methods have been introduced for estimating the SOC of a battery [3,9], many of the existing methods often disregard the influence of EV user behavior and environmental factors, as depicted in Figure 1, on the performance of electric drive vehicles, leading to an inadequate SOC estimation system.
In this context, the advancements produced by Industry 4.0 concepts, including significant advancements in information technologies, have facilitated a critical role for digital twins (DTs), particularly in the transportation industry, enabled by sophisticated data analytics and connectivity through the Internet-of-Things (IoT) [10,11]. Also, the literature has exhibited how DTs can help tackle the current challenges in the automotive industry, particularly in areas such as vehicle product design, manufacturing, sales, and service [11,12,13,14,15]. In this regard, BMSs can be revolutionized by integrating cloud computing and IoT technologies. These technologies enable the measurement and effortless transmission of all pertinent battery data to a cloud-based platform, which, in turn, creates DTs for battery systems. This integration offers four potential key advantages: ➊ monitoring and diagnostics for the battery’s operational states, ➋ prognostics for the trend in battery lifetime degradation, ➌ fault detection and prediction supported by big data analytics, and ➍ optimization for different operational scenarios [16].
These advantages are excelled remarkably by extra dimensions supported by involving the service-oriented DT concept, which is evolved by the paradigm of shifting Industrial Internet-of-Things (IIoT) towards a new concept, an Industrial Internet of Services (IIoS). One of these dimensions is energy efficiency decision making, which increasingly relies on real-time energy management tools and has become crucial in intelligent energy management hubs, smart cities, and 3D stocks [17]. Groundbreaking research has demonstrated several innovative concepts for implementing cloud computing BMSs. However, the studies have two significant limitations that require further enhancements:
  • The technical aspects of backend and hardware design for cloud-based BMS DTs were seldom presented, and the system’s capabilities were not validated through field operations.
  • There is a lack of cloud-compatible battery services algorithms that can support enterprise decision making and leverage a high computational power of real-time data, such as integrating the driving behavior, global positioning system (GPS) location, and weather factors in the SOC estimation for battery electric vehicles (BEVs).
The battery DT is considered more resilient when used in SOC estimation when compared to conventional methods [18]. By combining machine learning (ML) techniques with the DT, it becomes possible not only to predict the SOC using real-world data but also to update the BMS through cloud integration. This, in turn, allows the BMS to maintain safe operating conditions for the batteries and extend their cycle life [19].
By aiming at these issues, this study aims to contribute innovative ideas to solve the technical bottleneck for SOC estimation. The potential contributions of this paper can be summarized in the following bullet points:
  • Proposing a DT framework for SOC estimation of LIBs integrated into a cloud-based data-driven system considering different aspects affecting BEV’s SOC estimation, including driving behavior, GPS location of the EV, and weather factors.
  • Developing a hybrid twin for LIB by bridging the gap between the estimations from the DT and the measurements obtained from the physical LIB module.
  • The proposed method uses readily available measurements in existing LIBs (such as voltage, current, and operating temperature).
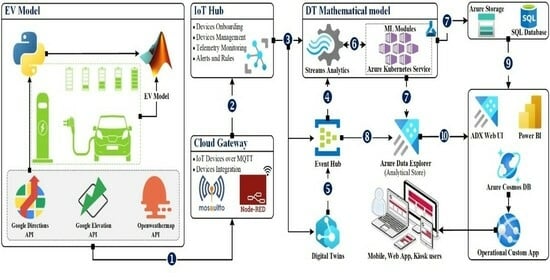
  • Collection of essential data and information from three application programming interfaces (APIs), namely Google Directions API, Google Elevation API, and OpenWeatherMap API, to closely emulate real-world battery electric vehicles.
  • The proposed framework provides information about the battery SOC in advance, facilitating determining the EV range.
  • The effectiveness of the proposed DT model has been validated by simulation and experimental results.
The following sections of this paper are organized as follows. Section 2 provides a review of the current research on SOC estimation and existing studies on battery digital twins. Section 3 presents the proposed DT model. Section 4 describes the validation of the proposed strategy. Conclusions and future directions are enclosed in Section 5.

2. SOC Estimation and Battery Digital Twin

2.1. SOC Estimation

Battery SOC is commonly defined as the ratio of the current remaining capacity of the battery ( C R ) to the rated capacity of the battery ( C N ) [5,20], as indicated in (1).
S O C ( % ) = C R C N 100
where C R and C N are, respectively, the current remaining battery capacity (Ah) and rated battery capacity (Ah). In the standard charge and discharge mode, the SOC of a battery is 0% when it is fully discharged, indicating empty capacity. Conversely, when the battery is fully charged, the SOC reaches 100%, indicating full capacity.
It is necessary to mention that the C R can be influenced by the degradation of electrochemical properties caused by corrosion, usage patterns, charging and discharging rates, temperature, and the number of charging cycles it has undergone. The value of battery C N depends on several factors, including the battery’s state-of-health (SOH), which reflects its overall condition and degradation level, as well as the discharging current rate [5,20,21]. Various modeling and state estimation methods have been proposed to describe the non-linear relationship between SOC and measured LIB variables. The SOC methods can be broadly divided into four categories [3,9,20]: direct estimation method, model-based method, artificial intelligence (AI)-based method, and hybrid method.
The direct SOC estimation method (DSEM), such as open-circuit voltage [22], Coulomb counting [23], and electrochemical impedance spectroscopy [24], may utilize a battery’s physical properties such as resistance, impedance, voltage, and current to estimate the SOC of the battery. These methods are known for their simplicity and cost effectiveness. However, measurement errors and assigning the initial SOC to start with are direct estimation methods setbacks.
The model-based SOC estimation method (MBSEM) has gained popularity recently as a reliable way to estimate SOC. The MBSEM takes advantage of both the measured current, voltage, and temperature signals without relying on the prior knowledge of the initial SOC of the battery [6], and thus forms a close loop estimation method, leading to a more accurate estimation and at the expense of a high computational cost. Such MBSEMs could be the Kalman filter family [20], the sliding mode method [25], the Luenberger observer method [9], etc. As a model-based method, the accuracy and efficiency of SOC estimation are highly affected by the performance of the battery model [7]. Three types of battery models can be employed in this method, including [20] the electrochemical model, the electrical equivalent circuit model, and the electrochemical impedance model. An effective battery model for aiding in SOC estimation should possess two key characteristics [7,20]: ➊ it should accurately represent the dynamic behaviors of the battery across a wide range of operating conditions and ➋ the battery model should be sufficiently simple to integrate with online algorithms. It is necessary to mention that using an inappropriate battery model for SOC estimation could lead to inaccurate and unreliable results, which may adversely impact the management and control of battery systems.
The artificial-intelligence-based method (AIBM) aims to form a predictive model directly instead of analyzing the electrochemical mechanism and building the model by treating a battery system as a black box and extracting correlations from large amounts of pre-existing data. Several AI approaches have been used for battery state estimation, such as machine learning (e.g., neural network [8], decision tree [26], support vector machine [27], etc.), fuzzy logic [28], etc. However, AIBM requires significant computational resources and an extensive dataset to define the non-linear characteristics needed for battery state estimation. Nonetheless, the merits are efficiency, high accuracy, and robustness.
The hybrid SOC estimation method (HSEM) aims to ensure higher precision and better robustness for battery state estimation by combining two or more approaches into a single algorithm. Such an HSEM could be the combination of Coulomb counting and the fuzzy logic method [29], the integration of the extended Kalman filter and the adaptive neuro-fuzzy inference system [30], a combined convolutional neural network and long short-term memory network [31], unified univariate-neural network models and minimized Akaike information criterion algorithm [32], etc. However, the HSEM requires a large memory unit because of its complex mathematical computations.
It can be clearly concluded that functional and operational requirements, component configurations, and how the components are coupled to other BMS algorithms determine the proper SOC method to be used.

2.2. Battery Digital Twin

Accurate modeling of LIBs remains a significant challenge, primarily due to the complex and interdependent nature of the internal battery relationships, which exhibit high non-linearity and strong coupling [33]. Due to these difficulties in parameterizing models, researchers have intensified their focus on data-driven approaches for state estimation problems. Despite a growing prospect to enhance the quantity and variety of data collected from real-world battery systems, some challenges arise with the dynamic nature of the collected data and its volume to effectively utilize the AIBM, especially machine learning techniques [18,20,32,33,34].
Effective managing and curating substantial volumes of data pose challenges similar to those encountered in other big data problems. However, the advancements in ML, data science, and the IoT have given rise to AIBM through the DT as a potential candidate to cure these challenges, as has been demonstrated in [35]. Additionally, the battery DT framework can help overcome challenges associated with installing numerous sensors in locally installed BMSs [35]. Reviews of a couple of papers based on DT-based BMSs are presented as follows:
A DT-based BMS was proposed in [36], which leverages only the voltage sensor to generate multiple estimates of battery states. In this study, a multi-linear regression algorithm was employed to establish a regression model between voltage and the other parameters. Prior to this, a thorough analysis of the correlation between voltage, current, and temperature readings was conducted. It was reported that using only voltage readings, the digital twin successfully estimated battery states with an accuracy rate exceeding 90%.
A regression-based battery SOC estimation DT model was constructed in [37], using sparse proper generalized decomposition data. This regression model enabled real-time monitoring of the overall EV system’s performance, accurately predicting the response of the LIB cell for any given EV itinerary.
A cloud BMS was introduced in [16] based on the concept of IoT and cloud computing to conduct the DT for li-ion and lead–acid battery systems, where the SOC and SOH estimation algorithms were developed based on an extended Thevenin model with extended H- filter and particle swarm optimization, respectively, for accurate monitoring and diagnostics with the cloud BMS.
The DT has also shown significant importance in assessing the degradation of LIBs in the field of battery energy storage systems in spacecraft applications. For instance, a DT platform based on LabVIEW 2018 software and the current and cell voltage of the battery pack was introduced in [38] to realize spacecraft LIB pack assessment, including SOC and SOH estimation based on the Kalman filter with least squares support vector machine and the auto-regression model’s particle filter algorithm, respectively.
It can be clearly concluded that the DT possesses a remarkable capability to mirror the real-time state of a battery system with utmost accuracy. By leveraging advanced technology, cutting-edge algorithms, and continuous data integration, the DT creates a virtual replica that remains synchronized with the physical system. Through the continuous collection and analysis of data from embedded sensors, the DT provides stakeholders with an up-to-date reflection of the battery system’s condition, including crucial parameters such as charge level, temperature, voltage, and overall health. This real-time mirroring capability empowers decision makers to make informed choices regarding maintenance, optimization, and performance improvements.
Accordingly, the research questions investigated in this study are formulated in the following way:
  • How can a DT model be developed and validated for accurate estimation of SOC in the battery systems?
  • How can real-time data capturing, integration, and synchronization be achieved in a DT model for SOC estimation to ensure up-to-date and accurate predictions?
  • What key factors and variables significantly influence the accuracy of a data-driven SOC estimation-based DT model for battery systems?
  • What are the most suitable regression-based ML algorithms for accurate SOC estimation in a DT model?

3. Proposed DT Model

The implementation of DTs does not depend on a single technology but instead requires the integration of multiple technologies, including big data, AI-ML, IoT, cyber–physical systems, edge computing, cloud computing, and communication technologies, among others [39,40].
Different tools can be employed to implement each technological component. While the importance of DT modeling is widely acknowledged in most research papers, there is currently no consensus on a standardized approach for constructing a practical and functional DT model. From this regard, several surveys have been conducted to determine the optimal IoT platform choice from the prominent cloud-based options, including Amazon Web Services (AWS), Microsoft Azure, and Google Cloud Platform (GCP). These surveys focus on evaluating and identifying the most suitable IoT platform candidate based on various factors (e.g., programming language, data storage, data communication protocols, security, etc.). For instance, a parallel analysis was carried out by [41] to compare the services offered by cloud-based IoT platforms, namely AWS, Microsoft Azure, and GCP. The aim of this study is not to determine a winner but rather to offer developers a valuable resource for making informed decisions when selecting a platform based on their specific use case. Another survey conducted in [42] specifically emphasizes the tools and services provided by Azure that support open-source computing. Furthermore, the survey identifies AWS as the preferred IoT cloud platform due to its effectively fulfilling user requirements. Additionally, the survey suggests that GCP offers more advantageous pricing and discount schemes.
It is necessary to mention that AWS-IoT holds the largest market share at 36%, followed by Azure-IoT at 18% and GCP-IoT at 16%, according to the IoT & Edge Developer Survey 2022 [43]. It is worth noting that the IoT platforms mentioned earlier operate on a pay-as-you-go model with different approaches to billing, where each platform has its own pricing structure and considerations. A study [41] has analyzed the cost changes in IoT platforms, focusing on continuous messaging and device connections, providing insights into how the costs may vary based on these factors across the aforementioned IoT platforms.
In this study, Microsoft Azure services will be utilized to facilitate the integration of components, DT simulation, bridging between LIB packs, control of physical twins, data storage, data fusion, and leveraging of Azure ML services.

3.1. System Configuration

The objective of this study is to gain valuable insights into the battery’s SOC through a combination of numerical simulation and experimental studies and predictions from a data-driven DT model. To validate this proposed methodology, both simulated and real-world experiments are conducted, followed by a comparison with the predictions made by the Azure-based DT model.
The numerical simulation and experimental studies are carried out herein, utilizing the Coulomb counting method (CCM) for estimating the battery’s SOC.
The CCM is widely acknowledged as a straightforward method for SOC estimation. Its ease of implementation and simple computation make it a prevalent choice in practical BMS for estimating SOC [5,6]. This method involves integrating the battery charge/discharge current, and then the current SOC value is estimated by the initial SOC, as illustrated in (2).
S O C ( t ) = S O C ( t o ) 1 C N t o t I B d t
where S O C ( t ) , S O C ( t o ) , and I B are, respectively, the current SOC of battery at a specific time t, SOC at the initial time t o , and the current of the battery.
It is necessary to mention that the main purpose of the numerical simulation and experimental studies is to collect the data for DT model conducting, as described next. A short introduction to each one of these systems is given here for completeness.

3.1.1. Numerical Simulation

The reference EV model shown in Figure 2 has been implemented in Matlab®/Simulink platform using the SimPowerSystems toolbox and the Powertrain Blockset, using the procedures that have been illustrated in [44,45,46,47]. Table 1 summarizes the powertrain configuration used in the simulated model.
The depicted BEV block comprises several interconnected electrical and mechanical elements, including the driver, battery pack, motor, differential, wheels, vehicle, and battery management unit. These components work together to replicate the dynamics of a real-world BEV accurately. The functions performed by each one of these blocks in the overall operation of the EV have been thoroughly discussed in [45,47] and are omitted here for brevity. Moreover, this model considers various parameters that influence a BEV’s performance, thereby estimating the battery’s SOC. The potential parameters that influence a BEV’s performance are summarized here:
  • GPS location: This information is essential as different routes may have varying characteristics such as road type, traffic conditions, and elevation changes, impacting energy consumption and SOC estimation.
  • Distance traveled: This is crucial as it directly affects energy consumption and the battery’s SOC. By measuring the distance covered during the trip, it is possible to estimate the energy expenditure and monitor the battery’s state [45].
  • Time traveled: The duration of the trip, or the time spent on the road, is another essential factor to consider. The time traveled can impact energy consumption and SOC due to variations in driving conditions, traffic patterns, and driving speeds.
  • Acceleration: The rate of velocity changes over time and plays a role in determining energy consumption. Aggressive acceleration increases power demands, leading to higher energy usage and faster SOC depletion [47].
  • Driving state: Categorizes the vehicle’s movement into climbing, steady, or declining driving conditions. Each state has different energy requirements, with climbing typically demanding more energy and causing faster SOC depletion, while declining may enable regenerative braking, recovering energy, and improving SOC.
  • Ambient temperature: Aggressive changes in ambient temperatures can have a significant impact on the battery’s internal resistance and capacity. At lower temperatures, the battery’s internal resistance typically increases, leading to higher losses. Conversely, at higher temperatures, these increases can accelerate chemical reactions within the battery, resulting in expedited degradation and reduced capacity. To mitigate these effects, thermal management systems are commonly employed [3,48].
  • Atmospheric pressure: The pressure is closely tied to altitude, as atmospheric pressure decreases with increasing altitude, and vice versa. As the altitude changes during a trip, the air density also changes. This variation in air density can influence the aerodynamic forces acting on the EV, which, in turn, affects energy consumption and, consequently, the battery’s SOC [49].
  • Wind speed: Wind speed directly affects the aerodynamic drag experienced by the EV. For instance, higher rates of wind speeds, particularly headwinds, increase resistance and energy consumption, resulting in a decrease in the battery’s SOC [50,51].
  • Wind direction “degree”: This can impact the aerodynamics of the EV. For instance, crosswinds, in particular, can introduce additional resistance and affect energy consumption and SOC depending on the EV’s heading and wind angle [50].
In this study, the three depicted APIs shown in Figure 3 have been employed to collect crucial data that significantly affects the dynamics of a real-world BEV, namely Google Directions API, Google Elevation API, and OpenWeatherMap API.
Algorithm 1 offers a comprehensive, step-by-step explanation of Figure 3. This comprehensive approach, combining various data points and utilizing multiple APIs, enables accurate estimation of SOC for a given EV trip. By utilizing the functionalities of these APIs, the depicted simulated model in Figure 2 can accurately replicate and analyze various aspects of a real-world BEV behavior. The key role of these APIs is shown in Figure 3 and Algorithm 1 and summarized here:
  • Google Directions API is used to retrieve directions and route information between the initial and final destination locations; accordingly, detailed information about the trip can be provided, such as distance traveled, time traveled, and coordinates for each point along the trip route “polyline”.
  • Google Elevation API calculates the road inclination during the trip “driving state”. By providing the coordinates obtained from the Google Directions API, this API can determine whether the road is climbing, steady, or declining. This information can be useful for analyzing the driving conditions and the effect on EV range.
  • OpenWeatherMap API is leveraged to retrieve weather-related data at the EV’s location. It provides information such as ambient temperature, atmospheric pressure, and wind speed direction.
Algorithm 1: Integrating data sources from the APIs
Batteries 09 00521 i001
As illustrated in Figure 2, this BEV block receives two primary inputs. ➊ Environment (ENT): This block is implemented using Python-based code and serves as a data acquisition system. It collects crucial environmental data throughout the vehicle’s journey, encompassing factors such as ambient temperature, atmospheric pressure, wind speed, wind direction, and route information “driving state”, these data are obtained by interfacing with the aforementioned APIs (see Figure 3). ➋ Drive cycle source (DCS): This block is responsible for generating longitudinal drive cycles, which can be standardized (e.g., FTP-75) or customized by the user. These drive cycles are essential for creating realistic velocity and shift references used in closed-loop acceleration and braking commands within the vehicle’s control [52]. In this study, the velocity data are derived from calculations using the Google Directions API, as illustrated in Figure 3.
In the concluding phase of this system, results and data generated by the ENT, BEV, and DCS are showcased prominently on the driver console, as shown in Figure 2. This console serves as a feedback interface, offering essential information to the operator, encompassing the battery’s SOC, motor speed, vehicle speed, etc.

3.1.2. Experimental Setup

The experiment aims to investigate the effects of real-world driving cycle data on an experimental battery pack using the current profile(s) obtained from a simulated model.
The battery pack (BP) considered in the experiments consists of 3 (series) × 8 (parallel) LIBs, as illustrated in Figure 4. The voltage and current for one LIB are 4.2 V and 2 A, respectively. Consequently, the voltage and current for the whole battery pack are 12.6 V and 16 A, respectively.
In this study, the DC electronic load (brand: Keysight, model: N3303A) has been chosen to provide a controllable and adjustable electrical load that can draw the current from the real-world battery pack. It is necessary to mention that the load drawn from the battery pack is determined by the current profile obtained from the simulated model. Since the current profile obtained from the simulated model is higher than the rated of the DC electronic load ( I N = 10 A), it is normalized using the decimal scaling normalization method.
The data station’s role herein is to extract and analyze the main system variables with a 1 kHz sampling frequency using the microcontroller board based on the ATmega2560 and in conjunction with the Matlab®/Simulink platform.
The measurement dataset acquired from the experimental system comprises five key features: measured BP voltage, measured BP current, ambient temperature, ambient humidity, and average BP temperature, along with the corresponding SOC estimated using the CCM-based method.
The BP voltage, BP current, and temperature and humidity of the ambient are measured using a resistive voltage divider (with 100/5 V ratio), Allegro ACS712ELCTR-30A current sensor, and DH11 sensor module, respectively. The average BP temperature ( T B P ) has been taken into account since temperatures of LIBs embedded in the battery module may be distinctly different. Therefore, to ensure an accurate calculation of the BP temperature, seven temperature sensors (NTC-10K, T s 1 , T s 2 , , T s 7 ) have been distributed inside the battery module, as depicted in Figure 4.

3.2. Data-Driven SOC-Based DT Proposed Strategy

The required behaviors and model fidelity of a DT depend on the intended use case of the DT. Figure 5 provides an overview of the proposed DT of the LIB-based EV using Microsoft Azure services.
The real-time streams are ingested from a simulated and real-world LIB module “BP” and Algorithm 1, which represents the driving behavior, the weather temperature, and the EV’s GPS location into a local data processing gateway designed by the Node-Red (see Figure 6), which then forwards it to the virtual cloud replica.
The computational time scale for the DT model’s selection is an important consideration. It should be aligned with the specific use case of the DT, taking into account factors such as signal sampling rates and data processing time in the DT code. This ensures that the model selection process can be executed within the desired timeframe, meeting the real-time requirements of the system. Implementing a multi-level hierarchical DT can be challenging due to several factors [53,54,55]:
  • Execution time: As the complexity of the DT increases with multiple layers and interactions, the execution time required for processing and updating the models also increases. It is crucial to manage the computational load efficiently and optimize the algorithms to ensure that the DT operates in a timely manner.
  • Data exchange: In a multi-level DT architecture, data exchange between different layers is essential for information flow and synchronization. Efficient mechanisms need to be established to facilitate data exchange between layers while minimizing delays and bottlenecks. This ensures that the models at different levels are updated with the latest information from the physical entity.
  • Time dependencies: The layers in a hierarchical DT may have time dependencies, meaning changes in one layer can affect the models and data in other layers. It is important to manage these dependencies to ensure consistency and accuracy throughout the system. Synchronization mechanisms need to be in place to handle these dependencies and update the models in a coordinated manner. In this study, a synchronization mechanism has been implemented at the Node-Red gateway by adding a time synchronization function to each twin device.
By combining the strengths of different modeling techniques, a more realistic virtual replica of the physical entity can be created. The DT modeling processes proposed in this study are shown in Figure 7 and summarized here:
  • Physical space: This refers to the real-world entity or system that the DT aims to replicate and monitor, specifically the LIB system in this case.
  • Perception layer: The perception layer is responsible for data collection and time synchronization. It collects comprehensive data from the physical LIB system, ensuring that the data are synchronized with the DT system’s timeline. This layer is crucial in acquiring the necessary input data for subsequent processing and modeling.
  • Middle layers: The middle layers are responsible for data processing tasks such as signal interpolation and data filtering. They receive the data collected by the perception layer and perform necessary pre-processing steps to prepare the data for modeling and storage. This may involve techniques like signal interpolation to fill in missing data points or data filtering to remove noise and anomalies.
  • Modeling layer: The modeling layer utilizes the processed data to build and refine the DT models. Different modeling techniques can be employed in this layer, such as physics-based models, data-driven models, cybernetics “hybrid techniques” models, and/or expert system models, to create an accurate virtual replica of the LIB system. These models capture the behavior and dynamics of the physical entity, enabling simulations and predictions.
  • Decision visualization layer: This facilitates human interaction with the DT system. It provides a graphical user interface (GUI) that displays the components of the EV and control features related to optimizing the LIB performance. The GUI allows users to visualize and interact with the DT models, enabling them to make informed decisions and take appropriate actions based on the insights provided by the DT.
Figure 7. The adopted DT modeling processes.
Batteries 09 00521 g007
The DT architecture described in this study includes these layers, ensuring the integration of data collection, processing, modeling, and decision making. The GUI provides an intuitive interface for human operators to monitor the LIB system and optimize its performance. By leveraging the strengths of different modeling techniques and enabling human interaction, the proposed DT architecture aims to create an effective virtual replica that closely represents the behavior and characteristics of the physical LIB system.

3.2.1. Supervised Voting Ensemble Regression ML

To enhance the capabilities of the proposed model, a supervised voting ensemble regression ML approach was incorporated using Azure Automated machine learning (AutoML). Azure AutoML is an ML platform that automates the process of building and selecting the best-fit ML model(s) for a given dataset [56,57,58,59,60,61].
In this context, by leveraging the power of multiple ML models and combining their predictions through a voting ensemble approach, the model’s overall performance and accuracy can be improved. The voting ensemble in Azure ML combines the predictions of multiple ML models to improve the accuracy and robustness of the final prediction [59,60].
The process involves training several models on the same dataset but with different algorithms, hyper-parameters, or subsets of features “inputs”. Accordingly, each model learns from the data and generates its own predictions. The predictions of these models are then combined using a voting scheme to realize the final prediction.
Azure ML provides several built-in voting ensemble approaches that can be utilized for both classification and regression problems, such as majority voting, weighted voting, and the stacking ensemble. These approaches offer flexibility and convenience in implementing the voting ensemble approach within the Azure ML framework.
In this study, a supervised voting ensemble regression model is conducted using the weighted voting approach. In this approach, the final prediction ( y ^ E ) is obtained by combining the predictions of multiple individual regression models using weights, as given in (3). The weights assigned to each model reflect their contribution to the final prediction.
y ^ E = w 1 | M 1 ( y ^ 1 | M 1 ) + w 2 | M 2 ( y ^ 2 | M 2 ) + + w n | M n ( y ^ n | M n )
where y ^ E , y ^ i | M i , w i | M i , and n are, respectively, the final prediction by the ensemble using majority voting, the prediction made by the ith individual model, and the weight assigned to the ith individual model, and the number of individual models in the ensemble.
In the context of the voting ensemble model outlined herein, an ensemble weight of “1” is specifically assigned. This weight allocation is carefully designed to ensure that the model with the lowest normalized root mean square error (NRMSE) score, achieved through various combinations of linear regression algorithms, including Gradient Boosting (XGBoostRegressor), ElasticNet, or Light Gradient Boosting Machine (LightGBM), coupled with any of the data pre-processing scaling techniques (MaxAbsScaler, MinMaxScaler, RobustScaler, or StandardScalerWrapper), assumes complete authority over the ensemble’s final prediction. Hence, Equation (3) can be simplified to:
y ^ E = 1 · y ^ i | M i
In this streamlined approach, the training process places the highest importance on the predictions generated by the MaxAbsScaler and XGBoostRegressor algorithm, as evidenced by their remarkably low NRMSE value of 0.00047. In contrast, MaxAbsScaler paired with LightGBM and MaxAbsScaler combined with ElasticNet achieved NRMSE values of 0.00395 and 0.02261, respectively. Consequently, Equation (4) can be rewritten as:
y ^ E = 1 · y ^ X G B o o s t R e g r e s s o r
Equation (5) elucidates the predominant role of the MaxAbsScaler and XGBoostRegressor combination in the ensemble’s decision-making process, as it has proven to be the most accurate and influential among the considered options.

3.2.2. Evaluation Metrics

Various statistical metrics can be used to measure the differences between the predicted SOC value from the trained ensemble model and the actual “true” SOC value, such as root mean square error, normalized root mean square error, mean absolute error, and mean absolute percentage error [56,62]. The NRMSE will be used herein.
Root mean square error (RMSE) is a widely used metric in ML to assess the performance of regression models. It calculates the root mean square of the differences between actual and predicted values. RMSE provides a measure of the spread of residuals (the vertical distance between the regression line and the actual data points) and represents the standard deviation of the errors. The RMSE metric can be calculated using the following formula (6):
R M S E = j = 1 q ( y j y j ^ ) 2 q
where y j , y j ^ and q are, respectively, the actual value for the jth data point, the predicted value for the jth data point, and the total number of predicted points.
NRMSE is a variation of RMSE that scales the error by the range of the actual values. It provides a normalized measure of the model’s performance. This allows for better comparison across different datasets. The NRMSE metric is calculated as in (7):
N R M S E = R M S E m a x ( y j ) m i n ( y j )
where m a x ( y j ) and m i n ( y j ) are, respectively, represent the maximum and minimum of actual values.

4. Verification and Discussion

To test the hypothesis and answer the research questions, three main experiments are conducted in a similar fashion “estimating the battery’s SOC”, namely simulated model-based estimated SOC, real-world-based estimated SOC, and DT model-based estimated SOC. The SOC estimated in the former two experiments is carried out using the CCM, while the latter is a data-driven SOC estimation-based DT model.
The work is carried out in Matlab 2023a, running on a Dell personal computer with a specification of an Intel® CoreTM i7-11700U processor at 2.50 GHz with 16 GB RAM.

4.1. Data Collection

To ensure comprehensive coverage of the wide range of the LIB’s SOC levels of BEV, the study employed a meticulous selection process for three long driving routes, as shown in Figure 8a. Each of these routes was approximately 58.7 km in length, resulting in a total driving distance of 176.1 km. The selected routes were designed to encompass a diverse range of driving conditions and speeds, ranging from 0 to 120 km/h.
It is necessary to mention that the selected driving routes aimed to cover the entire SOC range from 100% (fully charged) to 5% (nearly depleted). This extensive range will allow comprehensive verification of the SOC estimation framework’s performance across different SOC levels.
The experiment commenced by extracting voltage and current profiles of the LIB module for these routes using the reference EV model depicted in Figure 2 and considering the entities related to the aforementioned APIs (see Figure 3). Consequently, these profiles effectively captured how different driving scenarios affect the battery’s performance, providing a realistic representation of the battery’s behavior under various driving conditions. Then, the current profile obtained from the simulated model has been normalized, as mentioned earlier, to closely replicate the behavior of the reference EV model within the experimental setting. This normalization process aimed to align the simulated and real-world models, enabling a more accurate comparison, as illustrated in Figure 9.
The key role of the normalization method can be elucidated from the simulated model-based SOC estimation and real-world-based SOC estimation results, which are given in Figure 9g and Figure 9h, respectively. The quantitative comparison was quantified using the NRMSE metric, which resulted in a value of 0.0195. This low NRMSE value indicated a close match between the estimated SOC values from the simulated LIB module and the real-world LIB module, which can further translate into the SOC estimation process in the real world and closely align with the simulation model behavior of the LIB module.

4.2. DT Model for Battery’s SOC Estimation

To accurately simulate the performance of the proposed data-driven SOC estimation-based DT model, a comprehensive statistical-based model was developed using a dataset size of 12,852 events. This dataset likely comprised a collection of measurements and observations related to battery parameters and driving behaviors.
The model specifically incorporated the real parameters of the LIB module, which included the voltage, current, and operating temperature during the three selected routes (see Figure 8a). These parameters are crucial for accurately representing the behavior and characteristics of the battery. In addition to the LIB module parameters, the model is also integrated with various essential driving behaviors. This included factors such as the traveled distance, traveled time, weather temperature, route driving state, and the BEV’s speed. By incorporating these driving behaviors, the DT aimed to capture the intricate relationship between the LIB parameters and driving behaviors, enabling a more accurate prediction of SOC in the proposed data-driven model.
This model was conducted with a supervised voting ensemble regression ML approach utilizing the Azure AutoML service, as discussed earlier. The AutoML service was employed to deploy the best-fit prediction model by leveraging its capabilities in generating and evaluating multiple regression models to optimize the performance and accuracy of the SOC prediction, as shown in Figure 10.
The voting ensemble regression ML technique, featuring the MaxAbsScaler and XGBoostRegressor algorithm proved to be highly effective in predicting the SOC values in the proposed data-driven model. This combination allowed for a more robust and accurate estimation of the SOC, which can be demonstrated from the scored value of NRMSE, which reached an impressively low value of 0.00047, indicating the model’s high accuracy in predicting SOC values. This low NRMSE score signifies that the model’s predictions closely align with the real-world SOC values, demonstrating its reliability and precision.
In order to determine the top-k important features of driving behavior that significantly impact overall SOC model predictions, a method known as “feature importance analysis” was employed. Through this analysis, it was discovered that the traveled distance, BP current, BP temperature, traveled time, ambient temperature, BP voltage, BEV’s speed, and driving state were identified as the most influential factors, with importance values of 5.424, 4.291, 4.093, 4.083, 3.414, 3.297, 3.116, and 2.145, respectively. These features played a crucial role in accurately estimating the SOC in the proposed model.
It is necessary to mention that the driving state of the routes has been simulated and represented in this study using the values 1, 0, and −1, these numerical representations corresponded to climbing, steady, and descending conditions, respectively.
By employing feature importance analysis, the model could prioritize and highlight features that play a crucial role in the accurate estimation of SOC, providing valuable insights for the development and improvement of the SOC model.

4.3. Digital Twin Model Validation

The validation process for the DT model involves practical testing to evaluate its performance in estimating the SOC of the real-world LIB module under various driving behaviors and operational conditions. By comparing the estimated SOC values generated by the DT model with the SOC measurements obtained through CCM from the real-world LIB module, the accuracy of the DT model can be assessed. This comparison serves as a means to validate the DT model’s ability to predict the SOC under different driving behaviors and operational conditions.
To conduct the validation, a specific route of 6.6 km is selected (see Figure 8b), which involves a dataset size of 1000 events. This route is strategically chosen to encompass diverse driving conditions, including varied driving states, as depicted in Figure 11. By incorporating different terrains and gradients, the chosen route allows for a comprehensive evaluation of the DT model’s performance across a range of driving scenarios. The validation process begins by setting the initial SOC of the LIB module in the reference and real-world EV model to 100%. The test involves driving the BEV in the reference EV model at different speeds, ranging from 5 to 120 km/h. This wide speed range ensures that the DT model’s performance is evaluated across various driving conditions, including both low-speed and high-speed scenarios. Moreover, the influence of ambient temperature and pressure, as well as the speed and direction of the wind, have been taken into account, using the procedures discussed earlier. Thereafter, the BP current obtained from the reference EV model is normalized to adapt to the real-world LIB module, ensuring the real-world LIB module closely matches the behavior of the LIB module in the simulated model.
After obtaining the real-world LIB module measurements including the voltage, current, and operating temperature. These measurements are injected into the proposed DT model in conjunction with the data obtained from the reference EV model, namely traveled distance, travel time, ambient temperature, BEV’s speed, and driving state. When comparing the SOC estimated based on the DT model to the SOC estimated-based CCM; for the real-world LIB module, a score of NRMSE = 0.02385 was obtained. This lower score indicates that the SOC estimates from the DT model are in close agreement with the SOC values obtained through CCM for the real-world LIB module, as illustrated in Figure 11g.
It is necessary to mention that when the SOC estimated based on the DT model is compared to the SOC estimated based on a simulated reference EV model using the CCM, as shown in Figure 11g, a higher score of NRMSE = 1.1446 was observed; this elevated value can be attributed to the BP current profile normalization method.

4.4. Proposed Dashboard

The user interface was designed with a user-friendly GUI, as shown in Figure 12. This GUI, in essence, utilizes trained data and algorithms to calculate the estimated SOC based on the input arguments and the proposed DT model. In this context, the proposed DT simulates the behavior of the EV’s battery and predicts the estimated SOC throughout the planned trip. This real-time estimation assists EV users in making informed decisions about their range, optimizing charging strategies, and planning trips in advance.
Through this GUI, users can enter the initial SOC of the EV’s battery, which represents the amount of energy stored in the battery at the start of the trip. Furthermore, the GUI allows users to specify the source and destination of their desired route. By inputting this information, users can obtain estimations of the EV’s range for the intended trip. This functionality helps users assess whether the EV’s battery capacity is sufficient to reach their destination and plan for necessary charging stops along the way. Additionally, the GUI incorporates a feature for users to input their driving behavior preferences.
In short, by accounting for user-specific driving behavior, as well as defining the initial SOC and source and destination of the trip, the proposed GUI provides accurate SOC estimations that align with the user’s driving style and preferences.

5. Conclusions and Future Work

This study proposed an IIoT-based DT framework using Microsoft Azure services. By leveraging readily available measurements such as voltage, current, and operating temperature from the LIB module, the proposed DT framework provides advanced information about the SOC of the battery, enabling accurate determination of the EV range. The SOC estimation-based DT framework adopts a data-driven approach by utilizing a supervised voting ensemble regression machine learning model. This ML voting ensemble model based on the majority voting concept has been allocated with an ensemble weight of “1” to the model that produces the lowest NRMSE score from a range of linear regression algorithms (including XGBoostRegressor, ElasticNet, or LightGBM) when coupled with any data pre-processing scaling technique (MaxAbsScaler, MinMaxScaler, RobustScaler, or StandardScalerWrapper). The model boasting the lowest NRMSE score exercises complete authority over the ensemble’s ultimate prediction.
To ensure the accuracy of the SOC estimation-based DT framework and obtain a comprehensive understanding of historical driving patterns, this study integrates three APIs: Google Directions API, Google Elevation API, and OpenWeatherMap API. The collected data from these APIs is then utilized on a reference simulated EV model to closely emulate the dynamics and characteristics of real-world BEVs. The framework is designed to conduct the DT model based on the real-world LIB module, considering the normalized BP current from the reference EV model to practical scenarios realization. The SOC estimation of the real-world LIB module, conducted using the CCM, has been evaluated through quantitative analysis using the NRMSE metric. The resulting NRMSE value of 0.0195 demonstrates a remarkably close match between the estimated SOC values derived from the simulated LIB module based on the CCM and the actual SOC values obtained from the real-world LIB module. On the other hand, the data-driven DT, ML training process based on Azure AutoML revealed that the MaxAbsScaler paired with the XGBoostRegressor algorithm achieved an outstandingly low NRMSE value of 0.00047, signifying its exceptional predictive accuracy.
The validation results showed that the proposed strategy is able to estimate SOC, in the simulation and experimental studies, with an NRMSE of 1.1446 and 0.02385, respectively. These findings highlight the close agreement between the SOC estimates from the DT model and the SOC values obtained through the CCM for the real-world LIB module confirming the reliability and accuracy of the DT-based SOC estimation approach.
In future work, several aspects can be explored to enhance the proposed framework and SOC estimation approach. Firstly, the integration of additional data sources can provide further insights, such as charging infrastructure data and energy grid information. Furthermore, while the CCM has offered benefits in terms of cost and computation, issues related to battery aging, temperature variations, and initial SOC determination could arise. Therefore, future work may explore more effective methods, such as those within the Kalman filter family, for actively, responsively, and reliably estimating SOC based on measured battery variables. This, in turn, enhances the reliability of the collected data used in conducting the data-driven DT model framework. Secondly, advanced machine learning techniques, including deep learning models like convolutional neural networks, will be explored to enhance the DT framework’s performance. Additionally, increasing the dataset size will be a top priority in the future. Expanding the dataset will enable more rigorous testing of the model’s performance across a wider range of scenarios and conditions, thereby playing a crucial role in refining and validating the effectiveness of our approach. Lastly, the integration of the SOC estimation-based DT framework with predictive maintenance systems remains an exciting avenue for future research.

Author Contributions

Conceptualization and methodology, R.I., M.M.B., O.S. and A.A.O.; software, O.S. and A.A.O.; validation, R.I. and A.A.O.; formal analysis, R.I., A.A.O. and M.M.B.; investigation, M.S.H., A.S.A.-K. and S.A.; resources and data curation, R.I., M.M.B., A.A.O. and O.S.; writing—original draft preparation, R.I. and M.M.B.; writing—review and editing, R.I., M.M.B., O.S. and S.A.; visualization and supervision, M.S.H., A.S.A.-K. and S.A.; project administration, funding acquisition, and control design, E.H. and S.M.I. All authors have read and agreed to the published version of the manuscript.

Funding

This work was supported by the Information Technology Industry Development Agency (ITIDA)-Egypt, Information Technology Academia Collaboration (ITAC) program of collaborative funded project under the category of Preliminary Research Projects (PRP), Grant PRP2021.R31.28.

Data Availability Statement

The data presented in this study are available on request.

Acknowledgments

The authors would like to thank the Management, Arab Academy for Science, Technology and Maritime Transport, Alamein, Egypt for providing the support to carry out research work. This work is carried out at the Research and Innovation Center, Arab Academy for Science, Technology and Maritime Transport, Alamein, Egypt.

Conflicts of Interest

The authors declare no conflict of interest.

Abbreviations

AIArtificial Intelligence
AIBMArtificial Intelligence-Based Method
APIApplication Programming Interface
AutoMLAutomated Machine Learning
AWSAmazon Web Service
BEVBattery Electric Vehicle
BMSBattery Management System
BPBattery Pack
C.G.Centre of Gravity
CCMCoulomb Counting Method
DCDirect Current
DCSDrive Cycle Source
DSEMDirect SOC Estimation Method
DTDigital Twin
ENTEnvironment
EVElectric vehicle
FTPFederal Test Procedure
GCPGoogle Cloud Platform
GPSGlobal Positioning System
GUIGraphical User Interface
HSEMHybrid SOC Estimation Method
IIoTIndustrial Internet-of-Things
IoTInternet-of-Things
JSONJavaScript Object Notation
LIBLithium-Ion Battery
LightGBMLight Gradient Boosting Machine
MaxAbsScalerMaximum Absolute Scaler
MBSEMModel-Based SOC Estimation Method
MinMaxScalerMinimum-Maximum Scaler
MLMachine Learning
NRMSENormalized Root Mean Square Error
RMSERoot Mean Square Error
SOCState-Of-Charge
SOHState-Of-Health
XGBoostRegressoreXtreme Gradient Boosting Regressor

References

  1. Habib, A.A.; Hasan, M.K.; Mahmud, M.; Motakabber, S.M.; Ibrahimya, M.I.; Islam, S. A review: Energy storage system and balancing circuits for electric vehicle application. IET Power Electron. 2021, 14, 1–13. [Google Scholar] [CrossRef]
  2. Hannan, M.A.; Hoque, M.M.; Hussain, A.; Yusof, Y.; Ker, P.J. State-of-the-art and energy management system of lithium-ion batteries in electric vehicle applications: Issues and recommendations. IEEE Access 2018, 6, 19362–19378. [Google Scholar] [CrossRef]
  3. Liu, W.; Placke, T.; Chau, K.T. Overview of batteries and battery management for electric vehicles. Energy Rep. 2022, 8, 4058–4084. [Google Scholar] [CrossRef]
  4. Ouyang, D.; Weng, J.; Chen, M.; Wang, J.; Wang, Z. Sensitivities of lithium-ion batteries with different capacities to overcharge/over-discharge. J. Energy Storage 2022, 52, 104997. [Google Scholar] [CrossRef]
  5. Zhou, L.; Lai, X.; Li, B.; Yao, Y.; Yuan, M.; Weng, J.; Zheng, Y. State Estimation Models of Lithium-Ion Batteries for Battery Management System: Status, Challenges, and Future Trends. Batteries 2023, 9, 131. [Google Scholar] [CrossRef]
  6. Xu, J.; Cao, B.; Chen, Z.; Zou, Z. An online state of charge estimation method with reduced prior battery testing information. Int. J. Electr. Power Energy Syst. 2014, 63, 178–184. [Google Scholar] [CrossRef]
  7. Shen, J.N.; He, Y.J.; Ma, Z.F.; Luo, H.B.; Zhang, Z.F. Online state of charge estimation of lithium-ion batteries: A moving horizon estimation approach. Chem. Eng. Sci. 2016, 154, 42–53. [Google Scholar] [CrossRef]
  8. Yang, F.; Li, W.; Li, C.; Miao, Q. State-of-charge estimation of lithium-ion batteries based on gated recurrent neural network. Energy 2019, 175, 66–75. [Google Scholar] [CrossRef]
  9. T, G.; C, D. A Review on Different State of Battery Charge Estimation Techniques and Management Systems for EV Applications. Electronics 2022, 11, 1795. [Google Scholar] [CrossRef]
  10. Biller, B.; Biller, S. Implementing Digital Twins That Learn: AI and Simulation Are at the Core. Machines 2023, 11, 425. [Google Scholar] [CrossRef]
  11. Wang, Z.; Liao, X.; Zhao, X.; Han, K.; Tiwari, P.; Barth, M.J.; Wu, G. A digital twin paradigm: Vehicle-to-cloud based advanced driver assistance systems. In Proceedings of the 2020 IEEE 91st Vehicular Technology Conference (VTC2020-Spring), Antwerp, Belgium, 30 June 2020. [Google Scholar] [CrossRef]
  12. Hanelt, A.; Piccinini, E.; Gregory, R.W.; Hildebrandt, B.; Kolbe, L.M. Digital transformation of primarily physical industries-exploring the impact of digital trends on business models of automobile manufacturers. Wirtsch. Proc. 2015. Available online: https://aisel.aisnet.org/wi2015/88 (accessed on 9 October 2023).
  13. Piromalis, D.; Kantaros, A. Digital Twins in the Automotive Industry: The Road toward Physical-Digital Convergence. Appl. Syst. Innov. 2022, 5, 65. [Google Scholar] [CrossRef]
  14. Bhatti, G.; Mohan, H.; Singh, R.R. Towards the future of smart electric vehicles: Digital twin technology. Renew. Sustain. Energy Rev. 2021, 141, 110801. [Google Scholar] [CrossRef]
  15. Biesinger, F.; Weyrich, M. The facets of digital twins in production and the automotive industry. In Proceedings of the 2019 23rd International Conference on Mechatronics Technology (ICMT), Salerno, Italy, 23–26 October 2019. [Google Scholar] [CrossRef]
  16. Li, W.; Rentemeister, M.; Badeda, J.; Jöst, D.; Schulte, D.; Sauer, D.U. Digital twin for battery systems: Cloud battery management system with online state-of-charge and state-of-health estimation. J. Energy Storage 2020, 30, 101557. [Google Scholar] [CrossRef]
  17. Francisco, A.; Mohammadi, N.; Taylor, J.E. Smart city digital twin–enabled energy management: Toward real-time urban building energy benchmarking. J. Manag. Eng. 2020, 36, 04019045. [Google Scholar] [CrossRef]
  18. Zhao, K.; Liu, Y.; Ming, W.; Zhou, Y.; Wu, J. Digital twin-driven estimation of state of charge for Li-ion battery. In Proceedings of the 2022 IEEE 7th International Energy Conference (ENERGYCON), Riga, Latvia, 9–12 May 2022. [Google Scholar] [CrossRef]
  19. Tang, H.; Wu, Y.; Cai, Y.; Wang, F.; Lin, Z.; Pei, Y. Design of power lithium battery management system based on digital twin. J. Energy Storage 2022, 47, 103679. [Google Scholar] [CrossRef]
  20. Shrivastava, P.; Soon, T.K.; Idris, M.Y.; Mekhilef, S. Overview of model-based online state-of-charge estimation using Kalman filter family for lithium-ion batteries. Renew. Sustain. Energy Rev. 2019, 113, 109233. [Google Scholar] [CrossRef]
  21. Xu, J.; Gao, M.; He, Z.; Han, Q.; Wang, X. State of charge estimation online based on EKF-Ah method for lithium-ion power battery. In Proceedings of the 2009 2nd International Congress on Image and Signal Processing, Tianjin, China, 17–19 October 2009. [Google Scholar] [CrossRef]
  22. Roscher, M.A.; Sauer, D.U. Dynamic electric behavior and open-circuit-voltage modeling of LiFePO4-based lithium ion secondary batteries. J. Power Sources 2011, 196, 331–336. [Google Scholar] [CrossRef]
  23. Movassagh, K.; Raihan, S.A.; Balasingam, B. Performance analysis of coulomb counting approach for state of charge estimation. In Proceedings of the 2019 IEEE Electrical Power and Energy Conference (EPEC), Montreal, QC, Canada, 16–18 October 2019. [Google Scholar] [CrossRef]
  24. Leng, F.; Tan, C.M.; Yazami, R.; Le, M.D. A practical framework of electrical based online state-of-charge estimation of lithium ion batteries. J. Power Sources 2014, 255, 423–430. [Google Scholar] [CrossRef]
  25. Bouchareb, H.; Saqli, K.; M’sirdi, N.K.; Bentaie, M.O.; Naamane, A. Sliding mode observer design for battery state of charge estimation. In Proceedings of the 2020 5th International Conference on Renewable Energies for Developing Countries, Marrakech, Morocco, 29–30 June 2020. [Google Scholar] [CrossRef]
  26. Ipek, E.; Yilmaz, M. A novel method for SOC estimation of Li-ion batteries using a hybrid machine learning technique. Turk. J. Electr. Eng. Comput. Sci. 2021, 29, 18–31. [Google Scholar] [CrossRef]
  27. Antón, J.Á.; Nieto, P.G.; de Cos Juez, F.J.; Lasheras, F.S.; Vega, M.G.; Gutiérrez, M.R. Battery state-of-charge estimator using the SVM technique. Appl. Math. Model. 2013, 37, 6244–6253. [Google Scholar] [CrossRef]
  28. Jiani, D.; Zhitao, L.; Youyi, W.; Changyun, W. A fuzzy logic-based model for Li-ion battery with SOC and temperature effect. In Proceedings of the 11th IEEE International Conference on Control & Automation (ICCA), Taichung, Taiwan, 18–20 June 2014. [Google Scholar] [CrossRef]
  29. Saji, D.; Babu, P.S.; Ilango, K. SoC estimation of lithium-ion battery using combined coulomb counting and fuzzy logic method. In Proceedings of the 2019 4th International Conference on Recent Trends on Electronics, Information, Communication & Technology (RTEICT), Bangalore, India, 17–18 May 2019. [Google Scholar] [CrossRef]
  30. Shabarish, P.R.; Aditya, D.S.; Pavan, V.S.; Manitha, P.V. SOC estimation of battery in hybrid vehicle using adaptive neuro-fuzzy technique. In Proceedings of the 2020 International Conference on Smart Electronics and Communication (ICOSEC), Trichy, Tamilnadu, India, 10–12 September 2020. [Google Scholar] [CrossRef]
  31. Song, X.; Yang, F.; Wang, D.; Tsui, K.L. Combined CNN-LSTM network for state-of-charge estimation of lithium-ion batteries. IEEE Access 2019, 8, 88894–88902. [Google Scholar] [CrossRef]
  32. Khalid, A.; Sarwat, A.I. Unified univariate-neural network models for lithium-ion battery state-of-charge forecasting using minimized akaike information criterion algorithm. IEEE Access 2021, 9, 39154–39170. [Google Scholar] [CrossRef]
  33. Rae, C.; Bradley, F. Energy autonomy in sustainable communities—A review of key issues. Renew. Sustain. Energy Rev. 2012, 16, 9. [Google Scholar] [CrossRef]
  34. Wu, B.; Widanage, W.D.; Yang, S.; Liu, X. Battery digital twins: Perspectives on the fusion of models, data and artificial intelligence for smart battery management systems. Energy AI 2020, 1, 100016. [Google Scholar] [CrossRef]
  35. Semeraro, C.; Aljaghoub, H.; Abdelkareem, M.A.; Alami, A.H.; Olabi, A.G. Digital twin in battery energy storage systems: Trends and gaps detection through association rule mining. Energy 2023, 273, 127086. [Google Scholar] [CrossRef]
  36. Li, H.; Kaleem, M.B.; Chiu, I.J.; Gao, D.; Peng, J. A digital twin model for the battery management systems of electric vehicles. In Proceedings of the 2021 IEEE 23rd Int Conf on High Performance Computing & Communications; 7th Int Conf on Data Science & Systems; 19th Int Conf on Smart City; 7th Int Conf on Dependability in Sensor, Cloud & Big Data Systems & Application (HPCC/DSS/SmartCity/DependSys), Haikou, China, 20–22 December 2021. [Google Scholar] [CrossRef]
  37. Sancarlos, A.; Cameron, M.; Abel, A.; Cueto, E.; Duval, J.L.; Chinesta, F. From ROM of electrochemistry to AI-based battery digital and hybrid twin. Arch. Comput. Methods Eng. 2021, 28, 979–1015. [Google Scholar] [CrossRef]
  38. Peng, Y.; Zhang, X.; Song, Y.; Liu, D. A low cost flexible digital twin platform for spacecraft lithium-ion battery pack degradation assessment. In Proceedings of the 2019 IEEE International Instrumentation and Measurement Technology Conference, Auckland, New Zealand, 20–23 May 2019. [Google Scholar] [CrossRef]
  39. Sharma, A.; Kosasih, E.; Zhang, J.; Brintrup, A.; Calinescu, A. Digital twins: State of the art theory and practice, challenges, and open research questions. J. Ind. Inf. Integr. 2022, 30, 100383. [Google Scholar] [CrossRef]
  40. Rathore, M.M.; Shah, S.A.; Shukla, D.; Bentafat, E.; Bakiras, S. The role of ai, machine learning, and big data in digital twinning: A systematic literature review, challenges, and opportunities. IEEE Access 2021, 9, 32030–32052. [Google Scholar] [CrossRef]
  41. Pierleoni, P.; Concetti, R.; Belli, A.; Palma, L. Amazon, Google and Microsoft solutions for IoT: Architectures and a performance comparison. IEEE Access 2019, 8, 5455–5470. [Google Scholar] [CrossRef]
  42. Gupta, N.M.; Singh, R.; Das, S.S.; Choudhary, S.K. AWS VS Azure VS GCP: Leaders of the Cloud Race. Int. Res. J. Mod. Eng. Technol. Sci. 2022, 7. Available online: https://www.irjmets.com/uploadedfiles/paper/issue_7_july_2022/28711/final/fin_irjmets1658671480.pdf (accessed on 13 July 2023).
  43. IoT & Edge Developer Survey Report. Eclipse Foundation 2022. Available online: https://outreach.eclipse.foundation/iot-edge-developer-survey-2022 (accessed on 4 November 2022).
  44. Awasthi, N. Designing of electric vehicle using Matlab and Simulink. In Proceedings of the International Conference on Recent Advances in Computational Techniques (IC-RACT) 2020, Navi Mumbai, India, 27–28 March 2020. [Google Scholar]
  45. Hitesh, S.; Sunanda, C. Modeling and Performance Analysis of an Electric Vehicle with MATLAB/Simulink. Int. Res. J. Eng. Technol. (IRJET) 2020, 7, 1098–1104. [Google Scholar]
  46. Sharmila, B.; Srinivasan, K.; Devasena, D.; Suresh, M.; Panchal, H.; Ashokkumar, R.; Meenakumari, R.; Kumar sadasivuni, K.; Shah, R.R. Modelling and performance analysis of electric vehicle. Int. J. Ambient. Energy 2022, 43, 5034–5040. [Google Scholar] [CrossRef]
  47. Tomar, V.; Chitra, A.; Krishnachaitanya, D.; Rao, N.R.; Indragandhi, V.; Raziasultana, W. Design of Powertrain Model for an Electric Vehicle using MATLAB/Simulink. In Proceedings of the 2021 Innovations in Power and Advanced Computing Technologies (i-PACT), Kuala Lumpur, Malaysia, 27–29 November 2021. [Google Scholar] [CrossRef]
  48. Tripathy, Y.; McGordon, A.; Barai, A. Improving Accessible Capacity Tracking at Low Ambient Temperatures for Range Estimation of Battery Electric Vehicles. Energies 2020, 13, 2021. [Google Scholar] [CrossRef]
  49. C Soares, S.M.; Sodre, J.R. Effects of atmospheric temperature and pressure on the performance of a vehicle. Proc. Inst. Mech. Eng. Part J. Automob. Eng. 2002, 216, 473–477. [Google Scholar] [CrossRef]
  50. Askerdal, M.; Fredriksson, J.; Laine, L. Development of simplified air drag models including crosswinds for commercial heavy vehicle combinations. Veh. Syst. Dyn. 2023, 1–18. [Google Scholar] [CrossRef]
  51. Varga, B.O.; Sagoian, A.; Mariasiu, F. Prediction of Electric Vehicle Range: A Comprehensive Review of Current Issues and Challenges. Energies 2019, 12, 946. [Google Scholar] [CrossRef]
  52. Abu-Seif, M.A.; Abdel-Khalik, A.S.; Hamad, M.S.; Hamdan, E.; Elmalhy, N.A. Data-Driven modeling for Li-ion battery using dynamic mode decomposition. Alex. Eng. J. 2022, 61, 11277–11290. [Google Scholar] [CrossRef]
  53. Naseri, F.; Gil, S.; Barbu, C.; Cetkin, E.; Yarimca, G.; Jensen, A.C.; Larsen, P.G.; Gomes, C. Digital twin of electric vehicle battery systems: Comprehensive review of the use cases, requirements, and platforms. Renew. Sustain. Energy Rev. 2023, 179, 113280. [Google Scholar] [CrossRef]
  54. Ademujimi, T.; Prabhu, V. Digital Twin for Training Bayesian Networks for Fault Diagnostics of Manufacturing Systems. Sensors 2022, 22, 1430. [Google Scholar] [CrossRef]
  55. Segovia, M.; Garcia-Alfaro, J. Design, Modeling and Implementation of Digital Twins. Sensors 2022, 22, 5396. [Google Scholar] [CrossRef] [PubMed]
  56. Issa, R.; Hamad, M.S.; Abdel-Geliel, M. Digital Twin of Wind Turbine Based on Microsoft® Azure IoT Platform. In Proceedings of the 2023 IEEE Conference on Power Electronics and Renewable Energy (CPERE), Luxor, Egypt, 19–21 February 2023. [Google Scholar] [CrossRef]
  57. Waring, J.; Lindvall, C.; Umeton, R. Automated machine learning: Review of the state-of-the-art and opportunities for healthcare. Artif. Intell. Med. 2020, 104, 101822. [Google Scholar] [CrossRef] [PubMed]
  58. Choi, W.; Choi, T.; Heo, S. A Comparative Study of Automated Machine Learning Platforms for Exercise Anthropometry-Based Typology Analysis: Performance Evaluation of AWS SageMaker, GCP VertexAI, and MS Azure. Bioengineering 2023, 10, 891. [Google Scholar] [CrossRef]
  59. Sherafat, E.; Force, J.; Măndoiu, I.I. Semi-supervised learning for somatic variant calling and peptide identification in personalized cancer immunotherapy. BMC Bioinform. 2020, 21, 498. [Google Scholar] [CrossRef]
  60. Rebbouj, M.; Said, L. Students’ Physical Education Performance Analysis Using Regression Model in Machine Learning. In The International Conference of Advanced Computing and Informatics; Springer International Publishing: Cham, Switzerland, 2023. [Google Scholar] [CrossRef]
  61. Moleda, M.; Momot, A.; Mrozek, D. Predictive Maintenance of Boiler Feed Water Pumps Using SCADA Data. Sensors 2020, 20, 571. [Google Scholar] [CrossRef] [PubMed]
  62. Sawant, M.; Patil, R.; Shikhare, T.; Nagle, S.; Chavan, S.; Negi, S.; Bokde, N.D. A Selective Review on Recent Advancements in Long, Short and Ultra-Short-Term Wind Power Prediction. Energies 2022, 15, 8107. [Google Scholar] [CrossRef]
Figure 1. Key factors influencing the accuracy of estimating an EV’s battery’s SOC.
Batteries 09 00521 g001
Figure 2. The reference EV model.
Batteries 09 00521 g002
Figure 3. The flow diagram illustrating data collection from the APIs.
Batteries 09 00521 g003
Figure 4. Schematic diagram of the experimental setup.
Batteries 09 00521 g004
Figure 5. The proposed DT framework for EV’s battery SOC estimation.
Batteries 09 00521 g005
Figure 6. Integrating real-time streams with the Node-RED.
Batteries 09 00521 g006
Figure 8. Driving routes: (a) Three routes of each 58.7 km (176.1 km in total) are selected for the DT model modeling, (b) A route of 6.6 km is selected for the DT model validation.
Batteries 09 00521 g008
Figure 9. Sequence waveform of: (a) BEV’s speed profile, (b) driving state, (c) voltage from simulated LIB module, (d) voltage from real-world LIB module, (e) current from simulated LIB module, (f) current from real-world LIB module, (g) SOC estimated from simulated LIB module using CCM, (h) SOC estimated from real-world LIB module using CCM.
Batteries 09 00521 g009
Figure 10. Features used for the proposed data-driven SOC estimation-based DT model.
Batteries 09 00521 g010
Figure 11. The validation of proposed DT model: (a) BEV’s speed profile, (b) driving state, (c) BP voltage from simulated LIB module, (d) BP voltage from real-world LIB module, (e) BP current from simulated LIB module, (f) BP current from real-world LIB module, (g) SOC estimated based on DT model, simulated LIB module using CCM, and real-world LIB module using CCM.
Batteries 09 00521 g011
Figure 12. The EV dashboard-based proposed DT model.
Batteries 09 00521 g012
Table 1. Technical specification of the simulated EV model.
Technical SpecificationValueUnit
Vehicle mass1500kg
BP size (series × parallel)96 × 31-
BP voltage (nominal)400V
Drive typeFront wheel drive-
Horizontal distance from C.G. to front axle1.188m
Horizontal distance from C.G. to rear axle1.512m
C.G. above axles0.5m
Wheel radius0.336m
Drag coefficient0.28m
Static friction coefficient “Brake”0.45-
Kinetic friction coefficient “Brake”0.35-
Number of brake pads2-
Carrier to driveshaft ratio7.94-
TransmissionSingle speed-
Motor torque450N·m
Motor power211kW
Disclaimer/Publisher’s Note: The statements, opinions and data contained in all publications are solely those of the individual author(s) and contributor(s) and not of MDPI and/or the editor(s). MDPI and/or the editor(s) disclaim responsibility for any injury to people or property resulting from any ideas, methods, instructions or products referred to in the content.

