Mechanical and Optical Characterization of Lithium-Ion Battery Cell Components/Cross-Ply Lamination Effect


1
Department of Aerospace Engineering, Embry-Riddle Aeronautical University, Daytona Beach, FL 32114, USA
2
Hopkins Extreme Materials Institute, Johns Hopkins University, Baltimore, MD 21218, USA
3
Department of Mechanical Engineering, Johns Hopkins University, Baltimore, MD 21218, USA
4
Ralph S. O’Connor Sustainable Energy Institute, Johns Hopkins University, Baltimore, MD 21218, USA
5
Department of High Voltage Battery System, Ford Motor Company, Dearborn, MI 48121, USA
*
Author to whom correspondence should be addressed.
Batteries 2023, 9(11), 541; https://doi.org/10.3390/batteries9110541
Submission received: 30 September 2023
/
Revised: 19 October 2023
/
Accepted: 25 October 2023
/
Published: 1 November 2023
(This article belongs to the Section Battery Modelling, Simulation, Management and Application)
Abstract
:Excessive mechanical loading of lithium-ion batteries can impair performance and safety. Their ability to resist loads depends upon the properties of the materials they are made from and how they are constructed and loaded. Here, prismatic lithium-ion battery cell components were mechanically and optically characterized to examine details of material morphology, construction, and mechanical loading response. Tensile tests were conducted on the cell case enclosure, anodes, cathodes, and separators. Compression tests on stacks of anodes, cathodes, separators, and jellyrolls were made from them. Substantially differing behaviors were observed amongst all components tested. An optical examination of the anodes, cathodes, and separators revealed homogeneities, anisotropies, and defects. Substantial texturing was present parallel to the winding direction. When highly compressed, jellyrolls develop well-defined V-shaped cracks aligned parallel to the texturing. Like many laminates, altering the lay-up construction affects jellyroll mechanical performance. To demonstrate, a cross-ply jellyroll was fabricated by rotating every other complete component set (cathode/separator/anode/separator), reassembling, and compressing. A distinctly different fracture pattern and increased compressive strength were observed.
1. Introduction
Lithium-ion batteries (LIBs) are widely used as electric power sources for smartphones, tablets, laptops, power tools, unmanned aerial vehicles, e-scooters, electric vehicles (EVs), and many other transportable electronic devices. They are also popular in the aerospace transportation industry, where, for example, some Cessna (Wichita, KS, USA) Caravan and Bombardier (Montreal, Québec, Canada) Dash-8 aircraft use them as a primary electrical power source [1]. Similarly, the Boeing (Chicago, IL, USA) 787 uses an LIB in the auxiliary power unit (APU) [2]. Airport equipment and vehicles are also electrifying [3], and some next-generation electric aircraft are now using LIBs as their main power source [4]. However, for many transportation applications, the pace of adoption has been slower than envisioned, in part due to performance issues, range anxiety, safety worries, and other psychological apprehensions [5,6].
When LIBs get excessively loaded (e.g., drop impact, collision, shock, puncture, vibration, etc.), damage can occur, which impairs performance and safety. Load/stress can also be induced in battery components during fabrication and under normal operation [7]. Their ability to resist loads depends upon the properties of the materials they are made from, how they are constructed, and how they are loaded. Mechanical properties and performance of LIB cell materials are important during fabrication and use, as well as being needed inputs for iterative physical model predictions of loaded LIBs, the packaging around them, etc. Accurate predictive models can help reduce the time, effort, and cost associated with designing, building, and testing.
There have been several reports of mechanical tests on LIB cell components [8,9,10,11], most involving tension and indentation of anodes, cathodes, and separators, and some with more. In one study, the mechanical, electrical, and thermal responses of impact-damaged pouch cell LIB modules were examined using various types of indenters and state of charge (SOC) [12]. In another, stacks of LIB pouch cells were indented at various speeds after placing them in a specially designed enclosure representative of a battery module [13]. Entire modules have also been indented/crushed. For example, pouch cell modules [14] as well as prismatic cells [15] and prismatic cell modules [14,16] were indented while also monitoring voltage drops to investigate the effect of damage progression on electrical performance. In one of the studies, charged modules were indented at high loading rates using a module-level impact stand [14]. Basically, if the porous electrical insulator (separator) between anode(s) and cathode(s) gets damaged, short circuiting, voltage drop, thermal runaway, fire, and explosion can occur. Although catastrophic events are rare, such occasions affect public perception, creating apprehension, particularly for devices with large powerful LIBs operating in risky environments [5]. For reliable and safe operation, knowledge of potential in-service abuse loads and their effect on battery performance and safety is crucial. See [17,18,19] for reviews.
Most LIB cells are made by stacking sheet-like layers of anodes, separators, and cathodes, electrically connecting them, saturating them with electrolyte, and sealing them within an enclosure. Common cell configurations include cylindrical, pouch, or prismatic. Like many products, performance, reliability, and durability depend upon the materials they are made from and how they are processed, shaped, and geometrically arranged, as well as defects, operating conditions, environment, and time. It has been reported that when LIB cell layers get locally compressed (e.g., indented), inclined and/or V-shaped cracks form [13,20,21] which damage the separator, causing anodes and cathodes to touch and the onset of a short circuit. Additional material-focused experiments are needed to help gain better insight into cracking and other damage observations, the reasons for them, and how to address them.
Here, a prismatic LIB was carefully disassembled, followed by mechanical and optical characterization of its cell components. Microscopy, tensile, and compression tests were performed. Significantly different morphology and mechanical behaviors were observed. Substantial texturing is present parallel to the winding direction. When highly compressed, jellyrolls develop well-defined V-shaped cracks aligned parallel to the texturing. Crack formation is linked to cell component properties which are affected by chemical makeup, macro and microscopic structure, defects, and lay-up, which when altered can change the cracking pattern and increase compressive strength. Adequate equipment, supplies, and technique information are included; results, observations, and dialog are kept concise; uncertainty is not included in the approximate measured results.
2. Materials and Methods
2.1. Lithium-Ion EV Battery Module
EV battery modules serve as the main power source for most electrified transportation applications; they are constructed from many different components. The modules investigated here contain six prismatic LIB cells, connected in a series and packaged within a stainless steel mounting bracket surrounded by a stainless steel compression band, as shown in Figure 1a. The bracket is made from two ~1.5 mm thick sheets (short sides) with angled mounting tabs and holes for fastening, which are welded to a stainless steel C-section beam (top). The beam is made from a ~1.0 mm thick sheet with a right angle vent pipe fastened to it by welding. The compression band is made from two ~0.7 mm (long sides with elongated holes) and two ~1.5 mm (short sides with no holes) thick sheets welded together at all edges. Orange and black plastic (beneath orange) top covers afford wire connectivity pathways. Light blue soft rubber gaskets (beneath the C-section beam) seal and channel cells over pressure gas into the vent pipe.
To extract LIB cells, the compression band was dry cut along one welded edge using a belt/disc sander, thereby releasing the band, bracket, and then the cells. Wiring, connectivity, and other components on top were then detached. The cell enclosure is made from Al alloy, with the exterior painted blue, and wrapped with a thin green polymer about its sides, as shown in Figure 1b. Electrical connectivity posts and venting are situated on top, as shown in Figure 1b. Table 1 lists additional details, where mounting bracket tabs and electrical connectivity posts are excluded from the dimensions. These and many other photographs were recorded using an LG (Seoul, Republic of Korea) ReflectTM (L555DL) cell phone with a 13 MP digital camera.
2.2. Li-Ion Jellyrolls
Jellyroll details can help identify relations between LIB construction and performance. Prior to disassembly, cells were discharged (to less than 1 V) by connecting them to an electric resistive water heater element immersed in tap water. Since voltage gradually recovers after discharging, several discharge cycles were needed. Most cells swell when released from within the compression band; the cell over the pressure gas was released by perforating the thin Al alloy top vent. Because water readily reacts with jellyrolls (e.g., corrosion, HF acid, etc.), wet cutting is not advised. To remove jellyrolls, cell enclosures were dry cut just below their tops. Jellyrolls were then pried and pulled out, keeping the multifaceted top attached and intact. Nitrile gloves, goggles, organic vapor masks, shop coats, and adequate ventilation were used. Figure 2 shows a disassembled cell; the cell enclosure base had no visible seams. Each cell contains four flattened rectangular jellyrolls, connected in parallel, saturated with electrolyte, and sealed within the cell enclosure. The Figure 2 caption provides more details. Once exposed to ambient air, jellyrolls react and electrolyte evaporates. To better preserve them, a FoodSaver® Vacuum Sealing System V3420 (Sunbeam Products, Inc., Boca Raton, FL, USA) which uses polyethylene and nylon bags [23] was found to be simple and effective. Vacuum-sealed jellyrolls, cells, and modules were stored in an electrically grounded flammable storage cabinet on nonconductive polymer shelf liners to await further operations.
The jellyrolls are ~10–12 mm thick (varies), made by winding and then flattening cylindrically wound, repeating layers of cathode/separator/anode/separator, and so on. Additional separator layers are present on the exterior and interior (e.g., six separator layers were found at the center of one jellyroll). The anodes consist of graphite coated onto both sides of Cu alloy foil while the cathodes are lithiated NMC (Lithium, Nickel oxide, Manganese dioxide, and Cobalt oxide; LiNixMnyCozO2) coated onto both sides of Al alloy foil. A very thin translucent white layer coats the graphite (shown later). The separators are microporous polymer.
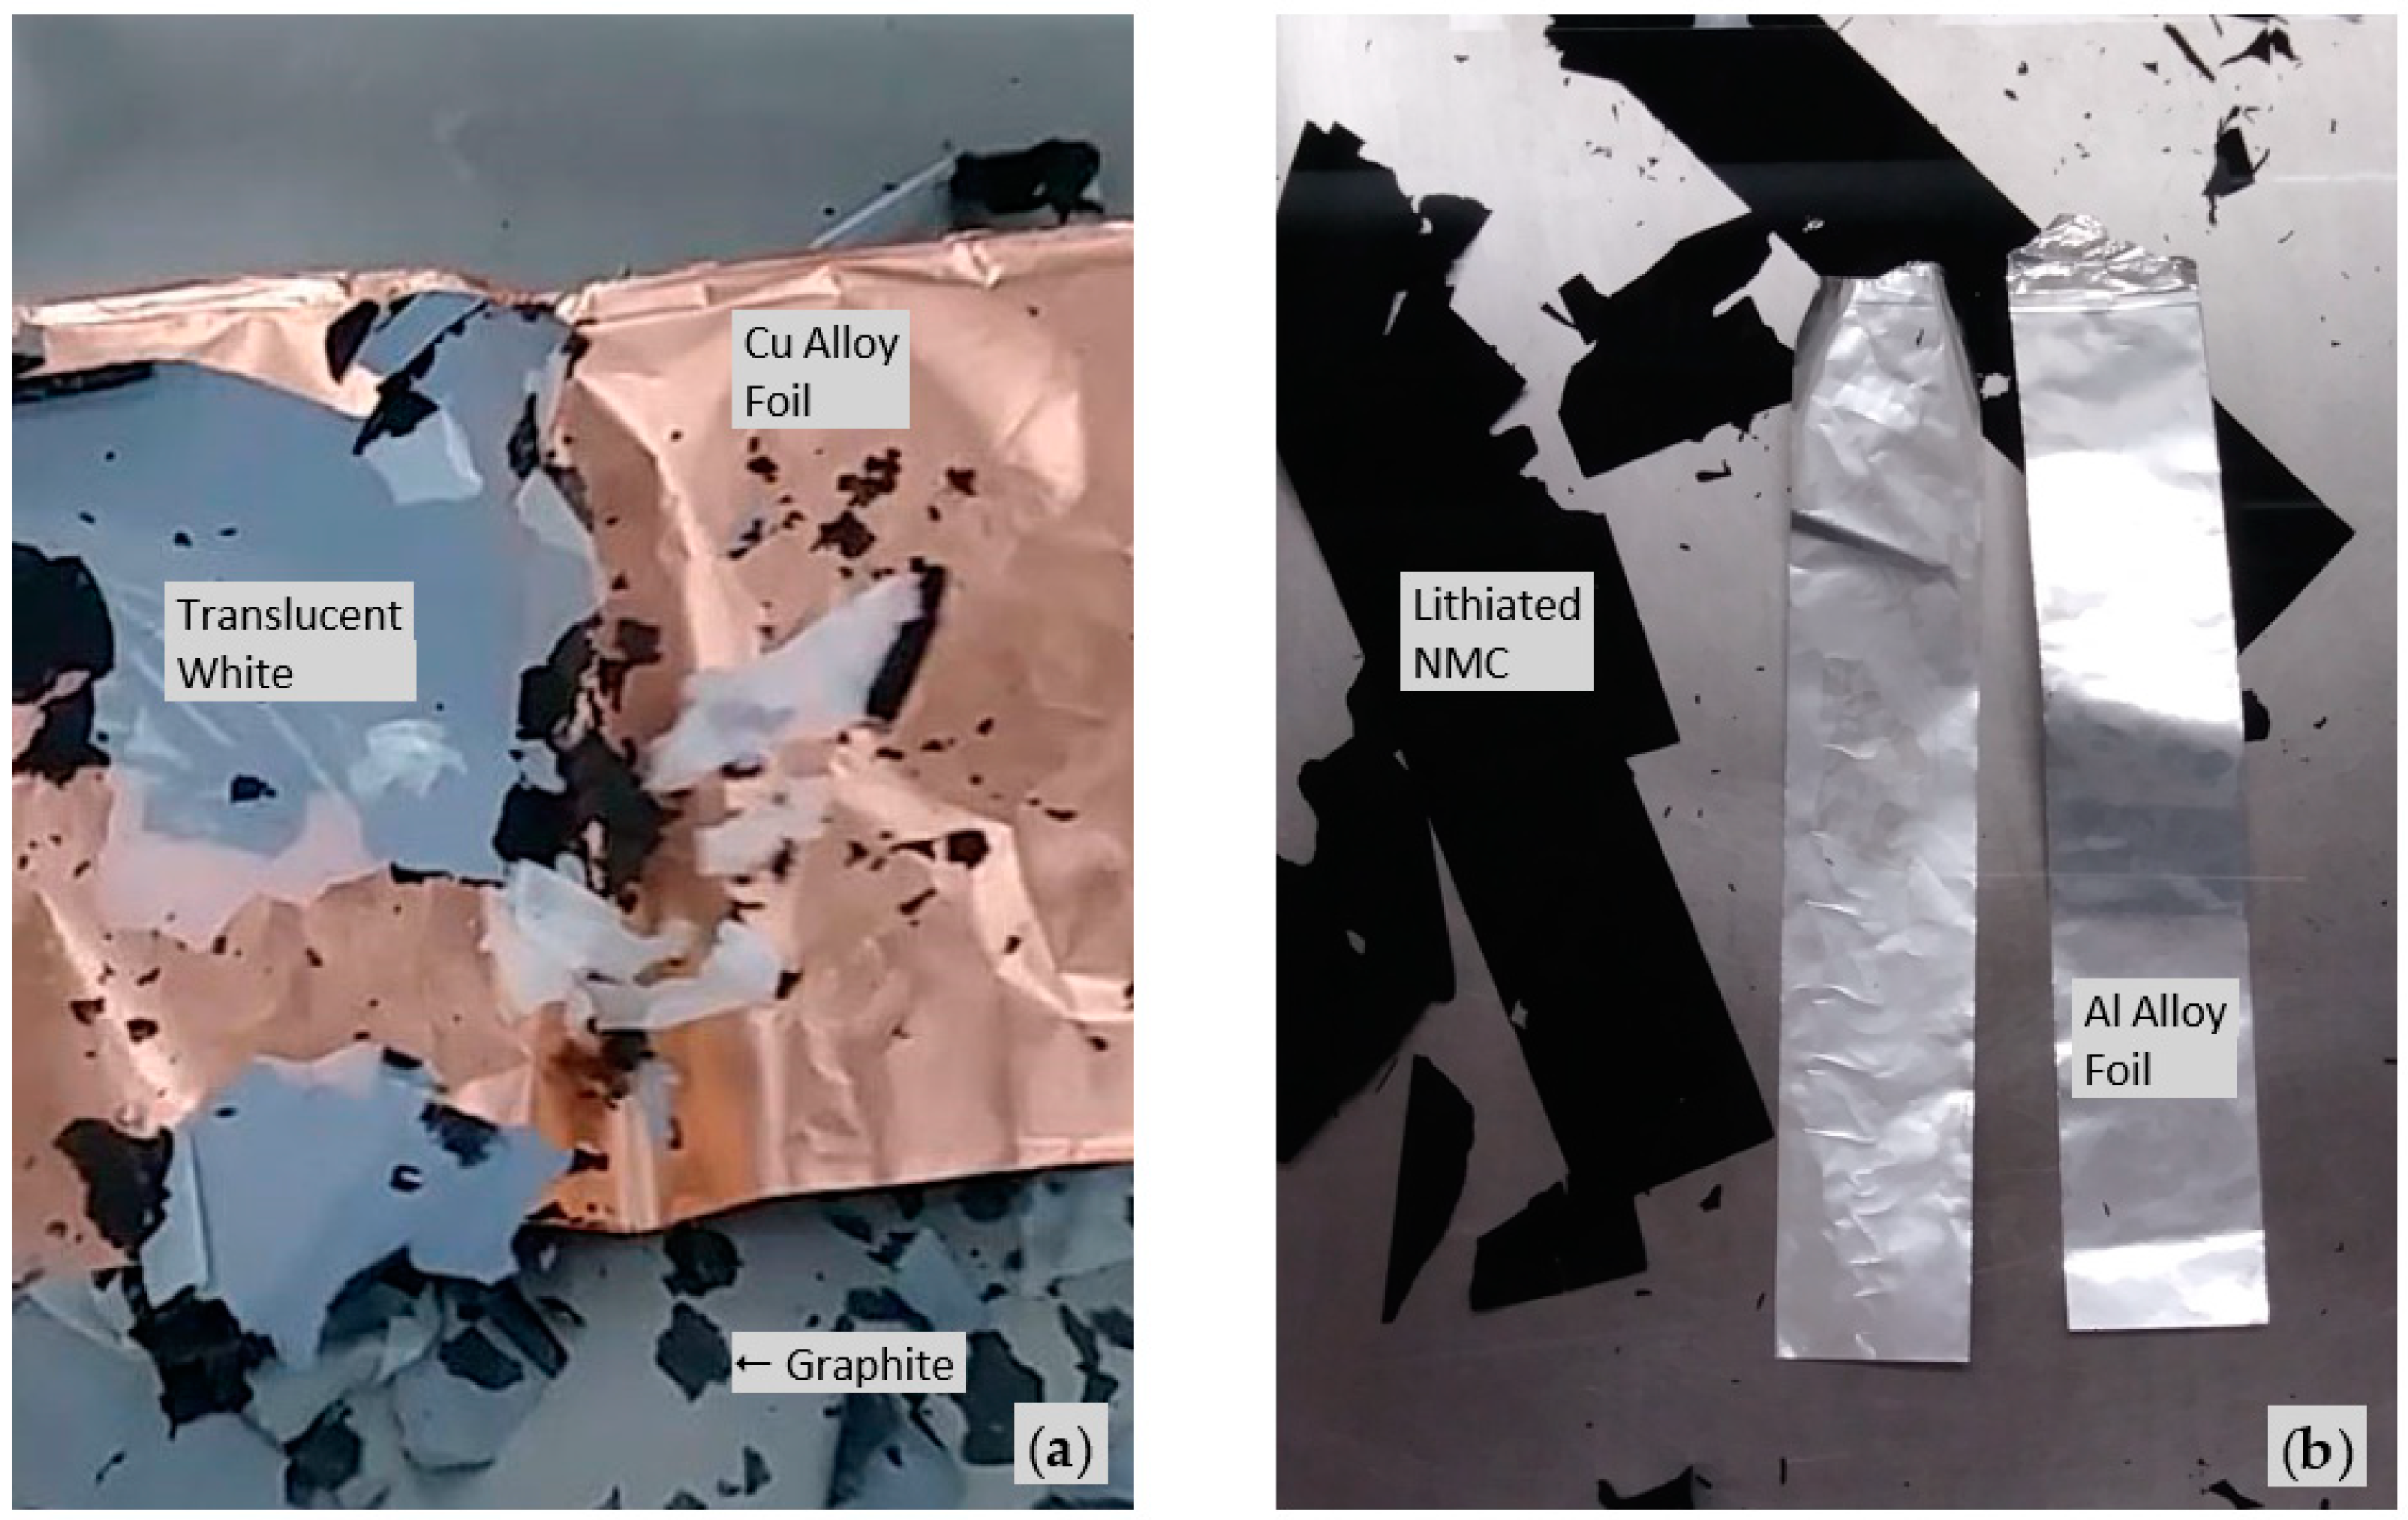
Anode and cathode coatings were detached from cut anodes and cathodes for optical microscopy and foil thickness measurement. Although they are mostly discharged, small arcing occasionally occurs when cutting jellyroll components with metal (scissors or paper trimmer). For anodes, graphite was detached from Cu alloy foils by placing scissor-cut portions into a stainless steel tray containing lukewarm tap water for ~10–15 s while gently hand-agitating the tray, as shown in Figure 3a. The thin translucent white coating bonded to graphite exteriors (on both sides of anodes) also detached; this layer causes anodes to appear gray rather than graphite black. For cathodes, lithiated NMC coatings were detached from Al alloy foils with the aid of ultrasonic agitation. Approximately 25 mm wide strips, cut with a paper trimmer, were ultrasonically agitated in a laboratory glass beaker containing ultrasonically warmed tap water for ~25 s or less, followed by thermal shock immersion into a stainless steel tray containing cooler tap water, followed by gentle finger massaging, as shown in Figure 3b. A Branson (Danbury, CT, USA) M1800 Ultrasonic Bath was used. Longer ultrasonic times damage and pulverize both coatings and foils. Common lab solvents and acids (ethanol, methanol, acetone, sulfuric, nitric, phosphoric, and acetic) did not observably react with cathodes. HF acid (a known Al alloy etchant) reacted, but primarily with the underlying Al alloy foil.
Once separated, dry anode and cathode foils, along with electrolyte-wet anodes, cathodes, and separators, were stacked to achieve caliper measurable thicknesses and divided by the number in the stack to compute the mean, as shown in Table 2. The anode and cathode coatings were too thin and delicate for stacking and caliper measurement (or later mechanical testing); their thickness was computed. Although Cu alloy and Al alloy foils were wrinkled and slightly damaged, stack thicknesses were measurable; mechanical tests were not attempted (later). Electrolyte-wet jellyroll layer (cathode/separator/anode/separator) thicknesses were also measured, and stacking was not needed. Jellyroll components, excluding dried anode and cathode foils, were kept reasonably electrolyte-wet by storing them in plastic bags with other intact electrolyte-wet jellyrolls.
2.3. Jellyroll Component Microscopy
Microscopic observations of jellyroll component morphology can help explain properties and performance. A Motic (Schertz, TX, USA) BA310Met trinocular optical microscope with a manual moveable stage, 3W LED illumination, 1000× maximum magnification, Moticam 10+ digital camera (10.0 MP with USB 3.0 connection), and Images Plus 3.0 software was used for optical microscopy. A white balance card provided white balance.
The optical microscope images are shown in Figure 4a–n, where the winding direction (i.e., coating, rolling, machine, MD, etc.) is vertical for all images. Some morphology observations are summarized in Table 3. The translucent white coating was imaged while bonded to the underlying graphite, and all others were separated as previously described prior to imaging. Graphite granules that had contacted the translucent white layer appeared brighter (not shown) than those that had contacted the Cu alloy foil (shown); otherwise, they were quite similar. Cu alloy foils exhibited microstructural differences depending on whether they faced toward the jelly roll center (i.e., facing in) or the enclosure (i.e., facing out); both cases were imaged. Other components did not. As before, jellyroll component tensile samples were kept reasonably electrolyte-wet by storing them in plastic bags with other intact electrolyte-wet jellyrolls.
Optical microscopes are generally limited to ~1000–1500×, so substantially higher magnification was needed to observe finer details of separator morphology. An FEI Quanta 650 (FEI Company, Hillsboro, OR, USA) scanning electron microscope (SEM) was used. The imaging sample was prepared by adhering a small portion of separator to an Al alloy SEM mount using carbon conductive tape, followed by gold sputter coating for improved electrical conductivity. A 50,000× SEM image is shown in Figure 4o. Its morphology has likeness to Celgard® [24], which comprises microporous polypropylene (PP), where microporous polyethylene (PE) is added for trilayer (PP/PE/PP) versions.
Microscopic homogeneities, anisotropies, and defects are present in jellyroll components. Substantial microscopic texturing occurs parallel to the winding direction for Cu alloy and Al alloy foils as well as the separator. Texturing aligned parallel to the winding direction is also observed macroscopically, as shown in Figure 2d; this is more readily seen when electrolyte-wet, but it is not easy to identify at 50× and 500× magnifications.
2.4. Enclosure Case Tensile Tests
The enclosure case seals the jellyrolls, protects them from impacts and penetrations, and resists cell over pressure gas. To measure tensile properties, flat dogbone-type tensile test samples (similar to ASTM D3039/D3039M-08 [25]) were fabricated from enclosure case side A (A1, A2, and A3), opposite side B (B1, B2, and B3), and blue side C base (C1); Figure 2b shows the A and C locations. The remaining sides D and E, unmarked in Figure 2a,b, were not long enough for our test machine minimum gripping distance, and only thicknesses were measured.
To fabricate ~240 mm × 25 mm test samples with ~80 mm gage length, the thin green polymer wrapping was peeled away and the enclosure was rough cut using a band saw. Test sample material was then cut to ~170 mm × 25 mm rectangles using a saw with a guide fence for parallel cutting. To increase the effective gripping lengths, ~35 mm × 25 mm sacrificial enclosure pieces were used to extend the ~170 mm-long test gage pieces within the gripping tab regions. Approximately 80 mm × 25 mm × 3 mm Al alloy 6061-T651 gripping tabs were cut using a band saw, 45° beveled using a belt/disc sander, then adhered to the extended test samples using a tough dissimilar material bonding epoxy (MetlWeld, System Three Resins, Inc., Lacey, WA, USA). The bonding surfaces were roughened by grit blasting with glass bead 80 grit abrasive media at 85 psi shop air, followed by acetone rinsing and drying prior to adhering. Test sample gage sections were covered with masking tape so as to not scratch or roughen them during grit blasting. A small table vise helped squeeze out excess epoxy, followed by wiping with an acetone-moistened cloth and then rubber banding around the tabs for steadiness during overnight curing. Cured test samples were then tap water wet-sanded to very parallel widths using a variable speed grinder-polisher with successively finer SiC sandpaper; 600 grit was used for final edge smoothing, which eases edge scratch stress concentrations. During sanding, the uniformity of width was periodically monitored using calipers. The means of five caliper thicknesses per side were measured. The mean thicknesses are: Side A = 1.09 mm, Side B = 1.09. mm, Side C = 1.60 mm, Side D = 1.03 mm, and Side E = 1.04 mm. The Side C base is somewhat thicker than the others; this is likely a consequence of the assumed deep drawing fabrication process, which should thin it the least.
An Instron (Norwood, MA, USA) model 8802 servo hydraulic test system was used for all mechanical tests, as shown in Figure 5. This ±250 kN capacity system features a 2527-113 dynamic load cell, 2742-501 fatigue rated hydraulic wedge grips, FastTrack 8800 digital control and software, two external strain channels, DAX V9.1 data acquisition, and 5 kS/s maximum sampling rate. With this system, the crosshead with attached load cell and upper grip are first positioned and locked, then an actuator moves the lower grip to apply tensile or compressive load. To measure enclosure sample tensile strain, a 2620-824 dynamic strain gage extensometer (extended to 50.8 mm gage) was adhered to unpainted sides of the dogbone-type test samples using hot glue, which is fast, strong, cheap, and easily removed. A right triangle helped with aligning the test samples parallel to the machine loading direction. Preliminary displacement-time tests with no test sample or applied load measured the maximum machine actuator rate as 67.9 mm/s; the minimum was substantially less. Tensile testing ocurred over a wide available range: 5 mm/s, 35 mm/s, and 65 mm/s, with data recorded at 5 kS/s. The Side C sample was tested at the midrange rate.
2.5. Jellyroll Component Tensile Tests
Prismatic cell jellyroll components are subjected to fabrication, winding, and flattening loads and sometimes vibrations, impacts, and penetrations during use. Their performance depends upon material properties, amongst other attributes. Since jellyroll components are thin, compressing them individually to measure mechanical properties is challenging; tensile tests were performed. Later, stacks of jellyroll components were compressed to monitor load progression, possible damage, and strength, but not elastic properties. ASTM D882-18 [26] helps guide tensile testing of thin components.
The Instron 8802 test system was fitted with a smaller ±500 N capacity 2530-500N static loadcell, 2713-007 self-tightening roller grips, and 2210-891 strain gage adapters, as shown in Figure 6a. Too large of a load cell (e.g., ±250 kN) buries low-level force data in noise. To facilitate machine gripping, the smaller load cell was fastened to a threaded stainless steel rod; the lower roller was fastened to a hollow stainless steel rod with a solid insert. Both were hydraulically gripped at a 1000 psi controllable machine setting. The roller grips kit included both stainless steel and rubber coated rollers. To increase initial clamping force, the original ~1.4 N/mm spring constant grip springs were replaced by similar size zinc plated steel springs, but with a higher ~3.4 N/mm spring constant. Spring constants were found by measuring compressive force vs. displacement using a universal testing machine. Both roller types were used during the tests; the rubber-coated rollers exhibited better friction and gripping, but they were gradually softened by reaction with electrolyte. The roller center separation distance was set to 75 mm for all tests; which is the gage length. One hundred twenty FPS slow-motion videos at Full HD (1080p) were recorded using a 32.5 Megapixel Canon EOS 90D digital camera (Canon U.S.A., Inc., Melville, NY, USA) equipped with Canon EF-S 18–135 mm f/3.5–5.6 IS USM DSLR zoom lens, RS60-E3 remote switch, and mounted to a tripod, as shown in Figure 6a. A Meiji Techno FL151 dual arm fiber optic illumination system (Meiji Techno America, San Jose, CA, USA) provided halogen illumination, as shown in Figure 6a.
Tensile test material was obtained by unrolling jellyrolls, separating components, and dry cutting to ~150 mm × 25–40 mm strips using a sharp blade guillotine paper trimmer. The trimmer blade was extra sharpened using a two-stage household pull-through knife sharpener; carbide was followed by ceramic abrasive. Like most “brittle” materials, tensile failure of anodes and cathodes is sensitive to edge defects, nicks, flaws, etc. Thin paper card stock above and below jellyroll components during their cutting helped improve test sample edge quality. A total of 75 mm of the ~150 mm length was used for the gage length between the roller centers, and the remainder was wrapped around the rollers.
Strain measurement based upon test machine actuator displacement (Instron 8802 test system) or crosshead motion (many other test systems) is affected by the displacement of the load train (e.g., load cell, grips, rollers, fixtures, etc.) as well as test sample grip slippage, which can all erroneously add to apparent sample strain. Most strain gage extensometers and linear variable differential transformer (LVDT) extensometers are too large and heavy for thin, delicate jellyroll components. One might consider fastening them to the roller grip ends, although grip slippage or roller deformation would still erroneously add to the apparent sample strain. Digital image correlation (DIC) methods can be used to measure strains directly on a test sample. A suitable and minimally invasive/reactive speckle pattern, good field of view, adequate lighting with little glare, special camera(s), analysis software, calibration specimens, etc., are needed.
A simpler conventional way to measure strain involves bonding electrical resistance strain gages to test samples. To do so, Kyowa Americas (Novi, MI, USA) KFGS-2-120-D1-16 N1M2 and KFGS-2-120-D1-23 N1M2 general purpose foil biaxial strain gages with 2 mm gage length were bonded to anodes and cathodes for linear strain measurement along both longitudinal and transverse directions. Since separators are much thinner and more delicate, two Kyowa KFEM-5-120-C1 N1M2 ultrahigh elongation foil uniaxial strain gages with 5 mm gage length were used for separators and were orthogonally bonded to them. Ultrahigh elongation strain gages are much more compliant than most strain gages; 20–30% deformations are possible [27]. This can help a test sample deform more naturally in the immediate vicinity of the strain gage as opposed to being resisted by it, although the present separators may be too thin and delicate even for very compliant strain gages. All strain gages had 120 Ω resistance, 2.0–2.1 gage factor, very fine 1 m long pre-attached polyester coated copper wires, and were adhered using Kyowa CC-36 cyanoacrylate type adhesive. For anodes, the porous graphite coating easily peels away when adhering the gages and/or manipulating strain gaged test samples, so a sharp hobby knife was used to gently remove it from strain gage locations for good bonding to the underlying Cu alloy foil rather than the graphite, as shown in Figure 6c. This was not necessary for cathodes, whose lithiated NMC coatings are tougher and well bonded. As before, jellyroll component tensile samples were kept reasonably electrolyte-wet by storing them in plastic bags with other intact electrolyte-wet jellyrolls. During test preparation, the anodes become lighter gray as the electrolyte quickly evaporates; the macroscopic texture (lines) are more easily seen, as shown in Figure 6c.
To confirm the accuracy of the instrumentation and methods, similar size tensile test samples were cut from 23 μm thick Great Value Heavy Duty Aluminum Foil (Walmart Inc., Bentonville, AR, USA), strain gaged with KFGS-2-120-D1-23 N1M2 using CC-36 adhesive, and tensile tested at 0.05 mm/s and 1 kS/s. E ≈ 70 GPa and ν ≈ 0.33 were obtained; this is typical for Al alloys. For anodes and cathodes, tensile testing ocurred at an actuator rate of 0.05 mm/s with force and strain data recorded at 1 kS/s. Since separators elongate substantially more than anodes or cathodes, reasonable test durations and data record lengths were achieved by testing them at a higher rate; 5 mm/s with data recorded at 5 kS/s. Additional separator tests at 60 mm/s were also performed to investigate the possibility of the strain rate effect, which is more common with polymers.
2.6. Jellyroll Component and Jellyroll Compression Tests
During use, excessive compression or indentation/perforation are the most likely causes of jellyroll component and jellyroll mechanical damage. To measure compressive properties and performance, the Instron 8802 test system was fitted with 2840-119 fatigue rated 150 mm (6 in) diameter compression platens, as shown in Figure 7a. To measure strain, the 2620-824 dynamic strain gage extensometer (extended to 50.8 mm gage) was adhered to upper and lower platens using hot glue. Measuring the motion of stiff, chrome-plated steel compression platens yields more accurate strain measurements than actuator displacement.
For anode, cathode, and separator stack samples, jellyrolls were unrolled and components were separated, dry cut using the paper trimmer method, and then stacked to approximate heights of a full jellyroll (~10–12 mm thick). Layer orientation as found within original jellyrolls was maintained. Once separated and stacked, these and full jellyrolls were dry cut to ~50 mm × 50 mm squares using a Leco (St. Joseph, MI, USA) MSX255 sectioning machine with medium duty Al2O3 impregnated wheel and gradual manual feed. Samples were sized large enough to observe fracture pattern progression if present, as shown in Figure 7b, without overloading the ±250 kN loadcell; a relatively high-capacity machine is needed. To avoid excessive edge damage during cutting and sanding, samples were compressed within thin sacrificial Al alloy sheets on the soon-to-be ~50 mm × 50 mm test sample faces using trigger clamps and/or C-clamps. After cutting, full jellyroll sample edges were dry sanded within the clamped Al alloy sheets parallel to component layer directions using 240 grit SiC sandpaper; the rotary cutting lines were removed for better close-up visualization. The others were not sanded in this fashion. Again, the samples were kept reasonably electrolyte-wet by storing them in plastic bags with other intact electrolyte-wet jellyrolls.
Compression test samples were slightly preloaded to reduce gaps/spaces between the stacked component layers and lessen the initial loading toe region. Testing ocurred at 0.05 mm/s (a reasonable rate for damage visualization, photographs, and videos), as well as 30 mm/s and 60 mm/s. Data were recorded at 1 kS/s for 0.05 mm/s and 5 kS/s for 30 mm/s and 60 mm/s. Some samples were intentionally unloaded prior to pulverizing them to facilitate post-test observation or automatically by the test machine if the load cell limit of −250 kN (compression) had been reached. Note that extensometer strains are only reasonable approximations to actual bulk material compressive strains. Gaps/spaces between the numerous stacked layers also get compressed, adding to the apparent material strain; Young’s modulus cannot be confidently extracted. Actuator strains are slightly larger owing to additional load train compliance as previously described.
3. Results
3.1. Enclosure Case Tensile Tests
Enclosure case material engineering stress-strain tensile behaviors and fractured test samples are shown in Figure 8a–d, with the mechanical properties summarized in Table 4. The actuator rates were divided by 80 mm (gage length) for the approximate strain rates. The yield strength uses the 0.2% offset method.
Enclosure case material tensile behaviors are typical for wrought Al alloys. These were “noisier” with increasing test rates, yet all instrumentation was dynamic rated. The Side C base had the highest maximum strain and lowest strength. This portion of the enclosure is thicker and likely less strain-hardened during the assumed deep drawing fabrication process. While 30°/60°-oriented fractures were observed for all tensile samples, 45° was the orientation for maximum shear stress [28], often observed as 45° angularity on ductile metal fracture surfaces (e.g., cup and cone fracture).
3.2. Jellyroll Component Tensile Tests
Jellyroll component engineering stress-strain tensile behaviors are shown in Figure 9, Figure 10 and Figure 11, where loading was applied parallel to the indicated fabrication direction (winding or transverse). Anode and cathode plots, shown in Figure 9a,b and Figure 10a,b, are shown up to fracture. Separator initial strain gage strain plots, shown in Figure 11a,c, are shown up to the appearance of a reverse loop. For the full longitudinal strain plot, refer to Figure 11b,d, where the strain is approximated using actuator displacement. This was necessary since localized strain reversals (e.g., reverse loop), a complex strain field, very large strains, and unraveling (transverse samples only) all limit the useful range of the strain gages. Since actuator strains are higher than both actual and initial strain gage strains at any given load (load train compliance and grip slippage effect), initial strain gage and actuator strain curves cannot be assembled/merged. Representative close-up video snapshots are shown for anode (transverse), Figure 6c, and separator (transverse), as in Figure 6b and Figure 12a,b. Mechanical properties and comments are summarized in Table 5. The actuator rates were divided by 75 mm (gage length) to obtain the approximate strain rates.
Anodes and cathodes load elastically and fail in a brittle fashion. Cracks initiate at sample edges and are aligned nearly perpendicular to the loading direction, as shown in Figure 6c. Winding and transverse tensile behaviors are similar. For this cell, cathodes are slightly stiffer than anodes. Since cracking occurred above or below the strain gages, additional strains associated with them are not seen on the stress-strain plots. Had actuator displacement, an extensometer, or another method been used to measure strain over a distance which encompassed the crack, gage section crack(s) would add to the measured strain, thereby affecting the stress-strain plots, even in the absence of plasticity or other microscopic damage. Sometimes, the flattening and/or descending of the stress-strain plots caused by cracking within a gage section gets inaccurately reported as additional yielding, ductility, etc. Figure 8b from the enclosure tensile tests shows the effect.
Estimates for Young’s modulus of the graphite and lithiated NMC coatings (too thin and delicate for the previous measurement methods) are made by treating the anodes and cathodes as three-layer composite laminates of coating/foil/coating (neglecting the thin translucent white coating over graphite). The rule of mixtures arrives at
where is Young’s modulus and is thickness. Subscripts or c indicate foil or coating while a lack of a subscript indicates an entire anode or cathode. Using measured Young’s moduli from Figure 9a,b and Figure 10a,b, measured thicknesses from Table 2, along with 120 GPa and 70 GPa as representative of Young’s moduli for Cu and Al alloy foils (mechanical tests were not attempted), one estimates:
For elemental graphite, Young’s modulus is reported as 4–5 GPa [29,30]. Considering that the graphite anode coating is very porous, a lower estimated value as found using the rule of mixtures is reasonable. Lithiated NMC properties are not widely reported.
Separators initially load linearly and elastically; their stress-strain plots become non-linear early on, followed by localized strain reversals (e.g., reverse loop), a complex strain field, very large strains, and unraveling (transverse samples only). Samples loaded along the winding direction (less interesting and not shown) did not unravel; their strain field was much less complex. The winding direction is slightly stiffer, much stronger, and with less maximum strain than the transverse direction. Unraveling for transverse-oriented separators appears to substantially reduce strength and increase maximum strain at lower test rates, as shown in Figure 12a,b. For both orientations, maximum strain is reduced at higher rates and the tests are “noisier”, as shown in Figure 11a–d. Loading orientation and strain rate affects separators, as reported by others.
Separator Young’s moduli of 10 GPa (winding) and 7 GPa (transverse) from Figure 11a,c seem high considering that the upper range for engineering polymers is about 10 GPa [31]; for polypropylene, it is about 2 GPa [31]. Other researchers report lower Young’s moduli for separators when using DIC to measure strain. Even with very compliant strain gages as used here, extra deformation resistance afforded by the strain gage and its adhesive (which fills separator pores and stiffens) likely affected the strain measurements. A non-contacting video extensometer (e.g., Instron AVE 2) may be a better strain measurement approach for separators; a speckle pattern is not needed. When determining elastic properties, only the very initial loading behavior makes sense since non-linear behavior and strain reversals quickly follow.
3.3. Jellyroll Component and Jellyroll Compression Tests
Jellyroll component and jellyroll engineering stress-strain compressive behaviors are shown in Figure 13a–d. Photographs of the samples, before and after compression, are shown in Figure 14a–d. Mechanical properties and comments are summarized in Table 6. Strain rates were obtained by dividing acturator rates by sample thicknesses.
When separated, stacked, and compressed, anodes fracture while cathodes and separators do not. Compressed jellyrolls develop well-defined V-shaped cracks aligned parallel to the winding and texture direction; this was repeatedly observed during each and every test. These cracks compromise the separator and cause anodes and cathodes to touch, likely initiating a short circuit. Anodes and jellyrolls exhibit an additional major load peak. Cathodes are slightly stiffer at higher rates. Separators are slightly stiffer and stronger at higher rates and are also “noisier”. Jellyrolls are stiffer, weaker, and fracture earlier at higher rates. While stacks of anodes do significantly crack when compressed, it is unclear if individual anodes sandwiched between separators initiate V-shaped cracking in jellyrolls. Materials with mechanically dissimilar properties, when laminated and loaded, often exhibit complex behaviors (e.g., composite laminates) which are frequently misunderstood, unpredictable, and sensitive to lay-up.
3.4. Cross-Ply Lamination Effect
Materials are often laminated to achieve a better balance of properties, improved resistance to cracking, gradual geometric variation, synergy, etc. Good examples include construction plywood, automobile tires, and aircraft skins. LIB cells are made by laminating different materials, with dissimilar mechanical properties, that are homogeneous, textured, anisotropic, and contain defects. Stacking variations are expected to affect jellyroll properties and performance.
Initially, simple experiments were performed. Solid wood (poplar and oak), plywood (hobby type), and thin wood veneers (walnut) were cut into squares using a paper trimmer, stacked, and slowly compressed through the thickness, similar to how jellyroll component (stacks) and jellyrolls were compressed. Solid wood did not exhibit any repetitive cracking patterns, only cracking at the outermost edges aligned parallel to the grain. However, some plywood and wood veneers exhibited repetitive cracking patterns. For veneers with all grain aligned along the same direction (0°), a V-shaped crack pattern, similar to that of compressed jellyrolls, as shown in Figure 7b and Figure 14d, was observed; all cracks aligned parallel to the wood grain direction. When the same veneers were cross-ply stacked (alternating 0°/90°), a dramatically different crack pattern emerged which was more similar to the compressed anode (stack), as shown in Figure 14a. These observations motivated similar alterations to jellyroll component layups.
Compression test material for making altered jellyrolls was obtained by unrolling electrolyte-wet jellyrolls, dry cutting components as previously described, rotating some of them, stacking to ~10–12 mm thicknesses, then dry sectioning and sanding the stacks to ~50 mm × 50 mm square test samples as before. Again, jellyroll components and samples were kept reasonably electrolyte-wet by storing them in plastic bags with other intact electrolyte-wet jellyrolls. Compression testing occurred at 0.05 mm/s, with photographs recorded at every 10% actuator strain up to 50% using the Canon EOS 90D; videos were also recorded for some of the tests. The actuator strains used for photograph timing were slightly greater than extensometer strains owing to load train compliance, as previously described. Additional original jellyrolls were likewise prepared and tested for comparison.
There are many ways to laminate. For example, when every other separator or every separator was rotated 90° within the original jellyroll layup (anodes and cathodes were not rotated), little difference in compression behavior with the same V-shaped fracture pattern as original jellyrolls was observed. Separators are the most anisotropic jellyroll component, at least from the tensile tests motivating these initial tries. However, when compressing a cross-ply jellyroll (stack) made by rotating every other complete component set (cathode/separator/anode/separator), as shown in Figure 15a, significant differences during later stages of compression and cracking pattern were observed, as shown in Figure 15b–d. Figure 16 shows photographs of the compression sequence for the original jellyroll and cross-ply jellyroll (stack), and Figure 17 shows them after testing. Properties and observations are summarized in Table 7. Strain rates were obtained by dividing acturator rates by sample thicknesses.
Figure 15.
Cross-ply jellyroll (stack) results. (a) Prior to cutting into ~50 mm × 50 mm test sample. (b) Compression behavior as compared to original jellyroll. (c) Opened just after testing. (d) Opened mid-thickness after testing.
Figure 15.
Cross-ply jellyroll (stack) results. (a) Prior to cutting into ~50 mm × 50 mm test sample. (b) Compression behavior as compared to original jellyroll. (c) Opened just after testing. (d) Opened mid-thickness after testing.


Table 7.
Original jellyroll and cross-ply jellyroll (stack) compression summary. Strain rates vary slightly due to varying sample thickness. See Figure 13d and Table 6 for results from other original jellyroll compression tests.
|
Compression Sample |
Actuator Rate (mm/s) |
Strain Rate (1/s) | Initial Fracture Stress (MPa) | Compressive Strength, σu (MPa) | Comments |
|---|---|---|---|---|---|
| Original Jellyroll | 0.05 | 0.0046 | 62 | 62 | V cracks aligned parallel to winding direction, additional major load peak beyond 35% strain. |
| Cross-Ply Jellyroll (stack) | 0.05 | 0.0053 | 66 | 92 | Complex radial cracking, increased compressive strength. |
Figure 16.
Compression test sequences for (a) original jellyroll and (b) cross-ply jellyroll (stack) tested at 0.05 mm/s. Actuator strains are indicated; the final photographs are after unloading, UL. Cross-ply jellyroll (stack) was photographed at 45° orientation to record two essentially equivalent faces with a single image. Compression test samples were ~10–12 mm thick and ~50 mm × 50 mm.

Figure 17.
Photograph of original jellyroll and cross-ply jellyroll (stack) tested at 0.05 mm/s. Entire samples are shown. Compression test samples were ~10–12 mm thick and ~50 mm × 50 mm.
Figure 17.
Photograph of original jellyroll and cross-ply jellyroll (stack) tested at 0.05 mm/s. Entire samples are shown. Compression test samples were ~10–12 mm thick and ~50 mm × 50 mm.

Altering the jellyroll component layup affects mechanical properties and how they crack and fail. The cross-ply jellyroll (stack) exhibited a completely different, more radial cracking pattern, with compressive strength increased by nearly 50%, as shown in Figure 15, Figure 16 and Figure 17. The initial fracture (seen as the initial deviation from smoothness on the stress-strain curves) for the cross-ply jellyroll (stack) was just slightly higher than the original jellyroll. After compression, the cross-ply jellyroll puffed up and the original jellyroll did not, as shown in Figure 16. There are many ways to laminate battery cell components; this is just one example.
4. Discussion
Prismatic Li-ion EV battery cell components were mechanically and optically characterized to examine details of material morphology, construction, and response to mechanical loading.
Microscopic homogeneities, anisotropies, and defects are present in jellyroll components. Substantial microscopic texturing occurs parallel to the winding direction for Cu alloy and Al alloy foils as well as the separator. Texturing aligned parallel to the winding direction is also observed macroscopically.
Enclosure case material tensile behaviors are typical for wrought Al alloys. Anodes and cathodes load elastically and fail in a brittle fashion. Cracks initiate at sample edges and are aligned nearly perpendicular to the loading direction. Winding and transverse tensile behaviors are similar. For this cell, cathodes are slightly stiffer than anodes. Separators initially load linearly and elastically; their stress-strain plots become non-linear early on, followed by localized strain reversals (e.g., reverse loop), a complex strain field, very large strains, and unraveling (transverse samples only). Samples loaded along the winding direction (less interesting and not shown) did not unravel; their strain field was also much less complex. The winding direction is slightly stiffer, much stronger, and with less maximum strain than the transverse direction. Unraveling for transverse-oriented separators appears to substantially reduce strength and increase maximum strain at lower test rates. For both orientations, maximum strain is reduced at higher rates and the tests are “noisier”. Loading orientation and strain rate affect separators as reported by others.
When separated, stacked, and compressed, anodes fracture while cathodes and separators do not. Compressed jellyrolls develop well-defined V-shaped cracks aligned parallel to the winding and texture direction; this was repeatedly observed during each and every test. These cracks compromise the separator and cause anodes and cathodes to touch, likely initiating a short circuit.
LIB cells are made by laminating different materials, with dissimilar mechanical properties, that are homogeneous, textured, anisotropic, and contain defects. Stacking variations are expected to affect jellyroll properties and performance. To demonstrate, a cross-ply jellyroll (stack) was made by rotating every other complete component set (cathode/separator/anode/separator), stacking, and compressing as before. The cross-ply jellyroll (stack) exhibited a completely different, more radial cracking pattern, with compressive strength increased by nearly 50%. Altering the jellyroll component layup affects mechanical properties and how they crack and fail.
Based on the mechanical and optical characterization results, there may be ways to enhance the mechanical durability of LIB cells: for example, using lightweight, damage-resistant materials (e.g., S2 glass and/or aramid fiber composites, fiber metal laminates, etc.) for cell case enclosures, reducing jellyroll component defects and texture, and/or altering their layup for improved compressive strength. Future characterization could extend to modules/packs and EVs, such as finding their maximum in-service mechanical loads (e.g., crash test) at high and low temperatures and then comparing them to results for other batteries that have been in service for some time. The knowledge gained can help with the design of future batteries for improved EV performance and safety.
5. Conclusions
The current study provides a reference for the mechanical properties of battery cell components and jellyrolls under different stress modes and strain rates. Moreover, the detailed descriptions of test methods and procedures sheds light on ways to mechanically and optically characterize battery cell materials. Furthermore, the fracture pattern observed during jellyroll compression tests and the ability to alter it demonstrates an important failure mechanism in batteries under mechanical loading, which is critical to calibrate battery safety models and improve battery performance.
Author Contributions
Conceptualization, D.S., F.Z., J.D. and C.B.; methodology, D.S. and F.Z.; investigation, D.S.; resources, D.S.; writing—original draft preparation, D.S.; writing—review and editing, D.S., F.Z. and J.D.; visualization, D.S.; supervision, D.S., F.Z., J.D. and C.B.; project administration, D.S., F.Z., J.D. and C.B.; funding acquisition, F.Z., J.D. and C.B. All authors have read and agreed to the published version of the manuscript.
Funding
This research was funded by Ford Motor Company through University Research Program project 2018-7165R.
Data Availability Statement
Not applicable.
Acknowledgments
We wish to thank the National Science Foundation for the Instron servohydraulic test system and FEI scanning electron microscope, as well as Embry-Riddle Aeronautical University for numerous small equipment and supplies. Sypeck acknowledges assistance from students S. Xu, B. de Bruns, O. Ajimobi, C. Wells, C. Huettner, X. Wang, M. Chotoo, A. Chika, K. Maurer, A. Patil, and F. Stephen.
Conflicts of Interest
The authors declare no conflict of interest. The funders had no role in the design of the study; in the collection, analyses, or interpretation of data; in the writing of the manuscript; or in the decision to publish the results.
References
- Clark, A. Update: True Blue TB44 Li-Ion Battery FAA Certified for Caravan, Dash-8. Disciples of Flight. Available online: https://disciplesofflight.com/lithium-ion-aircraft-battery-certified/ (accessed on 15 July 2023).
- Hayward, J. A Look at the Battery Issues that Grounded the Boeing 787 in 2013. Simple Flying. 3 March 2022. Available online: https://simpleflying.com/boeing-787-battery-issues/ (accessed on 15 July 2023).
- Federal Aviation Administration. FAA Awards Another $20.4M to Electrify Airport Equipment, Latest in $300M Investment This Year. 21 August 2021. Available online: https://www.faa.gov/newsroom/faa-awards-another-204m-electrify-airport-equip-ment-latest-300m-investment-year (accessed on 15 July 2023).
- Kuta, S. Electric Planes Are Taking Flight. Smithsonian Magazine. 23 September 2022. Available online: https://www.smithson-ianmag.com/smart-news/electric-planes-are-taking-flight-180980821/ (accessed on 15 July 2023).
- Viola, F. Electric Vehicles and Psychology. Sustainability 2021, 13, 719. [Google Scholar] [CrossRef]
- Zhou, W.; Cleaver, C.J.; Dunant, C.F.; Allwood, J.M.; Lin, J. Cost, range anxiety and future electricity supply: A review of how today’s technology trends may influence the future uptake of BEVs. Renew. Sustain. Energy Rev. 2023, 173, 113074. [Google Scholar] [CrossRef]
- Zhou, W. Effects of external mechanical loading on stress generation during lithiation in Li-ion battery electrodes. Electrochim. Acta 2015, 185, 28–33. [Google Scholar] [CrossRef]
- Choi, H.Y.; Lee, I.; Lee, J.S.; Kim, Y.M.; Kim, H. A Study on Mechanical Characteristics of Lithium-Polymer Pouch Cell Battery for Electric Vehicle. In Proceedings of the 23rd International Technical Conference on the Enhanced Safety of Vehicles (ESV), Seoul, Republic of Korea, 27–30 May 2013; Available online: https://www-esv.nhtsa.dot.gov/Proceedings/23/files/23ESV-000115.PDF (accessed on 30 September 2023).
- Zhang, C.; Xu, J.; Cao, L.; Wu, Z.; Santhanagopalan, S. Constitutive behavior and progressive mechanical failure of electrodes in lithium-ion batteries. J. Power Sources 2017, 357, 126–137. [Google Scholar] [CrossRef]
- Luo, H.; Jiang, X.; Xia, Y.; Zhou, Q. Fracture Mode Analysis of Lithium-Ion Battery Under Mechanical Loading. In ASME 2015 International Mechanical Engineering Congress and Exposition; American Society of Mechanical Engineers: New York, NY, USA, 2015. [Google Scholar] [CrossRef]
- Jiang, X.; Luo, H.; Xia, Y.; Zhou, Q. Mechanical Behavior of Lithium-Ion Battery Component Materials and Error Sources Analysis for Test Results. SAE Int. J. Mater. Manf. 2016, 9, 614–621. [Google Scholar] [CrossRef]
- Xia, Y.; Chen, G.; Zhou, Q.; Shi, X.; Shi, F. Failure behaviours of 100% SOC lithium-ion battery modules under different impactloading conditions. Eng. Fail. Anal. 2017, 82, 149–160. [Google Scholar] [CrossRef]
- Kalnaus, S.; Wang, H.; Watkins, T.R.; Simunovic, S.; Sengupta, A. Features of mechanical behavior of EV battery modules under high deformation rate. Extrem. Mech. Lett. 2019, 32, 100550. [Google Scholar] [CrossRef]
- Deng, J.; Smith, I.; Bae, C.; Rairigh, P.; Miller, T.; Bapiraju, S. Communication—Impact Behaviors of Pouch and Prismatic Battery Modules. J. Electrochem. Soc. 2021, 168, 020520. [Google Scholar] [CrossRef]
- Zhu, F.; Zhou, R.; Sypeck, D.; Deng, J.; Bae, C. Failure behavior of prismatic Li-ion battery cells under abuse loading condition—A combined experimental and computational study. J. Energy Storage 2022, 48, 103969. [Google Scholar] [CrossRef]
- Logakannan, K.P.; Zhu, F.; Sypeck, D.; Xu, S.; Deng, J.; Kim, S. Testing and Modeling of Vehicle Li-Ion Battery Module with Prismatic Cells under Abuse Conditions. Energies 2023, 16, 1055. [Google Scholar] [CrossRef]
- Turner, J.A.; Allu, S.; Gorti, S.; Kalnaus, S.; Kumar, A.; Lebrun-Grandie, D.; Pannala, S.; Simunovic, S.; Slattery, S.; Wang, H. Crash Models for Advanced Automotive Batteries. Oak Ridge National Laboratory. ORNL/TM-2015/366; February 2015. Available online: https://info.ornl.gov/sites/publications/files/Pub56852.pdf (accessed on 15 July 2023).
- Liu, B.; Jia, Y.; Yuan, C.; Wang, L.; Gao, X.; Yin, S.; Xu, J. Safety issues and mechanisms of lithium-ion battery cell upon mechanical abusive loading: A review. Energy Storage Mater. 2020, 24, 85–112. [Google Scholar] [CrossRef]
- Deng, J.; Bae, C.; Denlinger, A.; Miller, T. Progress in battery safety modeling. Prog. Energy 2022, 4, 043001. [Google Scholar] [CrossRef]
- Chung, S.H.; Tancogne-Dejean, T.; Zhu, J.; Luo, H.; Wierzbicki, T. Failure in lithium-ion batteries under transverse indentation loading. J. Power Sources 2018, 389, 148–159. [Google Scholar] [CrossRef]
- Logakannan, K.P.; Zhu, F.; Sypeck, D.; Deng, J.; Kim, S. Impact response of prismatic Li-ion battery jellyrolls and cells. Int. J. Impact Eng. 2022, 170, 104352. [Google Scholar] [CrossRef]
- Lima, P. What the Future Holds for the Fiat 500e. PushEVs 06/03/2017. Available online: https://pushevs.com/2017/03/06/future-holds-fiat-500e/ (accessed on 30 September 2023).
- FoodSaver General Questions. 2023. Available online: https://www.foodsaver.com/support/Auto-Ship-Program-FAQ?cfid=general-bag-roll-faq (accessed on 30 September 2023).
- Celgard Online Store for North America Customers Only. 2023. Available online: https://celgard.shop/ (accessed on 30 September 2023).
- ASTM D3039/D3039M-08; Standard Test Method for Tensile Properties of Polymer Matrix Composite Materials. ASTM International: West Conshohocken, PA, USA, 2023. Available online: https://www.astm.org/d3039_d3039m-08.html (accessed on 30 September 2023).
- ASTM D882-18; Standard Test Method for Tensile Properties of Thin Plastic Sheeting. ASTM International: West Conshohocken, PA, USA, 2023. Available online: https://www.astm.org/d0882-18.html (accessed on 30 September 2023).
- Kyowa Electronics Instrument Co., Ltd. KFEM Ultrahigh-elongation Foil Strain Gages. 2023. Available online: https://product.kyowa-ei.com/en/products/strain-gages/type-kfem?tab=features (accessed on 24 October 2023).
- Callister, W.D.; Rethwisch, D.G. Materials Science and Engineering: An Introduction, 10th ed.; Wiley: New York, NY, USA, 2018. [Google Scholar]
- Carbon—Graphite Materials. AZO Materials. 2023. Available online: https://www.azom.com/properties.aspx?ArticleID=516 (accessed on 30 September 2023).
- Carbon, C. MatWeb Materials Property Data. 2023. Available online: https://matweb.com/search/DataSheet.aspx?MatGUID=3f64b985402445c0a5af911135909344 (accessed on 30 September 2023).
- Ashby, M.F. Materials Selection in Mechanical Design, 2nd ed.; Elsevier: Oxford, UK, 1999. [Google Scholar]
Figure 1.
(a) LIB module containing six cells. (b) Extracted prismatic LIB cell.

Figure 2.
Prismatic LIB cell components. (a) Enclosure case (left) and four extracted jellyrolls within thin blue polymer wrap (right). (b) Enclosure case with marked tensile sample locations; A and C are shown. (c) Four jellyrolls, thin Cu alloy side sheet, white polymer jellyroll spacer, and electrical connectivity. (d) Lithiated NMC cathode (left), translucent white polymer separator over anode (middle and right), separator only (far right), uncoated portions of Al alloy cathode and Cu alloy anode foils on opposing edges. Macroscopic texture is visible parallel to the winding direction.

Figure 3.
(a) Anode and (b) cathode coating detachment in tap water. Anodes and cathodes are ~165–170 mm in the transverse direction (vertical); the jellyroll width.
Figure 3.
(a) Anode and (b) cathode coating detachment in tap water. Anodes and cathodes are ~165–170 mm in the transverse direction (vertical); the jellyroll width.

Figure 4.
(a–n) Optical microscope and (o) SEM images of jellyroll components. Some morphology observations are marked with labels and pointers.
Figure 4.
(a–n) Optical microscope and (o) SEM images of jellyroll components. Some morphology observations are marked with labels and pointers.


Figure 5.
(a) Experimental setup for enclosure sample tensile tests. (b) Typical dogbone-type test sample just after fracture showing partially adhered (hot glue) extensometer.
Figure 5.
(a) Experimental setup for enclosure sample tensile tests. (b) Typical dogbone-type test sample just after fracture showing partially adhered (hot glue) extensometer.

Figure 6.
(a) Experimental setup for jellyroll component tensile tests; illuminated cathode being tested. (b) Video snapshot of beginning stages of a separator tensile (transverse) test at 5 mm/s showing orthogonal ultrahigh elongation strain gages. (c) Video snapshot of an anode tensile (transverse) test at 0.05 mm/s just prior to fracture showing biaxial strain gage. The grip rollers are 50.8 mm (2 in) wide.

Figure 7.
(a) Experimental setup for jellyroll component and jellyroll compression tests. (b) Photograph of full jellyroll compressed at 0.05 mm/s and then unloaded. Samples were ~10–12 mm thick and ~50 mm × 50 mm prior to testing.
Figure 7.
(a) Experimental setup for jellyroll component and jellyroll compression tests. (b) Photograph of full jellyroll compressed at 0.05 mm/s and then unloaded. Samples were ~10–12 mm thick and ~50 mm × 50 mm prior to testing.

Figure 8.
(a–c) Enclosure case material tensile behaviors. (d) Photograph of tested ~240 mm × 25 mm dogbone-type test samples showing 30°/60° oriented fractures.
Figure 8.
(a–c) Enclosure case material tensile behaviors. (d) Photograph of tested ~240 mm × 25 mm dogbone-type test samples showing 30°/60° oriented fractures.

Figure 9.
Anode tensile behavior. (a) Winding direction. (b) Transverse direction.

Figure 10.
Cathode tensile behavior. (a) Winding direction. (b) Transverse direction.

Figure 11.
Separator tensile behavior. (a,b) Winding direction. (c,d) Transverse direction. Initial strain gage strain plots are shown only up to appearance of a reverse loop.
Figure 11.
Separator tensile behavior. (a,b) Winding direction. (c,d) Transverse direction. Initial strain gage strain plots are shown only up to appearance of a reverse loop.

Figure 12.
Video snapshots of separator tensile (transverse) tests just prior to fracture; (a) 5 mm/s actuator rate; (b) 60 mm/s actuator rate. The grip rollers are 50.8 mm (2 in) wide.
Figure 12.
Video snapshots of separator tensile (transverse) tests just prior to fracture; (a) 5 mm/s actuator rate; (b) 60 mm/s actuator rate. The grip rollers are 50.8 mm (2 in) wide.

Figure 13.
Jellyroll component (stack) and jellyroll compressive behaviors. (a) Anode (stack). (b) Cathode (stack). (c) Separator (stack). (d) Jellyroll.
Figure 13.
Jellyroll component (stack) and jellyroll compressive behaviors. (a) Anode (stack). (b) Cathode (stack). (c) Separator (stack). (d) Jellyroll.

Figure 14.
Photographs of jellyroll components (stack) and jellyroll before (upper left corner) and after compression at 0.05 mm/s. (a) Anode (stack). (b) Cathode (stack). (c) Separator (stack). (d) Jellyroll. Compression test samples were ~10–12 mm thick and ~50 mm × 50 mm; winding direction is parallel to the left sample edge for all photographs (see black arrow on separator stack).

Table 1.
LIB module and cell details.
| Parameter | Value |
|---|---|
| Module mass | 13.2 kg |
| Module dimensions | ~280 × 180 × 150 mm |
| Module voltage | ~21 V |
| Module rated capacity | 63 Ah [22] |
| Module watt-hour rating | 236.25 Wh [22] |
| Cell mass | 1.9 kg |
| Cell dimensions | ~173 × 125 × 45 mm |
| Cell voltage | 3.75 V [22] |
Table 2.
Jellyroll layer and component thicknesses.
| Component | Measurement (Five Times Each) | Mean Thickness (μm) (Each Layer) |
|---|---|---|
| Jellyroll layer (cathode/separator/anode/separator) | Single layer | 310 |
| Anode | Five-layer stack | 119 |
| Cathode | Five-layer stack | 141 |
| Separator | Twenty-layer stack | 25 |
| Cu alloy foil | Twenty-layer stack | 9 |
| Al alloy foil | Twenty-layer stack | 12 |
| Graphite + translucent white | - | (119 − 9)/2 = 55 |
| Lithiated NMC | - | (141 − 12)/2 = 64.5 |
| Translucent white | - | Very thin |
Table 3.
Jellyroll component morphology observations.
| Component | Observations |
|---|---|
| Translucent white | Very thin, ~40° angular texture. |
| Graphite | Very porous, ~10 μm dia granules, uniform. |
| Cu alloy foil (facing out) | Channels aligned parallel to winding direction, valleys, pores, residual graphite specks. |
| Cu alloy foil (facing in) | Channels aligned parallel to winding direction, pores, different phases. |
| Lithiated NMC | Porous, ~5 μm dia granules, uniform. |
| Al alloy foil | Scratches (well-defined widths, edges, and alignment) aligned parallel to winding direction, many pores. |
| Separator | Texture aligned parallel to winding direction, micropores and fibrils aligned parallel to winding direction. |
Table 4.
Enclosure case material tensile test results. Fracture outside extensometer gage region indicated by *.
Table 4.
Enclosure case material tensile test results. Fracture outside extensometer gage region indicated by *.
| Tensile Sample | Actuator Rate (mm/s) | Strain Rate (1/s) | Young’s Modulus, E (GPa) | Yield Strength, σy (MPa) | Tensile Strength, σu (MPa) | Maximum Strain, εmax (%) |
|---|---|---|---|---|---|---|
| A1 | 5 | 0.06 | 69 | 187 | 212 | 4.4 |
| A2 | 35 | 0.44 | 69 | 181 | 212 | 4.8 |
| A3 | 65 | 0.81 | 69 | 172 | 212 | 5.2 |
| B1 | 5 | 0.06 | 69 | 182 | 207 | 2.8 * |
| B2 | 35 | 0.44 | 69 | 180 | 208 | 4.6 |
| B3 | 65 | 0.81 | 69 | 180 | 214 | 2.9 * |
| C1 | 35 | 0.44 | 69 | 169 | 187 | 5.8 |
Table 5.
Jellyroll component tensile test summary. For the separator, and ν use initial strain gage strain data, and use actuator strain data indicted by *.
Table 5.
Jellyroll component tensile test summary. For the separator, and ν use initial strain gage strain data, and use actuator strain data indicted by *.
| Tensile Sample | Actuator Rate (mm/s) | Strain Rate (1/s) | Young’s Modulus, E (GPa) | Poisson’s Ratio, ν | Tensile Strength, σu (MPa) | Maximum Strain, εmax (%) | Comments |
|---|---|---|---|---|---|---|---|
| Anode (winding) | 0.05 | 0.00067 | 12 | 0.30–0.35 | 16–21 | 0.15–0.22 | Elastic, then fracture. |
| Anode (transverse) | 0.05 | 0.00067 | 12 | 0.30–0.35 | 18–21 | 0.16–0.20 | Elastic, then fracture. |
| Cathode (winding) | 0.05 | 0.00067 | 15 | 0.25–0.30 | 18–20 | 0.15–0.18 | Elastic, then fracture. |
| Cathode (transverse) | 0.05 | 0.00067 | 15 | 0.25–0.30 | 16–21 | 0.14–0.18 | Elastic, then fracture. |
| Separator (winding) | 5, 60 | 0.067, 0.80 | 10 (high), 10 (high) | 0.25–0.30, 0.35+ | 165–169 *, 175 * | 43–59 *, 36 * | Initially elastic, then complex strains, “noisier” at higher rates. |
| Separator (transverse) | 5, 60 | 0.067, 0.80 | 7 (high), 7 (high) | 0.25–0.30, 0.35+ | 13–15 *, 20 * | 102–133+ *, 40 * | Initially elastic, then complex strains, unraveling, “noisier” at higher rates. |
Table 6.
Jellyroll component (stack) and jellyroll compression summary. Strain rates vary slightly due to varying sample thickness.
Table 6.
Jellyroll component (stack) and jellyroll compression summary. Strain rates vary slightly due to varying sample thickness.
| Compression Sample | Actuator Rate (mm/s) | Strain Rate (1/s) | Initial Fracture Stress (MPa) | Comments |
|---|---|---|---|---|
| Anode (stack) | 0.05, 30, 60 | 0.0044, 2.7, 5.2 | 56, 54, 62 | Complex cracking, additional major load peak beyond 40% strain, little rate effect. |
| Cathode (stack) | 0.05, 30, 60 | 0.0043, 2.7, 5.5 | - | No cracks, slightly stiffer with increased rate. |
| Separator (stack) | 0.05, 30, 60 | 0.0044, 2.7, 5.4 | - | No cracks, increased strain along transverse direction, wavy (see black arrow), slightly stiffer and stronger with increased rate, “noisier”, darkened color after compressing. |
| Jellyroll | 0.05, 30, 60 | 0.0044, 2.6, 5.3 | 66, 35, 34 | V cracks aligned parallel to winding direction, additional major load peak beyond 35% strain, stiffer, weaker, and fracture earlier with increased rate. |
Disclaimer/Publisher’s Note: The statements, opinions and data contained in all publications are solely those of the individual author(s) and contributor(s) and not of MDPI and/or the editor(s). MDPI and/or the editor(s) disclaim responsibility for any injury to people or property resulting from any ideas, methods, instructions or products referred to in the content. |
© 2023 by the authors. Licensee MDPI, Basel, Switzerland. This article is an open access article distributed under the terms and conditions of the Creative Commons Attribution (CC BY) license (https://creativecommons.org/licenses/by/4.0/).
Share and Cite
MDPI and ACS Style
Sypeck, D.; Zhu, F.; Deng, J.; Bae, C. Mechanical and Optical Characterization of Lithium-Ion Battery Cell Components/Cross-Ply Lamination Effect. Batteries 2023, 9, 541. https://doi.org/10.3390/batteries9110541
AMA Style
Sypeck D, Zhu F, Deng J, Bae C. Mechanical and Optical Characterization of Lithium-Ion Battery Cell Components/Cross-Ply Lamination Effect. Batteries. 2023; 9(11):541. https://doi.org/10.3390/batteries9110541
Chicago/Turabian StyleSypeck, David, Feng Zhu, Jie Deng, and Chulheung Bae. 2023. "Mechanical and Optical Characterization of Lithium-Ion Battery Cell Components/Cross-Ply Lamination Effect" Batteries 9, no. 11: 541. https://doi.org/10.3390/batteries9110541
Note that from the first issue of 2016, this journal uses article numbers instead of page numbers. See further details here.