Article

Experimental Investigation of Thermal Runaway Propagation in a Lithium-Ion Battery Pack: Effects of State of Charge and Coolant Flow Rate

1
School of Energy Science and Engineering, University of Science and Technology of China, Guangzhou 510640, China
2
Laboratory of Advanced Energy Systems, Guangzhou Institute of Energy Conversion, Chinese Academy of Sciences (CAS), Guangzhou 510640, China
3
CAS Key Laboratory of Renewable Energy, Guangzhou 510640, China
4
Guangdong Provincial Key Laboratory of New and Renewable Energy Research and Development, Guangzhou 510640, China
*
Authors to whom correspondence should be addressed.
These authors contributed equally to this work.
Batteries 2023, 9(11), 552; https://doi.org/10.3390/batteries9110552
Submission received: 7 October 2023 / Revised: 8 November 2023 / Accepted: 9 November 2023 / Published: 12 November 2023
(This article belongs to the Section Battery Modelling, Simulation, Management and Application)

Abstract

:
Lithium-ion batteries (LIBs) are widely used as power sources for electric vehicles due to their various advantages, including high energy density and low self-discharge rate. However, the safety challenges associated with LIB thermal runaway (TR) still need to be addressed. In the present study, the effects of the battery SOC value and coolant flow rate on the TR behavior in a LIB pack are comprehensively investigated. The battery pack consists of 10 18650-type LIBs applied with the serpentine channel liquid-cooling thermal management system (TMS). The TR tests for various SOC values (50%, 75% and 100%) and coolant flow rates (0 L/h, 32 L/h, 64 L/h and 96 L/h) are analyzed. The retarding effect of the TMS on TR propagation is found to be correlated with both the coolant flow rate and the battery SOC value, and a larger coolant flow rate and lower SOC generally result in fewer TR batteries. Furthermore, the TR propagation rate, evaluated by the time interval of TR occurrence between the adjacent batteries, increases with the battery SOC. The battery pack with 100% SOC shows more rapid TR propagation, which can be completed in just a few seconds, in contrast to several minutes for 50% and 75% SOC cases. In addition, the impact of the battery SOC and coolant flow rate on the maximum temperature of the TR battery is also examined, and no determined association is observed between them. However, it is found that the upstream batteries (closer to the external heater) show a slightly higher maximum temperature than the downstream ones, indicating a weak association between the TR battery maximum temperature and the external heating duration or the battery temperature at which the TR starts to take place.

1. Introduction

Lithium-ion batteries (LIBs) are widely used to power electric vehicles (EVs) due to their advantages, including high energy efficiency, long cycle life, low self-discharge rate [1,2] and negligible memory effect [3,4,5]. However, battery burning and explosions caused by thermal runaway (TR) still present concerning safety challenges [6,7,8]. In EVs, a large number of batteries are connected to form a pack with the aim of meeting the required voltage and capacity; they are tightly bonded within the pack to reduce the bulk volume. When a single battery TR occurs, the generated heat is easily transferred to the adjacent ones, leading to TR propagation in the pack and resulting in a large-scale safety accident [9].
Battery TR can be triggered by various abuses that are classified into mechanical, electrical and thermal abuses [10,11,12]. All these can lead to battery overheating, which is a direct factor causing TR [13,14]. In the event of battery abuse, side reactions of the various materials inside the battery may occur, followed by abnormal heat generation resulting in further temperature rise if the heat is not effectively removed. The synergetic effect of increased side-reaction rate and temperature rise inevitably causes battery TR; therefore, an effective battery thermal management system (BTMS) is necessary, not only to keep the batteries operating within an appropriate temperature range during the regular operation [15,16,17,18,19] but also to provide efficient heat dissipation under the condition of battery abuse to prevent battery TR and its propagation.
The retarding effect of liquid-cooling BTMS with different coolant flow rates (0 L/h, 32 L/h, 64 L/h and 96 L/h) on TR propagation in the battery pack consisting of 10 18650-type LIBs was recently examined by Ke et al. [20]. Their experimental results show that the TR rate in the battery pack is almost random for lower values of coolant flow rates (0 L/h, 32 L/h and 64 L/h), but TR propagation can be effectively prevented when the coolant flow rate increases to 96 L/h, i.e., only the directly heated No. 1 battery is subjected to TR. Their investigation also shows that the sideways spreading of the high-temperature electrolyte ejected from the positive side of the TR battery is the leading mechanism yielding TR propagation in the battery pack, while heat conduction or radiation plays a minor role. However, all these conclusions are based on batteries with a state of charge (SOC) of 75%, and the impact of SOC on TR propagation was not examined.
Different from the work by Ke et al. [20], some researchers focused on the association between the SOC value and TR propagation behavior for batteries without applying the BTMS. Liu et al. [21] investigated the TR propagation rate in battery packs with various SOC values under different ambient pressures and showed that the TR propagation rate increases with ambient pressure and SOC value. The TR propagation rate increases by 476% when the SOC value increases from 30% to 100% under standard atmospheric pressure. Wang et al. [22] investigated TR propagation in battery packs with various SOC values and different connection modes. They found that the TR is more likely triggered when the SOC falls within 40–60%. In addition, the TR interval between adjacent batteries decreases when the proportion of parallel-connected batteries in the pack increases. Fang et al. [23] experimentally investigated how TR propagation is affected by the SOC value and the distance between batteries. They found that TR propagation could be retarded by reducing the SOC value or increasing the distance between batteries and that TR only occurs in the batteries with SOC ≥ 50%. Li et al. [24] examined the impact of SOC on the combustion behavior of TR batteries. They found a significant amount of smoke when burning batteries with SOC = 50%, while a violent jet flame was observed when burning batteries with SOC = 100%. Zhu et al. [25] examined the TR propagation of NCM pouch-type batteries with different SOC values and spacing distances. They showed that TR propagation time decreases with the increase in SOC value and the decrease in spacing distance. In comparison with spacing distance, the SOC has a more pronounced impact on the maximum temperature, flame ejection behavior and mass loss.
In practical applications, LIB packs are equipped with BTMS for safety. The above investigations of the impact of SOC on TR behavior in the pack without BTMS applications are inadequate. Although the impact of BTMS on TR behavior has been studied by Ke et al. [20], battery SOC was constant (SOC = 75%) in their experiments and the effect of the variation in SOC was not considered. In this paper, we present more experimental results for LIB packs with SOC = 50% and 100% following the study by Ke et al. [20], and more comprehensively examine the effects of SOC and coolant flow rate on TR propagation behavior.

2. Experimental Setup
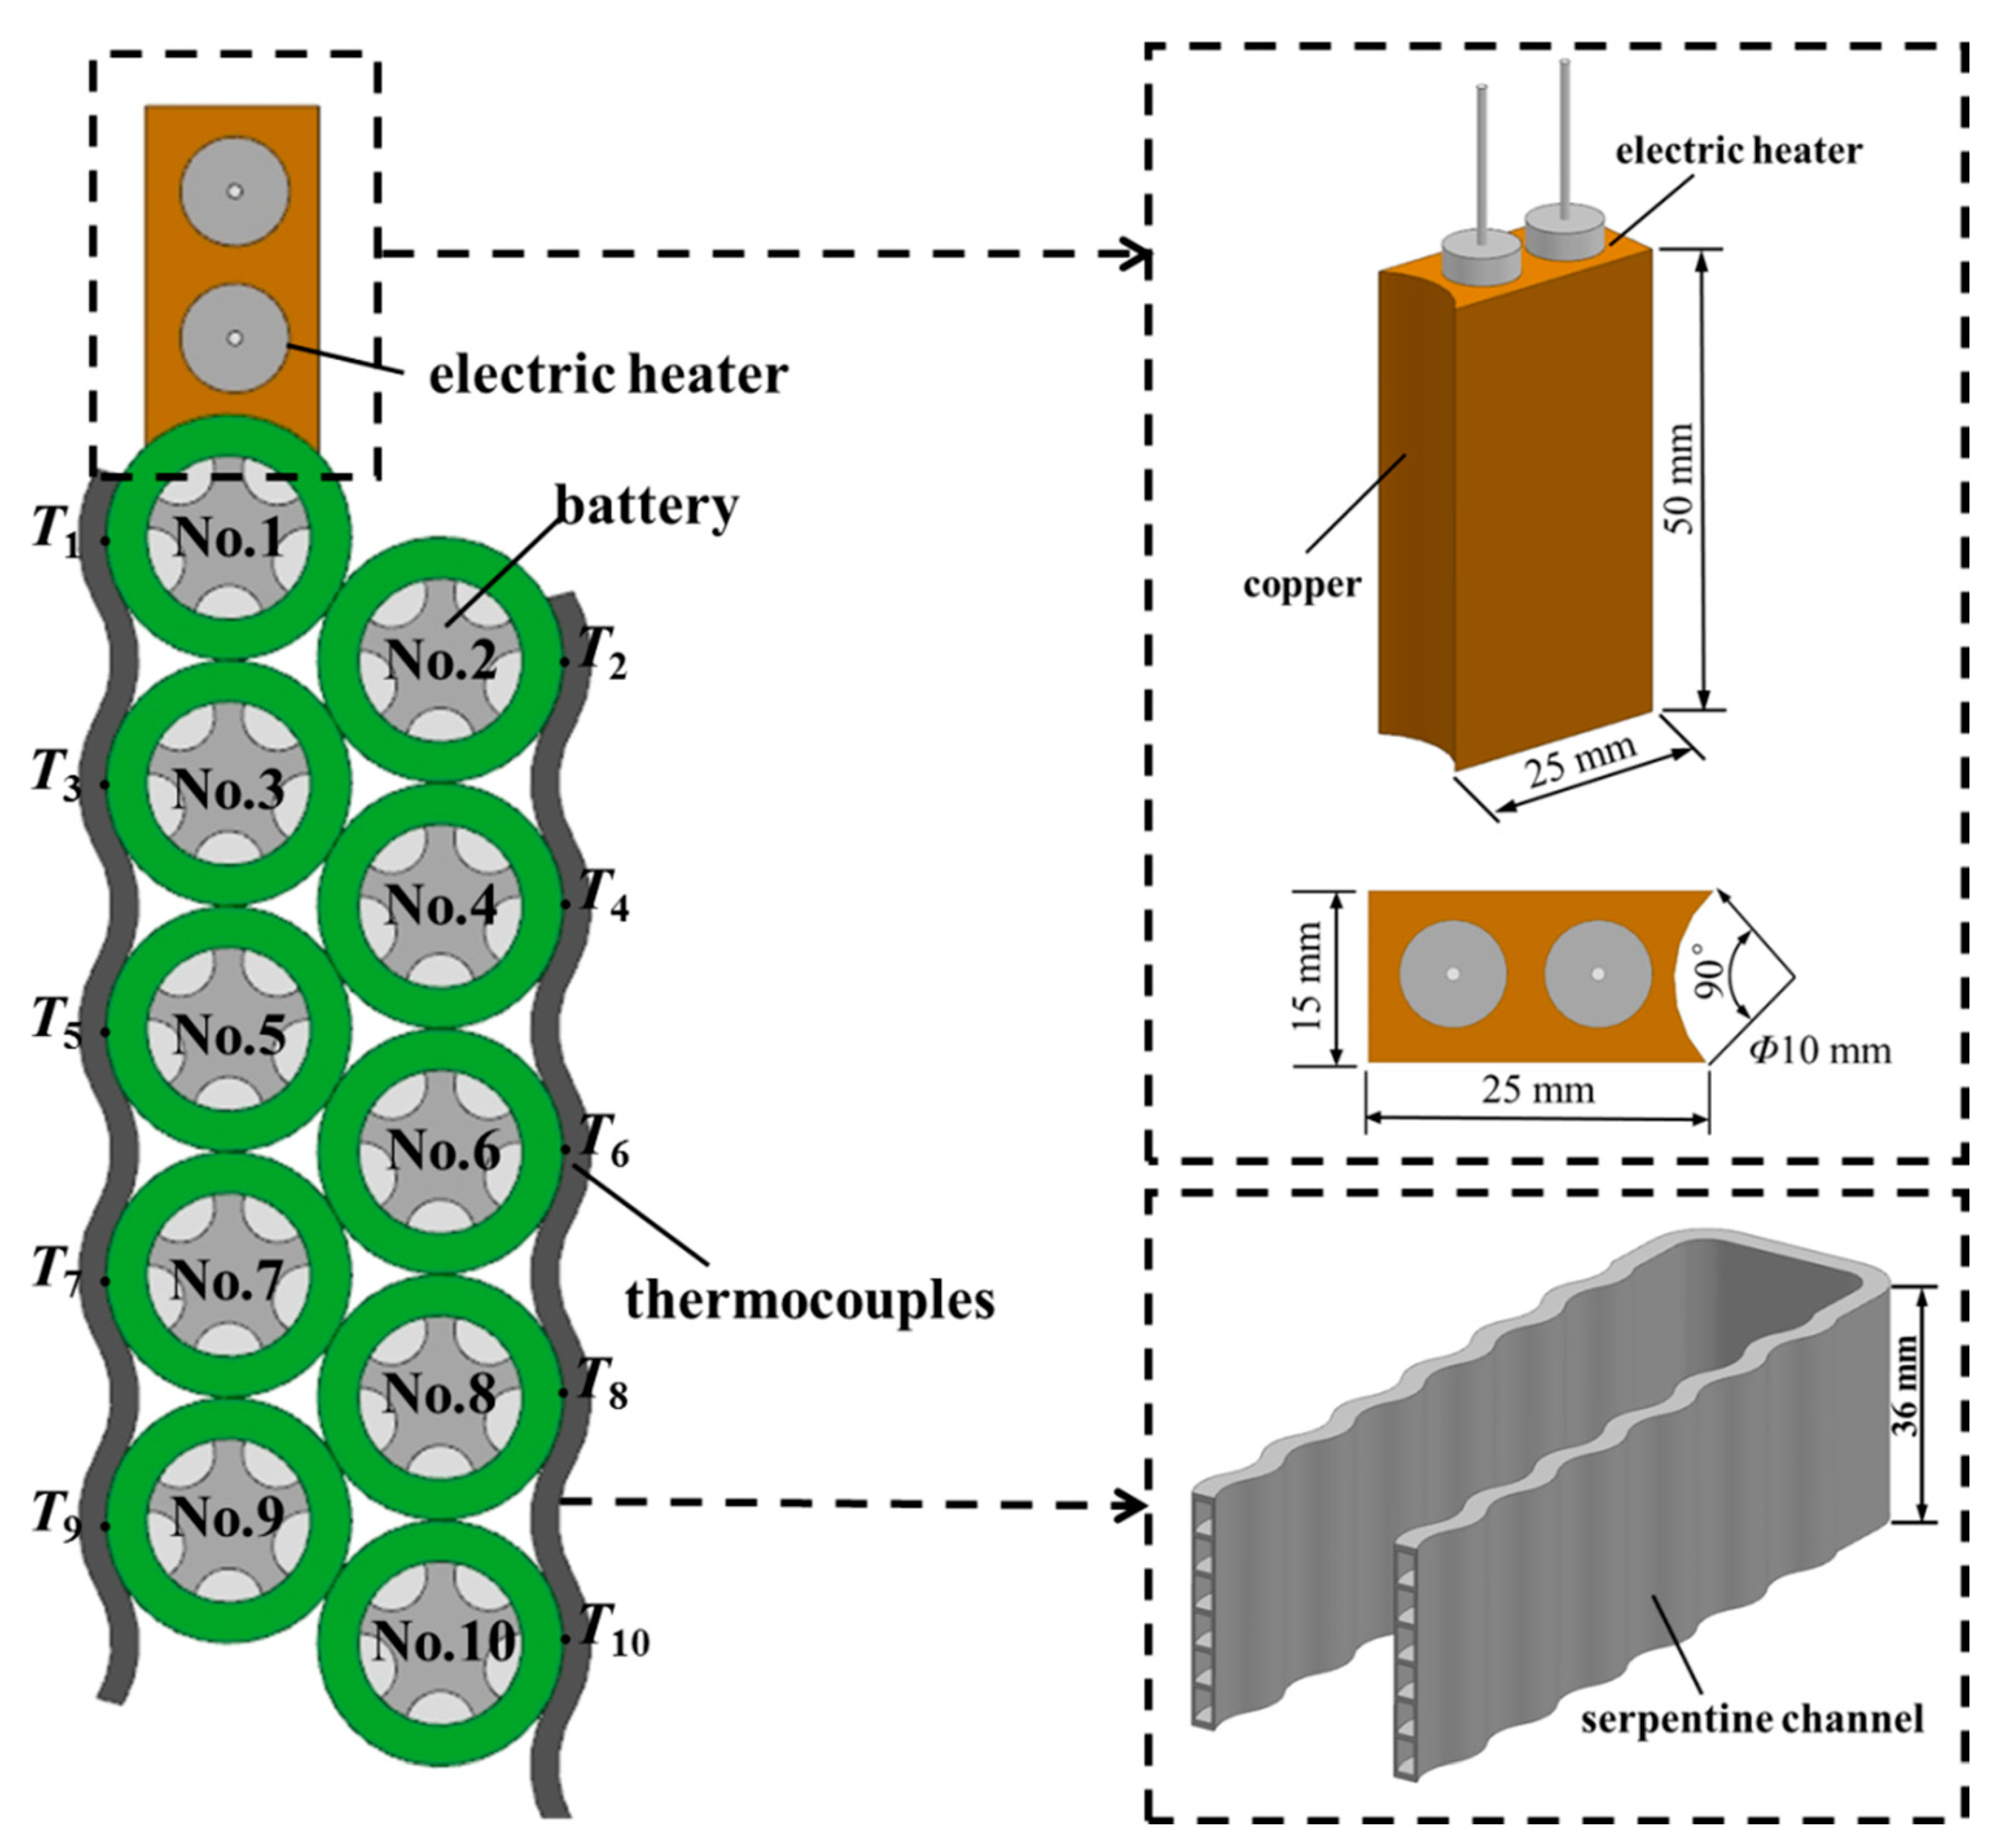
2.1. Battery Module

As shown in Figure 1, the battery module that consists of 10 batteries is equipped with a serpentine cooling channel, an electric heater and some thermocouples. The batteries are commercial 18650 LIBs with a nominal capacity of 2.75 Ah (manufactured by Shenzhen BAK Battery Co., Ltd., Shenzhen, China) and use graphite and nickel–cobalt–aluminum (NCA) as the anode and cathode materials, respectively. Detailed specifications for the batteries are given in Table 1.
The serpentine channel contains six parallel microchannels; their detailed information is given in [26]. The No. 1 battery is directly heated by the electric heater, and the others are numbered in series from No. 2 to No. 10 following No. 1. The electric heater is specially designed with a cambered surface to fit the battery surface curvature for the purpose of effective heating. Copper is chosen as the base on which two electric heating rods are inserted. The heating power is 70 W, which is adequate to trigger the TR of the No. 1 battery.
As shown in Figure 2a, the 10 batteries are connected in parallel by nickel sheets on both the positive and negative sides and the presence of the nickel sheet at the top of the battery causes the electrolyte ejected from the TR battery to spread to the neighbors. In order to distinguish the heat transfer mechanisms associated with electrolyte diffusion and heat conduction (radiation), an aluminum sleeve (shown in Figure 2b) is designed to cover the battery pack whose nickel sheet is removed so that the ejected electrolyte passes through the sleeve, preventing its diffusion. The structure of this ejection isolation sleeve is shown in Figure 2c. In order to prevent heat conduction between the batteries and the sleeve, the inner diameter at the sleeve end is manufactured to be 19 mm, which is 1 mm larger than the battery diameter so that the thermal contact resistance is large enough to reduce conductive heat loss from the battery to the sleeve.

2.2. Experimental System

The battery module is placed in a thermostatic explosion-proof chamber (KOMEG, type KMT-408L-C1). As depicted in Figure 3, the coolant (distilled water), driven by the water pump (Grundfos, type UPA 15-120), circulates in a closed loop through a radiator (ribbon-tubular type, 30 rows) equipped with a fan, serpentine cooling channel and receiving tank. The coolant flow rate is regulated by the float flow meter with a range from 16 L/h to 160 L/h and an increment of 8 L/h. A voltage transformer is used to power the electric heater. K-type thermocouples with measurements ranging from 0 °C to 1300 °C and uncertainty of ±0.3 °C are used to measure the battery temperature and the ambient temperature, which are controlled by the air conditioner in the chamber and the laboratory room, respectively. Temperature data are collected every second by the data recorder (Agilent 34970A, Agilent Technologies Inc., California, USA) and stored in the computer.

2.3. Experimental Procedure

For the purpose of experiment consistency, new batteries that undergo hybrid pulse power characteristic (HPPC) tests [27] and satisfy the following criteria are selected: (1) capacity from 2.70 Ah to 2.80 Ah, (2) internal resistance from 30 mΩ to 40 mΩ, (3) open circuit voltage (OCV) from 4.18 V to 4.2 V. Each battery pack, with a capacity of around 26 Ah, is activated by three charge and discharge cycles at a rate of 0.2 C and separated cutoff voltages of 4.2 V and 3 V. They are then charged again to 50% and 100% SOC at 0.2 C and finally subjected to the TR tests. It should be noted that the test results for 75% SOC have been presented by Ke et al. [20], and they are employed in the present study for the comprehensive analysis of TR propagation behavior at various SOC values (50%, 75% and 100%).
During the tests, the ambient temperature is set to 25 °C. When the battery temperature is brought to 25 °C by the running BTMS, the electric heater is powered on. Once the TR of the No. 1 battery is successfully triggered, the heater is immediately powered off while the BTMS keeps running until all the batteries cool down to ambient temperature. The examined coolant flow rates were 0 L/h, 32 L/h, 64 L/h and 96 L/h, and were kept constant for each test. More information on the experimental setup can be found in Ke et al. [20].

3. Results and Discussion

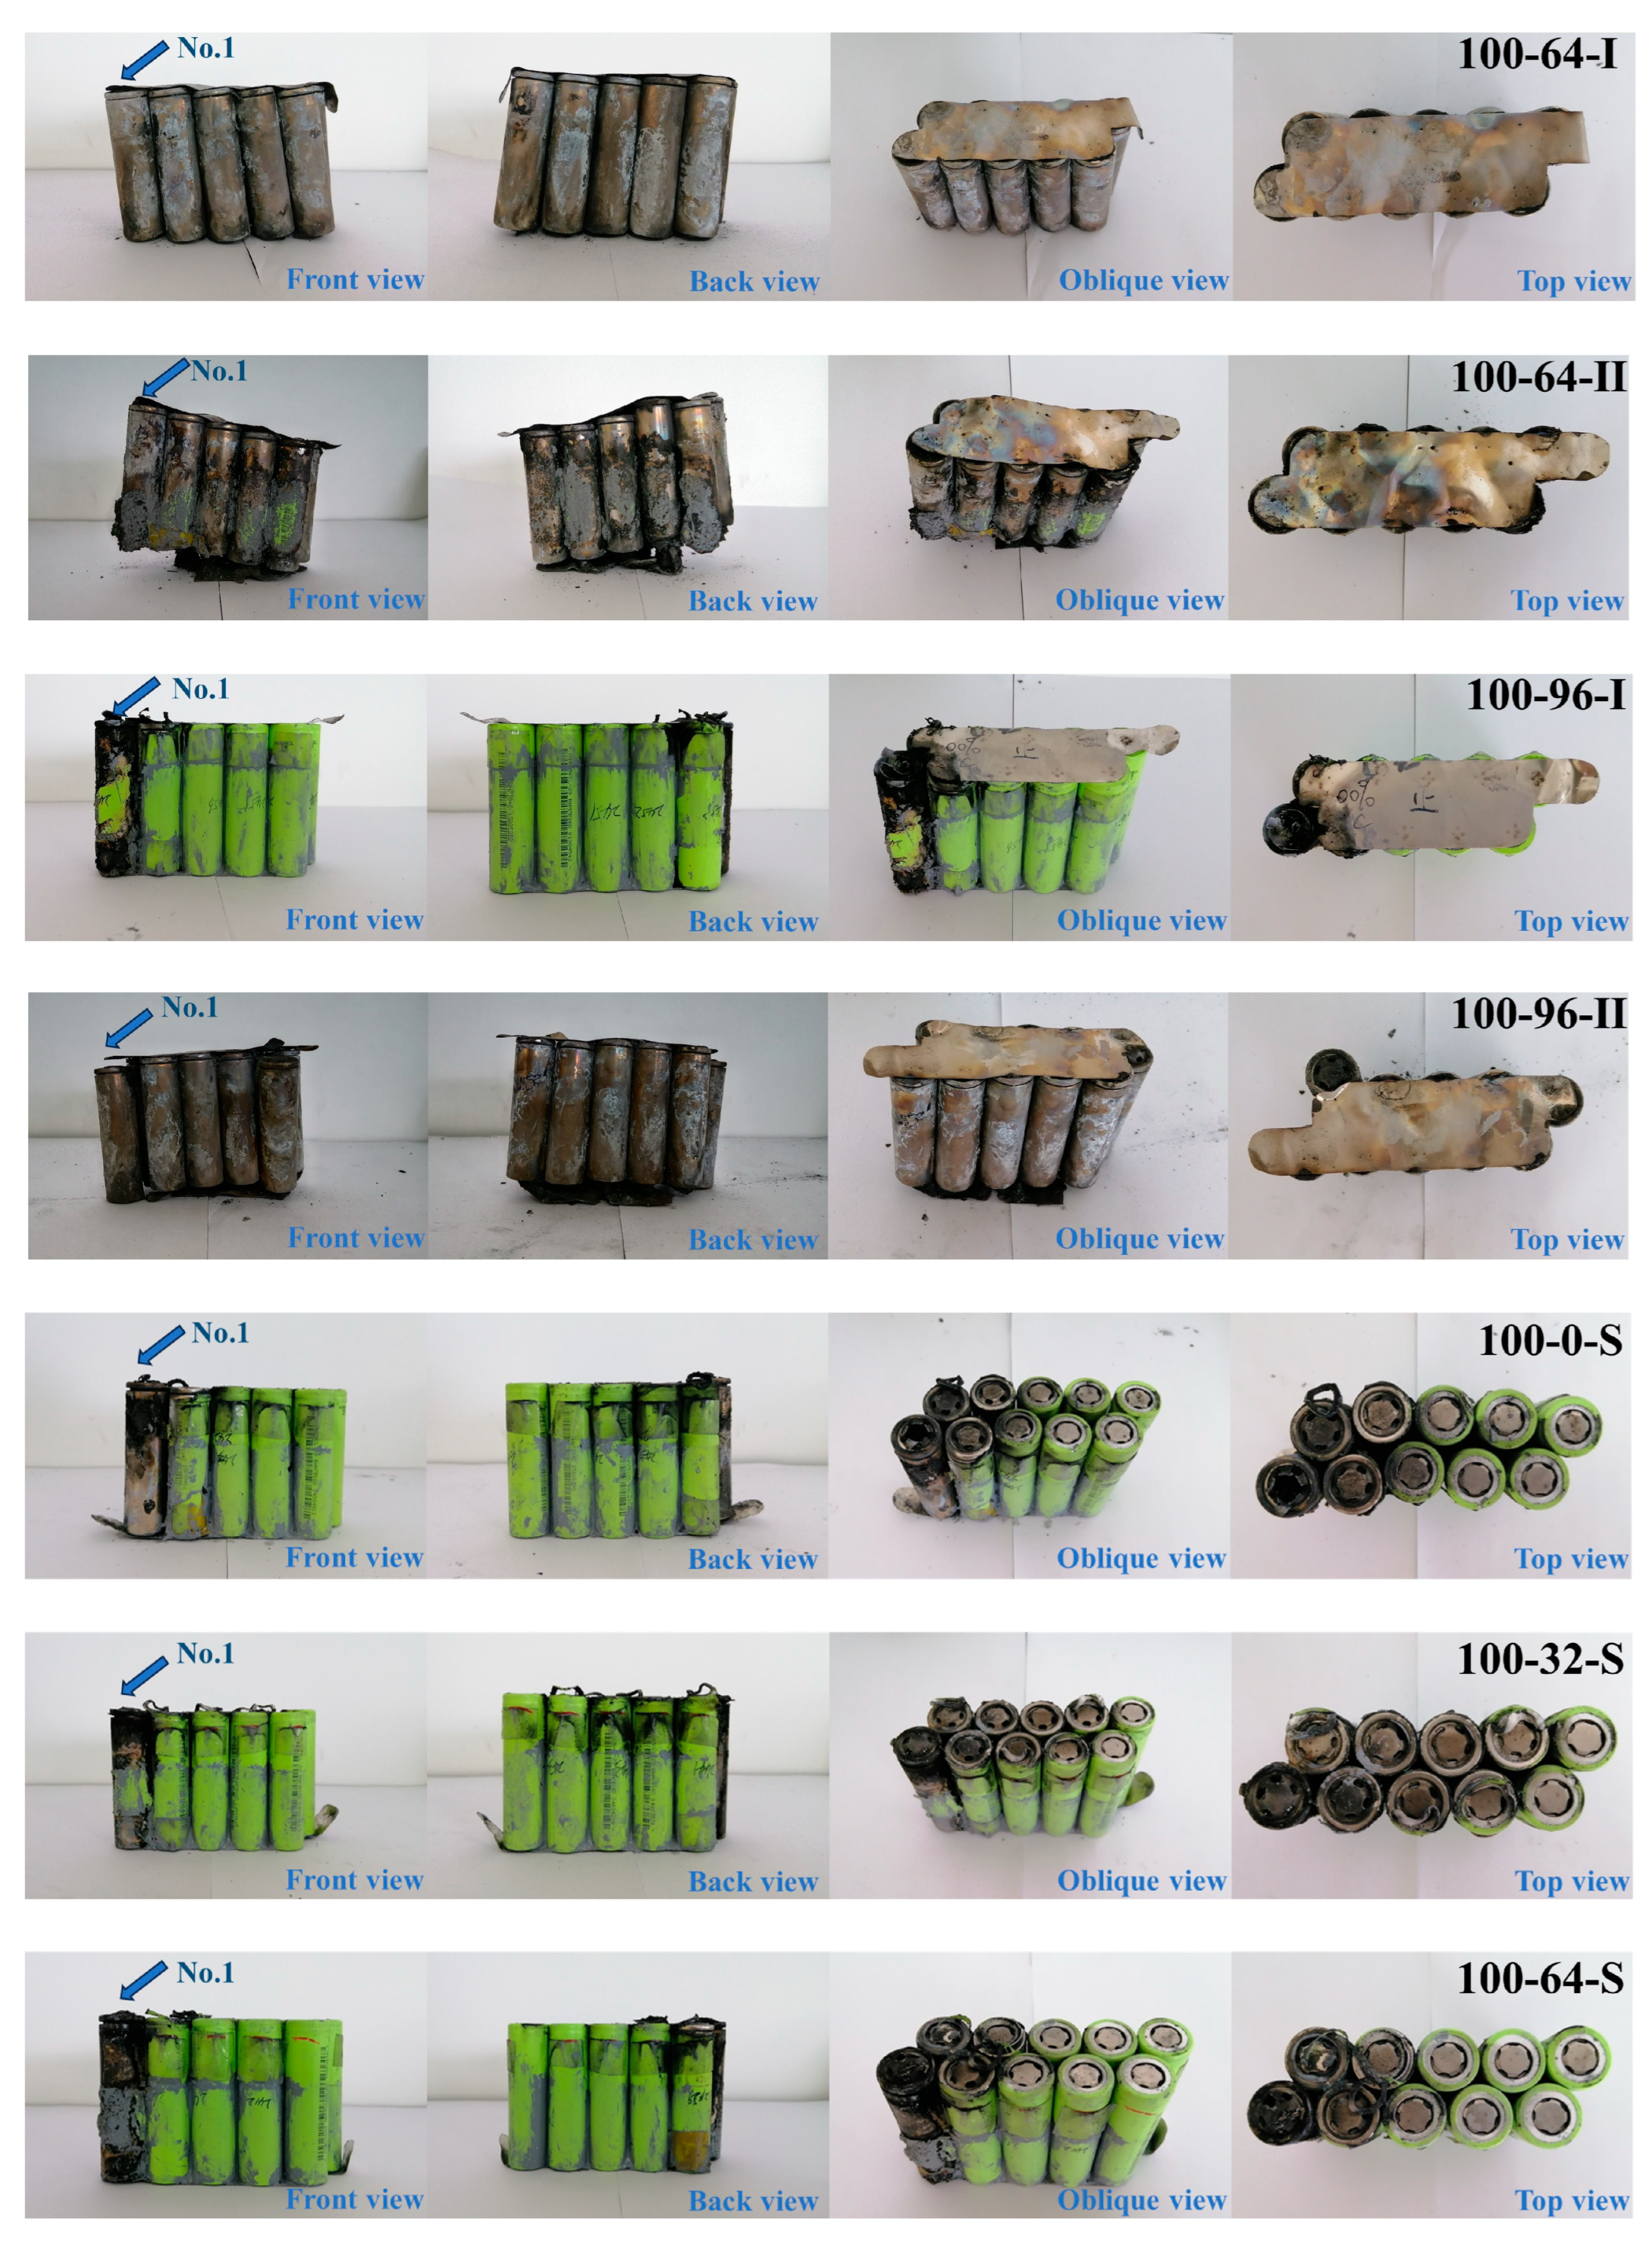
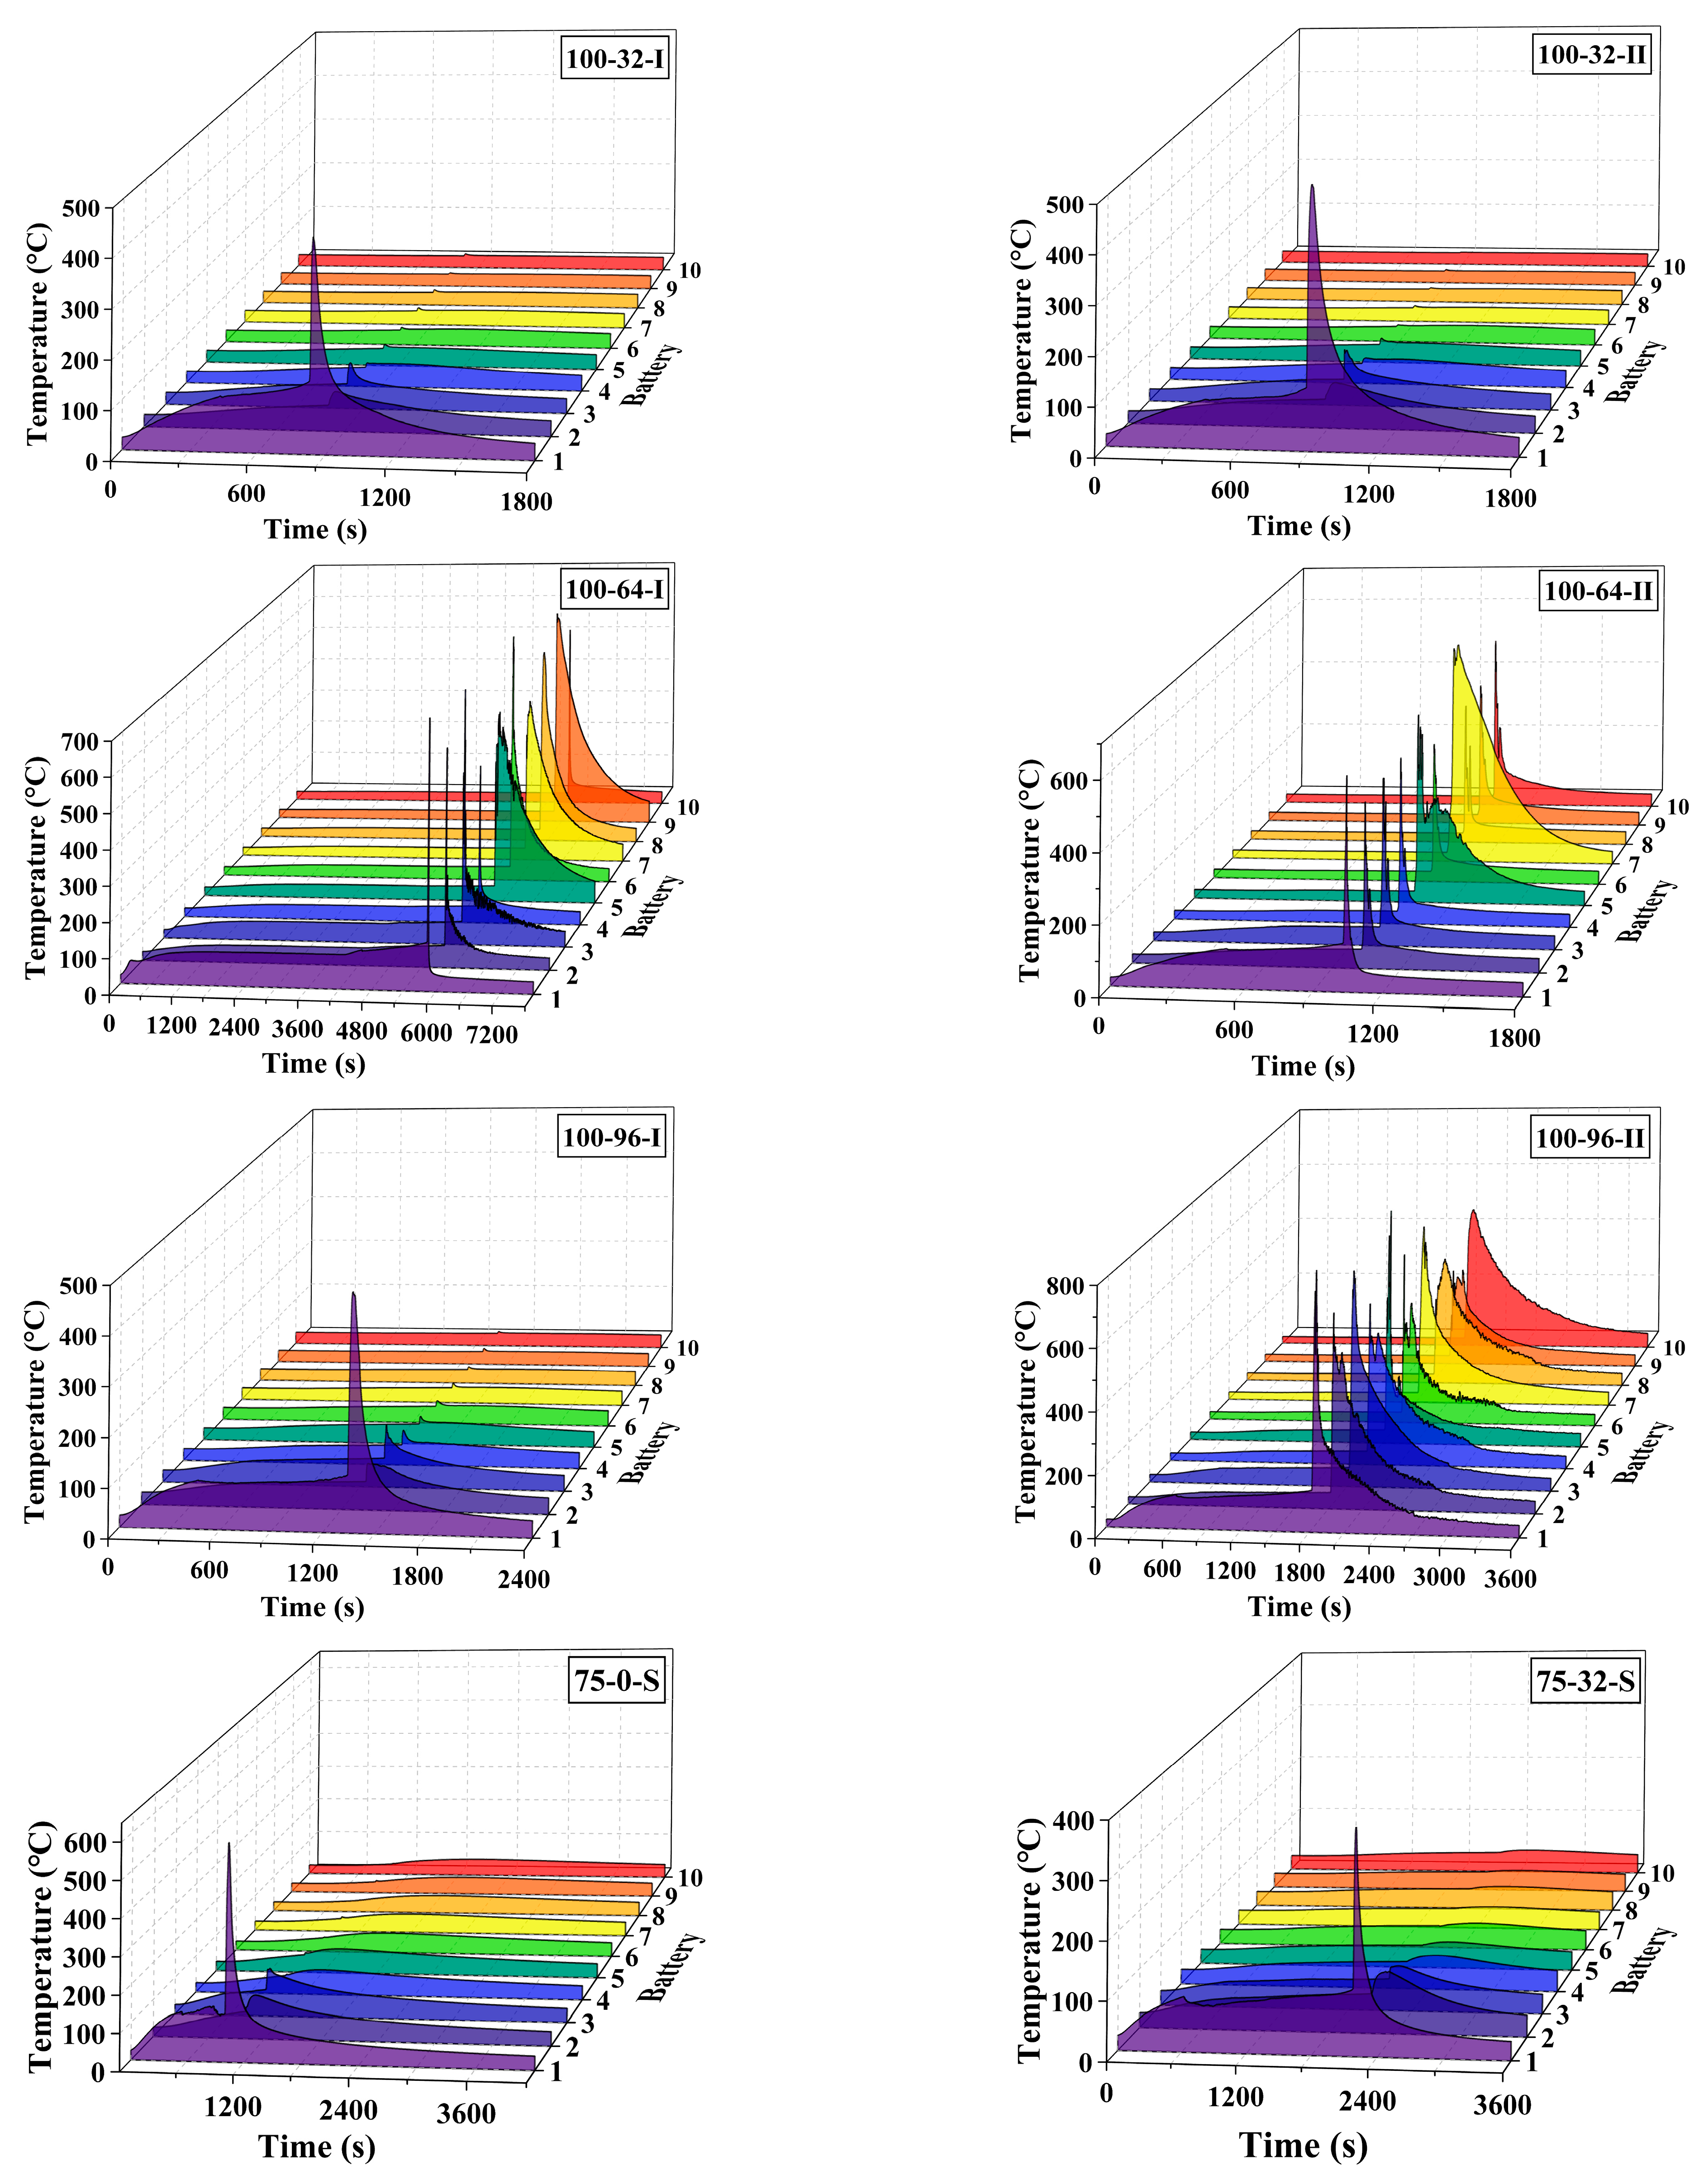
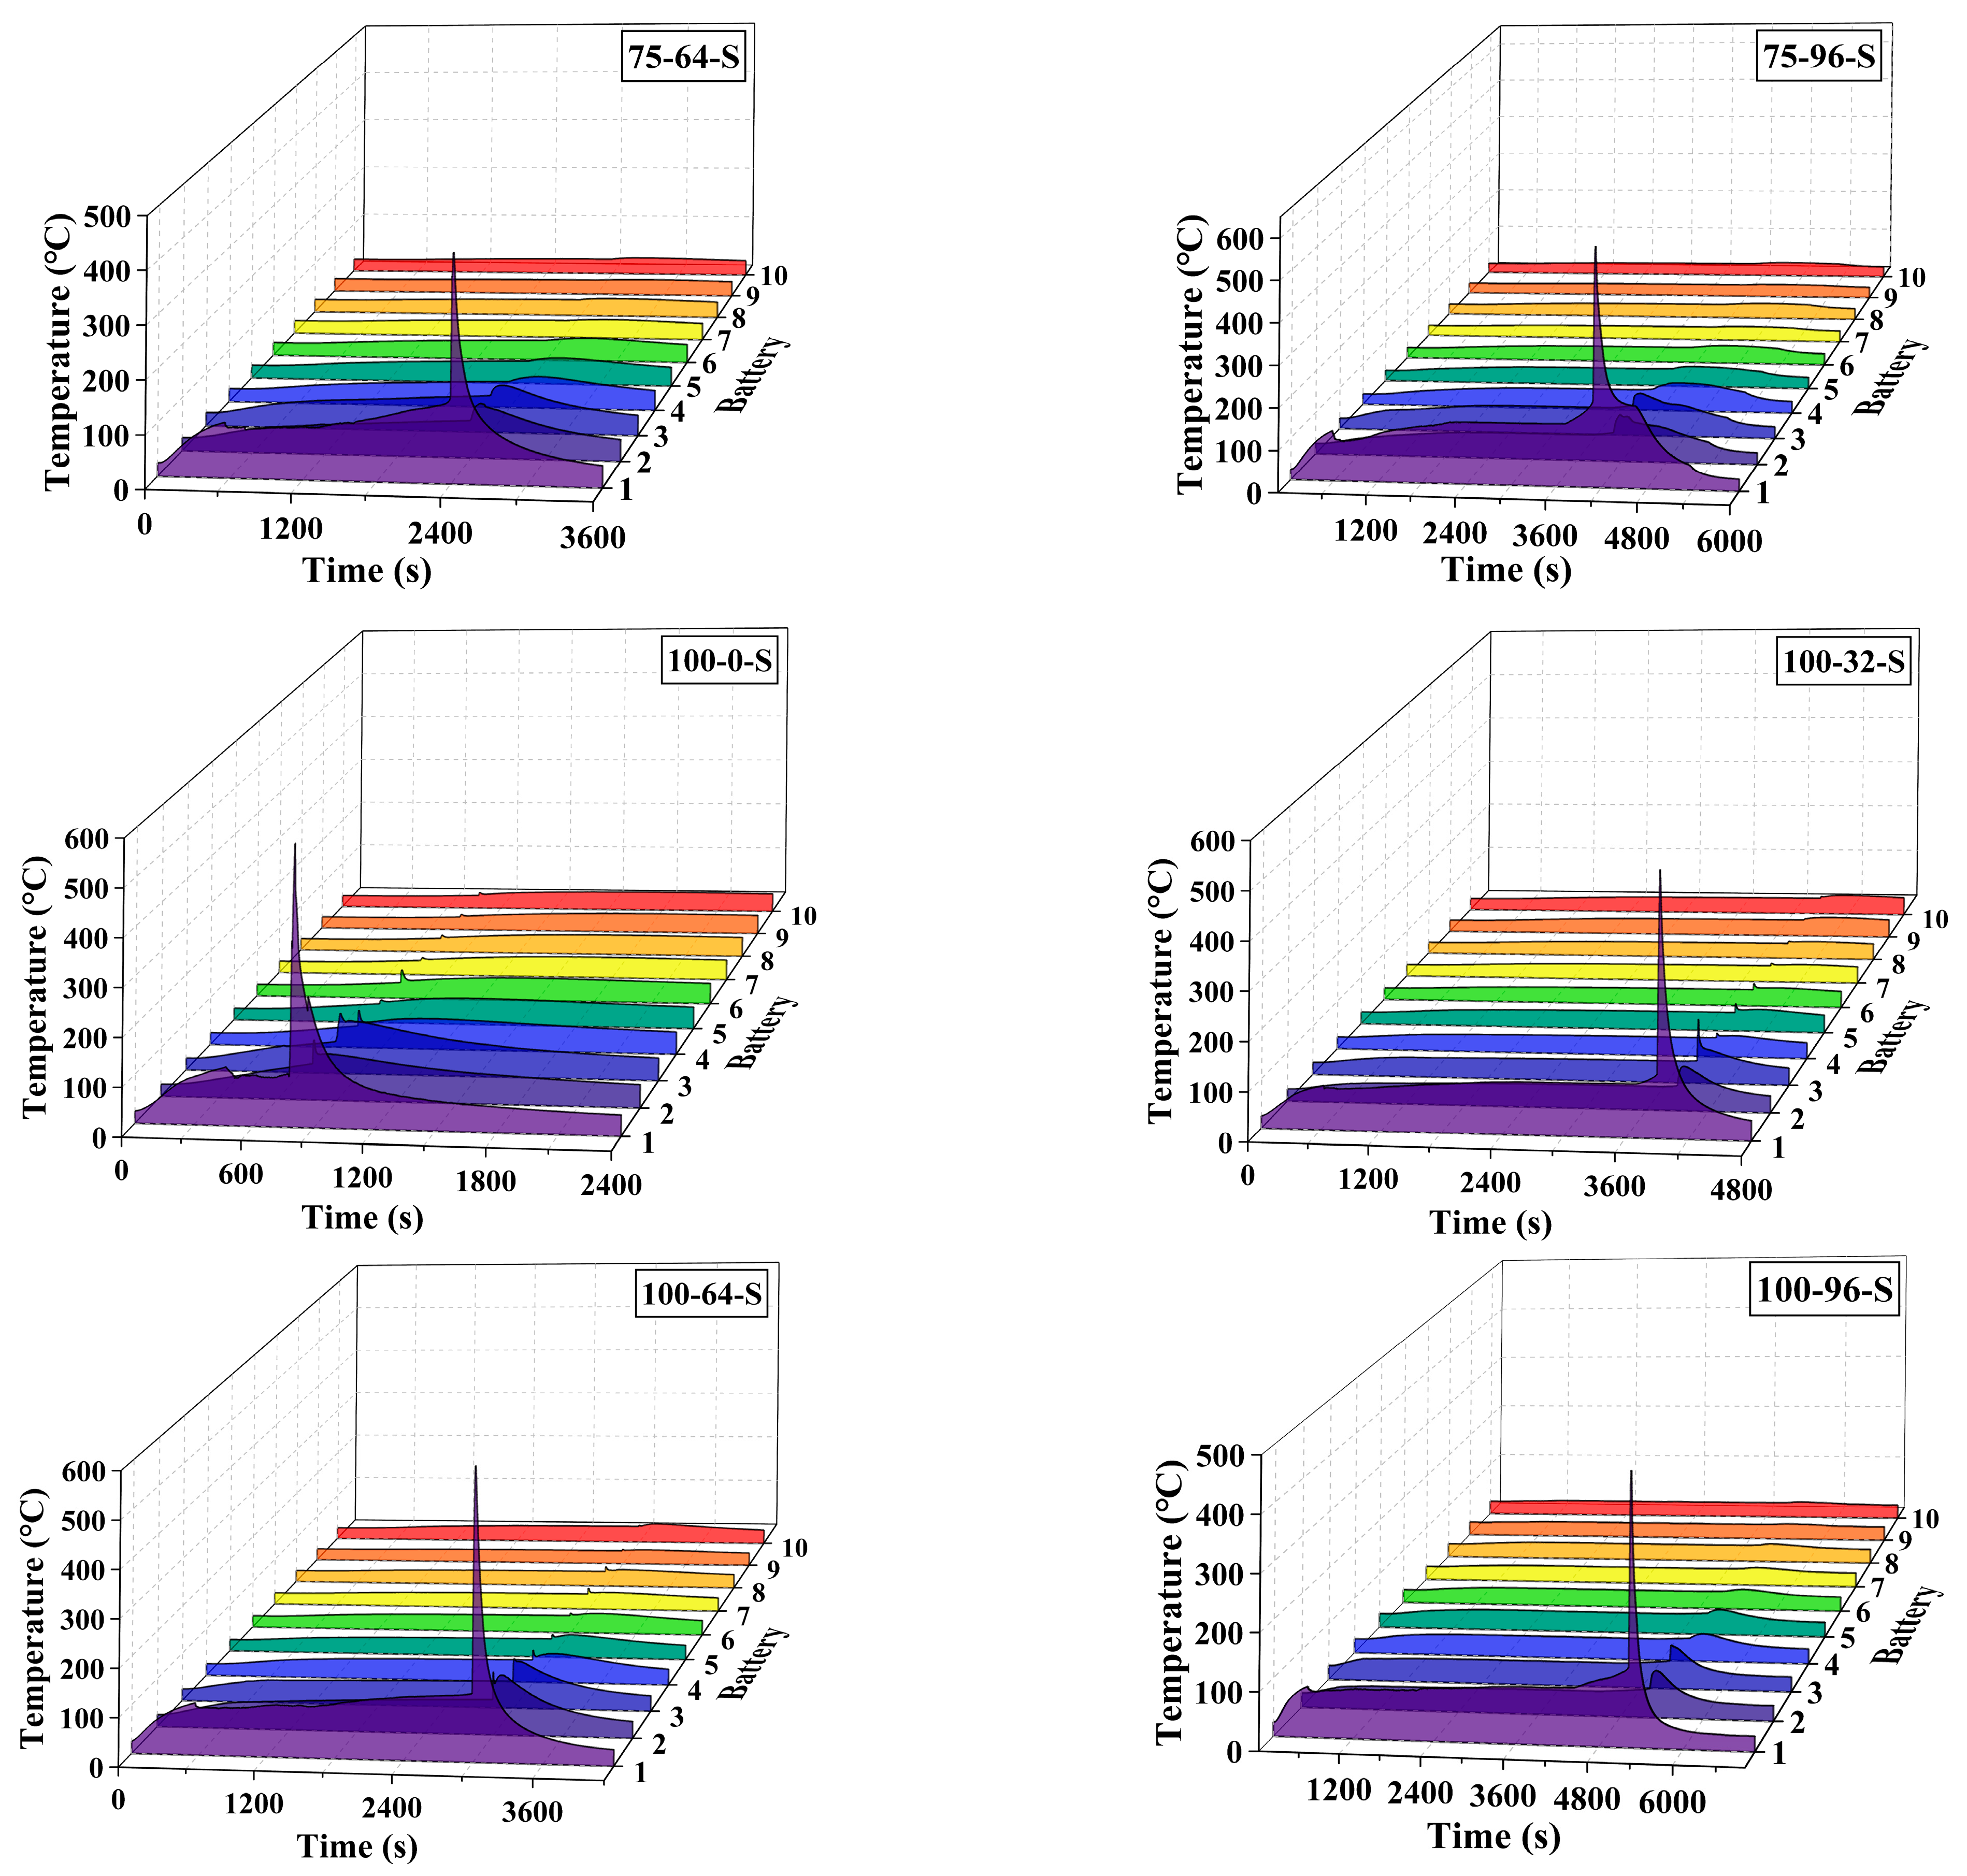
3.1. General Results

The number of batteries that experienced TR in each test based on different SOC values, coolant flow rates and sleeve applications are given in Table 2. A total of 30 tests are presented in this paper, with 12 of them (for 75% SOC) taken from a previous study [20]. For the battery pack without the sleeve, two tests are conducted under the same SOC and coolant flow rate. As noted in Table 2, all the tests present at least one battery (No. 1) TR, except for tests 50-32-I and 50-64-I, whose No. 1 batteries are not successfully brought to TR by the electric heater. Some tests present more than one TR battery, indicating TR propagation from the No. 1 battery to the other batteries in the pack.
As previously stated by Ke et al. [20], based on their test results for 75% SOC, the leading mechanism yielding TR propagation is the rapid heat diffusion caused by the sideways spreading electrolyte ejected from the TR battery; this heat transfer mechanism was effectively removed by the sleeve covering the battery pack. This finding was verified by the test results for 100% SOC in the present study. No TR propagation is observed for various flow rates for the tests with the sleeve, even when the BTMS is not running (coolant flow rate of 0 L/h). On the contrary, TR propagation easily occurs for the battery pack without the sleeve.
Figure 4 depicts the physical appearance of battery packs at the end of the tests, except for the ones lost during tests 50-64-I, 50-64-II and 100-96-S, and those of 75% SOC, which have been previously presented in [20]. The TR battery undergoes a sharp increase in temperature, electrolyte ejection at the positive end, and even a fire. As a result, the polyvinyl chloride (PVC) wrapper melts and almost disappears, exposing the steel shell of the battery with the damaged positive end, indicating the occurrence of TR. For example, all the batteries in test 50-0-I undergo TR and completely lose their green PVC wrappers, indicating severe damage due to burning. The batteries in test 100-0-II show similar physical appearances, and the damaged positive end of the No. 1 battery is observed. For test 50-0-I, only the steel shell of the No. 1 battery is exposed, while the others retain their green PVC wrappers, coincident with the fact that no TR propagation occurs. In addition, although different ejection powers and flame strengths were observed as the SOC varied during the test, the TR batteries observed after the test showed no apparent physical differences.
Figure 5 depicts battery temperature variations in the 30 tests as listed in Table 2. In general, three distinct stages of temperature variations were observed for the TR batteries. However, there are two different patterns distinguished in stage II, as illustrated in Figure 6. In stage I, the temperature rises gradually to the critical values (163 °C and 182 °C, respectively) because of external heating. It is noted that the slight decrease in temperature at 439 s and 760 s was caused by slight electrolyte ejection from the safety valve caused by the battery self-protection. TR occurs in stage II, and the temperature suddenly rises to the peak value over several seconds, indicating rapid self-reaction inside the battery. The dramatic fluctuation in temperature during this stage can be observed in Figure 6b, which differs from the monotonic variation in Figure 6a. It is caused by the counterbalance between cooling by the electrolyte ejection and self-heating by the reaction of the remaining chemicals. In stage III, the batteries are eventually cooled down to the ambient temperature as the BTMS keeps running.
Some anomalous temperature variations observed in Figure 5 are explained as follows: First, the multi-step in stage I of tests 50-32-I and 50-64-I is due to the adjustment of the power of the electric heater. During tests 50-32-I and 50-64-I, the electric heating power is increased to 110 W after more than one hour (3600 s) of heating at 70 W to trigger the TR of the No. 1 battery. However, no TR occurs, although the electric heating power eventually increases to 130 W (the maximum value available) and remains stable for some time, while the temperature of the No. 1 battery finally rises to 131 °C (test 50-32-I) and 225 °C (test 50-64-I). Second, in stage III, the dramatic drop in No. 1 batteries in tests 100-0-II and 100-64-I, etc., is most likely due to the thermocouples getting detached from the batteries.

3.2. Effect of the Coolant Flow Rate and SOC

In the previous study [20], which only examined batteries with 75% SOC, it was concluded that the correlation between TR rate and coolant flow rate is weak, while effective prevention of TR propagation was achieved at the relatively high coolant flow rate of 96 L/h. However, as seen in Table 2, when the SOC increases to 100%, TR propagation still occurs during test 100-96-II, although the coolant flow rate is 96 L/h. Nevertheless, for the lower SOC (50%), no TR propagation is observed when the coolant flow rate is 32 L/h or 64 L/h, and the No. 1 battery TR is not even successfully triggered by the persistent external heating in tests 50-32-I and 50-64-I, during which the heating power increases from 70 W to 110 W and then to 130 W. Therefore, the test conducted at 96 L/h is not necessarily performed for 50% SOC because of the supposition of similar results as those of 32 L/h and 64 L/h. Once the BTMS stops running (0 L/h), complete TR propagation (10 TR batteries) occurs in the two tests with 100% SOC without sleeve compared to TR batteries with SOC = 50% and 100%. This demonstrates that the retarding effects of the BTMS on TR propagation also depend on the battery SOC values; higher SOC increases the difficulty of TR propagation prevention by BTMS. Although the number of TR batteries is almost randomly associated with coolant flow rate and SOC, a lower TR rate is generally obtained for larger coolant flow rates and lower SOC values.
The temperature variations in the No. 1 batteries before TR occurrence during the 22 tests without the sleeve application are depicted in Figure 7 and Figure 8 in terms of the SOC and coolant flow rate, respectively. The retarding effect of the liquid-cooling BTMS on the TR occurrence of batteries with various SOC values can be observed in Figure 7. In spite of the particular deviations due to the battery properties, a larger coolant flow rate generally results in a slow temperature increase and delayed TR occurrence for different SOC values. However, the delaying effect strongly depends on the SOC value. For example, when the SOC is 75%, there is a considerable period during which the temperature remains unchanged under a coolant flow rate of 96 L/h. When the SOC increases to 100%, the constant-temperature period disappears and the TR occurs much earlier. When the SOC is relatively small (50%), the constant temperature period can also be reached at coolant flow rates of 32 L/h and 64 L/h. The impact of SOC on the rate of temperature increase and TR occurrence time are further illustrated in Figure 8. When the coolant flow rate and electric heating power are fixed, faster increases in temperature and earlier TR occurrence in the No. 1 battery are mostly observed for larger SOC values.
Figure 9 depicts the critical temperatures and times of TR occurrence (at the end of stage I) for the tests that undergo complete TR propagation in the pack (all 10 batteries undergo the TR). The sequential propagation from the No. 1 to the No. 10 batteries can be observed. The time intervals of TR occurrence between adjacent batteries vary from seconds to minutes. In addition, the observed critical temperatures of some batteries, in particular those placed downstream, are abnormally low, even below 30 °C. These abnormally low critical temperatures are mostly observed for the downstream batteries whose TR occurs immediately (within several seconds) after the upstream ones. When the critical time interval is increased to minutes, the observed critical temperature for the downstream batteries also increases. For instance, in test 75-0-I, the critical time interval between the No. 3 and No. 4 batteries is about 180 s, and the critical temperature for the No. 4 battery rebounds to 138 °C compared to 84 °C for the No. 3 battery. As previously stated in [20], the thermocouples point-positioned on the battery surface did not get the correct temperature values for the downstream batteries when the TR occurred due to the extremely rapid TR propagation caused by the sideways spreading of the ejected electrolyte.
From Figure 9, it is also noted that during all the tests conducted at 100% SOC (tests 100-0-I, 100-64-II and 100-96-II), the battery packs undergo complete TR propagation within only a few seconds, with almost negligible time intervals in TR occurrence between adjacent batteries, indicating extremely high TR propagation rates in batteries with 100% SOC; however, for batteries with 50% or 75% SOC, it took a relatively longer time (around 3–5 min) to complete the TR propagation, during which the large time intervals in TR occurrence could be observed, except for test 75-64-II, which had a similar TR propagation rate as those with 100% SOC. All these indicate that the TR propagation rate in batteries is associated with the SOC values of the batteries, and higher SOC could result in more rapid TR propagation. This correlation between TR propagation rate and SOC value is probably caused by the different behaviors of electrolyte ejection from TR batteries with various SOC values; the battery with higher SOC may not only release more powerful ejection but may also be more prone to being triggered to TR. Therefore, faster TR propagation could be observed for batteries with 100% SOC compared to batteries with 75% or 50% SOC.
Figure 10 and Figure 11 depict the maximum temperature of the TR batteries during the 22 tests without the sleeve application, in terms of the SOC and coolant flow rate, respectively. It is shown that the maximum temperature of the TR batteries is almost independent of the coolant flow rate and the SOC value. However, a very weak correlation can be observed between the maximum temperature and the battery number, irrespective of the randomness in some particular batteries. The temperature curves in Figure 10 and Figure 11 slightly decline with the battery number, showing that the downstream batteries generally have lower maximum temperatures compared with the upstream ones. During stage I, before TR occurrence (pre-TR stage), the upstream batteries are externally heated for a longer duration and reach a higher temperature compared to the downstream ones. Therefore, it is speculated that the maximum temperature during the TR process is partially correlated with the external heating duration and the pre-TR stage temperature of the battery.

4. Conclusions

The TR propagation behavior in the battery pack consisting of 10 18650-type LIBs applied with the serpentine channel liquid-cooling BTMS is experimentally investigated, and the effects of battery SOC (50%, 75% and 100%) and coolant flow rate (0 L/h, 32 L/h, 64 L/h and 96 L/h) is comprehensively examined. The main findings are summarized as follows:
(1)
The retarding effect of BTMS on TR propagation in LIBs depends on the coolant flow rate as well as the battery SOC value; higher SOC increases the difficulty of TR propagation prevention by BTMS. Lower SOC values and higher coolant flow rates generally result in delayed TR occurrence in No.1 batteries and fewer TR batteries in the pack during the tests.
(2)
The TR propagation rate, indicated by the time intervals in TR occurrence between adjacent batteries is associated with the battery SOC value; higher SOC values lead to more rapid TR propagation in the pack. The batteries with 100% SOC show extremely rapid TR propagation, which is completed in only a few seconds compared to several minutes for batteries with 50% SOC and 75% SOC.
(3)
The maximum temperature of the TR battery partially depends on the battery position in the pack, rather than the battery SOC value and coolant flow rate. The upstream batteries generally show a slightly higher maximum temperature during the TR process compared to the downstream ones. Therefore, a weak correlation between the maximum temperature during the TR process and the external heating duration as well as the pre-TR stage temperature of the battery can be speculated.

Author Contributions

W.W.: Experiments, Literature search, Visualization, Writing—original draft; Q.K.: Experiments, Literature search, Visualization, Analysis; J.G.: Experiments, Literature search, Visualization, Methodology, Writing—original draft; Y.W.: Methodology, Assistance with experiments; Y.Q.: Visualization, Analysis; J.C.: Visualization, Analysis; F.J.: Conceptualization, Supervision, Resources, Writing—review and editing, Funding acquisition. All authors have read and agreed to the published version of the manuscript.

Funding

This research was funded by the Guangzhou Science and Technology Plan Project (No.202201010418) and China Southern Power Grid science and technology Project (090000KK52210140).

Data Availability Statement

Data are contained within the article.

Conflicts of Interest

The authors declare no conflict of interest.

References

  1. Hannan, M.A.; Lipu, M.S.H.; Hussain, A.; Mohamed, A. A review of lithium-ion battery state of charge estimation and management system in electric vehicle applications: Challenges and recommendations. Renew. Sustain. Energy Rev. 2017, 78, 834–854. [Google Scholar] [CrossRef]
  2. Wang, Y.; Zhang, X.; Chen, Z. Low temperature preheating techniques for Lithium-ion batteries: Recent advances and future challenges. Appl. Energy 2022, 313, 118832. [Google Scholar] [CrossRef]
  3. Zhang, X.; Sun, Q.; Zhen, C.; Niu, Y.; Han, Y.; Zeng, G.; Chen, D.; Feng, C.; Chen, N.; Lv, W.; et al. Recent progress in flame-retardant separators for safe lithium-ion batteries. Energy Storage Mater. 2021, 37, 628–647. [Google Scholar] [CrossRef]
  4. Li, Z.; Kong, Q.; Tian, H.; Cai, Y.; Su, Z. Interaction of superionic conductor and heterostructure LiVOPO4-Li2.72Ti2(PO4)3 cathode materials for lithium-ion batteries. Mater. Lett. 2023, 335, 133824. [Google Scholar] [CrossRef]
  5. Chen, L.; Fan, X.; Hu, E.; Ji, X.; Chen, J.; Hou, S.; Deng, T.; Li, J.; Su, D.; Yang, X.; et al. Achieving High Energy Density through Increasing the Output Voltage: A Highly Reversible 5.3 V Battery. Chem-Us 2019, 5, 896–912. [Google Scholar] [CrossRef]
  6. Yan, P.; Zhu, Y.; Pan, X.; Ji, H. A novel flame-retardant electrolyte additive for safer lithium-ion batteries. Int. J. Energy Res. 2021, 45, 2776–2784. [Google Scholar] [CrossRef]
  7. Xu, J.; Duan, Q.; Zhang, L.; Liu, Y.; Sun, J.; Wang, Q. The enhanced cooling effect of water mist with additives on inhibiting lithium ion battery thermal runaway. J. Loss Prevent. Proc. 2022, 77, 104784. [Google Scholar] [CrossRef]
  8. Hu, J.; Liu, T.; Wang, X.; Wang, Z.; Wu, L. Investigation on thermal runaway of 18,650 lithium ion battery under thermal abuse coupled with charging. J. Energy Storage 2022, 51, 104482. [Google Scholar] [CrossRef]
  9. Feng, X.; He, X.; Ouyang, M.; Lu, L.; Wu, P.; Kulp, C.; Prasser, S. Thermal runaway propagation model for designing a safer battery pack with 25 Ah LiNixCoyMnzO2 large format lithium ion battery. Appl. Energy 2015, 154, 74–91. [Google Scholar] [CrossRef]
  10. Wen, J.; Yu, Y.; Chen, C. A Review on Lithium-Ion Batteries Safety Issues: Existing Problems and Possible Solutions. Mater. Express 2012, 2, 197–212. [Google Scholar] [CrossRef]
  11. We Feng, X.; Ouyang, M.; Liu, X.; Lu, L.; Xia, Y.; He, X. Thermal runaway mechanism of lithium ion battery for electric vehicles: A review. Energy Storage Mater. 2018, 10, 246–267. [Google Scholar] [CrossRef]
  12. Chen, Y.; Kang, Y.; Zhao, Y.; Wang, L.; Liu, J.; Li, Y.; Liang, Z.; He, X.; Li, X.; Tavajohi, N.; et al. A review of lithium-ion battery safety concerns: The issues, strategies, and testing standards. J. Energy Chem. 2021, 59, 83–99. [Google Scholar] [CrossRef]
  13. Kong, D.; Wang, G.; Ping, P.; Wen, J. Numerical investigation of thermal runaway behavior of lithium-ion batteries with different battery materials and heating conditions. Appl. Therm. Eng. 2021, 189, 116661. [Google Scholar] [CrossRef]
  14. Qiu, Y.; Jiang, F. A review on passive and active strategies of enhancing the safety of lithium-ion batteries. Int. J. Heat Mass Transf. 2022, 184, 122288. [Google Scholar] [CrossRef]
  15. Jiang, Z.; Qu, Z. Lithium-ion battery thermal management using heat pipe and phase change material during discharge-charge cycle: A comprehensive numerical study. Appl. Energy 2019, 242, 378–392. [Google Scholar] [CrossRef]
  16. Rao, Z.; Qian, Z.; Kuang, Y.; Li, Y. Thermal performance of liquid cooling based thermal management system for cylindrical lithium-ion battery module with variable contact surface. Appl. Therm. Eng. 2017, 123, 1514–1522. [Google Scholar] [CrossRef]
  17. Greco, A.; Jiang, X.; Cao, D. An investigation of lithium-ion battery thermal management using paraffin/porous-graphite-matrix composite. J. Power Sources 2015, 278, 50–68. [Google Scholar] [CrossRef]
  18. Wu, W.; Wang, S.; Wu, W.; Chen, K.; Hong, S.; Lai, Y. A critical review of battery thermal performance and liquid based battery thermal management. Energy Convers. Manag. 2019, 182, 262–281. [Google Scholar] [CrossRef]
  19. Liu, H.; Wei, Z.; He, W.; Zhao, J. Thermal issues about Li-ion batteries and recent progress in battery thermal management systems: A review. Energy Convers. Manag. 2017, 150, 304–330. [Google Scholar] [CrossRef]
  20. Ke, Q.; Li, X.; Guo, J.; Cao, W.; Wang, Y.; Jiang, F. The retarding effect of liquid-cooling thermal management on thermal runaway propagation in lithium-ion batteries. J. Energy Storage 2022, 48, 104063. [Google Scholar] [CrossRef]
  21. Liu, Y.; Niu, H.; Liu, J.; Huang, X. Layer-to-layer thermal runaway propagation of open-circuit cylindrical li-ion batteries: Effect of ambient pressure. J. Energy Storage 2022, 55, 105709. [Google Scholar] [CrossRef]
  22. Wang, Z.; He, T.; Bian, H.; Jiang, F.; Yang, Y. Characteristics of and factors influencing thermal runaway propagation in lithium-ion battery packs. J. Energy Storage 2021, 41, 102956. [Google Scholar] [CrossRef]
  23. Fang, J.; Cai, J.; He, X. Experimental study on the vertical thermal runaway propagation in cylindrical Lithium-ion batteries: Effects of spacing and state of charge. Appl. Therm. Eng. 2021, 197, 117399. [Google Scholar] [CrossRef]
  24. Li, H.; Duan, Q.; Zhao, C.; Huang, Z.; Wang, Q. Experimental investigation on the thermal runaway and its propagation in the large format battery module with Li(Ni1/3Co1/3Mn1/3)O-2 as cathode. J. Hazard Mater. 2019, 375, 241–254. [Google Scholar] [CrossRef]
  25. Zhu, M.; Zhang, S.; Chen, Y.; Zhao, L.; Chen, M. Experimental and analytical investigation on the thermal runaway propagation characteristics of lithium-ion battery module with NCM pouch cells under various state of charge and spacing. J. Energy Storage 2023, 72, 108380. [Google Scholar] [CrossRef]
  26. Cao, W.; Zhao, C.; Wang, Y.; Dong, T.; Jiang, F. Thermal modeling of full-size-scale cylindrical battery pack cooled by channeled liquid flow. Int. J. Heat Mass Transf. 2019, 138, 1178–1187. [Google Scholar] [CrossRef]
  27. US DOE. FreedomCAR Battery Test Manual for Power-Assist Hybrid Electric Vehicles: DOE/ID-11069; US Department of Energy: Washington, DC, USA, 2013.
Figure 1. Schematic of the battery module with serpentine cooling channel, electric heater and thermocouples. Reprinted with permission from [20]. Copyright 2022, Elsevier.
Batteries 09 00552 g001
Figure 2. Schematic of the battery pack with (a) the nickel-sheet current connector, (b) the ejection isolation aluminum sleeve, and (c) the structure of the sleeve. Reprinted with permission from [20]. Copyright 2022, Elsevier.
Batteries 09 00552 g002
Figure 3. Schematic diagram of the experimental system. Reprinted with permission from [20]. Copyright 2022, Elsevier.
Batteries 09 00552 g003
Figure 4. Physical appearances of the battery packs after the tests.
Batteries 09 00552 g004aBatteries 09 00552 g004b
Figure 5. Individual battery temperature variations over time for the 30 different tests.
Batteries 09 00552 g005aBatteries 09 00552 g005bBatteries 09 00552 g005cBatteries 09 00552 g005d
Figure 6. Battery temperature variations over time for (a) the No. 1 battery in test 75-0-II, and (b) the No. 1 battery in test 50-0-I.
Batteries 09 00552 g006
Figure 7. Temperature variations in No. 1 batteries with SOC values of (a) 50%, (b) 75% and (c) 100% without the sleeve application before TR occurrence.
Batteries 09 00552 g007
Figure 8. Temperature variations in No. 1 batteries with coolant flow rates of (a) 0 L/h, (b) 32 L/h, (c) 64 L/h and (d) 96 L/h without the sleeve application before TR occurrence.
Batteries 09 00552 g008
Figure 9. Critical temperatures and times of occurrence of TR for tests that undergo complete TR propagation (10 TR batteries in the pack). (a) Time scales of electric heating, (b) time scales of TR in No. 1 batteries. The numbers in the boxes denote the battery numbers.
Batteries 09 00552 g009
Figure 10. The maximum temperatures of TR batteries with SOC values of (a) 50%, (b) 75% and (c) 100% without the sleeve application.
Batteries 09 00552 g010
Figure 11. The maximum temperatures of TR batteries with coolant flow rates of (a) 0 L/h, (b) 32 L/h, (c) 64 L/h and (d) 96 L/h without the sleeve application.
Batteries 09 00552 g011aBatteries 09 00552 g011b
Table 1. Specifications of the tested batteries. Reprinted with permission from [20]. Copyright 2022, Elsevier.
ParametersValues
Type18650
Electrode materialAnode: graphite; Cathode: NCA
Voltage range3.0–4.2 V
Rated capacity2.75 Ah
Nominal voltage3.6 V
Energy density170 Wh/L
Mass49 g
Specific heat1098.2 J/(kg·K)
Thermal conductivity2.586 W/(m·K)
Table 2. General results of the TR tests.
SOCFlow Rate (L/h)Without SleeveWith Sleeve
50%0(50-0-I) *: 10 **(50-0-II): 2
32(50-32-I): 0(50-32-II): 1
64(50-64-I): 0(50-64-II): 1
75%0(75-0-I): 10(75-0-II): 1(75-0-S): 1
32(75-32-I): 1(75-32-II): 10(75-32-S): 1
64(75-64-I): 3(75-64-II): 10(75-64-S): 1
96(75-96-I): 1(75-96-II): 1(75-96-S): 1
100%0(100-0-I): 10(100-0-II): 10(100-0-S): 1
32(100-32-I): 1(100-32-II): 1(100-32-S): 1
64(100-64-I): 10(100-64-II): 10(100-64-S): 1
96(100-96-I): 1(100-96-II): 10(100-96-S): 1
* The test number denotes information on SOC (50) and flow rate (0); the Roman numerals (I and II) tell apart the two tests performed under the same SOC and coolant flow rate; the letter S indicates the tests with sleeves. ** The number of TR batteries discovered in the test.
Disclaimer/Publisher’s Note: The statements, opinions and data contained in all publications are solely those of the individual author(s) and contributor(s) and not of MDPI and/or the editor(s). MDPI and/or the editor(s) disclaim responsibility for any injury to people or property resulting from any ideas, methods, instructions or products referred to in the content.

