Article

Selective Precipitation of Rare Earth Double Sulfate Salts from Industrial Ni–MH Battery Leachates: Impact of Downstream Processing on Product Quality

1
Laboratoire de Génie Chimique, Université de Toulouse, CNRS, INP, UPS, Toulouse, France
2
CIRIMAT, Université de Toulouse, UPS, CNRS, INP, Toulouse, France
3
Société Nouvelle d’Affinage des Métaux (SNAM Groupe), Viviez, France
*
Author to whom correspondence should be addressed.
Batteries 2023, 9(12), 574; https://doi.org/10.3390/batteries9120574
Submission received: 25 October 2023 / Revised: 17 November 2023 / Accepted: 24 November 2023 / Published: 28 November 2023
(This article belongs to the Section Battery Processing, Manufacturing and Recycling)

Abstract

:
This work focuses on the recovery of rare earth elements (REEs = La, Ce, Nd, Pr) from spent nickel–metal hydride batteries by hydrometallurgical processing. The REEs were precipitated in the form of sodium-lanthanide double sulfate salts by adding Na2SO4 to a leach liquor prepared from industrially processed spent batteries. The objectives were to better understand the parameters driving the purity of the product and to identify the phases involved, as well as their crystallographic structure. The methodology included experiments performed in a 2 L reactor, thermodynamic calculations and product characterization. We confirmed that high REE precipitation yields (>95%) can be achieved under a wide range of hydrodynamic conditions. Furthermore, we demonstrated and quantified how appropriately washing the product allows for a significant reduction in nickel losses while maintaining control over REE product purity. Finally, using X-ray Diffraction analyses, it was established that REEs form a solid solution with a chemical formula (Na0.9K0.1)(La0.65Ce0.24Pr0.04Nd0.07)(SO4)2·H2O, which has not been reported so far.

1. Introduction

Nickel–metal hydride (Ni–MH) batteries have been used since the early 1990s as a replacement for hazardous Ni–Cd batteries and have found wide integration in hybrid-electric vehicles produced at the beginning of the 21st century [1,2,3]. These batteries consist of five main parts: a steel casing, a KOH electrolyte that is contained in a gas-permeable polymer separator, a cathode whose active mass is made of spherical β-Ni(OH)2 particles deposited on a nickel plate, and an anode made of metal hydride particles deposited on nickel-plated steel [4,5,6,7,8]. Mixtures of rare-earth elements (REEs) and other transition metals are widely used as active anode materials in commercial Ni–MH batteries [1].
In 2014, Ni–MH batteries were used in all hybrid-electric vehicles. However, the adoption of lighter and smaller lithium–ion batteries quickly replaced Ni–MH batteries [4]. As a result, considerable quantities of spent Ni–MH batteries are currently being discarded and becoming hazardous waste. Meanwhile, spent Ni–MH batteries can be considered as a secondary source of critical metals (mainly Ni and REEs) owing to their valuable metal content. For example, a battery pack from a Toyota Prius contains about 15 kg of REEs [8,9].
Various routes have been investigated for the selective recovery of metals by chemical processes, as recently reviewed by Cassayre et al. [10]. Pyrometallurgical processes suffer from low selectivity, especially for REEs which are lost in the slags [10]. The hydrometallurgical treatment consists of the following steps: preparation of a battery powder called black mass (BM) through thermal and mechanical pretreatment, leaching of valuable metals from the BM by an acid solution and subsequent metal recovery from the leachate by different methods, such as precipitation, solvent extraction and electrowinning. As the pregnant leach solution (PLS) contains more than 10 chemical elements, including about 50 g/L of Ni and 15 g/L of REEs (La, Ce, Nd, Pr), their efficient and cost-effective separation is a key challenge [10,11,12].
As for the specific recovery of REEs from these acid leachates, solvent extraction from HCl or H2SO4 media has been widely studied [3,13,14,15,16,17,18,19,20]. Although this method reaches the best performances in terms of purity and extraction yields and is well-suited for continuous operations, it requires rather complex processes and multi-step operations. Another option consists of implementing grouped selective precipitation of REEs. In this case, the individual separation of REEs is not achievable, but processes are very effective and robust. Oxalic acid, which is a common reactant for REE precipitation, is not adapted in the case of Ni–MH leachates due to the absence of selectivity concerning the primary impurities, such as Fe and Al [10,21]. The main route consists of precipitating sodium–lanthanide double sulfates salts, which are sparingly soluble in sulfuric acid media, according to the following reaction:
REE ( aq ) 3 + + 2 SO 4 ( aq ) 2 + Na ( aq ) + + H 2 O ( aq ) NaREE SO 4 2 H 2 O ( s )
As for any separation processes, the key aspects of the precipitation of the REEs, according to Equation (1), are (i) the REE recovery yield, (ii) the nature of the obtained phase and (iii) the purity of the solid product about the other elements contained in the PLS. REE precipitation can be initiated by pH increase with NaOH or NaOH–Na2CO3 mixtures, where Na+ cations are the main drivers of supersaturation. Using these reactants, several authors have showed that the best selectivity is achieved at low pH (typically at pH = 1.5), while the reported residual metal contamination (Ni, Co, Fe, Al) in the precipitate strongly varies between the studies [22,23,24,25,26,27,28,29,30].
Another effective reactant is Na2SO4, which brings the advantage of adding both sulfate and sodium ions in the PLS and thus enhances the supersaturation [31,32,33,34,35]. In this case, the yield of precipitation depends on three main parameters: the molar ratios Na:REE and SO4:REE, and the temperature. Porvali et al. [32] carried out experiments with the simultaneous addition of Na2SO4 and H2SO4. They showed that, at high acidity (3.19 mol/L H+) and high Na:REE (21.2:1) and SO4:REE (58.3:1) molar ratios, the precipitation efficiencies at room temperature (RT) were extremely high (La > 98%, Ce > 99% and Pr > 99%), while the precipitation yield reached only 93–95% without H2SO4 addition. The authors reported small contamination of Ni, Co, Al and Fe in the solid product (0.75 mg/g, 0.13 mg/g, 0.16 mg/g and 0.07 mg/g respectively). In a further study, the same authors obtained very high extraction yields (>99%) at 50 °C for Na:REE ratio of 9.1:1, using a Na2SO4–water solution as a reactant [31], while the starting pH of the PLS was slightly below 1. Zielinski et al. [35] have confirmed that using Na2SO4 alone can lead to the complete precipitation of REEs from a PLS that was obtained by the leaching of a BM prepared in industrial facilities. Specifically, they showed that a temperature increase from 25 to 60 °C at a constant Na:REE ratio of 3.2:1 increases the overall REE recovery yield from 77.6% to 99.2%. However, significant amounts of unwanted metals, such as Ni (>5 wt%) and Al (>1.5 wt%), were also detected in the solid products [35]. Said et al. [33] obtained a high La precipitation yield from a synthetic PLS with a Na:REE ratio of 3.0:1 at 70 °C. In parallel, Takano et al. [34] have reported the precipitation of REEs from industrial Ni–MH leachate in a 300 L stirred tank at 80 °C by adding a 1.3 mol/L sodium sulfate solution until reaching a Na:REE molar ratio of 22.0:1. They confirmed that such a precipitation reaction is an effective operation at the industrial scale: 99% of La and Ce were recovered as double sulfate salts. Ni and Co concentrations in the solution remained almost unchanged after REE precipitation, while their content in the solid phase was 0.04% and 0.005%, respectively [34].
Although the method of the grouped recovery of REEs by the precipitation of sodium–lanthanide double sulfate salts has been proven to be efficient by these previous studies, essential questions remain to be answered, from the perspective of process operation and further product valorization, for a better understanding of the precipitation reaction.
First, the exact nature of the solid precipitate needs to be clarified. Indeed, it is not yet clear whether REEs form a mixture of double sulfate salts or a single phase in the form of a solid solution. Based on X-ray diffraction (XRD) analysis, several studies have concluded that the product is a mixture of lanthanide double sulfate salts (NaLa(SO4)2·H2O, NaCe(SO4)2·H2O and NaNd(SO4)2·H2O) [23,24,27,32], while others have mentioned only one single phase [22,35], and most did not provide structural characterizations [25,26,28,29,30,31,34].
Second, the purity of the product regarding other metal elements contained in the PLS (Ni, Co, Fe, Mn, Al) is a key factor in the separation process. Again, even if several studies have reported very low contaminations [23,32,34], some others have mentioned noticeable amounts of metal elements [22,24,25,35], and several did not provide any analyses [26,27,28,29,30,31]. The phenomenon linked with metal contamination is also not well identified. It could occur during the precipitation step through the co-precipitation of a minor phase or by the integration of metal elements in the structure of the double sulfate salts. It could also be due to a crystallization phenomenon during the drying of the filter cake obtained after the precipitation stage. Very little information is currently available relative to this issue, especially about the role of the filtration and washing steps following the precipitation reaction.
In relation to these questions, the present work addresses the precipitation of REEs from an industrial PLS prepared at the SNAM facilities from an industrial feedstock of spent Ni–MH batteries. The reaction was carried out in a 2 L reactor, using Na2SO4 solution as a reactant. The reaction parameters were selected according to our previous work [35] where we showed that the most adapted process temperature (in the range of 25 to 60 °C) was 60 °C, with a Na:REE molar ratio of at least 3.2:1 in order to maximize the recovery yield of REEs. These conditions are very close to those recently proposed by Said et al. [33] (Na:La = 3:1 and T = 70 °C) after optimization of precipitation yield and purity of lanthanum sodium sulfate monohydrate from synthetic sulfate solutions. The influence of hydrodynamic parameters (stirring and feed rates) on precipitation kinetics was investigated. The washing of the solid phase after precipitation was studied to determine the optimal temperature and quantity of washing water required to obtain the purest product. The crystal structures of non-washed and washed samples were identified by XRD analysis, with supporting chemical composition analysis. Furthermore, thermodynamic calculations using the OLI System software (version 11.5) [36] and the recent database from Das et al. [37] were implemented as support for understanding the system chemistry.

2. Materials and Methods

2.1. Chemicals

Sulfuric acid solution (95–97%) was purchased from Supelco (Darmstadt, Germany). Sodium sulfate (anhydrous, ACS reagent, ≥99%) and cerium (III) sulfate (≥99.99% trace metals basis) were supplied by Sigma-Aldrich (St Quentin Fallavier, France). Lanthanum (III) sulfate hydrate (99.9% REO) was obtained from Alfa Aesar (Kandel, Germany). Aqueous ICP standards of aluminum, cerium, cobalt, iron, lanthanum, manganese, neodymium, nickel, praseodymium, zinc and potassium were delivered by SCP Science (Villebon-sur-Yvette, France). All chemicals were used as received, without any further purification.

2.2. Preparation of the Leach Solutions

The leach liquor, provided by the SNAM facility (Viviez, France), was produced at the SNAM facilities in a pilot-scale reactor using sieved (<100 µm) BM powder that was prepared from Ni–MH cells with prismatic geometry from first-generation hybrid vehicle batteries. The leaching process was carried out under the following conditions:
  • Washing of BM at 40 °C, solid–liquid ratio (S/L) = 0.2, for 1 h at pH 6, in order to remove residual electrolyte salts (mostly composed of water-soluble KOH);
  • Drying at 80 °C for 12 h;
  • Dissolution of BM in sulfuric acid solution at regulated pH = 1 and 50 °C, S/L = 0.15, for 22 h.
As several leaching batches were performed to provide the PLS used in this study, the resulting leachates were mixed. The chemical composition of the resulting solution, determined by spectroscopy analysis, is provided in Table 1 (see Section 2.3.1 for analytical protocol). Ni was the most concentrated metal (46 g/L) and the total concentration of REEs was above 13 g/L. Sodium was below the detection limit, whereas the residual potassium concentration was at 0.75 g/L, indicating incomplete washing of the BM. The total sulfur concentration (133 g/L) was calculated based on sulfur analysis measured by ICP.
Additional synthetic solutions, whose compositions are provided in Table 1, were prepared to synthesize pure double salts of La and Ce (synth-La and synth-Ce), as well as a mixture of both elements (synth-LaCe). The solutions were prepared by adding 1 kg of water into the reactor with subsequent heating to 60 °C. Then, the sulfuric acid solution was added to adjust the pH of the solution to 1.3. The pure sulfate compounds (La2(SO4)3·9H2O or/and Ce2(SO4)3) were then added and dissolved in the solution.

2.3. Analytical Methods

2.3.1. Liquid Phase Analyses

Metal concentrations in the PLS and in the samples drawn during the precipitation experiments were determined by inductively coupled plasma–optical emission spectroscopy (ICP–OES, HORIBA Jobin Yvon ULTIMA 2, Palaiseau, France). All samples were diluted 40 times in distilled water. The calibrations were made by measurement of standard solutions spanning the expected sample concentration range. The standard solutions were prepared by dilution of commercial standard solutions in 3 wt% H2SO4 solution to reach the desired concentration range.

2.3.2. Solid Phases Characterizations

The elemental composition of the precipitated solids was also determined by ICP–OES analysis, with a preliminary dissolution using a microwave digestion system (CEM MARS 6, Charlotte, NC, USA). The dissolution was conducted by adding 0.5 g of the solid sample and 12 mL of aqua regia solution (3 mL of HNO3 solution + 9 mL of HCl solution) into the digestion vessel. The dissolution was carried out using an iPrep kit at 210 °C for 30 min. After that, the obtained solution was diluted 1000 times to proceed with ICP–OES analysis.
The structural characterization of the synthesized solid phases was performed by powder X-ray diffraction analysis (XRD BRUKER D8 Endeavor equipped with a LynxEye-XE-TTM detector with energy resolution < 380 eV (Cu Kα), which enables the filtering of unwanted scattering) in the measurement range 2θ of 10–100° with 0.02° step. Phase identification was performed with DiffracPlus EVA and Match!3 software (version 3.15) combined with the ICCD-PDF and Crystallography Open Database (COD) database. Profile matching refinement (or pattern decomposition using Le Bail method [38]) was subsequently performed with the Fullprof/WinPlotR software (version 7.95) [39].
Microscopic observation and qualitative elemental analyses were performed by scanning electron microscopy (SEM) and energy dispersive spectroscopy (EDS) analysis (JSM-7100F field emission gun SEM attached with EDS Oxford ASDD X-Max 50 mm2, Les Ulis, France). The solid samples were deposited on carbon tape for direct SEM observation. In order to implement EDS analysis, a compacted tablet was prepared by applying around 5 tons on 0.5 g of powder placed in a cylindrical compaction mold. Then, the tablet was embedded in a non-conductive phenolic resin, leaving an open, smooth and dense surface of the sample for EDS analyses.
The water content in solid products was measured by thermogravimetric analysis (TGA, TGA/DSC1 Mettler Toledo). The solid samples were heated under nitrogen from 25 to 500 °C with isothermal steps at 105 and 500 °C, both for 15 min. The first step aimed to remove residual moisture, while the second was performed to achieve complete dehydration of the sample. The heating rate was 10 °C/min.
A Mastersizer 3000 device (Malvern Panalytical, Palaiseau, France) equipped with a dry powder disperser (Aero S) was used to determine the particle size distribution of the samples.

2.4. Experimental Protocols

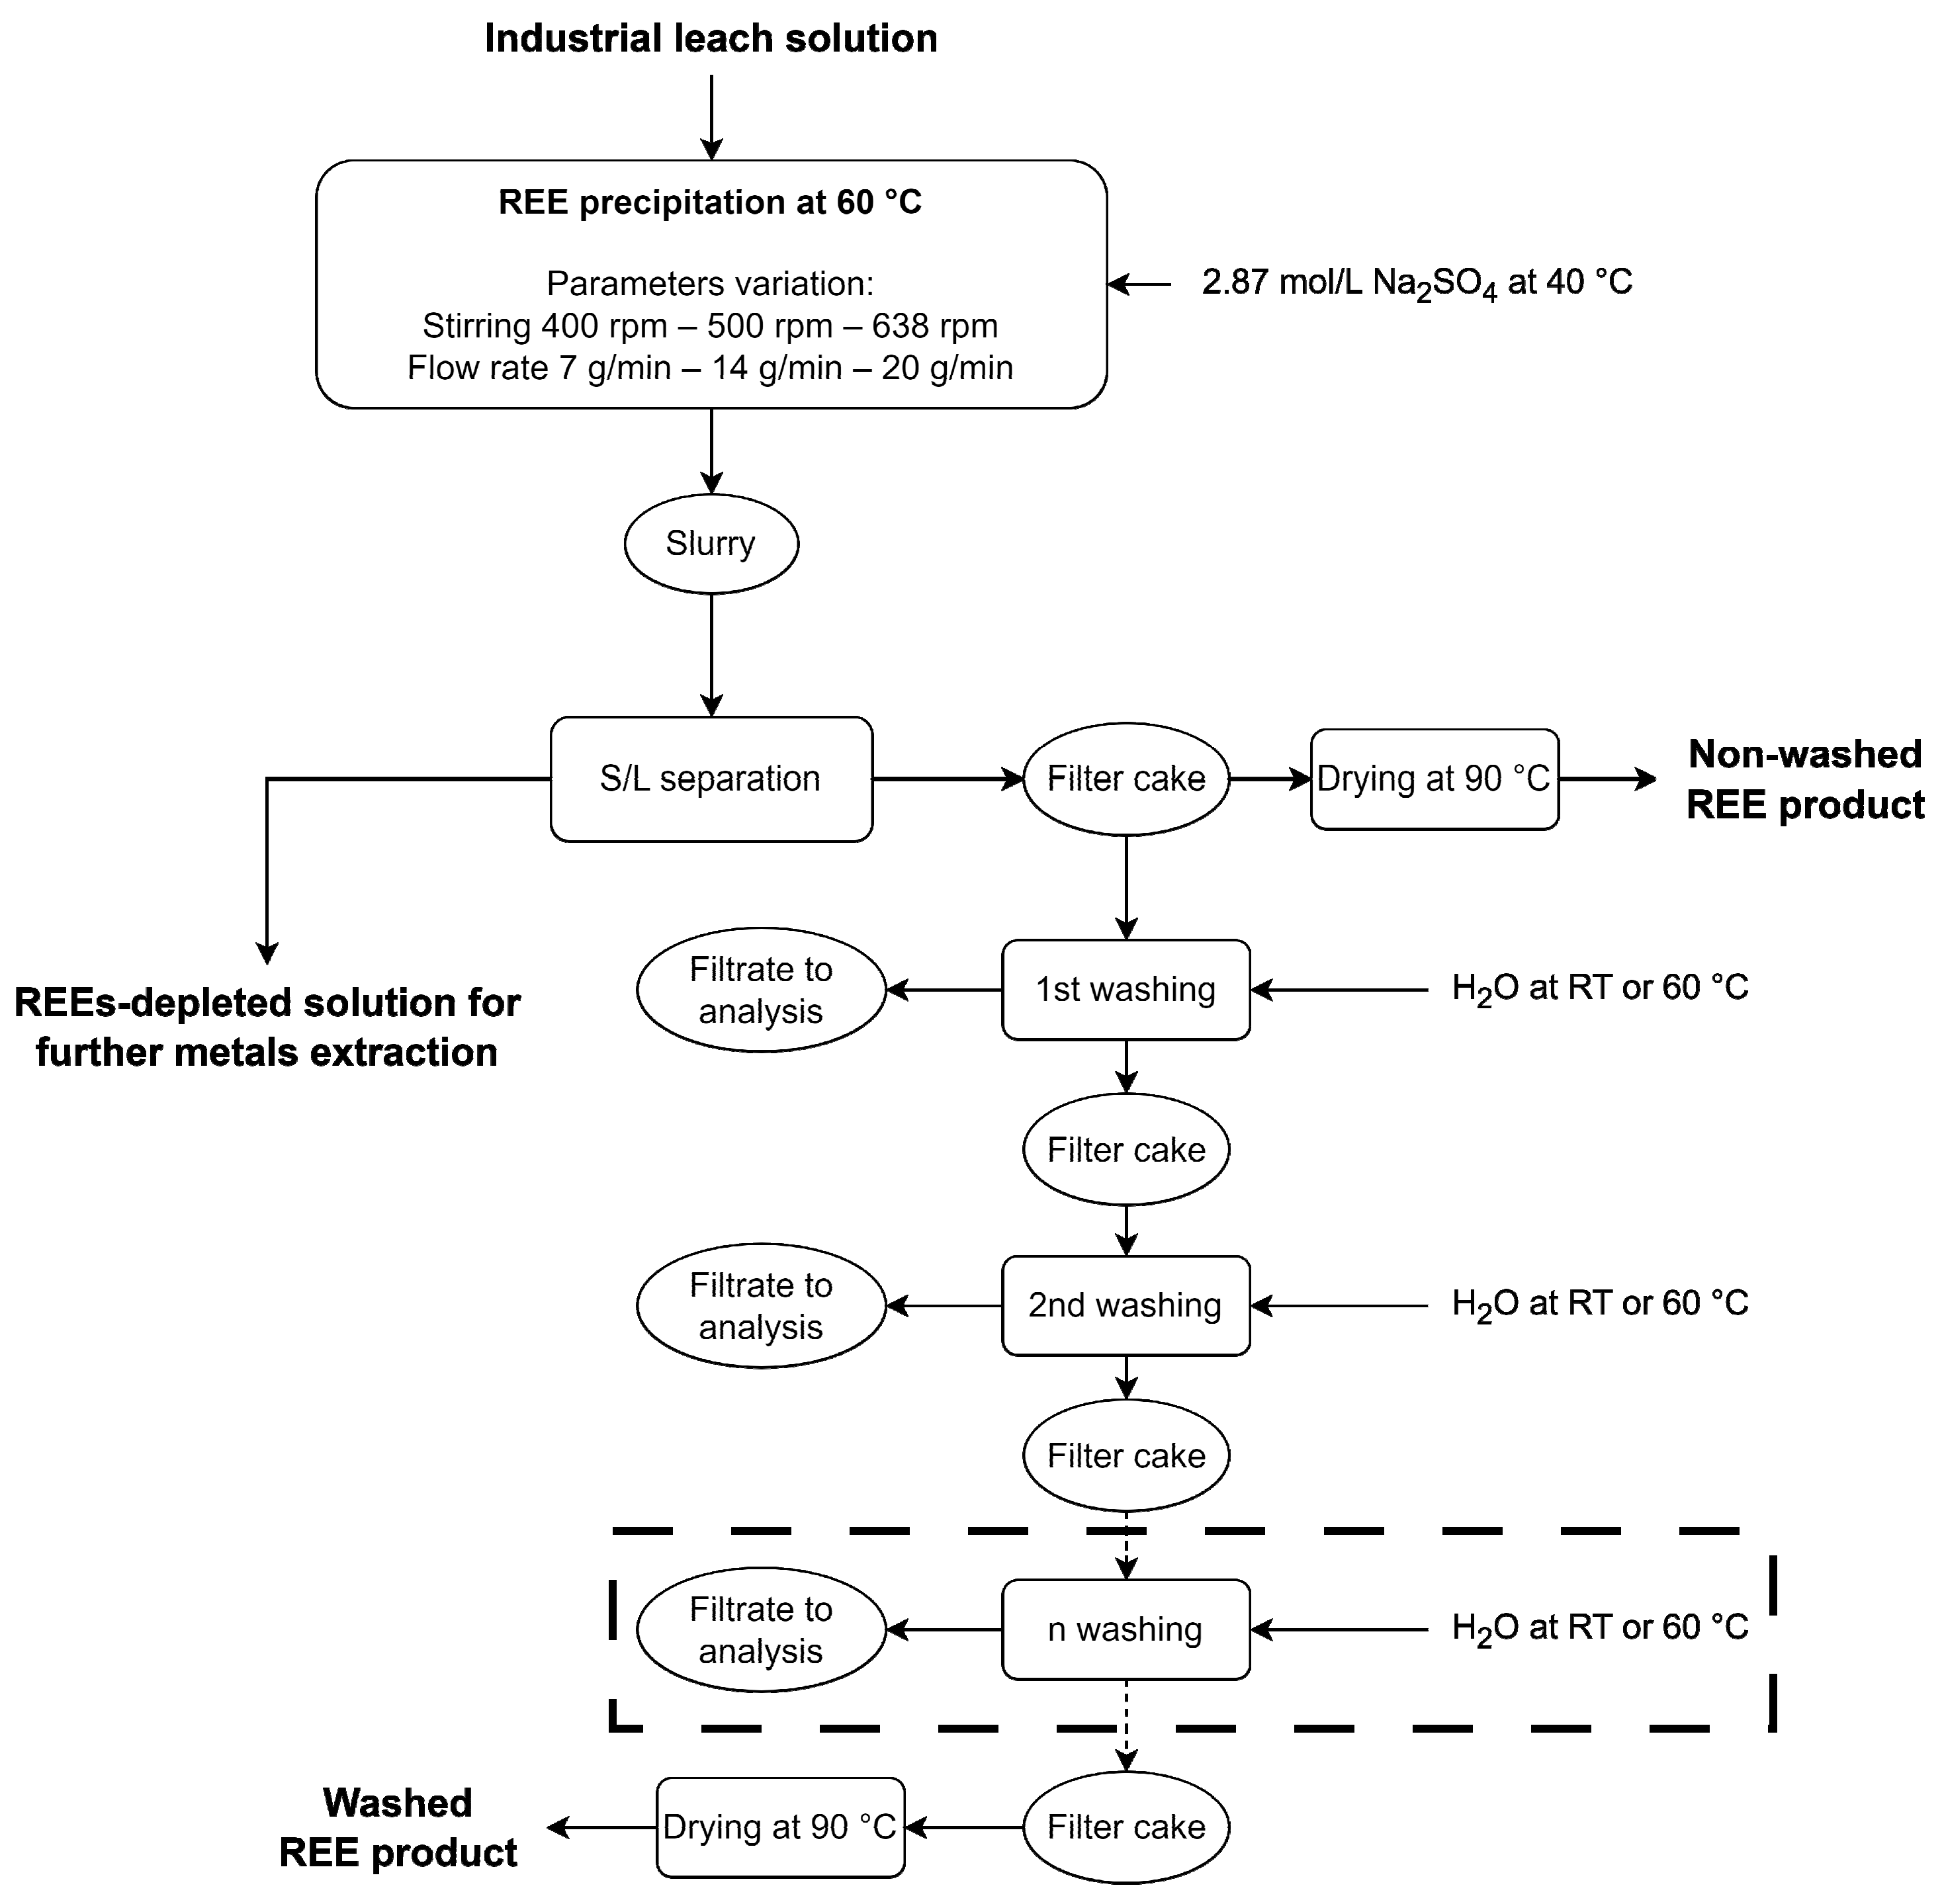
2.4.1. Precipitation of REE Double Sulfates Salts

The precipitation reactions were carried out in a 2 L jacketed round bottom glass vessel, equipped with 4 wall-mounted glass baffles and a mechanical stirrer made of a 4 bladed turbine with 45° inclined blades covered with Teflon. The reaction temperature and pH were controlled throughout the process using a thermocouple and a pH probe. Each experiment started with the addition of 1.5 L of the PLS into the reactor. Subsequently, the solution was heated to 60 °C with continuous stirring. Then, the precipitation agent, consisting of a 2.87 mol/L Na2SO4 solution pre-heated at 40 °C, was added to the reactor using a single-jet injection device at a constant flow rate. In the first set of experiments, the stirring rate was varied from 400 rpm to 640 rpm while the mass flow was kept constant at 7 g/min (corresponding to 5.4 mL/min with a reactant density of 1.30 g/mL). In the second set of experiments, the flow rate was increased from 7 g/min to 14 (10.8 mL/min) and 20 g/min (15.4 mL/min), while the stirring rate was fixed at 550 rpm. The total added amount of Na2SO4 reactant was kept constant for each test, corresponding to a molar ratio of Na:REE = 3.6:1 (see Section 3.1 for more details). All experiments (corresponding to a given set of parameters) were performed in duplicate.
At the end of the Na2SO4 addition, the suspension was stirred at a constant temperature for 1 h and was then filtered using a Büchner setup (d = 180 mm; pore size 16–40 µm) to recover a Ni-rich solution on one hand and an REEs-rich filter cake on the other hand.
The synthetic Na–La, Na–Ce and mixed Na–La–Ce double sulfate salts were precipitated from the synthetic solutions by adding the 2.87 mol/L Na2SO4 solution at 7 g/min. The added volume of sodium sulfate solution varied from 80 mL to 120 mL depending on the initial concentration of REEs.
Liquid samples were drawn during the experiments (using a plastic syringe with a filter of 0.45 µm pore size) and diluted with distilled water for elemental analysis using ICP–OES. The precipitation yield ( % Y i ( t ) ) of metal i was calculated via Equation (2), where C t i (g/L) and V t (L) are respectively the concentration of metal i and the volume of solution at a given time and C init i and V init are the initial concentration of metal i and volume of PLS added into the reactor:
% Y i ( t ) = 1 C t i V t C init i V init 100 %
The precipitation yield of the sum of REE (%YREE(t)) was calculated by Equation (3):
% Y REE ( t ) = 1 n t La + n t Ce + n t Pr + n t Nd n init La + n init Ce + n init Pr + n init Nd 100 %
where n t L a , n t C e , n t P r , n t N d represent the respective number of moles of La, Ce, Pr and Nd in the solution at a given time and n i n i t L a , n i n i t C e , n i n i t P r , n i n i t N d represent the respective number of moles of La, Ce, Pr and Nd in the initial solution.

2.4.2. Washing of REE Double Sulfates Salts

After the initial filtration, filter cakes underwent washing with water. The washing operation was carried out in successive steps in order to evaluate the effect of the amount of water on the removal of impurities and estimate the losses of REEs in the filtrate. This consisted of pouring distilled water on the surface of the filter cake (still placed on the Büchner device). In the first set of experiments, 250 mL of water at RT was poured 10 times (2.5 L in total). Then, the total amount of added water was decreased to 1 L with water addition in 6 steps: 2 × 100 mL and 4 × 200 mL. Water was either at RT or 60 °C, to investigate the influence of temperature on the washing process and to potentially minimize the loss of REEs due to re-dissolution. After each washing/filtration step, the aqueous solution was collected and its elemental composition was analyzed by ICP–OES. All filter cakes were dried at 90 °C in an oven for about 1 day. Weighing before and after the drying enabled the determination of moisture content. Solid samples taken from the filter cakes were subsequently analyzed. The “non-washed product” is the product derived from the filter cake obtained after the initial suspension filtration, while the products obtained after washing are referred to as “washed products”.
The entire flow-chart of the precipitation-washing experiments is shown in Figure 1.

3. Results and Discussion

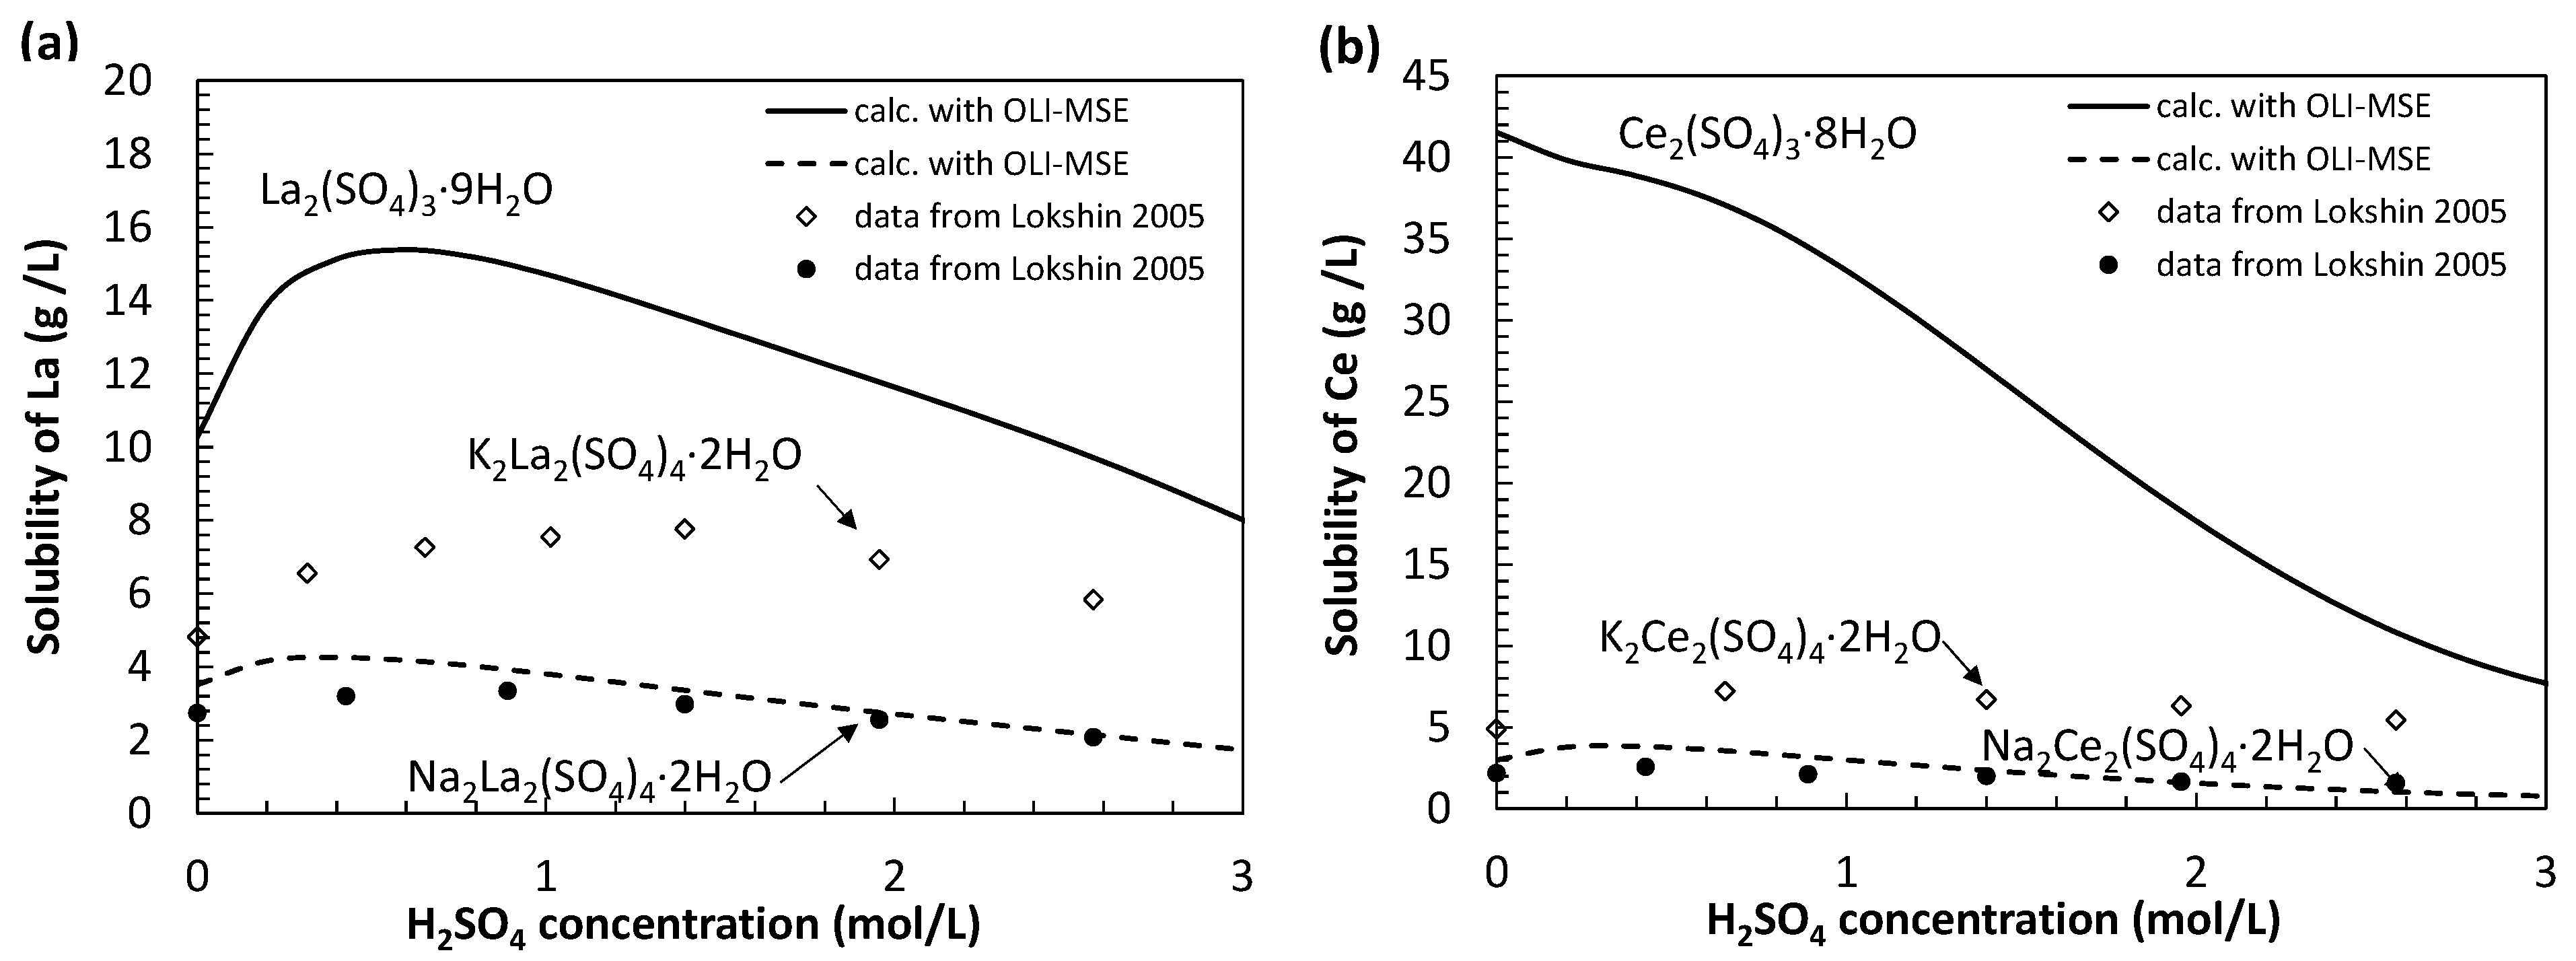
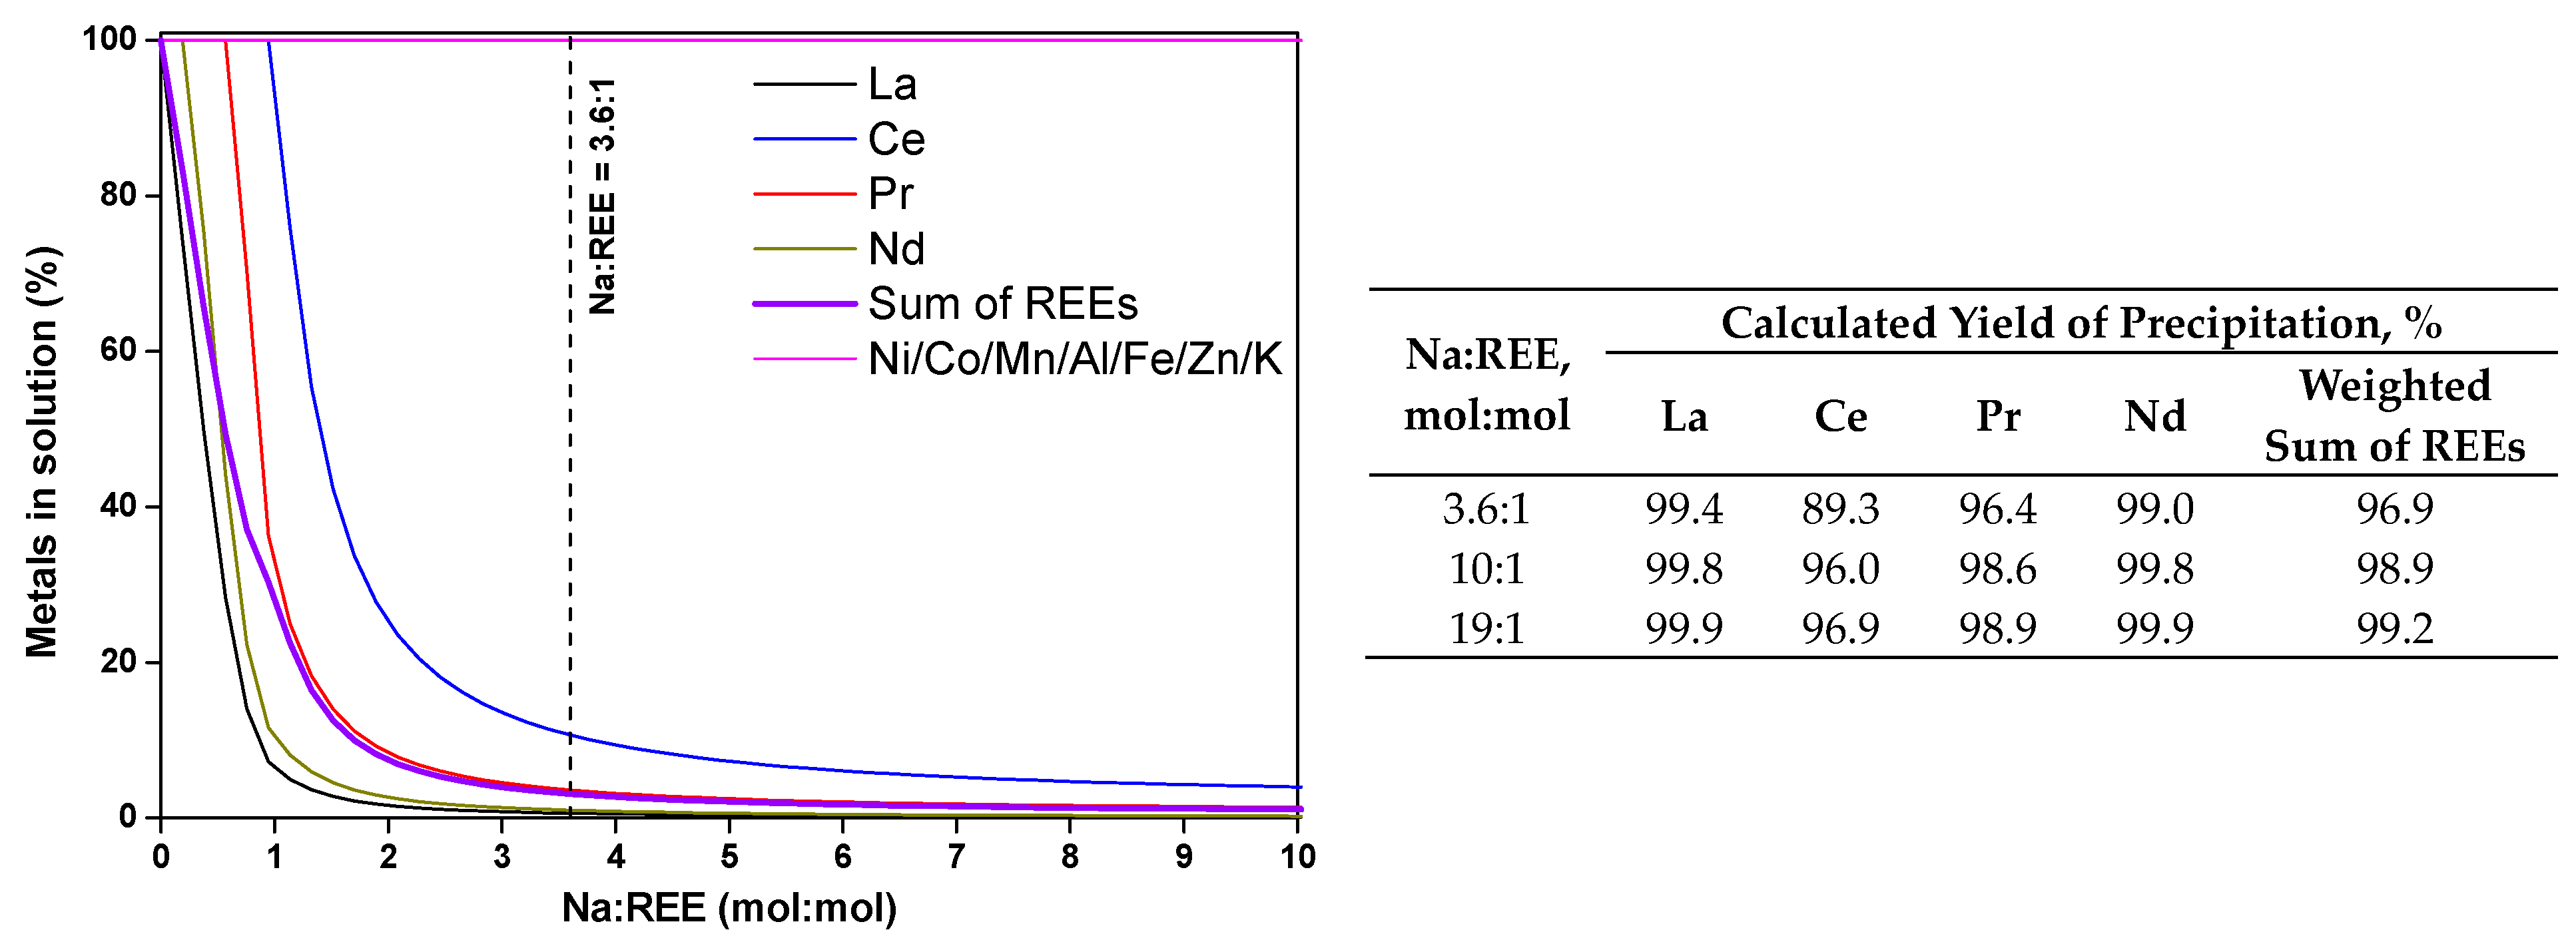
3.1. Preliminary Thermodynamic Calculations

The variation of REE precipitation yield when adding Na2SO4 addition was evaluated by thermodynamic modeling using the OLI studio module (v11.0) of the OLI Systems software. This program implements the mixed-solvent electrolyte (MSE) model for concentrated electrolyte solutions [36]. The OLI–MSE database includes a specific thermodynamic description of the system’s rare earth sulfates/sodium sulfate/sulfuric acid /water [37] and is thus well adapted to represent the chemical system. As illustrated in Figure 2, the calculated solubility of monohydrated sodium–lanthanide double sulfate salts Na2REE2(SO4)4·2H2O (with REE = La and Ce) in aqueous solution with various contents of H2SO4 at 25 °C reproduces the experimental data from the work by Lokshin et al. [40]. However, as later discussed in this article, the model does not integrate the potassium double sulfate salts KREE(SO4)2·H2O, which possess an intermediate solubility level between sodium double sulfate salts and simple REE sulfates (LaSO4·9H2O and CeSO4·8H2O).
The calculation procedure, implemented and discussed in our previous work [35], was reproduced in the present work, with a slightly different initial PLS composition. The composition of the input PLS corresponded to the chemical composition provided in Table 1, from which 11 elements were introduced in the form of their corresponding sulfates (M2SO4, MSO4 or M2(SO4)3 depending on the oxidation state of element M). The pH of the simulated PLS was adjusted to the experimental value (pHmes = 1.0) by the addition of sulfuric acid. The temperature was fixed at 60 °C. The calculations consisted in mixing 1.5 L of the PLS with an increasing volume of a 2.87 mol/L Na2SO4 solution to simulate the addition of the reactant.
As shown in Figure 3, which presents the calculated proportion of the element in the aqueous phase versus the molar ratio Na:REE, the precipitation of REEs is expected to be a highly selective process, as no element other than Na and REEs should precipitate. In agreement with Equation (1), the calculations indicate the formation of four monohydrated sodium–lanthanide double sulfate salts with the form NaREE(SO4)2·H2O (REE = La, Ce, Pr, Nd). Due to slight differences in equilibrium constants, the calculations predict that the elements should precipitate in the following order: La first, then Nd, Pr and Ce.
While considering the mass balance, the addition of one mole of Na per mole of REEs may be sufficient to recover all REEs as double sulfates in accordance with Equation (1), the calculations plotted in Figure 3 show that a significant excess of Na2SO4 is required to obtain a high REE recovery. A precipitation yield of REEs over 99% can only be reached with a Na:REE molar ratio of 19:1. Such an addition of reagent is not acceptable as it would cause significant dilution to the remaining solution, and thus a lower efficiency in subsequent metal recovery steps, particularly for Ni. Moreover, as shown in Figure 3, yields higher than 95% can be obtained for much lower additions. In this work, a Na:REE ratio of 3.6:1 was selected, which should allow for a precipitation efficiency of 96.9% to be reached for the weighted sum of the four REEs (99.4% for La, 89.3% for Ce, 96.4% for Pr and 99.0% for Nd). According to these calculations, the resulting solid phase should consist of a mixture of the four double sulfate salts, and be free of other elements present in the PLS.

3.2. Precipitation of REEs from PLS: Experimental Yields

Precipitation experiments were carried out according to the protocol described in Section 2.4.1. The precipitation yields corresponding to a standard experiment (T = 60 °C, Na:REE = 3.6, stirring rate 550 rpm and reactant flow rate of 7 g/min) are presented in Section 3.2.1. Then, the influence of stirring rate and flow rate on the REE precipitation yields are evaluated in Section 3.2.2.

3.2.1. Standard Experiment

Figure 4 shows the evolution of REE precipitation yields with time (100-%Yi(t), derived from Equations (2) and (3)) for the standard conditions. After 80 min, the experimental yields were 95.7 ± 0.2 mol% for La, 98.8 ± 0.3 mol% for Ce and 99.1 ± 0.2 mol% for Nd. The total yield of REEs reached 96.3 ± 0.2 mol%. The time evolution revealed that REEs precipitated with a short (<10 min) induction time, and that the majority of precipitation (>90%) occurred by the end of Na2SO4 addition. Furthermore, in contrast with equilibrium calculations, the precipitation appeared to be simultaneous for all REEs.
No precipitation of transition metals (Ni, Co, Mn, Zn, Fe, Al) could be evidenced by the analysis of the aqueous phase samples. It can be noted that the rates of Ni and Al reported in Figure 4 vary slightly, sometimes exceeding 100% (maximum 103%). This is attributed to the sum of several uncertainties in the determination of the values according to Equation (2): the determination of concentrations (Cinit and Ct) and, primarily, the total volume of the solution at the time of sampling (Vt). Indeed, the volume is estimated by the sum of the initial volume and the added reactant, thus neglecting the mixing contribution as well as the formation of solid phases involving water molecules.
Figure 5a provides a comparison between the REE precipitation yields predicted by thermodynamic calculations and those determined from the analysis of the aqueous solution. The overall agreement is rather good, particularly for the total REE yield. The slight overestimation of the thermodynamic calculation could be attributed to an incomplete reaction after 80 min. However, considering individual elements and the standard deviation of the experiments, we find that the measured yield of Ce is considerably higher than expected by calculation, whereas Nd is equivalent and La is significantly lower. This discrepancy is most likely attributed to the model, as discussed in Section 3.5. As illustrated in Figure 5b, the influence of the Na:REE ratio on the overall precipitation efficiencies obtained in this work as well as in the works of Zielinski et al. (at 60 °C) [33] and Porvali et al. (at 50 °C) [29] are consistent with thermodynamic predictions. This analysis confirms the discussion related to preliminary thermodynamic calculations (Figure 3), showing that a significant excess of Na2SO4 is required to obtain a high (>99%) recovery of REEs.
The elemental mass balance comparing the initial PLS with the resulting filtrate is detailed in Table 2. This balance was established using elemental ICP analysis and the measured mass of both solutions. It was found that 95.7% of Al and Ni, >99% Co, Mn, Fe, and Zn were recovered in the filtrate, confirming the efficiency of the applied method for the selective removal of REEs from the PLS.
The losses in Ni and Al between the initial PLS and the filtrate are unlikely to be attributed to a precipitation reaction due to (i) their constant concentration in the solution over the experiment (Figure 4), and (ii) the absence of any formation of solid compounds containing Ni or Al, as indicated by thermodynamic calculations (Figure 3). As further discussed in Section 3.3, the main hypothesis is that Ni and Al losses occur during the filtration operation, notably due to the partial trapping of the solution in the filter cake.
Additionally, it is worth noting that only 30% of K was recovered in the REEs-depleted solution, indicating a potential co-precipitation of K-containing compounds. Due to the large excess of Na2SO4 added during the precipitation reaction, the final solution contains a rather high content of Na (almost 5 g/L, not shown in the mass balance).

3.2.2. Influence of Hydrodynamic Parameters

The influence of the stirring rate and reactant flow rate on the precipitation reaction was evaluated. For this purpose, the agitation was first varied from 400 rpm to 638 rpm (standard experiments were carried out at 550 rpm) while other parameters were kept constant (temperature of 60 °C, flow rate of 7 g/min of 2.87 mol/L Na2SO4 and Na:REE molar ratio of 3.6:1). Second, different flow rates (from 7 g/min to 14 g/min and 20 g/min) were applied, while stirring (550 rpm), temperature (60 °C) and Na:REE (3.6:1) were kept constant. The resulting experimental yields are plotted as a function of time in Figure 6a,b.
Regarding the effect of stirring rate (Figure 6a), it can be observed that the initial slope of the curve for 638 rpm was steeper than that at 400 rpm. This indicates that there was a corresponding increase in the rate of crystal production as a result of stirring rate augmentation. This suggests a diffusion-controlled reaction. Meanwhile, the yield of precipitation after 1 h of ripening time was almost independent of the stirring rate. Specifically, the yield at 638 rpm was only 2% higher than that at 550 rpm. That means that the system reached equilibrium. Therefore, for future experiments, the stirring rate was fixed to 550 rpm, corresponding to a power of 1.29 W/kg of solution estimated using the Zwietering correlation and the properties of the experimental setup (stirrer type and its diameter, density of the solid/liquid phases and kinematic viscosity).
Regarding the effect of the Na2SO4 addition flow rate (Figure 6b), the induction period of REE precipitation was shorter at higher flow rates. This can be explained by the increased concentration of sulfate and sodium ions, which leads to higher supersaturation of the solution and shifts the reaction (Equation (1)) towards the products. The variation in precipitation yields was not significant: after 1 h of ripening time, 92.8% of REEs were removed from the solution at 7 g/min, whereas at 14 and 20 g/min, the final yields were 94.2% and 94.7%, respectively. It is worth noting that the precipitation of other metal elements was not observed at any flow rate.
The particle size distribution measurements of the washed products (see Figure 1) are summarized in Table 3. The variation of stirring rate (samples 1–2) and feed rate (samples 1–3) was not found to modify the particle size distribution significantly. For instance, D [4,3] values were about 16–19 µm. On the other hand, when the ripening time was extended from 60 to 99 min (sample 4), the D [4,3] value increased to 28 µm, which shows a strong effect of ripening time on particle agglomeration.
In conclusion, the results related to the influence of hydrodynamic parameters during the precipitation of REEs mostly demonstrate that the precipitation process is very robust, with little influence of stirring rate and reactant feed rate on the composition of the aqueous solution. The following sections present the results related to the washing step and product analysis in standard conditions, which are representative of applicable industrial conditions.

3.3. Washing of the REE Precipitates

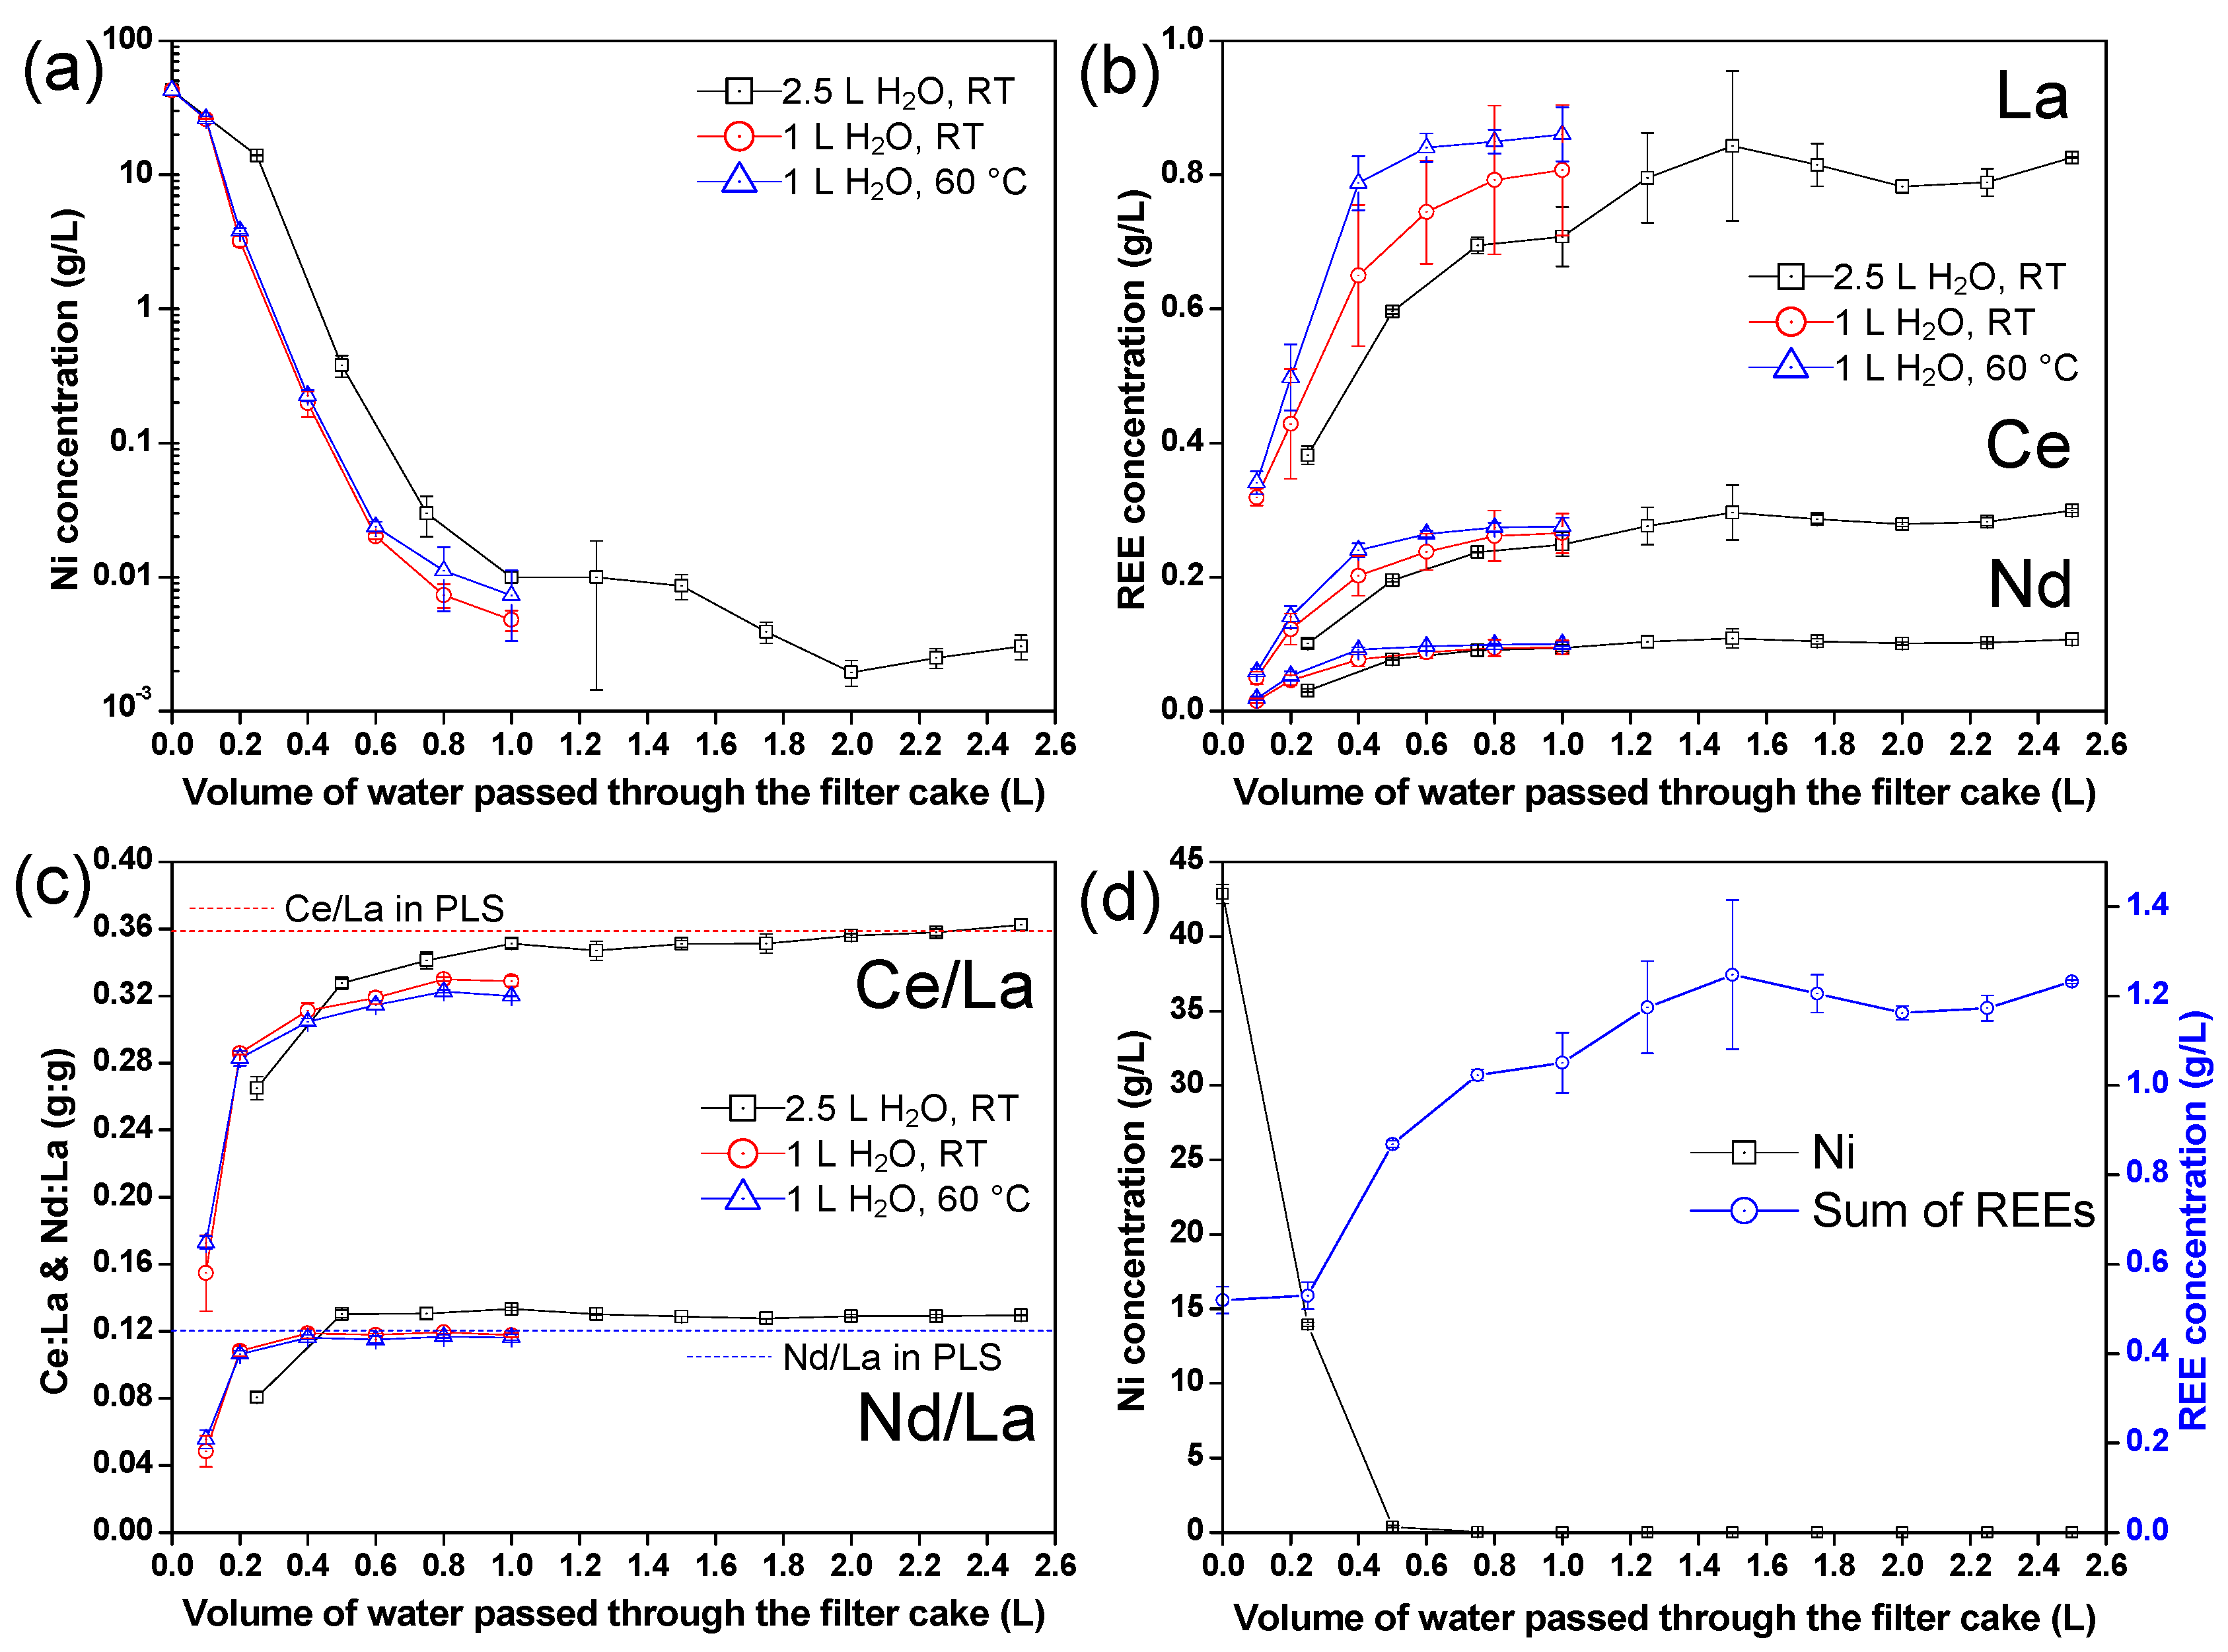
3.3.1. Composition of the Filtrate during Multi-Step Washing

This section is devoted to the washing of the filter cakes obtained by filtration of the suspension following the precipitation reaction under standard conditions (60 °C, 550 rpm, 7 g/min of 2.87 mol/L Na2SO4, Na:REE of 3.6:1 and 1 h of ripening). As described in Section 2.4.2 and Figure 1, the filter cakes were washed with successive additions of distilled water. Four different filter cakes were prepared: one that was obtained without washing, and three that were washed with 2.5 L of water at 25 °C, 1 L of water at 25 °C, and 1 L of water at 60 °C. The overall moisture of each filter cake, determined by weighing before and after 24 h drying, was between 26 and 28 wt% (for a dried mass of about 45 g).
Figure 7a,b represents the concentration evolution of Ni and REEs in washing liquors as a function of the amount of water passed through the filter cake. The data show that the first filtrates were highly loaded in Ni (around 25 g/L in the first filtrate, and 4 g/L in the second), and depleted in REEs (less than 0.35 g/L in the first filtrate). In relation to the moisture content of the first filter cake (28 wt%), the experiments showed that the first additions of water efficiently removed the solution trapped in the filter cake, corresponding to the REEs-depleted solution that contained high Ni concentration and low amounts of REEs (see Table 2). Then, Ni concentration sharply dropped to 0.01 g/L in the filtrate after 1 L of washing water addition. In further steps, Ni concentration remained at a very low level, indicating that washing was completed.
After the initial washing, some REEs were entrained in the washing solutions (Figure 7b) due to partial re-dissolution of the solid product. Indeed, the concentration of REEs increased in the first steps and was then constant (at about 1.2 g/L for the sum of REEs) once the Ni washing was completed. The total losses of REEs in the filtrate after washing with 1 L of H2O were about 5 wt% of the initial quantity of REEs in the solid phase (1 g of 19.4 g in the filter cake). For a washing volume of 2.5 L, the losses increased up to 15 wt% (3 g of 19.4 g in the filter cake). Furthermore, as shown in Figure 7b, the increase in water temperature up to 60 °C did not significantly modify the REE redissolution. This indicates that the washing step did not reach thermodynamic equilibrium, as the solubility of REE double sulfate salts is significantly lower at 60 °C than at 25 °C. Indeed, according to the data compiled by Das et al. [37], the solubility of REE double sulfate salts in pure water is divided by two between 25 and 60 °C.
The weight ratios Ce/La and Nd/La in the washing waters are plotted in Figure 7c. The data indicate that the initial dissolution of La was favored over Ce and Nd, and then quickly reached the ratio of the initial PLS. The dissolution of REEs was then congruent.
As illustrated in Figure 7d, the main conclusion related to the implementation of the washing operation is that determining the quantity of washing water is crucial to reaching maximum nickel removal while minimizing the losses of REEs caused by re-dissolution.

3.3.2. Effect of Washing on Particle Morphology

SEM images of non-washed and washed samples are provided in Figure 8. A comparison of the two images reveals that the shape of crystals after washing is more rounded, indicating a partial re-dissolution of the solid phase. That is consistent with the wash water analysis (Figure 7b) which demonstrated a partial re-dissolution of REEs over the washing step.

3.3.3. Effect of Washing on the Composition of the REE Precipitate

Samples from the four dried filter cakes were analyzed to monitor the influence of the washing procedure. Their elemental compositions, determined by ICP–OES analysis (see Section 2.3.2) in mg per g of product, are gathered in Table 4. We see first that the solid products are mostly composed of REEs and Na, which is consistent with the formation of REE–alkali double sulfates. This overall composition will be discussed in more detail in Section 3.4.1.
The concentration of Ni was rather high in the non-washed product (>23 mg/g), and decreased to 1–2 mg/g in the washed samples, which confirms the effectiveness of the washing protocol. This also suggests that Ni did not precipitate in the same phase as REEs. The concentration of other metal impurities in the washed products was about 0.4 mg/g for Al, 0.1 mg/g for Fe, and below 0.1 mg/g for other metals (Co, Mn, Zn).
Two complementary characterization techniques were used to further investigate the behavior of Ni in the filter cake. First, chemical mapping by SEM–EDS analysis of the compacted powders (Figure 9a,b) enabled the localization of nickel-containing particles in the non-washed product, while these particles were absent in the washed sample. Local mapping of the Ni and lanthanides clearly indicated the presence of a 50 µm Ni-rich zone and a heterogeneous localization of La in the non-washed sample (Figure 9a). In contrast, Ni was no longer detected in the washed sample (Figure 9b). Furthermore, in all observations, Na and S were distributed homogeneously over the same areas as REEs.
Second, the XRD patterns of the non-washed and washed powders are presented in Figure 9c. In both cases, a trigonal main phase (space group P3121 (152)) of NaREE(SO4)2·H2O type was detected. In the case of the non-washed product, additional peaks located at 2θ = 18.6° and 2θ = 26.6° (highlighted in the inset of Figure 9c) revealed the presence of a secondary phase which could be a monoclinic nickel sulfate (space group C12/c1 (15)) of type NiSO4·H2O.
These results confirm the fact that the residual Ni contained in the non-washed product formed a specific phase and did not enter into the structure of the rare earth double sulfate salts. The formation of the nickel sulfate compound most likely occurred from the trapped solution (which represents 28 wt% of the total mass of the filter cake) during drying, according to Equation (4). The driver of the precipitation reaction is the evaporation of water.
Ni ( aq ) 2 + + SO 4 ( aq ) 2 + H 2 O ( liq ) NiSO 4 H 2 O ( s )

3.3.4. Adjustment of the Washing Protocol for Minimizing Ni Losses

The set of results concerning the washing of the filter cake allows several conclusions to be drawn concerning the treatment of PLS. First, as the initial Ni concentration in the filtrate is high, with a low REE content, an interesting option is to first add filtrates in the REEs-depleted solution to minimize the overall Ni losses during the REE recovery operation. As illustrated in Figure 10, in the specific case of our filtration device, a volume of 200 mL containing 3.1 g of Ni can be added to the ~1.5 L of REE-depleted solution. This lowers the total Ni losses to about 1% related to the initial nickel content of the PLS.
Second, the amount of additional water to be used for the removal of remaining Ni and other impurities (mainly Fe and Al) in the filter cake must be carefully controlled in order to minimize the re-dissolution of REEs as well as the amount of wastewater. The appropriate amount of washing water (if any) will strongly depend on the subsequent processing step of the double sulfate salts, and thus cannot be precisely specified at this stage. Indeed, as further discussed in the conclusion of this article, various re-dissolution/precipitation processes can be considered for the double sulfate salts conversion. For each of these processes, it is crucial to investigate the behavior of remaining impurities and the resulting contamination of the final REE product.

3.4. Characterization of the Washed REE Product

This section reports further characterizations of the product containing REEs prepared under standard conditions (60 °C, 550 rpm, 7 g/min of 2.87 mol/L Na2SO4, Na:REE of 3.6:1, 1 h of ripening), with a washing protocol consisting of the addition of 2.5 L distilled water. While the usual description of the precipitation reaction is the formation of Na–REE double sulfate salts according to Equation (1) [23,24,27,32], the chemical analysis of the washed product originating from the industrial PLS showed a more complex situation.

3.4.1. Chemical Composition

As shown in Table 1, despite preliminary washing of BM powder to eliminate the residual KOH electrolyte before leaching, the initial PLS contained ca. 0.8 g/L of K, which decreased to about 0.2 g/L after the precipitation reaction. As evidenced in the chemical analyses provided in Table 4 and the elemental mapping in Figure 9a, potassium was found in the products (about 15 mg/g of washed product, in comparison with about 70 mg/g of Na), which indicates the co-precipitation of this element during Na2SO4 addition. The most likely reaction is that according to Equation (5), since it is established that K can form sparingly soluble REE double sulfates (Figure 2, [38]).
REE ( aq ) 3 + + 2 SO 4 ( aq ) 2 + K ( aq ) + + H 2 O ( aq ) KREE SO 4 2 H 2 O ( s )
The main driver for this precipitation reaction is the addition of sulfate anions in the solution through the Na2SO4 reactant, Equation (5) is thus a concurrent precipitation reaction of Equation (1). The calculation of the Na:REE and (Na + K):REE molar ratios in the washed solids, provided in Table 4, supports the hypothesis of the formation of K-salts on top of Na-salts. Indeed, while the molar ratio Na:REE is less than 1, the ratio (Na + K):REE is about 1, which is consistent with the molecular formula of the double sulfate salts. Such co-precipitation of K has been previously mentioned by Porvali et al. [31], based on the observation of the decrease of the concentration of K in the aqueous solution (from 0.3 g/L in the PLS to about 0.05 g/L after the precipitation reaction).
As evidenced in Table 5, the molar ratio of REEs in the initial leach solution is similar to the molar ratio in the obtained double sulfate salts and does not change over the washing. Taking into account the way in which REEs precipitated simultaneously from the PLS (Figure 4) and the fact that the molar ratio of REEs in the solid phase is equal to that in the PLS, it can be suggested that, rather than four individual sodium–REE double sulfates salts, as predicted by modeling, only one solid solution phase formed during precipitation.
Three washed samples were submitted to TGA analysis to determine their structural water content (conditions are specified in Section 2.3.2). The resulting thermograms are plotted in Figure 11. They show a reproducible weight loss between 180 °C and 500 °C, with an average value of about 5.3% ± 0.1%. This behavior is similar to the one reported by Kolcu et al. [41], who studied the thermal properties of certain Na–REE double sulfate monohydrates and revealed that a dehydration reaction occurs at a temperature below 300 °C. The authors measured weight losses of 5.0%, 4.8% and 5.0% for NaLa(SO4)2·H2O, NaCe(SO4)2·H2O and NaNd(SO4)2·H2O, respectively [41]. In the case of our product, the overall dehydration reaction can be drawn as shown in Equation (6).
Na 0 . 9 K 0 . 1 REEs SO 4 2 H 2 O ( s ) T ~ 300 ° C Na 0 . 9 K 0 . 1 REEs SO 4 2 ( s ) + H 2 O ( g )
The theoretical mass loss corresponding to Equation (6) (with the REE composition reported in Table 5) is 4.8%, which is in good accordance with the measured value of 5.3%. The TGA analysis thus confirms that the obtained product is a monohydrate salt.

3.4.2. Structural Characterization

As mentioned in Section 3.3.3, profile matching refinement of the XRD patterns (Figure 9c) showed that the crystal structure of the washed product corresponds to the NaCe(SO4)2·H2O structure type [42,43]. This structure belongs to the trigonal P3121 (152) space group symmetry with a = 7.0395(2) Å and c = 12.9679(3) Å. The unit cell volume (V), expressed in the hexagonal unit cell axes, is 556.52 Å3 (see Table 6). No other crystallized phase was detected in this product. The identification of a single di-sulfate phase despite the presence of several REE cations in the solid phase strongly suggests that the precipitation reaction forms a solid solution containing all REEs with the overall formula (Na,K)(La, Ce, Pr, Nd)(SO4)2·H2O. Due to their close chemical properties and sizes, REEs tend to form solid solutions in various types of compounds, including, for example, oxides [44], nitrates [45], or phosphates [46]. However, as pointed out by Lister et al. [47] the formation of solid solutions for REE–Na double sulfate salts has not been reported so far.
The potential of solid solution formation for such salts was evaluated based on the structural studies of Iyer et al. [49] and Denisenko et al. [50]. These studies have shown that the size of the crystal lattice of single NaREE(SO4)2·H2O double sulfate salts (considering 14 REEs, including La, Ce, Nd and Pr) is directly proportional to the size of the REE3+ cations. For this purpose, two simple salts (synth-La and synth-Ce) as well as a mixed salt (synth-LaCe) were prepared according to the protocol described in Section 2.4.1. XRD analyses of the three compounds showed that their crystal structure also corresponded to the NaREE(SO4)2·H2O structure type. Table 6 presents the structural data obtained from the XRD profile matching refinement. The lattice volumes of synthetic salts based on La and Ce that were prepared in the present work are nearly identical to those reported in the literature [43,48]. This validates our synthesis and XRD analysis protocols.
The unit cell volume variations of the salts show a regular lanthanide contraction from La to Ce as plotted in Figure 12c, where r L a I X 3 + = 1.216 Å and r C e I X 3 + = 1.196 Å according to Shannon’s ionic radii table [51]. As illustrated in Figure 12c, there is an excellent linear correlation between the ionic radii and unit cell volumes for La, mixed LaCe and Ce synthetic salts. The linear regression comes to:
V = 347 r REE IX 3 + + 136 . 6
where r R E E I X 3 + is the ionic radius of REE, Å; V is a unit cell volume, Å3.
The perfect agreement between the measured unit cell volume of the mixed salt and the weighted mean volume of the two simple salts NaLa(SO4)2·H2O (synth-La) and NaCe(SO4)2·H2O (synth-Ce) represented by Equation (7), is fully consistent with Vegard’s law and demonstrates the formation of a pure NaLa0.5Ce0.5(SO4)2·H2O solid solution. This is supported by the absence of any diffraction peak that could correspond to the pure salts on the XRD patterns of the mixed salt (see Figure 9c and the zoom of the XRD patterns presented in Figure 12a).
As illustrated in Figure 12c, the product obtained from the industrial PLS, which contains Pr and Nd in addition to La and Ce, also agrees well with Vegard’s law. Indeed, the experimental measurement of its unit cell volume indicated in Table 6 (with the corresponding refinement analysis given in Figure 12b) enables one to determine an average radius of r R E E I X 3 + = 1.210 Å.
It is also interesting to note that, by using the cationic distribution of 65%, 23.6%, 4.1% and 7.3% determined by ICP–OES (Table 5) for La3+, Ce3+, Pr3+ and Nd3+ respectively, and by using their ionic radii (1.216 Å, 1.196 Å, 1.179 Å and 1.163 Å, respectively according to Shannon’s ionic radii table [51]), an average r R E E I X 3 + = 1.206 Å is obtained. This calculated average REE ionic radius is in rather good accordance with the average radius determined by XRD. The small difference (0.3%) between the ionic radius determined from XRD refinement analysis (1.210 Å) and the average ionic radius determined from the overall composition (1.206 Å) may arise from the error of ICP analysis as well as from an error in the estimation of the linear contraction of the lattice (Equation (7)). Indeed, Equation (7) is only determined for La and Ce, i.e., for ionic radii greater than 1.196 Å. Considering the idea that this equation may have a slightly lower slope over a broader range of ionic radii, as proposed by Denisenko et al. [50] ( V = 346 · r R E E I X 3 + + 138.8 for Dy-La), or even by Iyer et al. [49] ( V = 299 · r R E E I X 3 + + 194.0 for Er-La), the average ionic radius of REEs determined by XRD could be reduced and converge with that calculated from cationic distribution.
The structural analysis thus confirms the formation of a single solid solution NaREE(SO4)2·H2O rather than a mixture of several individual phases, which is consistent with the simultaneous precipitation of REEs (Figure 4). Meanwhile, K on the Na site of the NaREE(SO4)2·H2O structure was not quantified by XRD analysis, this is likely due to the low and relatively constant concentration of K in the solids. Furthermore, the unit cell volume variation of NaREE(SO4)2·H2O is not significantly affected by the Na-site substitution, as it is mainly governed by the efficient REE3+ ion radius with coordination number 9 [50]. However, although not quantifiable by profile matching refinement, the substitution of Na+ by K+ on the same crystallographic site is very likely. Based on the chemical analysis of the solid samples (Table 4), the proposed chemical formula for the crystallized phase obtained from the industrial PLS finally comes to (Na0.9K0.1)(La0.65Ce0.24Pr0.04Nd0.07)(SO4)2·H2O.

3.5. Discussion about the Thermodynamic Model

As described in Section 3.1, when calculating the equilibrium between the PLS and the Na2SO4 solution, the thermodynamic model embedded in the OLI software predicted the formation of four individual doubles salts and partially sequential precipitation of REE ions due to slightly different equilibrium constants for each REE. This contrasts significantly with the compound (Na0.9K0.1)(La0.65Ce0.24Pr0.04Nd0.07)(SO4)2·H2O identified in the present work. Although the model is, to our knowledge, the best available option that accurately represents the influence of Na:REE ratio on the overall precipitation yield of REEs (Figure 5b), it does not consider two main features of this complex chemical system.
Firstly, the formation of KREE(SO4)2·H2O salts according to Equation (5), which have low solubility in sulfuric acid media (Figure 2), should be considered, due to the presence of K+ ions in the PLS originating from the electrolyte of Ni–MH batteries (Table 1). Nonetheless, the current OLI–MSE model mentioned in Section 3.1 does not include the K element and therefore cannot represent such solid phases.
Secondly, our experimental work has demonstrated that the solid product is composed of a solid solution of the four lanthanides, and potentially a mixture of Na and K salts, which is not taken into account in the current model. One of the main consequences of the model’s limitation is that the individual behavior of each REE is not well predicted, as illustrated in Figure 5a. Indeed, among the four single Na–REE (REE = La, Ce, Pr and Nd) salts, the Na–Ce double sulfate has the highest solubility constant (e.g., 2.095 × 10⁻¹⁸ at 25 °C) in the MSE database. Therefore, the calculation predicts that the Na–Ce salt precipitation yield is lower than other REEs (Figure 3). When the solid solution forms instead of individual salts, the solubility constant of each compound is modified due to additional mixing enthalpies, and the Na–Ce salt becomes less soluble. Thus, the calculated precipitation yield for Ce (89.3%) is significantly lower than the measured value (98.8%). This effect is reversed for the Na–La salt, which becomes slightly more soluble when mixed in the solid solution. This is why the predicted La precipitation yield is higher than what was measured.

4. Conclusions

This paper has focused on the REE selective precipitation from acid leachates derived from an industrial black mass prepared from spent Ni–MH batteries. Based on the already established method of REE precipitation in the form of sodium–lanthanide double sulfate salts, an industrial starting material was studied with the specific objective of obtaining a better characterization of the obtained product and a better understanding of the parameters driving its purity. The main findings regarding the precipitation reaction and down-stream processing are as follows:
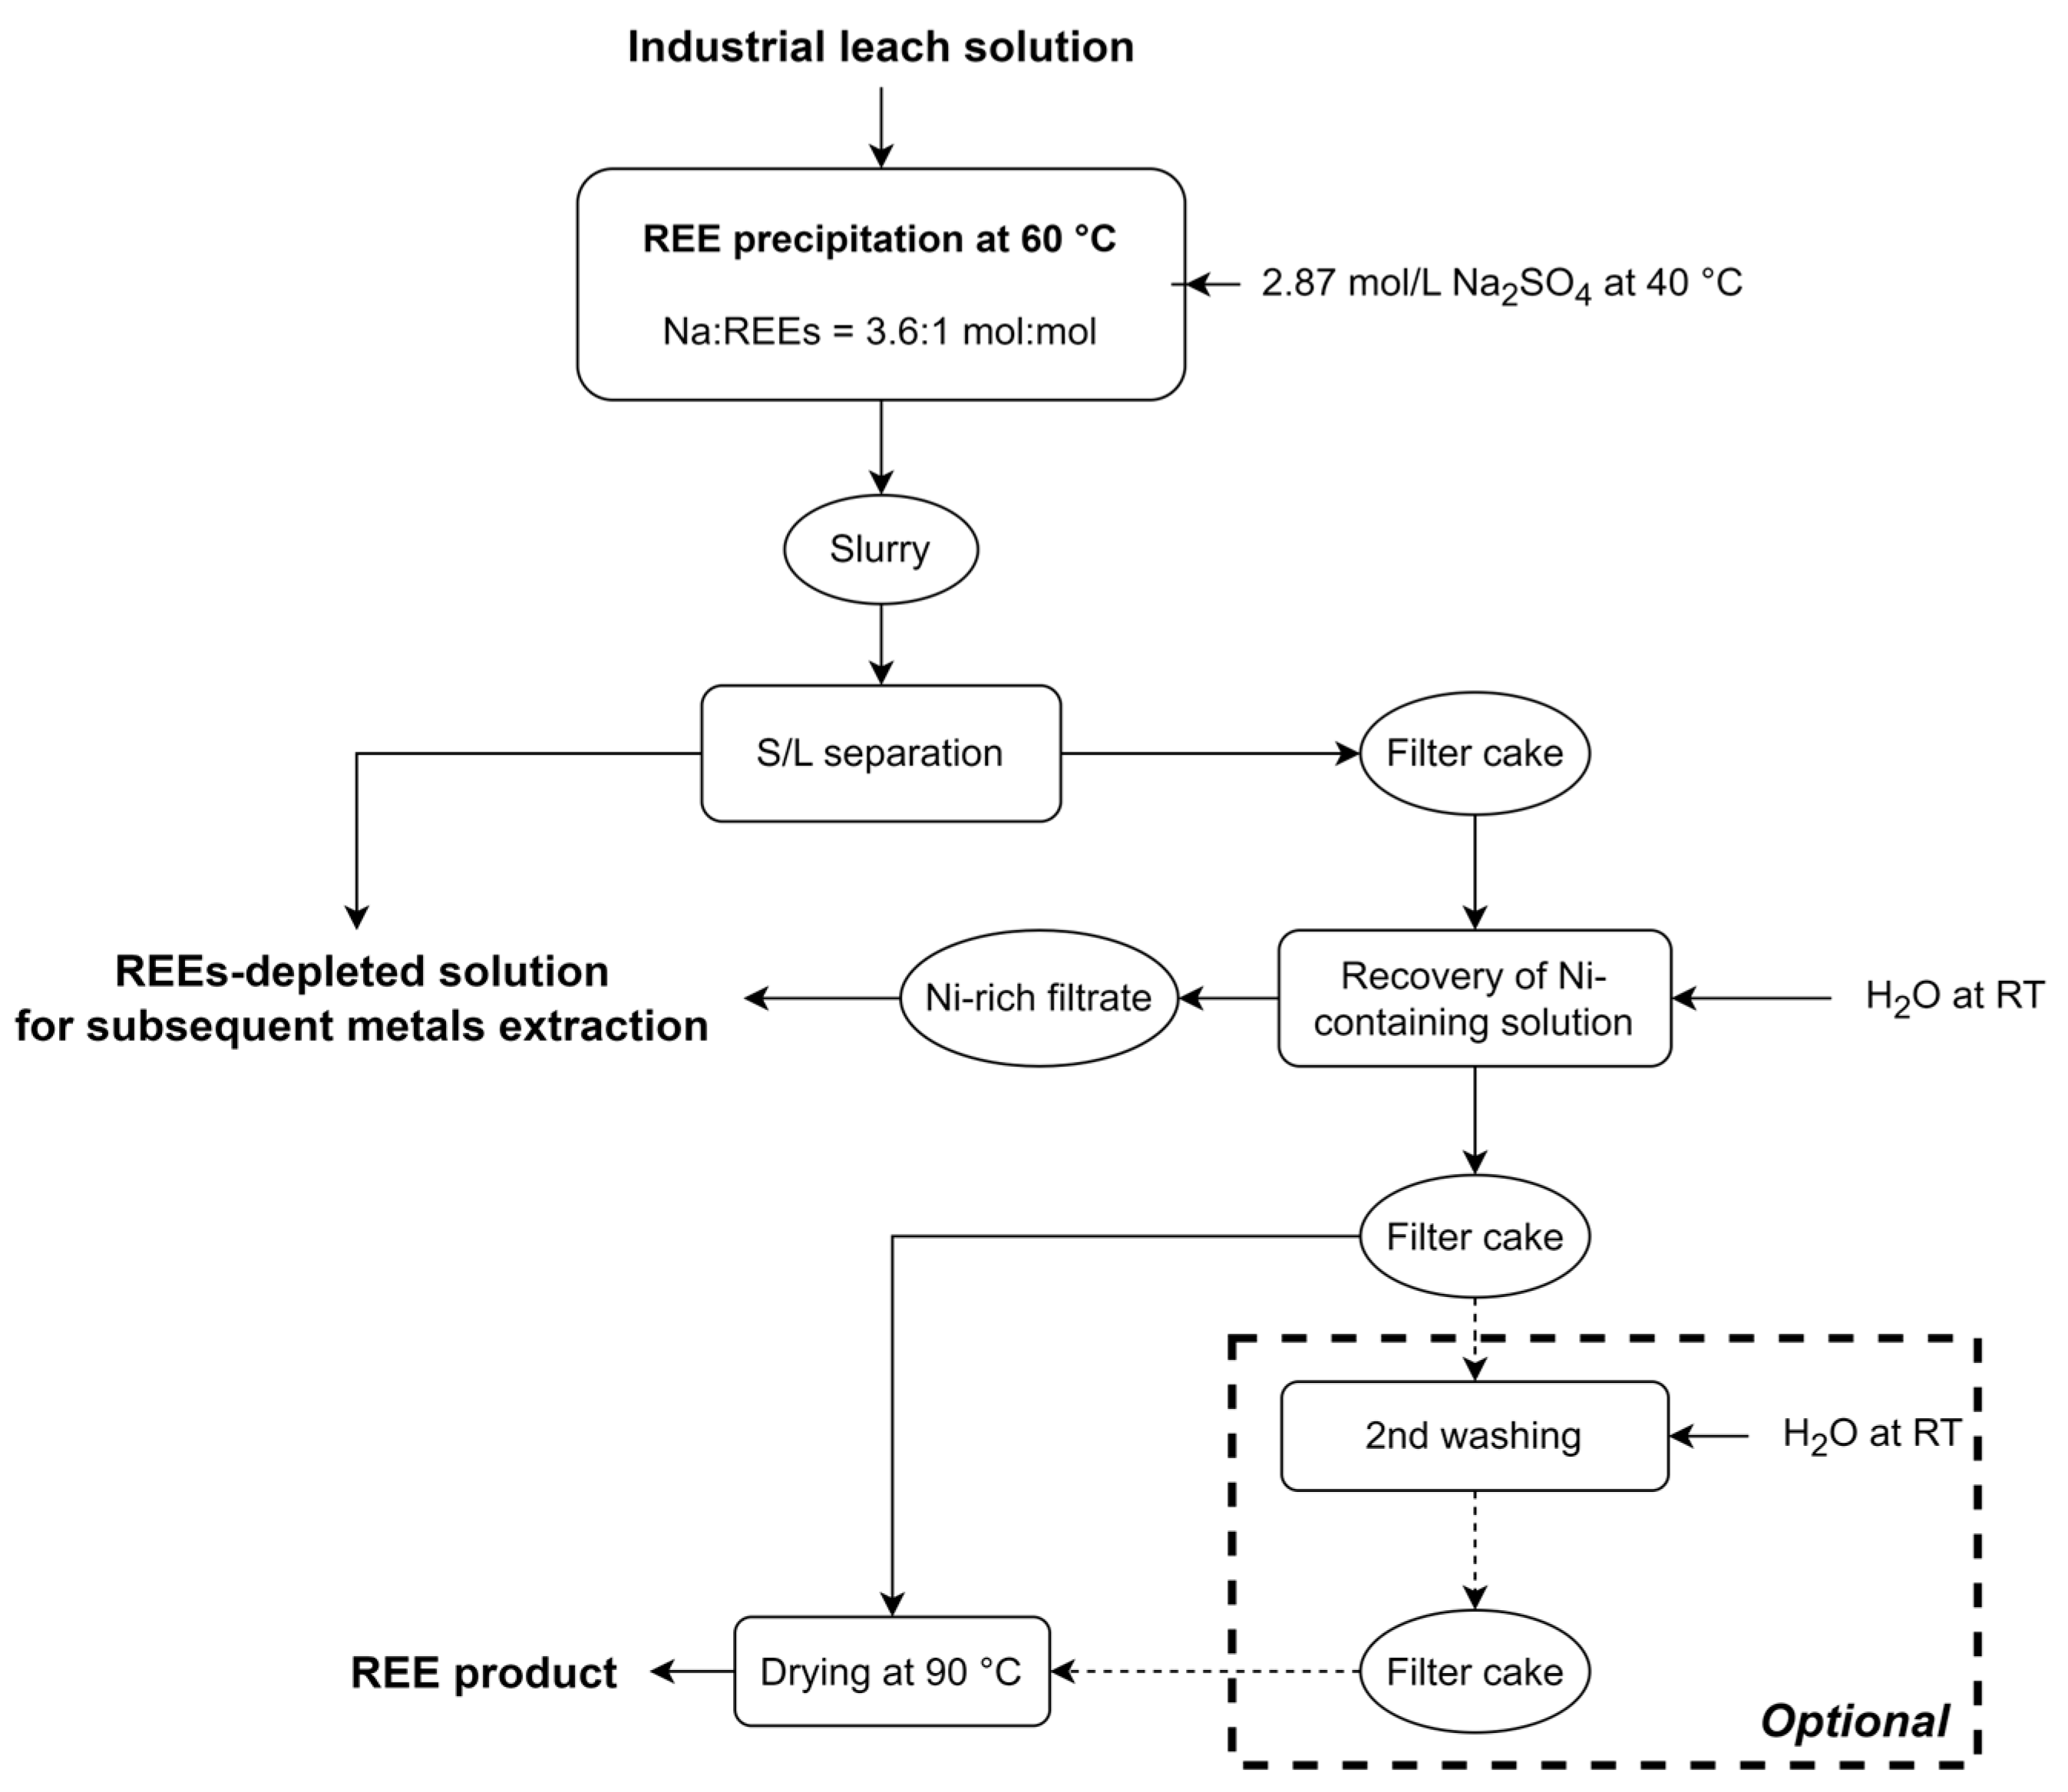
  • In addition to the observed robustness and efficiency of the reaction involving Na2SO4 as a reactant already shown in previous studies, this study demonstrates that, under suitable operating conditions (Na:REE = 3.6 and T = 60 °C), high (>95%) precipitation yields of REEs can be obtained in a large range of hydrodynamic conditions (flow rate of the precipitation agent and stirring rate in the precipitation reactor). This indicates that process scale-up should lead to performant and cost-effective operations compared with solvent extraction processes.
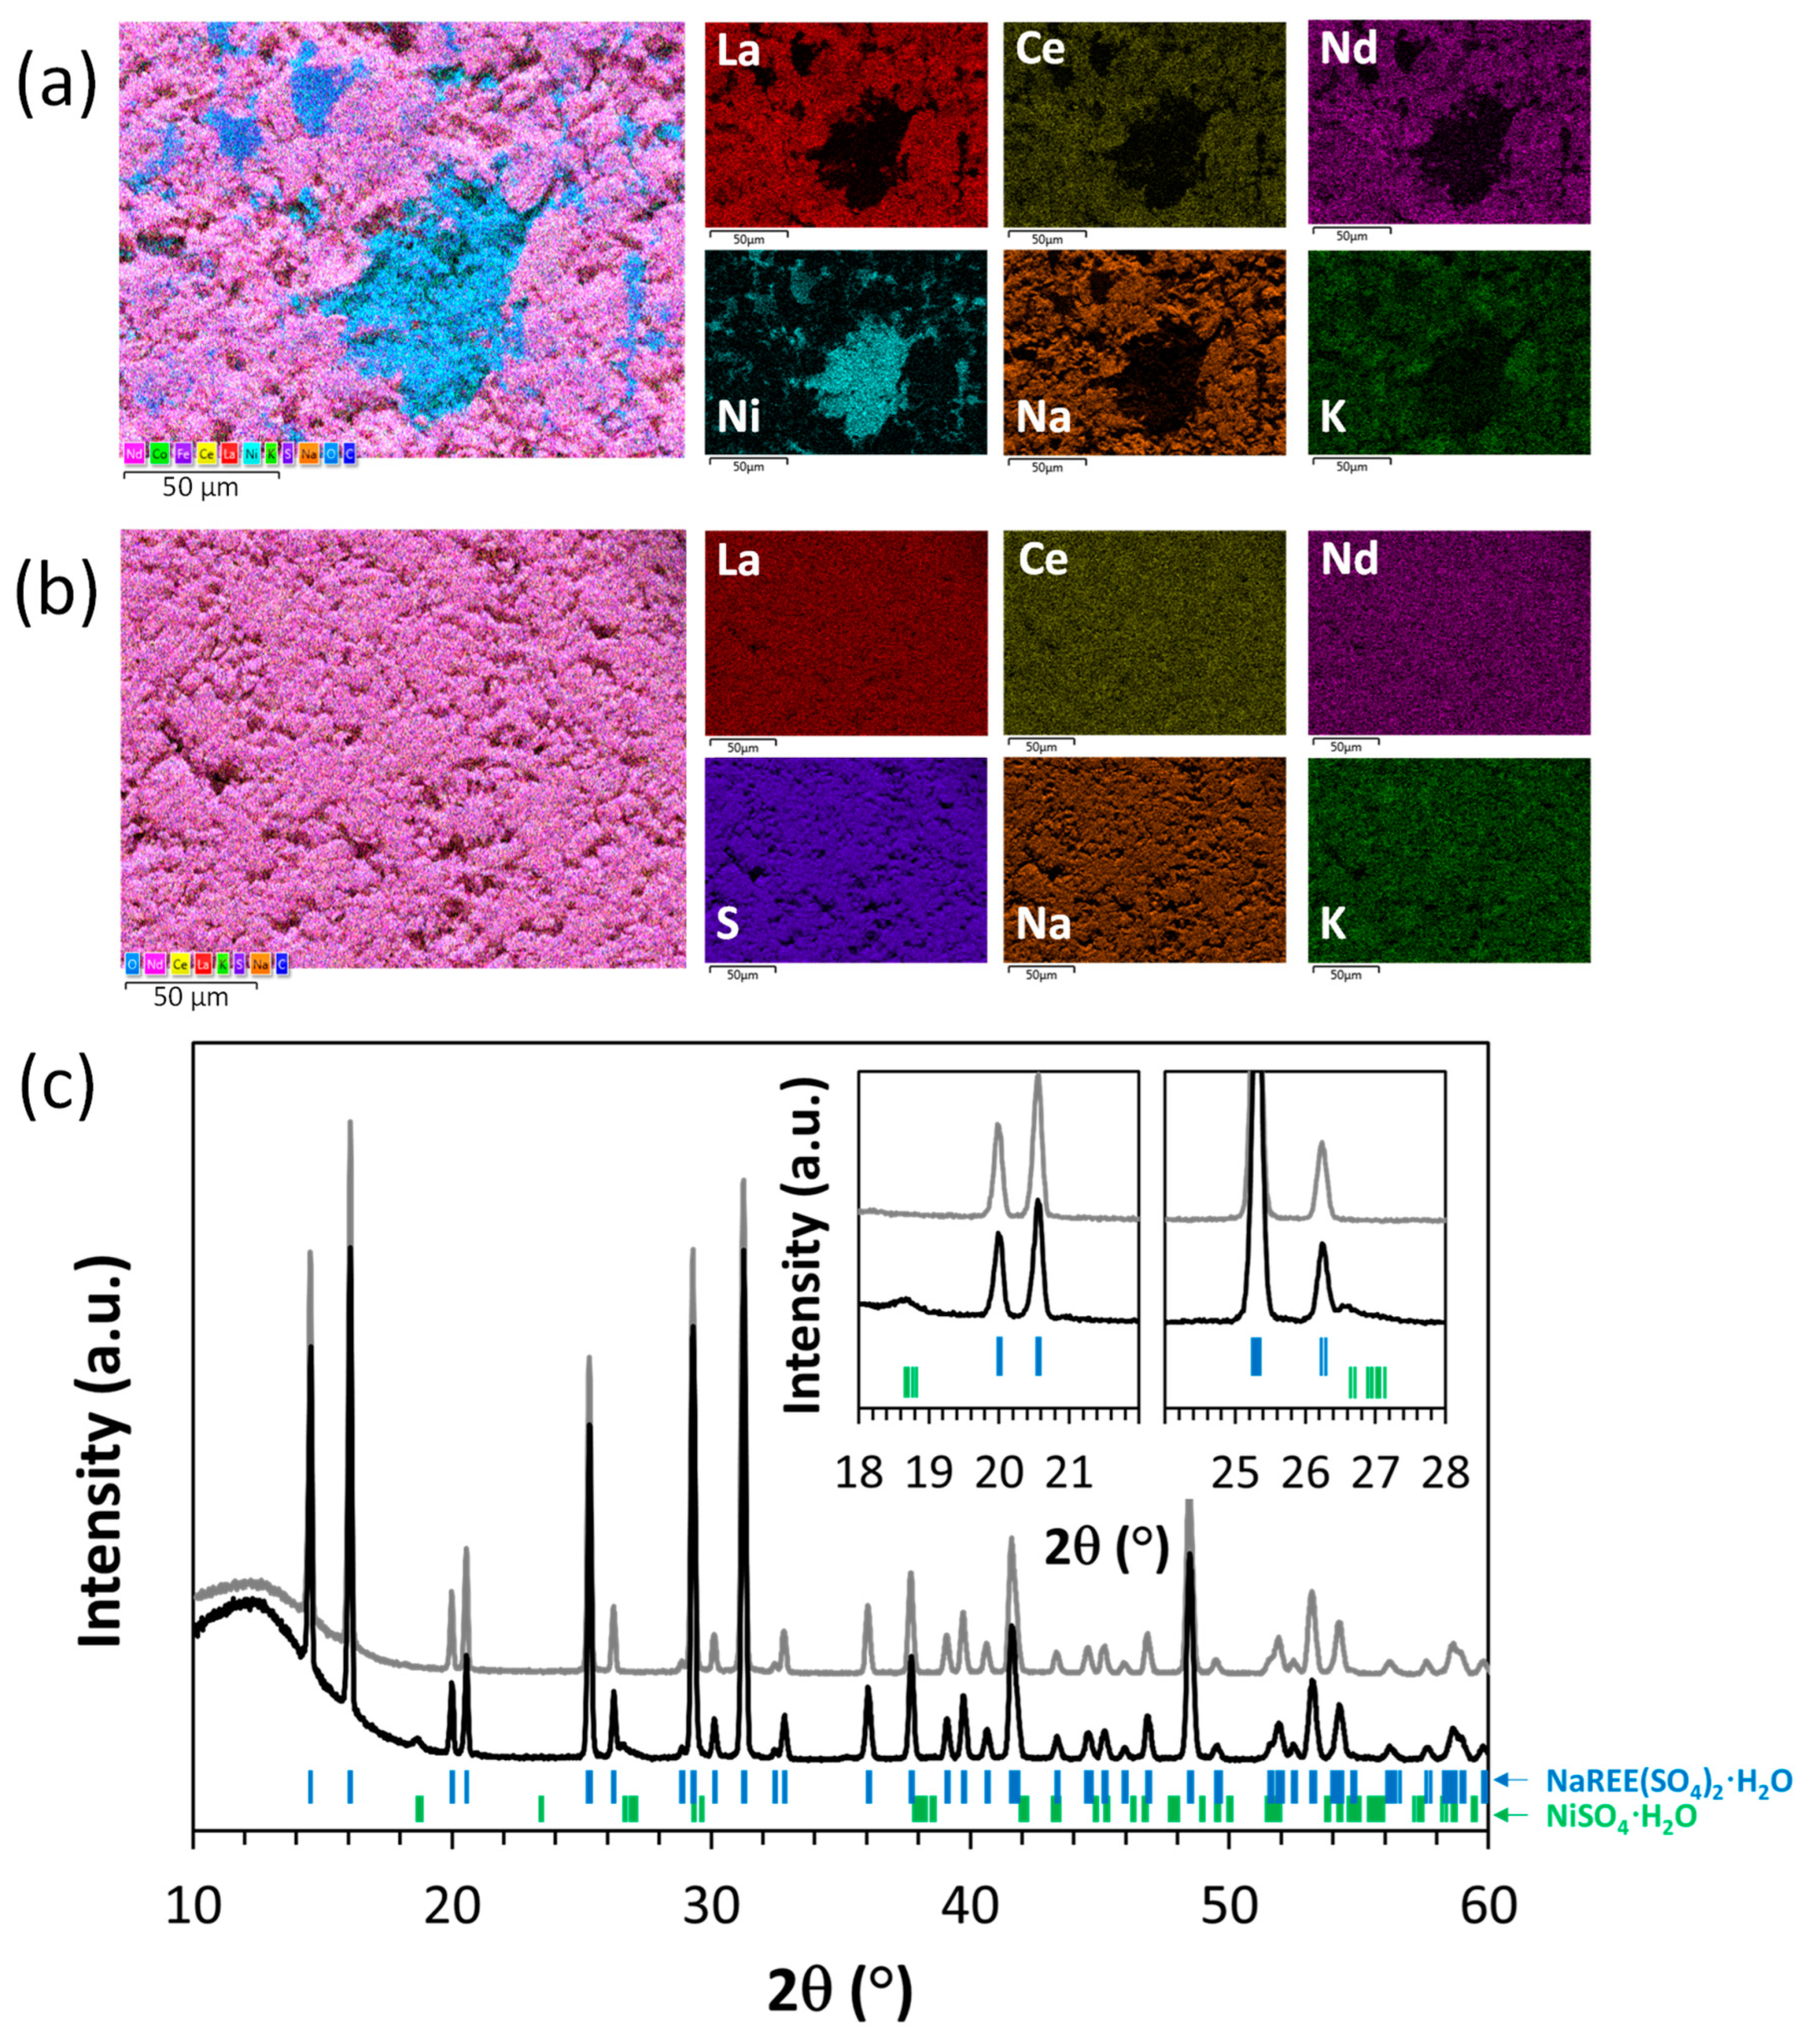
  • The contamination of the REE product by the main elements of the PLS is mainly attributed to the residual solution remaining in the filter cake (which contained about 28 wt% moisture) and not a result of a concurrent precipitation reaction. Specifically, the non-washed product has been shown to contain nickel sulfate formed from the residual solution during the drying of the filter cake.
  • Washing the wet filter cake with pure water enables the recovery of a concentrated nickel sulfate solution that can be reintegrated in the REEs-depleted PLS, thereby enhancing the overall recovery of Ni (99%).
  • Washing the wet filter cake with pure water appears to be highly effective in removing impurities from the solid product. In fact, the contamination of Ni in the dried product was significantly decreased from above 20 mg/g to approximately 1 mg/g, while other impurities (Fe, Al, Co, Zn, Mn) were below 1 mg/g. The amount of washing water to be used is then a tradeoff between the targeted purity, the re-dissolution of REEs (which lowers the overall REE recovery yield), and the amount of wastewater generated.
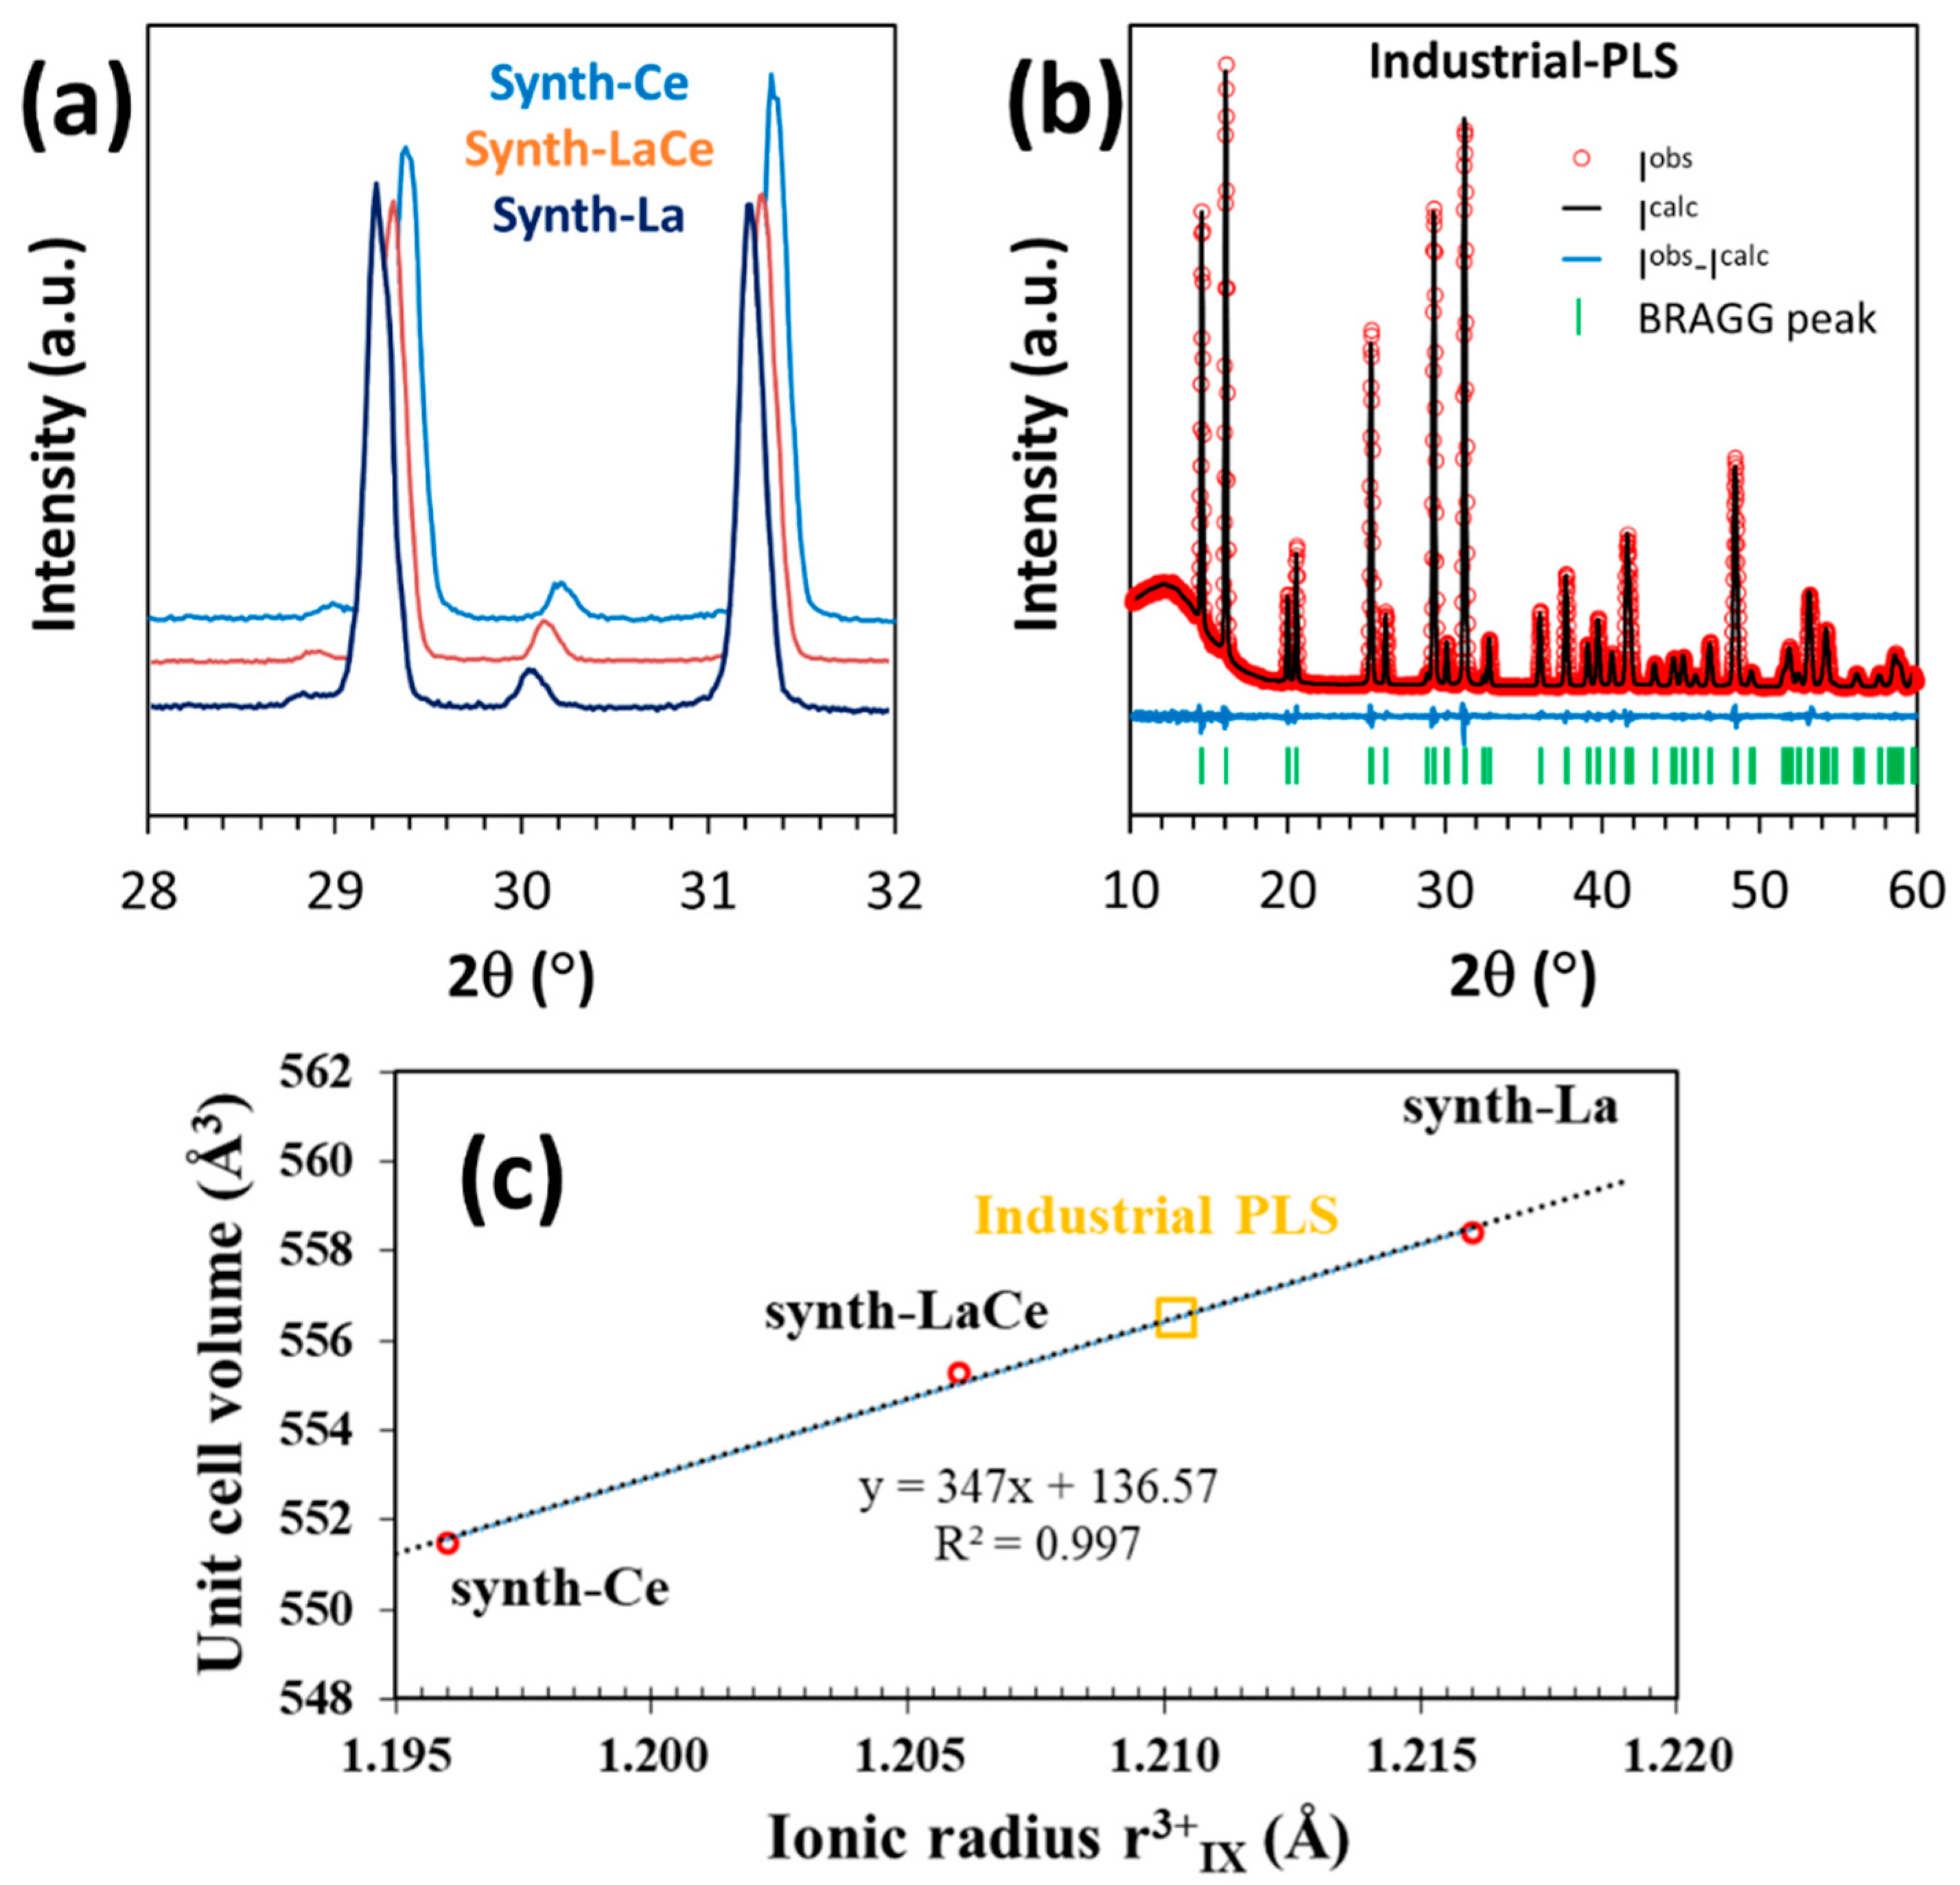
  • Structural analyses of the product, along with synthetic double sulfate salts prove that the precipitate is a solid solution rather than a mixture of individual REE salts. To our knowledge, this is the first time that such sodium-REE double sulfate solid solution is evidenced.
  • The chemical formula of the obtained solid phase can be expressed as (Na0.9K0.1)(La0.65Ce0.24Pr0.04Nd0.07)(SO4)2·H2O. The quantitative presence of K in the precipitation product is an important point associated with the use of an industrial PLS.
As already envisaged in recent research [52,53], further processing of the obtained double sulfate salts is crucial to produce REE products free from sulfates and alkaline elements. This can be achieved by conversion to hydroxides, oxalates or carbonates. Our findings emphasize that this processing should (i) take into account the presence of K in the chemical system and (ii) precisely monitor the behavior of other low-concentrated impurities (e.g., Ni) in order to adjust the washing step based on various constraints such as wastewater volumes, REE recovery yield, and the required purity of the end product.

Supplementary Materials

The following supporting information can be downloaded at: https://www.mdpi.com/article/10.3390/batteries9120574/s1, Figure S1: EDS spectrum of non-washed sample; Figure S2: EDS spectrum of washed sample.

Author Contributions

B.G.: experimentation, formal analysis, investigation, methodology, writing—original draft; L.C.: conceptualization, funding acquisition, supervision, writing—review and editing; A.B.: complementary characterization experimentation, formal analysis, review; N.C.: methodology, investigation, resources; B.B.: conceptualization, funding acquisition, project administration, supervision, writing—review and editing. All authors have read and agreed to the published version of the manuscript.

Funding

This work was financially supported by Region Occitanie (contract N° ALDOCT 000983—Prebathy) and CNRS-MITI (AAP Metallo-Mix 2021–2022, project Recycl’Bat).

Data Availability Statement

The data presented in this study are available on request from the corresponding author.

Conflicts of Interest

Author Nicolas Coppey is employed by the Société Nouvelle d’Affinage des Métaux (SNAM Groupe). The remaining authors declare that the research was conducted in the absence of any commercial or financial relationships that could be construed as a potential conflict of interest.

References

  1. Binnemans, K.; Jones, P.T.; Blanpain, B.; Van Gerven, T.; Yang, Y.; Walton, A.; Buchert, M. Recycling of Rare Earths: A Critical Review. J. Clean. Prod. 2013, 51, 1–22. [Google Scholar] [CrossRef]
  2. Bertuol, D.A.; Bernardes, A.M.; Tenório, J.A.S. Spent NiMH Batteries: Characterization and Metal Recovery through Mechanical Processing. J. Power Sources 2006, 160, 1465–1470. [Google Scholar] [CrossRef]
  3. Zhang, P.; Yokoyama, T.; Itabashi, O.; Wakui, Y.; Suzuki, T.M.; Inoue, K. Hydrometallurgical Process for Recovery of Metal Values from Spent Nickel-Metal Hydride Secondary Batteries. Hydrometallurgy 1998, 50, 61–75. [Google Scholar] [CrossRef]
  4. Al-Thyabat, S.; Nakamura, T.; Shibata, E.; Iizuka, A. Adaptation of Minerals Processing Operations for Lithium-Ion (LiBs) and Nickel Metal Hydride (NiMH) Batteries Recycling: Critical Review. Miner. Eng. 2013, 45, 4–17. [Google Scholar] [CrossRef]
  5. Bernard, P.; Lippert, M. Nickel-Cadmium and Nickel-Metal Hydride Battery Energy Storage. In Electrochemical Energy Storage for Renewable Sources and Grid Balancing; Elsevier B.V.: Amsterdam, The Netherlands, 2015; pp. 223–251. ISBN 9780444626103. [Google Scholar]
  6. Dunn, B.; Kamath, H.; Tarascon, J.M. Electrical Energy Storage for the Grid: A Battery of Choices. Science 2011, 334, 928–935. [Google Scholar] [CrossRef]
  7. Lin, S.L.; Huang, K.L.; Wang, I.C.; Chou, I.C.; Kuo, Y.M.; Hung, C.H.; Lin, C. Characterization of Spent Nickel–Metal Hydride Batteries and a Preliminary Economic Evaluation of the Recovery Processes. J. Air Waste Manag. Assoc. 2016, 66, 296–306. [Google Scholar] [CrossRef] [PubMed]
  8. Lucas, J.; Lucas, P.; Le Mercier, T.; Rollat, A.; Davenport, W. Rare Earths in Rechargeable Batteries. In Rare Earths; Elsevier B.V.: Amsterdam, The Netherlands, 2015; pp. 167–180. ISBN 9780444627353. [Google Scholar]
  9. Blengini, G.A.; Latunussa, C.E.L.; Eynard, U.; Torres de Matos, C.; Wittmer, D.; Georgitzikis, K.; Pavel, C.; Carrara, S.; Mancini, L.; Unguru, M.; et al. Study on the EU’s List of Critical Raw Materials (2020) Final Report; Publications Office of the European Union: Luxembourg, 2020. [Google Scholar]
  10. Cassayre, L.; Guzhov, B.; Zielinski, M.; Biscans, B. Chemical Processes for the Recovery of Valuable Metals from Spent Nickel Metal Hydride Batteries: A Review. Renew. Sustain. Energy Rev. 2022, 170, 112983. [Google Scholar] [CrossRef]
  11. Salehi, H.; Maroufi, S.; Mofarah, S.S.; Nekouei, R.K.; Sahajwalla, V. Recovery of Rare Earth Metals from Ni-MH Batteries: A Comprehensive Review. Renew. Sustain. Energy Rev. 2023, 178, 113248. [Google Scholar] [CrossRef]
  12. Tanji, K.; Ouzaouit, K.; Belghiti, M.; Lamsayety, I.; Faqir, H.; Benzakour, I. Hydrometallurgy Two Stage Process for Preparation of (Nd, La, Ce)2O3 from End-of-Life NiMH Batteries. J. Rare Earths 2023, (in press). [Google Scholar] [CrossRef]
  13. Zhang, P.; Yokoyama, T.; Itabashi, O.; Wakui, Y.; Suzuki, T.M.; Inoue, K. Recovery of Metal Values from Spent Nickel-Metal Hydride Rechargeable Batteries. J. Power Sources 1999, 77, 116–122. [Google Scholar] [CrossRef]
  14. Larsson, K.; Ekberg, C.; Degaard-Jensen, A. Using Cyanex 923 for Selective Extraction in a High Concentration Chloride Medium on Nickel Metal Hydride Battery Waste. Hydrometallurgy 2012, 129–130, 35–42. [Google Scholar] [CrossRef]
  15. Larsson, K.; Ekberg, C.; Ødegaard-Jensen, A. Using Cyanex 923 for Selective Extraction in a High Concentration Chloride Medium on Nickel Metal Hydride Battery Waste: Part II: Mixer-Settler Experiments. Hydrometallurgy 2013, 133, 168–175. [Google Scholar] [CrossRef]
  16. Fernandes, A.; Afonso, J.C.; Dutra, A.J.B. Separation of Nickel(II), Cobalt(II) and Lanthanides from Spent Ni-MH Batteries by Hydrochloric Acid Leaching, Solvent Extraction and Precipitation. Hydrometallurgy 2013, 133, 37–43. [Google Scholar] [CrossRef]
  17. Jha, M.K.; Choubey, P.K.; Dinkar, O.S.; Panda, R.; Jyothi, R.K.; Yoo, K.; Park, I. Recovery of Rare Earth Metals (Rems) from Nickel Metal Hydride Batteries of Electric Vehicles. Minerals 2022, 12, 34. [Google Scholar] [CrossRef]
  18. Liu, C.; Deng, Y.; Chen, J.; Zou, D.; Su, W. Integrated Process to Recover NiMH Battery Anode Alloy with Selective Leaching and Multistage Extraction. Ind. Eng. Chem. Res. 2017, 56, 7551–7558. [Google Scholar] [CrossRef]
  19. Tzanetakis, N.; Scott, K. Recycling of Nickel-Metal Hydride Batteries. I: Dissolution and Solvent Extraction of Metals. J. Chem. Technol. Biotechnol. 2004, 79, 919–926. [Google Scholar] [CrossRef]
  20. Pospiech, B.; Gega, J. Solvent Extraction of Metal Ions from Sulfate Solutions Obtained in Leaching of Spent Ni-MH Batteries. New Trends Prod. Eng. 2019, 2, 214–221. [Google Scholar] [CrossRef]
  21. Zhang, W.; Noble, A.; Ji, B.; Li, Q. Effects of Contaminant Metal Ions on Precipitation Recovery of Rare Earth Elements Using Oxalic Acid. J. Rare Earths 2020, 40, 482–490. [Google Scholar] [CrossRef]
  22. Pietrelli, L.; Bellomo, B.; Fontana, D.; Montereali, M.R. Rare Earths Recovery from NiMH Spent Batteries. Hydrometallurgy 2002, 66, 135–139. [Google Scholar] [CrossRef]
  23. Ahn, N.K.; Shim, H.W.; Kim, D.W.; Swain, B. Valorization of Waste NiMH Battery through Recovery of Critical Rare Earth Metal: A Simple Recycling Process for the Circular Economy. Waste Manag. 2020, 104, 254–261. [Google Scholar] [CrossRef]
  24. Bertuol, D.A.; Bernardes, A.M.; Tenório, J.A.S. Spent NiMH Batteries-The Role of Selective Precipitation in the Recovery of Valuable Metals. J. Power Sources 2009, 193, 914–923. [Google Scholar] [CrossRef]
  25. Innocenzi, V.; Vegliò, F. Recovery of Rare Earths and Base Metals from Spent Nickel-Metal Hydride Batteries by Sequential Sulphuric Acid Leaching and Selective Precipitations. J. Power Sources 2012, 211, 184–191. [Google Scholar] [CrossRef]
  26. Rodrigues, L.E.O.C.; Mansur, M.B. Hydrometallurgical Separation of Rare Earth Elements, Cobalt and Nickel from Spent Nickel-Metal-Hydride Batteries. J. Power Sources 2010, 195, 3735–3741. [Google Scholar] [CrossRef]
  27. Meshram, P.; Pandey, B.D.; Mankhand, T.R. Process Optimization and Kinetics for Leaching of Rare Earth Metals from the Spent Ni-Metal Hydride Batteries. Waste Manag. 2016, 51, 196–203. [Google Scholar] [CrossRef]
  28. Korkmaz, K.; Alemrajabi, M.; Rasmuson, Å.C.; Forsberg, K.M. Sustainable Hydrometallurgical Recovery of Valuable Elements from Spent Nickel-Metal Hydride HEV Batteries. Metals 2018, 8, 1062. [Google Scholar] [CrossRef]
  29. Nan, J.; Han, D.; Yang, M.; Cui, M. Dismantling, Recovery, and Reuse of Spent Nickel–Metal Hydride Batteries. J. Electrochem. Soc. 2006, 153, A101–A105. [Google Scholar] [CrossRef]
  30. Nan, J.; Han, D.; Yang, M.; Cui, M.; Hou, X. Recovery of Metal Values from a Mixture of Spent Lithium-Ion Batteries and Nickel-Metal Hydride Batteries. Hydrometallurgy 2006, 84, 75–80. [Google Scholar] [CrossRef]
  31. Porvali, A.; Ojanen, S.; Wilson, B.P.; Serna-Guerrero, R.; Lundström, M. Nickel Metal Hydride Battery Waste: Mechano-Hydrometallurgical Experimental Study on Recycling Aspects. J. Sustain. Metall. 2020, 6, 78–90. [Google Scholar] [CrossRef]
  32. Porvali, A.; Wilson, B.P.; Lundström, M. Lanthanide-Alkali Double Sulfate Precipitation from Strong Sulfuric Acid NiMH Battery Waste Leachate. Waste Manag. 2018, 71, 381–389. [Google Scholar] [CrossRef]
  33. Said, A.; Lundström, M.; Louhi-Kultanen, M. Recovery of Lanthanum from Aqueous Solutions by Crystallization as Lanthanum Sodium Sulfate Double Salt. Jom 2022, 74, 3010–3020. [Google Scholar] [CrossRef]
  34. Takano, M.; Asano, S.; Goto, M. Recovery of Nickel, Cobalt and Rare-Earth Elements from Spent Nickel–Metal-Hydride Battery: Laboratory Tests and Pilot Trials. Hydrometallurgy 2022, 209, 105826. [Google Scholar] [CrossRef]
  35. Zielinski, M.; Cassayre, L.; Coppey, N.; Biscans, B. Pilot-Scale Lanthanide Precipitation from Sulfate-Based Spent Ni-MH Battery Leachates: Thermodynamic-Based Choice of Operating Conditions. Cryst. Growth Des. 2021, 21, 5943–5954. [Google Scholar] [CrossRef]
  36. Wang, P.; Anderko, A.; Young, R.D. A Speciation-Based Model for Mixed-Solvent Electrolyte Systems. Fluid Phase Equilibria 2002, 203, 141–176. [Google Scholar] [CrossRef]
  37. Das, G.; Lencka, M.M.; Eslamimanesh, A.; Wang, P.; Anderko, A.; Riman, R.E.; Navrotsky, A. Rare Earth Sulfates in Aqueous Systems: Thermodynamic Modeling of Binary and Multicomponent Systems over Wide Concentration and Temperature Ranges. J. Chem. Thermodyn. 2019, 131, 49–79. [Google Scholar] [CrossRef]
  38. Le Bail, A.; Duroy, H.; Fourquet, J.L. Ab-Initio Structure Determination of LiSbWO6 by X-ray Powder Diffraction. Mater. Res. Bull. 1988, 23, 447–452. [Google Scholar] [CrossRef]
  39. Rodríguez-Carvajal, J. Recent Advances in Magnetic Structure Determination by Neutron Powder Diffraction. Phys. B Phys. Condens. Matter 1993, 192, 55–69. [Google Scholar] [CrossRef]
  40. Lokshin, E.P.; Tareeva, O.A.; Ivlev, K.G.; Kashulina, T.G. Solubility of Double Alkali Metal (Na, K) Rare-Earth (La, Ce) Sulfates in Sulfuric-Phosphoric Acid Solutions at 20 °C. Russ. J. Appl. Chem. 2005, 78, 1058–1063. [Google Scholar] [CrossRef]
  41. Kolcu, Ö.; Zümreoǧlu-Karan, B. Thermal Properties of Sodium—Light-Lanthanoid Double Sulfate Monohydrates. Thermochim. Acta 1994, 240, 185–198. [Google Scholar] [CrossRef]
  42. Lindgren, O.; Oinonen, L.; Salomaa, P.; Svanholt, H.; Hagenmuller, P.; Andresen, A.F. The Crystal Structure of Sodium Cerium(III) Sulfate Hydrate, NaCe(SO4)2.H2O. Acta Chem. Scand. 1977, 31, 591–594. [Google Scholar] [CrossRef]
  43. Blackburn, A.C.; Gerkin, R.E. Redetermination of Sodium Cerium(III) Sulfate Monohydrate, NaCe(SO4)2.H2O. Acta Crystallogr. Sect. C Cryst. Struct. Commun. 1995, 51, 2215–2218. [Google Scholar] [CrossRef]
  44. Schneider, S.J.; Roth, R.S. Phase Equilibria in Systems Involving the Rare-Earth Oxides. Part II. Solid State Reactions in Trivalent Rare-Earth Oxide Systems. J. Res. Natl. Bur. Stand. Sect. A Phys. Chem. 1960, 64, 317–332. [Google Scholar] [CrossRef]
  45. Lassin, A.; Guignot, S.; Lach, A.; Christov, C.; André, L.; Madé, B. Modeling the Solution Properties and Mineral-Solution Equilibria in Radionuclide-Bearing Aqueous Nitrate Systems: Application to Binary and Ternary Systems Containing U, Th, or Lanthanides at 25 °C. J. Chem. Eng. Data 2020, 65, 3613–3626. [Google Scholar] [CrossRef]
  46. Strzelecki, A.C.; Reece, M.; Zhao, X.; Yu, W.; Benmore, C.; Ren, Y.; Alcorn, C.; Migdisov, A.; Xu, H.; Guo, X. Crystal Chemistry and Thermodynamics of HREE (Er, Yb) Mixing in a Xenotime Solid Solution. ACS Earth Space Chem. 2022, 6, 1375–1389. [Google Scholar] [CrossRef]
  47. Lister, T.E.; Meagher, M.; Strauss, M.L.; Diaz, L.A.; Rollins, H.W.; Das, G.; Lencka, M.M.; Anderko, A.; Riman, R.E.; Navrotsky, A. Recovery of Rare Earth Elements from Recycled Hard Disk Drive Mixed Steel and Magnet Scrap. In Rare Metal Technology 2021; Minerals, Metals and Materials Series; Springer International Publishing: Berlin/Heidelberg, Germany, 2021; pp. 139–154. [Google Scholar] [CrossRef]
  48. Blackburn, A.C.; Gerkin, R.E. Sodium Lanthanum(III) Sulfate Monohydrate, NaLa(SO4)2.H2O. Acta Crystallogr. Sect. C Cryst. Struct. Commun. 1994, 50, 833–838. [Google Scholar] [CrossRef]
  49. Iyer, P.N.; Natarajan, P.R. Double Sulphates of Plutonium(III) and Lanthanides with Sodium. J. Less-Common Met. 1989, 146, 161–166. [Google Scholar] [CrossRef]
  50. Denisenko, Y.G.; Sedykh, A.E.; Basova, S.A.; Atuchin, V.V.; Molokeev, M.S.; Aleksandrovsky, A.S.; Krylov, A.S.; Oreshonkov, A.S.; Khritokhin, N.A.; Sal’nikova, E.I.; et al. Exploration of the Structural, Spectroscopic and Thermal Properties of Double Sulfate Monohydrate NaSm(SO4)2·H2O and Its Thermal Decomposition Product NaSm(SO4)2. Adv. Powder Technol. 2021, 32, 3943–3953. [Google Scholar] [CrossRef]
  51. Shannon, R.D. Revised Effective Ionic Radii and Systematic Studies of Interatomic Distances in Halides and Chalcogenides. Acta Crystallogr. Sect. A 1976, 32, 751–767. [Google Scholar] [CrossRef]
  52. Ahn, N.K.; Swain, B.; Shim, H.W.; Kim, D.W. Recovery of Rare Earth Oxide Fromwaste NiMH Batteries by Simple Wet Chemical Valorization Process. Metals 2019, 9, 1151. [Google Scholar] [CrossRef]
  53. Porvali, A.; Agarwal, V.; Lundström, M. REE(III) Recovery from Spent NiMH Batteries as REE Double Sulfates and Their Simultaneous Hydrolysis and Wet-Oxidation. Waste Manag. 2020, 107, 66–73. [Google Scholar] [CrossRef]
Figure 1. Precipitation/washing/drying protocol for the study of REE double sulfate production from spent Ni–MH battery leachate.
Batteries 09 00574 g001
Figure 2. Solubility of La (a) and Ce (b) salts (g of REE/L of solution) in H2SO4–H2O media at 25 °C (calculated with OLI–MSE [35]; experimental data for Na, K–La, Ce double sulfate salts from Lokshin et al. [40]).
Batteries 09 00574 g002
Figure 3. Rates of metal elements in solution calculated at thermodynamic equilibria as a function of the addition of 2.87 mol/L Na2SO4 solution in the industrial PLS at 60 °C.
Batteries 09 00574 g003
Figure 4. Evolution of the REE concentrations in the aqueous phase with time during the addition of 2.87 mol/L Na2SO4 solution at 60 °C and ripening time for 1 h.
Batteries 09 00574 g004
Figure 5. (a) Comparison of experimental and calculated yields of precipitation of rare earth elements after standard precipitation experiment (60 °C, 7 g/min of 2.87 mol/L Na2SO4, Na:REE = 3.6:1, 550 rpm, 1 h of ripening) and (b) comparison between calculated and experimental amount of REEs in solution as a function of the Na:REE molar ratio (with exp. data from [31,35]).
Batteries 09 00574 g005
Figure 6. Influence of hydrodynamic parameters on the precipitation reaction of REEs (a) stirring rate (T = 60 °C; Na:REE = 3.6:1; Na2SO4 = 7 g/min) and (b) Na2SO4 flow rate (T = 60 °C; Na:REE = 3.6:1; 550 rpm).
Batteries 09 00574 g006
Figure 7. Concentrations (g/L) of (a) Ni and (b) REEs in filtrates during filtration-washing steps. (c) Ce:La and Nd:La ratios (g/g) in the filtrates. (d) Comparison of Ni and REE concentrations in the filtrates during washing by 2.5 L of H2O.
Batteries 09 00574 g007
Figure 8. SEM images of Na–REE double sulfates salts. (a) Sample before washing and (b) sample after washing at RT.
Batteries 09 00574 g008
Figure 9. SEM–EDS elemental mapping of (a) non-washed and (b) washed Na–REE double sulfate salts (EDS spectra are outlined in the supplementary materials). (c) Corresponding XRD patterns with the non-washed sample in black and with the washed sample in grey. Bragg’s peak of the trigonal NaREE(SO4)2·H2O and NiSO4·H2O are represented in blue and green, respectively.
Batteries 09 00574 g009
Figure 10. Recommended protocol for washing of the REEs-rich filter cake.
Batteries 09 00574 g010
Figure 11. TGA curves of 3 samples (blue, red and black lines) of washed Na–REE double sulfate salts (N2, 10 °C/min, isothermal at 105 °C and 500 °C for 15 min).
Batteries 09 00574 g011
Figure 12. (a) The XRD patterns of the synthetic NaLa(SO4)2·H2O, NaCe(SO4)2·H2O and the mixed compound NaLa0.5Ce0.5(SO4)2·H2O. (b) Output from the profile matching refinement analysis of the XRD pattern for the washed product obtained from the industrial PLS. (c) Variation of REE double sulfate unit cell with ionic radius of the corresponding REE.
Batteries 09 00574 g012
Table 1. Composition (g/L) of synthetic (synth-) solutions and industrial PLS.
Solutionsynth-Lasynth-Cesynth-LaCePLS
pH at 25 °C1.31.31.31.0
Ni 45.83 ± 1.22
Co 5.65 ± 0.15
Mn 2.33 ± 0.07
Zn 0.47 ± 0.02
Fe 1.31 ± 0.05
Al 1.33 ± 0.03
K 0.78 ± 0.05
La8.38 ± 0.36 6.62 ± 0.058.64 ± 0.25
Ce 8.64 ± 0.126.90 ± 0.103.10 ± 0.09
Pr 0.64 ± 0.04
Nd 1.04 ± 0.03
Sum of REEs8.38 ± 0.368.64 ± 0.1213.52 ± 0.1513.42 ± 0.38
Table 2. Elemental mass balance comparing the initial PLS with the REEs-depleted filtrate.
ElementNiCoMnZnFeAlKLaCePrNdSum of REEs
Initial PLS
(1769 g)
Weight, g68.758.483.500.701.962.001.1212.964.640.961.5620.12
Distribution ratio, %100100100100100100100100100100100100
Filtrate
(1780 g)
Weight, g65.758.423.490.691.951.910.340.580.080.130.010.80
Distribution ratio, %95.699.499.999.299.895.730.44.41.613.90.94.0
Table 3. Particle size distribution of washed samples obtained in various hydrodynamic conditions.
Sample ID1234
Parameters550 rpm;
FR = 7 g/min;
60 min of
Ripening
638 rpm;
FR = 7 g/min;
60 min of
Ripening
550 rpm;
FR = 14 g/min;
60 min of
Ripening
550 rpm;
FR = 20 g/min;
99 min of
Ripening
Dx (10), µm3.954.484.345.60
Dx (50), µm15.816.213.524.2
Dx (90), µm37.236.934.255.8
D [4,3], µm18.218.516.727.8
Span2.1072.0052.2132.075
FR—feed rate of 2.87 mol/L Na2SO4;
All samples were precipitated at 60 °C;
A solution of 2.87 mol/L Na2SO4 was added to the ratio Na:REE = 3.6:1;
Ripening time was 60 min for all samples except sample 4 (99 min)
Table 4. Influence of washing on the elemental composition of solid phases obtained from industrial PLS.
SampleNiLaCePrNdKNaNa:REE(Na + K):REE
mg/g of Solidmol/mol
Non-washed23.7281.9102.144.732.912.465.60.941.04
1 L of H2O at RT1.2310.3113.349.435.714.069.00.870.98
2.5 L of H2O at RT1.3304.9114.148.535.614.768.50.880.99
1 L of H2O at 60 °C2.1317.0113.650.837.013.670.30.880.98
Table 5. Respective proportions (in mol%) of REEs in the initial PLS and in the solid phases before and after washing (avg. values).
LaCePrNd
PLS64.8 23.0 4.7 7.5
Solid phase before washing64.9 23.5 4.2 7.4
Solid phase after washing65.0 23.6 4.1 7.3
Table 6. Cell parameters obtained from XRD analysis of the various Na–REE double sulfates prepared in this study.
Product PreparationCell Parameters, ÅVolume of the Lattice Cell, Å3
acMeasuredLiterature
Industrial PLSWashed by 2.5 L of H2O7.0395(2)12.9679(3)556.52
synth-LaLa7.0523(2)12.9646(6)558.41559.05 [48]
synth-LaCeLa0.5Ce0.5 7.0376(2)12.9456(4)555.27
synth-CeCe7.0195(2)12.9235(5)551.47551.46 [43]
Disclaimer/Publisher’s Note: The statements, opinions and data contained in all publications are solely those of the individual author(s) and contributor(s) and not of MDPI and/or the editor(s). MDPI and/or the editor(s) disclaim responsibility for any injury to people or property resulting from any ideas, methods, instructions or products referred to in the content.

