
Layer-Resolved Mechanical Degradation of a Ni-Rich Positive Electrode
by
 , , and
Priyank Gupta
1,*,†,
Moritz Streb
2,†,
Aamer Siddiqui
3,
Matilda Klett
3,
Göran Lindbergh
2 and
Peter Gudmundson
1 1
Solid Mechanics, Department of Engineering Mechanics, School of Engineering Sciences, KTH Royal Institute of Technology, SE-100 44 Stockholm, Sweden
2
Applied Electrochemistry, Department of Chemical Engineering, School of Engineering Sciences in Chemistry, Biotechnology, and Health, KTH Royal Institute of Technology, SE-100 44 Stockholm, Sweden
3
Scania CV AB, Granparksvägen 10, SE-151 48 Södertälje, Sweden
*
Author to whom correspondence should be addressed.
†
These authors contributed equally to this work.
Batteries 2023, 9(12), 575; https://doi.org/10.3390/batteries9120575
Submission received: 10 October 2023
/
Revised: 8 November 2023
/
Accepted: 23 November 2023
/
Published: 28 November 2023
Abstract
:The effects of electrochemical aging on the mechanical properties of electrodes in lithium-ion batteries are challenging to measure and are largely unknown. Mechanochemical degradation processes occur at different scales within an electrode and understanding the correlation between the degradation of mechanical properties, electrochemical aging, and morphological changes is crucial for mitigating battery performance degradation. This paper explores the evolution of mechanical and electrochemical properties at the layer level in a Ni-rich positive electrode during the initial stages of electrochemical cycling. The investigation involves complementary cross-section analyses aimed at unraveling the connection between observed changes on both macroscopic and microscopic scales. The macroscopic constitutive properties were assessed using a U-shaped bending test method that had been previously developed. The compressive modulus exhibited substantial dependency on both the porous structure and binder properties. It experienced a notable reduction with electrolyte wetting but demonstrated an increase with cycling and aging. During the initial stages of aging, electrochemical impedance spectra revealed increased local resistance near the particle–electrolyte interface. This is likely attributable to factors such as secondary particle grain separation and the redistribution of carbon black. The swelling of particles, compression of the binder phase, and enhanced particle contact were identified as probable factors adding to the elevation of the elastic modulus within the porous layer as a result of cycling.
1. Introduction
While lithium-ion batteries are the dominant technology in the energy storage market and electrification of transport, many aspects of these batteries are still not understood [1,2]. During the service life of lithium-ion cells, lithium intercalation and de-intercalation result in reversible and irreversible volumetric changes in both electrodes of lithium-ion cells [3,4,5]. The accompanying changes in the mechanical properties of electrodes may have a considerable influence on the electrochemical performance as well as on the overall mechanical response of lithium-ion cells. This interplay between electrode expansion, changes in mechanical properties, and changes in microstructure has an impact on the degradation of lithium-ion batteries. It is therefore of interest to measure the relationship between the mechanical properties of electrodes and their concomitant effects on electrochemical performance.
Several studies on the mechanical behavior of lithium-ion battery electrodes have been conducted at both micro- and macro scales. At the micro-scale, intercalation/deintercalation of lithium ions in the active particles causes mechanical deformation. This deformation can give rise to elevated internal and contact stresses, potentially causing grain fracture, fragmentation, pulverization, and the exposure of surfaces to side reactions. These effects ultimately contribute to the deterioration of battery capacity [6,7,8,9,10,11,12,13]. At the particle level, several models have been developed in the literature to capture these effects [14,15,16]. At the battery level, tackling detailed micro-structure resolution in this type of modeling presents computational challenges [13]. For battery packs, the focus shifts toward phenomenological modeling to capture the system’s response. These models seek to predict the reaction forces generated based on the state-of-charge, cycling, variations between cells, and localized degradations across a broad spectrum of operational temperatures and preloads [13,17,18,19,20,21,22]. However, these models do not provide insight into the mechanical properties of electrodes that change during service life, which is necessary to guide the development of better electrode materials and electrode architectures and for the development of better computational models [23,24,25]. In recent studies, ultrasound measurements have been conducted to explore the interaction between electrochemical performance and the mechanical characteristics of cells. This includes parameters such as Young’s modulus, electrode expansion, and alterations in porosity observed during cycling and aging. It’s important to note that while this method is designed to measure properties at the cell level, drawing conclusions about the specific properties of individual electrodes is limited to qualitative inferences [13,26,27]. Moreover, studies on coupled transient mechanical and electrochemical behavior at the electrode level in lithium-ion battery cells are missing in the literature to a considerable extent. These investigations are essential for characterizing the constitutive behavior of electrodes, providing crucial input for computational models assessing the performance of various battery cell types under electrochemical loadings for system integration [13]. The cyclical expansion and contraction of electrodes induce mechanical deformations and stresses, potentially causing non-uniform electrochemical states. This, in turn, can give rise to spatially varying pressure and aging within the cells [13,28].
There is substantial interest in the development of lithium-ion battery electrodes with exceptional resistance to degradation. The microscopic mechanical properties of electrode materials such as Young’s modulus, indentation hardness, and fracture strength and their effect on electrochemical performance have been characterized in the literature [25,29,30,31,32,33] with the aim of improving electrode structural stability, mechanical integrity, electronic and ionic conductivity, and cyclic performance [34]. However, to date, little is known about the macroscopic mechanical behaviors of lithium-ion battery electrodes and how the mechanical response of electrodes affects electrochemical performance. The characterization and modeling of the constitutive behavior of active layers within batteries are crucial for both cell-level and pack-level modeling. The impact of electrochemical cycling on the properties of these active layers remains largely unexplored. Moreover, there is a deficiency of appropriate test methods capable of capturing the mechanical behavior of active layers. Difficulties are related to the porous structure, the small thicknesses, and the non-linear and time-dependent characteristics of the active layers [13].
In the present work, the mechanical behavior of a LiNi0.6Mn0.2Co0.2O2 (NMC-622) positive electrode is comprehensively investigated at the electrode level. A reliable test method is first needed to obtain the constitutive behavior of the electrode active layer. Several efforts have been made in the literature to obtain the constitutive behavior of the active layer using tensile tests, indentation tests, etc. [35,36,37,38,39]. However, the tensile behavior is heavily influenced by the metal foil in the electrode, which leads to uncertainties when attempting to extract the properties of the active layer. Additionally, it has been noted that electrode failure often occurs prematurely during these tests. Bending tests have an advantage over tensile tests as the stiffness contribution of the active layer is significantly larger under bending as compared to tension. As a result, extraction of the properties of the active layer is less affected by experimental variability in bending tests than in tensile tests. Additionally, compressive properties can be accurately determined in bending tests without the issues of buckling and indeterminate contact conditions that arise in the hardness tests. Recently, a U-shape bending test method that enables separate measurements of the tensile and compressive properties of the electrode was developed [40,41]. The elastic modulus of the active layer in the electrode was determined by applying linear elastic beam theory, relying on small strains and accommodating large rotations. This method surpasses the constraints of previously reported techniques and effectively captures hysteresis effects. These effects arise from the presence of polymeric binders and the potential evolution of microstructural contacts.
It has been shown that the capacity of lithium-ion batteries decreases over successive charge/discharge cycles and is sensitive to operating conditions and the electrode and electrolyte composition [25,42,43]. In the present study, we utilized the previously developed U-shape bending test method [40,41] to assess the in-plane mechanical properties of the positive electrode throughout electrochemical cycling. The influence of electrolyte immersion on the mechanical characteristics of the active layer has direct implications for cell design [25]. We first investigated the mechanical behavior of electrodes using U-shape bending by immersing the electrode in an electrolyte and drying it overnight in a vacuum chamber. In contrast to a dry electrode, the mechanical properties of an electrode immersed in the electrolyte provide a baseline for evaluating the mechanical characteristics of the active layer throughout electrochemical cycling. Following the assembly of the battery cell, it undergoes varying numbers of electrochemical cycles, and subsequently, the mechanical properties of the active layer are assessed. Ongoing efforts aim to comprehend the mechanisms underlying the observed alterations in macroscopic mechanical behavior [13].
To complement the mechanical characterization, electrochemical impedance spectroscopy (EIS) is measured on a reference system in equivalent conditions to mechanical testing. Electrochemical impedance spectroscopy (EIS) can clarify shifts in electrochemical properties and contribute to the comprehension of the connection between mechanical alterations and the electrochemical system.
To guide the better design of electrodes, it is also important to observe how the microstructure evolves with electrochemical cycling to obtain a better understanding of the system’s transient response. We visualize the morphological changes in terms of particle and binder cracking, delamination between the electrode and current collector, and the size and circularity of particles at distinct stages of electrochemical cycling by cross-sectioning samples using a broad-ion beam (BIB) and imaging using a scanning electron microscope (SEM). Efforts have been made to understand the relationship between changes in the macroscopic and microscopic mechanical properties of electrodes.
2. Materials and Methods
2.1. Mechanical
2.1.1. Experimental Samples
The material assessed in this study was a single-side coated LiNi0.6Mn0.2Co0.2O2 (NMC-622) electrode supplied by CUSTOMCELLS®, Itzehoe, Germany. The electrode consisted of an active layer that was 111 μm thick calendared on an aluminum current collector that was 20 μm thick. The Youngs’ modulus of the used aluminum foils was estimated to be 70 GPa using tensile tests. The electrode was calendared to obtain a porosity of 51.80%. The active layer was made up of NMC particles (86%), a PVdF binder (7%), and conductive carbon (7%). Note that the studied electrodes have higher porosities and inactive material volume fractions than those commonly used in commercial energy-optimized cells. However, the qualitative trends and mechanisms presented in this work should not be impacted by the different material volume fractions. The study used rectangular samples with dimensions of 10 cm × 1 cm, which were cut from a larger electrode sheet using a Rexel ClassicCut™ CL420 cutter. The samples were examined using the U-shape bending test method, and a slight variation of ±0.4 mm in the specimen widths was observed. However, the data was normalized by the specimen width, so it did not affect the reliability or repeatability of the measurements.
2.1.2. U-shape Bending Test
A previously established the U-shaped bending technique was introduced to assess the in-plane mechanical characteristics of the active layer [40,41]. The method is based on an experimental setup, shown in Figure 1a, where the electrode sample is subjected to the U-shape bending test inside a tensile testing machine. The specimen was placed symmetrically between crossheads by taping the ends of electrodes to the faceplate such that there was no sliding between the faceplate and the electrode sample. The investigation focused on electrodes with a single-sided coating, considering that the placement of the coating (on the outer or inner side of the bending curvature) influences whether the layer experiences tension or compression during a U-shaped bending test [40,41]. In this study, all the samples were tested with the active layer subjected to compression, as shown in Figure 1b.
The experiments were carried out utilizing a ZwickRoell tensile testing machine, which was equipped with a 50 N load cell. The initial separation between the faceplates was set as 30 mm. The faceplates were moved with a fast displacement rate of 30 mm/min so that the relaxation effects and/or time-dependent effects were minimized. The correlation between the applied load, denoted as P, and separation of the faceplates, Δ, is given in [44] as:
This relationship has been deduced through the application of linear elastic beam theory, considering small strains and substantial rotations. In this context, EI denotes the bending stiffness of the entire specimen, encompassing both the active layer and the current collector [40,41].
This method enables the calculation of the bending stiffness of the electrode by measuring the force and the distance between the faceplates. The elastic modulus of the active layer was determined by calculating the slope of the P vs. 1/∆2 curves. The bending stiffness, denoted as EI, for the entire electrode can be expressed in terms of the elastic modulus of the porous active layer () and the elastic modulus of the aluminum current collector ( = 70 GPa).
The bending stiffness is defined by the following relationship:
where the position of the neutral layer () is given by:
Here, the thickness of the dry porous active layer and the aluminum current collector is denoted by ( = 111 µm) and ( = 20 µm), respectively. The thickness of the porous active layer changes with electrochemical cycling and must be considered while evaluating the bending stiffness of the active layer. Equations (1)–(3) have been used to evaluate the elastic modulus of the active layer () from measurements of bending stiffness, EI, according to Equation (1) and known values of , b, , and .
2.2. Electrochemical
2.2.1. Cell Preparation
For electrochemical cycling, pouch cells were prepared with an NMC 622 positive electrode (nominal loading = 3.5 mAh/cm2) and a graphite negative electrode (nominal loading = 3.9 mAh/cm2, CUSTOMCELLS®). Further specifications of the positive electrode are given in Section 2.1.1. Electrochemical cycling was performed on pouch cells constructed from 10 cm × 1 cm positive electrodes and 10 cm × 1.1 cm negative electrodes. A 20 µm thick separator (Celgard) and LP40 electrolyte (ethylene carbonate: di-ethylene carbonate, 1:1 by weight, Solvionic, Toulouse, France) were used. Additionally, a subset of cells was subjected to 50 cycles, where 2 wt% tris(trimethylsilyl) phosphite (TTSPi, >95%, Sigma Aldrich, St. Louis, MO, USA) was added to the LP40 electrolyte to inhibit aluminum corrosion on the positive electrode current collector [45]. Such current collector corrosion was observed in pre-study experiments (see Supplementary Figure S1). All 50 cycle cells used a 300 µm Whatman glass fiber separator to improve cycling stability.
The same electrode materials were used for 18 mm disk electrodes assembled in an El-cell three-electrode setup to measure half-cell potentials and impedance against a lithium reference electrode.
A sketch of the geometry of the pouch cells is given in Figure 2. After cycling, the pouch cells were disassembled inside the glovebox, washed with dimethyl carbonate (DMC), and dried at room temperature for at least 12 h. This ensured that no ethylene carbonate remained in the porous structure. To study the direct impact of electrochemical cycling on the electrode properties, reference samples were immersed in LP40 over 12 h but not electrochemically cycled. For every sample, the electrode thickness was determined after disassembly using a digital micrometer. Cells were fastened between two acrylic plates under isostatic pressure to ensure good contact during operation.
2.2.2. Electrochemical Cycling
Galvanostatic cycling of pouch cells was carried out on a high precision coulometry setup previously described by Smith et al. [46]. Cells were cycled for one, three, or fifty cycles between 3.0 and 4.2 V at C/3 rates (1.17 mA/cm2), where the C-rate was the current normalized by the theoretical capacity of the sample. At the end of the test, cells were discharged to 3 V. After cycling the cells, electrode samples were harvested and dried overnight for further mechanical testing. A list of tested samples is provided in Table 1.
El-cell impedance measurements were conducted on a Biologic VMP3 potentiostat. The galvanostatic cycling was controlled on the positive electrode between 3.6 V and 4.2 V at a C/3 rate. At 3.8 V vs. Li/Li+, a 1 h constant voltage step followed by a 1 h rest was set. After the rest, galvanostatic electrochemical impedance spectroscopy (EIS) was measured. The cell was perturbed by an AC potential signal (10 mV amplitude) with frequencies between 10 mHz and 20 kHz and the resulting current and phases were measured. We sampled ten frequencies per decade and averaged over two repetitions per frequency.
All electrochemical experiments were carried out in a 25 °C temperature chamber.
2.2.3. Microstructural Imaging
The samples were cross-sectioned using a broad-ion beam mill (Hitachi AirBlade 5000, Hitachi High-Tech, Tokyo, Japan). The milling parameters used were 6 kV Acc. voltage for a milling time of 1.5 h and a second finer polishing of 4 kV for 1 h with a dead-time of 10 s between the mills. Subsequently, the cross-sections were imaged using secondary electrons with the Zeiss Sigma HD at 5 kV for the positive electrode. The SEM micrographs underwent processing in ImageJ, involving segmentation, cleaning, and quantification. A comprehensive discussion of the imaging and subsequent analysis methodology can be found in [47].
3. Results
3.1. Mechanical Characterization
Rectangular specimens of dry, pristine electrode samples were first taken and subjected to the U-shape bending test described in Section 2.1.2. To determine the mechanical properties of the active layer, the unloading stiffness (compressive modulus) of the active layer was measured under different bending strains using Equations (1)–(3). Initially, the faceplate separation was set as 30 mm, and small unloadings were performed when faceplate separations reached 25 mm, 22.5 mm, 20 mm, and 17.5 mm with 1 mm retraction. Ultimately, when the faceplate separation reached 15 mm, the specimen was completely unloaded to the initial faceplate separation (Δ = 30 mm). A rapid displacement rate of 30 mm/min was employed to mitigate the time-dependent effects of the polymeric binder [40,41].
Plots for force vs. displacement (Δ) and force vs. 1/∆2 for the pristine dry electrode are presented in Figure 3a,b. At each unloading step, a straight line was fitted to the initial linear part of the unloading in force vs. 1/∆2 curve and the slope of the line gave an estimate of the bending stiffness of the electrode (cf. Equation (1)).
It is important to highlight that, at each unload step, the active layer experiences varying bending strains. The volume average of bending strain in the active layer was computed using linear elastic theory, as illustrated in Figure 3c. This procedure was replicated for all sample categories outlined in Table 1.
In the literature, investigations have been carried out to measure in-plane strains in the constrained positive and negative electrodes using DIC (digital image correlation). On average, these analyses reveal a range of approximately 1–2% strains during the phases of lithiation and delithiation [48,49]. The elastic modulus of the active layer for the dry pristine positive electrode during compression was calculated to be in the range of 1.46 GPa to 2.74 GPa when subjected to bending strains of 1.00–1.41% (see Figure 4). It should also be noted that the elastic modulus does not change with bending strain when the active layer is subjected to tension [40,41], and hence only the compression modulus is reported here.
To characterize the evolution of the compressive modulus at different strain levels, the samples listed in Table 1 were subjected to U-shape bending tests. Figure 4a shows a comparison of force vs. 1/∆2 response for samples subjected to a different number of charging–discharging cycles, and Figure 4b shows the evolution of the compressive elastic modulus of the electrode active layer under various bending strains. It must be noted that the tests were performed with multiple samples and an average of the results has been presented here.
In addition, two additional samples were charged to 30% or 60% state-of-charge (SOC) after the first cycle. The results are presented in the supplementary material in Figure S2.
In the literature, it has been established that for secondary particles, immersion in electrolyte results in minimal changes in mechanical properties, including Young’s modulus, hardness, and fracture strength [13,25]. To observe this effect at the layer level, the electrodes were immersed in an electrolyte, dried overnight in the vacuum chamber, and subsequently subjected to a U-shape bending test. The immersion of the electrode in the liquid electrolyte resulted in an augmentation of the active layer thickness, as shown in Table 1, and a significant drop in the compressive modulus was also observed, as shown in Figure 4b. Changes in the thickness of the layer can significantly affect the porosity and distribution of NMC particles within the layer. It must be noted that the thickness of the active layer was measured to calculate the unloading compressive modulus at different strain levels (cf. Equation (3)). From Figure 4b, it is also evident that the compressive modulus of the active layer increased gradually over the cycles. While differences in the measured compressive modulus are small between the immersed, one-cycle, and three-cycle samples, a drop in modulus between the pristine and immersed samples, as well as a steady increase in the modulus during cycling, was observed.
Especially at higher bending strains, the compressive modulus of the active layer increased significantly for the fifty-cycle samples. To understand the evolution of changes in the compressive modulus, it is necessary to investigate concomitant electrochemical and microstructural changes, which are discussed in subsequent sections.
3.2. Electrochemical Characterization
The 10 cm × 1 cm cells lost a maximum of 10% C/3 capacity after 50 cycles. A subsequent C/10 cycle showed only minor irreversible capacity losses. We therefore concluded that the 10 cm × 1 cm cells’ poorer cyclability and apparent capacity loss stems from polarization and poor electrolyte wetting in the unconventional cell geometry necessitated by mechanical testing. The evaluated discharge capacities and coulombic efficiencies are presented in Figure 5a. A reference experiment was conducted on 18 mm diameter pouch cells constructed using electrodes from the same batch. The equivalent discharge capacities and coulombic efficiencies are presented in Figure 5b. The 10 cm × 1 cm cells suffered higher capacity loss than the reference cells, allowing us to conclude that this geometry was not suitable for long-term experiments. However, as most of the capacity could be recovered with a slow discharge, we concluded that the material could be qualitatively compared with the circular electrodes used in the EIS experiments.
The electrode material was also investigated through electrochemical impedance spectroscopy (EIS) after one, three, and fifty cycles at 3.8 V of NMC622 vs. Li/Li+. The Nyquist plot is presented in Figure 6, which shows that the impedance decreases between one and three cycles. The high-frequency resistance (HFR), determined using the x-axis intercept, decreases, and the charge transfer rate, represented by the size of the semi-circle, increases. This is likely an activation of the material happening during the first cycles. After 50 cycles, the HFR and the charge transfer resistance increased significantly.
3.3. Microstructural Characterization
To understand the evolution of macroscopic compressive modulus with electrochemical cycling, it is important to observe the changes in microstructure. Cross-sectional images of different samples were taken as per the specifications given in Section 2.2.3 and are presented in Figure 7. Several observations can be made through qualitative comparison of the given images. In comparison to the dry pristine electrode shown in Figure 7a, the electrode immersed in the electrolyte shows a larger porosity and more void spaces, as shown in Figure 7b. This is also reflected in the increased thickness of the active layer (see Table 1). The cycled samples in Figure 7d showed more delamination between the active layer and the current collector compared to the pristine and immersed samples. This correlates with the increase in HFR observed in impedance measurements. The fifty-cycle sample shown in Figure 7d has a visible surface layer at the separator interface.
Energy dispersive X-ray analysis (EDX) (provided in the supplementary material (Figure S3)) showed that this layer did not contain significantly more fluorinated species but did contain a higher nickel content compared to the bulk porous electrode. We therefore believe it could be evidence of dissolved and redeposited transition metals from the active material.
In addition, a statistical analysis of the images captured at different stages was performed. This analysis assumes isotropic properties throughout the sample. Firstly, an equivalent particle diameter was calculated from the observed particle area and is shown in Figure 8a. The pristine sample was observed to have a mean diameter of 5.2 µm, but after three cycles, the mean diameter was estimated to be 4.4 µm. After fifty cycles, the mean diameter increased to 4.75 µm. This trend follows the observed moduli in Figure 4b, where the highest compressive modulus was observed for the pristine material. The evolution of the circularity of the particles, defined as , where is the particle area and is the particle perimeter, is shown in Figure 8b. The lower the circularity, the larger the deviation of the particle shape was from a perfect circle/sphere. A significant reduction in circularity was observed between the pristine and three-cycle samples, and an increase was then observed between three and fifty cycles. As these two observations show the same trend as the measured mechanical properties, they are likely strongly related. Five areas of the same cross-section were analyzed, and the sample averages and 95% confidence intervals suggest that the material is not fully isotropic.
4. Discussion
In the present work, we investigated the macroscopic mechanical properties of single-side coated NMC622 battery electrodes using complementary techniques. For a pristine dry electrode, the compressive modulus was reported in the range of 1.46 GPa to 2.74 GPa, which is low compared to the elastic modulus of electrode active particles [50]. This suggests that macroscopic mechanical behavior is mainly controlled by the porous structure of the active layer and the binder. With increasing bending strain, a stiffening effect in compression is also observed. The contribution of the current collector to the measured modulus is taken into consideration in Equations (1)–(3) assuming a no-slip condition, which remains valid on a macroscopic scale unless the active layer is entirely separated from the current collector within the electrode. The force–displacement curves also show significant hysteresis, which can be explained by viscoelastic and/or plastic deformations in the binder [40,41] as well as frictional effects.
The electrode samples were subjected to electrochemical cycling, and they were mechanically tested using the presented U-shape bending technique. Duplicate samples were then analyzed through BIB-SEM and electrochemical impedance spectroscopy. Mechanical measurements show two distinct trends. Firstly, it was observed that for the samples immersed in the electrolyte, the compressive modulus of the active layer dropped by up to 60% and the thickness of the active layer increased by approximately 7% compared to the pristine dry electrodes. This is likely due to the relaxation of residual and contact stresses in the active layer generated during electrode calendaring [51] and binder swelling [52] which is reported in the literature. The second major observation is that the compressive modulus increases during the initial utilization of the electrode up to 50 cycles. Previous work [53] notes the binder’s role in mitigating the volumetric expansion of particles during cycling. The increase in compressive modulus during cycling could thus be caused by an increased volumetric expansion in the particles.
These two trends are shown in a statistically significant manner in Figure 4b. The first trend concerns the modulus drop between the pristine and the immersed sample for all strain rates whereas the second trend involves a progressive increase in the modulus between immersed, one- or three-cycle, and fifty-cycle samples. However, the difference between immersed, one-, and three-cycle samples is only statistically significant for the 1% strain. We therefore refrain from drawing conclusions from the difference between immersed, one-, and three-cycle samples and only show the three-cycle sample in the cross-section analysis in Figure 8.
Electrochemical impedance spectroscopy was measured at the equivalent cycling stages. Between one and three cycles, a decrease in semi-circle size and HFR was observed. This is commonly reported in the literature and is associated with the activation and wetting of the electrode material [54,55]. After fifty cycles, both the HFR and semi-circle size increased. Previous reports have linked the increase in semi-circle size to the redistribution and de-activation of the carbon black additive [56]. The insignificant mechanical changes between one- and three-cycle samples suggest this electrochemical process does not alter mechanical properties.
Cross-sectioning and subsequent image analysis show a significant change in particle and binder phase properties. Between three cycles and fifty cycles, a slight increase in the active layer thickness could be observed. The particle swelling is likely caused by the cyclic expansion during lithiation and delithiation and the resulting separation of primary particles in the secondary particle agglomerates. This is in line with recent investigations, where synchrotron tomography was used to capture the morphology of cycle-aged lithium-ion battery electrodes [57]. The image analysis also revealed a decrease in particle diameter after immersion and then an increase during cycling (see Figure 8). Note that the box plots shown in Figure 8a,b represent distributions of properties, meaning a change in the distribution properties, i.e., in the median and the quartiles, cannot be disqualified as insignificant by similar box size or whisker length. Instead, a statistical test should be used to assess the likelihood that the two independent sample sets are, in fact, samples drawn from the same distribution. We employ the Kruskal–Wallis test [58]. We dismiss this 0-hypothesis, as the evaluated likelihood that the samples are drawn from the same distribution is below 0.1%.
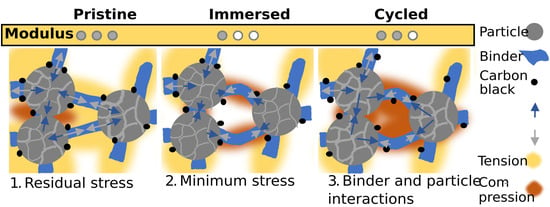
We suggest mechanical and chemical mechanisms responsible for the observed mechanical, electrochemical, and microstructural changes. From the calendaring stage, significant residual stresses exist in the pristine samples. During calendaring, the binder phase is compressed and plastically deformed. After the release of the calendaring force, a springback results, and it can be expected that the particles are subjected to compressive forces from particle–particle contacts [34,59]. The binder will instead, on average, be loaded with tension. When the electrode is immersed in electrolyte, the binder swells and softens [32,60] and built-in residual stresses are largely released. This results in a thickening of the binder–particle contacts and thereby an increase in the thickness of the electrode, which also is observed in the data (see Table 1). The softening of the binder, an expected decrease in the number of particle–particle contacts, and a lower particle volume fraction will also result in a decrease in the electrode stiffness for soaked and dried electrodes, which can also be observed in Figure 4b.
The calendaring stage results in certain particles cracking. However, due to the compressive forces between neighboring particles, many of the cracked particles are left more or less intact. The release of tensile binder stresses in the electrolyte immersion stage also causes a release of compressive particle–particle forces. This release of the compressive forces, combined with the overall volume expansion that results from immersion with electrolyte, makes it possible for cracked particles to be more distinctly divided into “separate” particles. This could be an explanation for the decrease in average particle diameter and circularity after immersion in the electrolyte and initial cycling (see Figure 8). The separation of cracked particles could also be a contribution to the observed decrease in stiffness (Figure 4b). This is likely a prominent mechanism in energy-optimized electrodes with lower porosity and a larger number of particle–particle contacts. In the pristine stage, primary particle adhesion could be overcome by tensile stresses in the binder, resulting in a slight expansion of the particles. The binder pulls on the primary particles, slightly increasing primary particle grain separation in the secondary particle agglomerate. The release of these stresses during electrolyte immersion releases the tension on primary particles in the secondary particle agglomerates and thereby causes the observed drop in particle size (Figure 8). It is likely that both effects occur in parallel; however, given the current evidence, we cannot discern which one dominates, and further work is required to validate the proposed mechanisms.
During subsequent electrochemical usage, the particles expand cyclically, which is known to cause grain separation and particle cracking [57,61]. In Table 1, it is noted that there is an irreversible expansion of the active layer thickness with the number of cycles. This type of irreversible swelling has been observed in several experimental investigations [3,5,62]. The increase in average particle diameter with the number of cycles (cf. Figure 8a) is most likely the major cause for the increase in layer thickness. Remembering that the active layer is constrained by the current collector, an increase in particle diameter will lead to an increase in particle–particle contacts, which is reflected in a higher compressive modulus with the number of cycles (see Figure 4b). The particle expansion also causes a rearrangement of the binder/carbon additive phase, which is reflected in the expansion of the charge-transfer semi-circle in the measured impedance spectra (Figure 6) with the number of cycles.
As our study focuses only on the earliest stage of the battery lifetime, it is likely the layer-level modulus will change significantly for a higher number of cycles where considerable particle cracking is expected. Microscale testing techniques can be employed to evaluate the individual mechanical properties of the electrode components to explain the changes in macroscopic properties [63]. A drawback of the U-shape bending technique is that only the average macro-mechanical properties can be calculated. Detailed micromechanical studies of the interaction of binder and particle phases are therefore needed to study individual components of the electrode and validate the mechanisms proposed above.
It must also be noted that the measurement of the evolution of the tensile modulus is equally important, since inside the battery cell, the stress state changes continuously during charging and discharging. However, we restricted our studies to the investigation of compressive modulus only. The presented methodology is general and can be used to study the macroscopic behavior of an electrode with different material compositions and porosity, under both compression and tension.
5. Conclusions
In this study, the U-shape bending test method was used to determine the macroscopic mechanical properties of an electrode active layer during early-stage cycling. The following observations were made:
- Mechanical characterization of pristine material overestimates the elastic modulus. The compressive modulus of the electrode dropped significantly after being immersed in the electrolyte overnight compared to the pristine electrode.
- There was an observed increase in the elastic modulus during the initial stages of cycling in nickel-rich battery electrodes.
- Electrochemical impedance spectra show an increase in characteristic semi-circle size and high-frequency resistance. The increase in semi-circle size corresponds to a rise in local resistance near the particle–electrolyte interface.
- Qualitative and quantitative analyses of cross-sections show that particle properties change significantly between pristine and cycled samples. After electrolyte exposure, first a decrease and then a subsequent increase in particle diameter and circularity during cycling was observed.
Swelling of particles and an augmented number of particle–particle contacts are probable factors contributing to the rise in the elastic modulus of the porous layer induced by cycling [13]. These observations allow us to conclude that layer-level mechanical properties change significantly during the utilization of the battery. The significant drop in modulus between pristine and immersed samples and the steady increase during early cycling are not sufficiently well understood and have not been previously reported. Our results show that interactions between particles and the binder dominate macroscopic properties, implying that the commonly measured particle stiffness only plays a minor role in macroscopic mechanical properties. Instead, future research should focus on methods capable of measuring interactions between the binder and individual particles directly. Furthermore, it is of interest to understand this system not only in a pristine state but also under the effects of immersion and electrode utilization, as our results show a softening due to electrolyte immersion followed by subsequent stiffening due to electrochemical utilization. The link between electrochemical utilization and mechanical properties is similarly challenging and in operando methodology must be developed to validate proposed mechanisms.
Supplementary Materials
The following supporting information can be downloaded at: https://www.mdpi.com/article/10.3390/batteries9120575/s1, Figure S1: Current collector corrosion observed in earlier samples, promoting the addition of electrolyte additive; Figure S2: Force vs. 1/∆2 plot for samples subjected to a different state-of-charge after the first cycle; Figure S3: EDX of a fifty-cycle sample showing the presence of transition metals in the observed surface layer; Figure S4: Image of the negative counter electrode after disassembly in the glovebox. No discoloration indicative of lithium plating was observed.
Author Contributions
Conceptualization, P.G. (Priyank Gupta), M.S., M.K., G.L. and P.G. (Peter Gudmundson); methodology, P.G. (Priyank Gupta) and M.S.; software, P.G. (Priyank Gupta), M.S. and A.S.; validation, P.G. (Priyank Gupta), M.S. and A.S.; formal analysis, P.G. (Priyank Gupta), M.S. and A.S.; investigation, P.G. (Priyank Gupta), M.S. and A.S.; resources, M.K., G.L. and P.G. (Peter Gudmundson); data curation, P.G. (Priyank Gupta) and M.S.; writing—original draft preparation, P.G. (Priyank Gupta) and M.S.; writing—review and editing, P.G. (Priyank Gupta), M.S., M.K., G.L. and P.G. (Peter Gudmundson); visualization, M.S.; supervision, M.K., G.L. and P.G. (Peter Gudmundson); project administration, P.G. (Priyank Gupta); funding acquisition, M.K., G.L. and P.G. (Peter Gudmundson). All authors have read and agreed to the published version of the manuscript.
Funding
We gratefully acknowledge the financial support provided by the Swedish Energy Agency under contract 45514-1 and contract 47103-1 (through the FFI program Energy and Environment).
Data Availability Statement
The data presented in this study are available on request from the corresponding author.
Conflicts of Interest
Author Aamer Siddiqui and Matilda Klett are employed by the Scania CV AB. The remaining authors declare that the research was conducted in the absence of any commercial or financial relationships that could be construed as a potential conflict of interest.
References
- Zubi, G.; Dufo-López, R.; Carvalho, M.; Pasaoglu, G. The lithium-ion battery: State of the art and future perspectives. Renew. Sustain. Energy Rev. 2018, 89, 292–308. [Google Scholar] [CrossRef]
- Thackeray, M.M.; Wolverton, C.; Isaacs, E.D. Electrical energy storage for transportation—Approaching the limits of, and going beyond, lithium-ion batteries. Energy Environ. Sci. 2012, 5, 7854–7863. [Google Scholar] [CrossRef]
- Bond, T.; Gauthier, R.; Eldesoky, A.; Harlow, J.; Dahn, J.R. In Situ Imaging of Electrode Thickness Growth and Electrolyte Depletion in Single-Crystal vs Polycrystalline LiNixMnyCozO2/Graphite Pouch Cells using Multi-Scale Computed Tomography. J. Electrochem. Soc. 2022, 169, 020501. [Google Scholar] [CrossRef]
- Mussa, A.S.; Liivat, A.; Marzano, F.; Klett, M.; Philippe, B.; Tengstedt, C.; Lindbergh, G.; Edström, K.; Lindström, R.W.; Svens, P. Fast-charging effects on ageing for energy-optimized automotive LiNi1/3Mn1/3Co1/3O2/graphite prismatic lithium-ion cells. J. Power Sources 2019, 422, 175–184. [Google Scholar] [CrossRef]
- Deich, T.; Storch, M.; Steiner, K.; Bund, A. Effects of module stiffness and initial compression on lithium-ion cell aging. J. Power Sources 2021, 506, 230163. [Google Scholar] [CrossRef]
- Zhang, J.; Lu, B.; Song, Y.; Ji, X. Diffusion induced stress in layered Li-ion battery electrode plates. J. Power Sources 2012, 209, 220–227. [Google Scholar] [CrossRef]
- Christensen, J.; Newman, J. Stress generation and fracture in lithium insertion materials. J. Solid State Electrochem. 2006, 10, 293–319. [Google Scholar] [CrossRef]
- Danner, T.; Zhu, G.; Hofmann, A.F.; Latz, A. Modeling of nano-structured cathodes for improved lithium-sulfur batteries. Electrochim. Acta 2015, 184, 124–133. [Google Scholar] [CrossRef]
- Mukhopadhyay, A.; Sheldon, B.W. Deformation and stress in electrode materials for Li-ion batteries. Prog. Mater. Sci. 2014, 63, 58–116. [Google Scholar] [CrossRef]
- Balke, N.; Jesse, S.; Morozovska, A.N.; Eliseev, E.; Chung, D.W.; Kim, Y.; Adamczyk, L.; García, R.E.; Dudney, N.; Kalinin, S.V. Nanoscale mapping of ion diffusion in a lithium-ion battery cathode. Nat. Nanotechnol. 2010, 5, 749–754. [Google Scholar] [CrossRef]
- Gudmundson, P.; Larsson, P.-L. An analytic model for effective mechanical properties and local contact stresses in lithium-ion porous electrodes. Extreme Mech. Lett. 2021, 42, 101067. [Google Scholar] [CrossRef]
- Boyce, A.M.; Martínez-Pañeda, E.; Wade, A.; Zhang, Y.S.; Bailey, J.J.; Heenan, T.M.; Brett, D.J.; Shearing, P.R. Cracking predictions of lithium-ion battery electrodes by X-ray computed tomography and modelling. J. Power Sources 2022, 526, 231119. [Google Scholar] [CrossRef]
- Gupta, P. Experimental Characterization of Electrodes and Multi-Scale Modeling of Swelling Induced Stresses in Lithium-Ion Batteries. Doctoral Dissertation, KTH Royal Institute of Technology, Stockholm, Sweden, 2023. [Google Scholar]
- Zhao, K.; Pharr, M.; Vlassak, J.J.; Suo, Z. Inelastic hosts as electrodes for high-capacity lithium-ion batteries. J. Appl. Phys. 2011, 109, 016110. [Google Scholar] [CrossRef]
- Purkayastha, R.T.; McMeeking, R.M. An integrated 2-D model of a lithium ion battery: The effect of material parameters and morphology on storage particle stress. Comput. Mech. 2012, 50, 209–227. [Google Scholar] [CrossRef]
- Malavé, V.; Berger, J.; Zhu, H.; Kee, R.J. A Computational Model of the Mechanical Behavior within Reconstructed LixCoO2 Li-ion Battery Cathode Particles. Electrochim. Acta 2014, 130, 707–717. [Google Scholar] [CrossRef]
- Oh, K.-Y.; Epureanu, B.I. A phenomenological force model of Li-ion battery packs for enhanced performance and health management. J. Power Sources 2017, 365, 220–229. [Google Scholar] [CrossRef]
- Oh, K.-Y.; Epureanu, B.I.; Siegel, J.B.; Stefanopoulou, A.G. Phenomenological force and swelling models for rechargeable lithium-ion battery cells. J. Power Sources 2016, 310, 118–129. [Google Scholar] [CrossRef]
- Oh, K.-Y.; Epureanu, B.I. A novel thermal swelling model for a rechargeable lithium-ion battery cell. J. Power Sources 2016, 303, 86–96. [Google Scholar] [CrossRef]
- Govindaraj, A.L. Phenomenological Swelling Model of Battery Module. Master’s Thesis, School of Engineering Sciences (SCI), Stockholm, Sweden, 2022. [Google Scholar]
- Mohan, S.; Kim, Y.; Siegel, J.B.; Samad, N.A.; Stefanopoulou, A.G. A Phenomenological Model of Bulk Force in a Li-Ion Battery Pack and Its Application to State of Charge Estimation. J. Electrochem. Soc. 2014, 161, A2222–A2231. [Google Scholar] [CrossRef]
- Knutsson, A.; Trombati, J. Finite Element Modelling of Cell Swelling for Traction Batteries. Master’s Thesis, Chalmers University of Technology, Gothenburg, Sweden, 2021. [Google Scholar]
- Yan, P.; Zheng, J.; Gu, M.; Xiao, J.; Zhang, J.-G.; Wang, C.-M. Intragranular cracking as a critical barrier for high-voltage usage of layer-structured cathode for lithium-ion batteries. Nat. Commun. 2017, 8, 14101. [Google Scholar] [CrossRef]
- Zhu, P.; Slater, P.R.; Kendrick, E. Insights into architecture, design and manufacture of electrodes for lithium-ion batteries. Mater. Des. 2022, 223, 111208. [Google Scholar] [CrossRef]
- Stallard, J.C.; Wheatcroft, L.; Booth, S.G.; Boston, R.; Corr, S.A.; De Volder, M.F.; Inkson, B.J.; Fleck, N.A. Mechanical properties of cathode materials for lithium-ion batteries. Joule 2022, 6, 984–1007. [Google Scholar] [CrossRef]
- Feiler, S.; Daubinger, P.; Gold, L.; Hartmann, S.; Giffin, G.A. Interplay between Elastic and Electrochemical Properties during Active Material Transitions and Aging of a Lithium-Ion Battery. Batter. Supercaps 2023, 6, e202200518. [Google Scholar] [CrossRef]
- Hodson, T.; Patil, S.; Steingart, D.A. An Initial Exploration of Coupled Transient Mechanical and Electrochemical Behaviors in Lithium Ion Batteries. J. Electrochem. Soc. 2021, 168, 070515. [Google Scholar] [CrossRef]
- Lensch-Franzen, C.; Gohl, M.; Schmalz, M.; Doguer, T. From Cell to Battery System—Different Cell Formats and their System Integration. MTZ Worldw. 2020, 81, 68–73. [Google Scholar] [CrossRef]
- Mughal, M.Z.; Amanieu, H.-Y.; Moscatelli, R.; Sebastiani, M. A Comparison of Microscale Techniques for Determining Fracture Toughness of LiMn2O4 Particles. Materials 2017, 10, 403. [Google Scholar] [CrossRef] [PubMed]
- Mughal, M.Z.; Moscatelli, R.; Amanieu, H.-Y.; Sebastiani, M. Effect of lithiation on micro-scale fracture toughness of LixMn2O4 cathode. Scr. Mater. 2016, 116, 62–66. [Google Scholar] [CrossRef]
- Amanieu, H.-Y.; Rosato, D.; Sebastiani, M.; Massimi, F.; Lupascu, D.C. Mechanical property measurements of heterogeneous materials by selective nanoindentation: Application to LiMn2O4 cathode. Mater. Sci. Eng. A 2014, 593, 92–102. [Google Scholar] [CrossRef]
- de Vasconcelos, L.S.; Sharma, N.; Xu, R.; Zhao, K. In-Situ Nanoindentation Measurement of Local Mechanical Behavior of a Li-Ion Battery Cathode in Liquid Electrolyte. Exp. Mech. 2018, 59, 337–347. [Google Scholar] [CrossRef]
- Xu, R.; Sun, H.; de Vasconcelos, L.S.; Zhao, K. Mechanical and Structural Degradation of LiNixMnyCozO2 Cathode in Li-Ion Batteries: An Experimental Study. J. Electrochem. Soc. 2017, 164, A3333–A3341. [Google Scholar] [CrossRef]
- Primo, E.N.; Chouchane, M.; Touzin, M.; Vazquez, P.; Franco, A.A. Understanding the calendering processability of Li(Ni0.33Mn0.33Co0.33)O2-based cathodes. J. Power Sources 2021, 488, 229361. [Google Scholar] [CrossRef]
- Zhu, J.; Zhang, X.; Sahraei, E.; Wierzbicki, T. Deformation and failure mechanisms of 18650 battery cells under axial compression. J. Power Sources 2016, 336, 332–340. [Google Scholar] [CrossRef]
- Zhang, C.; Xu, J.; Cao, L.; Wu, Z.; Santhanagopalan, S. Constitutive behavior and progressive mechanical failure of electrodes in lithium-ion batteries. J. Power Sources 2017, 357, 126–137. [Google Scholar] [CrossRef]
- Lai, W.-J.; Ali, M.Y.; Pan, J. Mechanical behavior of representative volume elements of lithium-ion battery modules under various loading conditions. J. Power Sources 2014, 248, 789–808. [Google Scholar] [CrossRef]
- Zhu, J.; Zhang, X.; Luo, H.; Sahraei, E. Investigation of the deformation mechanisms of lithium-ion battery components using in-situ micro tests. Appl. Energy 2018, 224, 251–266. [Google Scholar] [CrossRef]
- Sahraei, E.; Bosco, E.; Dixon, B.; Lai, B. Microscale failure mechanisms leading to internal short circuit in Li-ion batteries under complex loading scenarios. J. Power Sources 2016, 319, 56–65. [Google Scholar] [CrossRef]
- Gupta, P.; Üçel, I.B.; Gudmundson, P.; Olsson, E. Characterization of the Constitutive Behavior of a Cathode Active Layer in Lithium-Ion Batteries Using a Bending Test Method. Exp. Mech. 2020, 60, 847–860. [Google Scholar] [CrossRef]
- Üçel, I.; Gupta, P.; Gudmundson, P. Experimental determination of the constitutive properties of a graphite anode layer in lithium-ion batteries using a bending test method. J. Energy Storage 2022, 46, 103845. [Google Scholar] [CrossRef]
- Broussely, M.; Biensan, P.; Bonhomme, F.; Blanchard, P.; Herreyre, S.; Nechev, K.; Staniewicz, R. Main aging mechanisms in Li ion batteries. J. Power Sources 2005, 146, 90–96. [Google Scholar] [CrossRef]
- Shaijumon, M.M.; Perre, E.; Daffos, B.; Taberna, P.; Tarascon, J.; Simon, P. Nanoarchitectured 3D Cathodes for Li-Ion Microbatteries. Adv. Mater. 2010, 22, 4978–4981. [Google Scholar] [CrossRef]
- Matthewson, M.J.; Kurkjian, C.R.; Gulati, S.T. Strength Measurement of Optical Fibers by Bending. J. Am. Ceram. Soc. 1986, 69, 815–821. [Google Scholar] [CrossRef]
- Kazzazi, A.; Bresser, D.; Kuenzel, M.; Hekmatfar, M.; Schnaidt, J.; Jusys, Z.; Diemant, T.; Behm, R.; Copley, M.; Maranski, K.; et al. Synergistic electrolyte additives for enhancing the performance of high-voltage lithium-ion cathodes in half-cells and full-cells. J. Power Sources 2020, 482, 228975. [Google Scholar] [CrossRef]
- Smith, A.J.; Burns, J.C.; Zhao, X.; Xiong, D.; Dahn, J.R. A High Precision Coulometry Study of the SEI Growth in Li/Graphite Cells. J. Electrochem. Soc. 2011, 158, A447–A452. [Google Scholar] [CrossRef]
- Siddiqui, A.M.S. Broad Ion Beam Cross-Sectioning, Microscopy, and Image Analysis of Battery Electrode Morphology. Master’s Thesis, Lund University, Lund, Sweden, 2022. [Google Scholar]
- Çapraz, S.; Rajput, S.; White, S.; Sottos, N.R. Strain Evolution in Lithium Manganese Oxide Electrodes. Exp. Mech. 2018, 58, 561–571. [Google Scholar] [CrossRef]
- Jones, E.M.C.; Silberstein, M.N.; White, S.R.; Sottos, N.R. In Situ Measurements of Strains in Composite Battery Electrodes during Electrochemical Cycling. Exp. Mech. 2014, 54, 971–985. [Google Scholar] [CrossRef]
- Cheng, E.J.; Hong, K.; Taylor, N.J.; Choe, H.; Wolfenstine, J.; Sakamoto, J. Mechanical and physical properties of LiNi0.33Mn0.33Co0.33O2 (NMC). J. Eur. Ceram. Soc. 2017, 37, 3213–3217. [Google Scholar] [CrossRef]
- Haselrieder, W.; Ivanov, S.; Christen, D.K.; Bockholt, H.; Kwade, A. Impact of the Calendering Process on the Interfacial Structure and the Related Electrochemical Performance of Secondary Lithium-Ion Batteries. ECS Trans. 2013, 50, 59–70. [Google Scholar] [CrossRef]
- Sethuraman, V.; Van Winkle, N.; Abraham, D.; Bower, A.; Guduru, P. Real-time stress measurements in lithium-ion battery negative-electrodes. J. Power Sources 2012, 206, 334–342. [Google Scholar] [CrossRef]
- Koo, B.; Kim, H.; Cho, Y.; Lee, K.T.; Choi, N.; Cho, J. A Highly Cross-Linked Polymeric Binder for High-Performance Silicon Negative Electrodes in Lithium Ion Batteries. Angew. Chem. 2012, 124, 8892–8897. [Google Scholar] [CrossRef]
- Günter, F.J.; Habedank, J.B.; Schreiner, D.; Neuwirth, T.; Gilles, R.; Reinhart, G. Introduction to Electrochemical Impedance Spectroscopy as a Measurement Method for the Wetting Degree of Lithium-Ion Cells. J. Electrochem. Soc. 2018, 165, A3249–A3256. [Google Scholar] [CrossRef]
- Günter, F.J.; Keilhofer, J.; Böhm, V.; Daub, R.; Reinhart, G. Wetting and Inductivity in the Impedance Behavior of Large Lithium-Ion Cells. J. Electrochem. Soc. 2022, 169, 050522. [Google Scholar] [CrossRef]
- Scipioni, R.; Jørgensen, P.S.; Ngo, D.-T.; Simonsen, S.B.; Hjelm, J.; Norby, P.; Jensen, S.H. Low-voltage FIB/SEM Tomography for 3D Microstructure Evolution of LiFePO4/C Electrode. ECS Trans. 2015, 69, 42. [Google Scholar] [CrossRef]
- Ridder, A.; Prifling, B.; Hilger, A.; Osenberg, M.; Weber, M.; Manke, I.; Birke, K.P.; Schmidt, V. Quantitative analysis of cyclic aging of lithium-ion batteries using synchrotron tomography and electrochemical impedance spectroscopy. Electrochim. Acta 2023, 444, 142003. [Google Scholar] [CrossRef]
- Kruskal, W.H.; Wallis, W.A. Use of Ranks in One-Criterion Variance Analysis. J. Am. Stat. Assoc. 1952, 47, 583–621. [Google Scholar] [CrossRef]
- Lundkvist, A.; Larsson, P.-L.; Olsson, E. A discrete element analysis of the mechanical behaviour of a lithium-ion battery electrode active layer. Powder Technol. 2023, 425, 118574. [Google Scholar] [CrossRef]
- Chong, J.; Xun, S.; Zheng, H.; Song, X.; Liu, G.; Ridgway, P.; Wang, J.Q.; Battaglia, V.S. A comparative study of polyacrylic acid and poly(vinylidene difluoride) binders for spherical natural graphite/LiFePO4 electrodes and cells. J. Power Sources 2011, 196, 7707–7714. [Google Scholar] [CrossRef]
- Xu, R.; De Vasconcelos, L.S.; Shi, J.; Li, J.; Zhao, K. Disintegration of Meatball Electrodes for LiNixMnyCozO2 Cathode Materials. Exp. Mech. 2017, 58, 549–559. [Google Scholar] [CrossRef]
- Bond, T.; Gauthier, R.; Gasilov, S.; Dahn, J.R. In-Situ Computed Tomography of Particle Microcracking and Electrode Damage in Cycled NMC622/Graphite Pouch Cell Batteries. J. Electrochem. Soc. 2022, 169, 080531. [Google Scholar] [CrossRef]
- Iyer, A.H.; Gupta, P.; Gudmundson, P.; Kulachenko, A. Measuring microscale mechanical properties of PVdF binder phase and the binder-particle interface using micromechanical testing. Mater. Sci. Eng. A 2023, 881, 145352. [Google Scholar] [CrossRef]
Figure 1.
(a) Test set-up with an electrode sample taped to faceplates in the tensile testing machine; (b) Schematic of the electrode sample with an active layer subjected to compression [40].
Figure 1.
(a) Test set-up with an electrode sample taped to faceplates in the tensile testing machine; (b) Schematic of the electrode sample with an active layer subjected to compression [40].

Figure 2.
Pouch cell geometry showing the graphite counter electrode and the 10 cm × 1 cm NMC622 electrode that were investigated in this study.
Figure 2.
Pouch cell geometry showing the graphite counter electrode and the 10 cm × 1 cm NMC622 electrode that were investigated in this study.

Figure 3.
Results for the dry pristine electrode sample U-shape bending tests with unloading steps: (a) force vs. faceplate separation (Δ), (b) force vs. 1/∆2, (c) root mean squared strain in the positive electrode active layer vs. faceplate separation.
Figure 3.
Results for the dry pristine electrode sample U-shape bending tests with unloading steps: (a) force vs. faceplate separation (Δ), (b) force vs. 1/∆2, (c) root mean squared strain in the positive electrode active layer vs. faceplate separation.

Figure 4.
(a) Force vs. 1/∆2 plot for pristine samples, immersed samples, and samples subjected to different cycles; (b) Comparison of the compressive elastic modulus of samples subjected to different cycles with different bending strains. The mean compressive elastic modulus is indicated by vertical bars and the error bars denote the standard deviation.


Figure 5.
Two 10 × 1 cm cells (a) and two 18 mm diameter pouch cells (b) during 50 galvanostatic cycles at 25 °C. The markers denote the coulombic efficiency, and the lines show the capacity fade. The 10 × 1 cm pouch cells lose less than 10% C/3 capacity during 50 cycles in (a), whereas the more conventional geometry in (b) loses a maximum of 5% capacity.

Figure 6.
Electrochemical impedance spectroscopy of NMC622 at 3.8 V vs. Li/Li+ at 25 °C. Bode plot showing (a) the average and deviation over two samples and a Nyquist plot in (b) with the average impedance of the two cells in (a). Impedance is shown after one, three, and fifty cycles. In (a), two independent samples are included, the maximum and minimum are shown as error bars, and the mean is shown by the markers. In (b), only the mean is shown. Impedance decreases from one to three cycles and increases again after fifty cycles. All impedance spectra were measured in the El-cell three-electrode setup. Note that due to limited cycling stability in this three-electrode cell, only one-cycle and three-cycle samples were cycled directly in this setup, whereas the fifty-cycle sample was harvested from a pouch cell.


Figure 7.
SEM cross-section micrographs of pristine (a), immersed (b), three-cycle (c), and fifty-cycle (d) electrodes. Note that the carbon black and binder phases are porous and thereby contribute to the electrodes’ porosity.
Figure 7.
SEM cross-section micrographs of pristine (a), immersed (b), three-cycle (c), and fifty-cycle (d) electrodes. Note that the carbon black and binder phases are porous and thereby contribute to the electrodes’ porosity.


Figure 8.
Image analysis-derived particle size distribution (a) and circularity (b) at various stages. In (a,b), the median particle property is indicated by a horizontal line and the mean is denoted by a circle. The whiskers contain the maximum and minimum values of the distributions, and the colored boxes denote the second and third quartiles. In (a), the pristine sample shows the largest particles. In the three-cycle sample, the mean particle size decreased significantly (by ~1 µm). After fifty cycles, the average particle size increased again. A similar trend is observed for the particle circularity in (b). Particles in the pristine sample are mostly circular but contact with the electrolyte and subsequent electrochemical utilization causes cyclic stresses and shape changes in the particles. The statistics were derived through image analysis of the cross-sections shown in Figure 7.


Table 1.
Positive electrode samples subjected to different levels of electrochemical cycling. Note that the thickness of the active layer is calculated by subtracting the known thickness of the aluminum current collector (20 µm) from the measured thickness of the electrode. The average and standard deviation of three measurements are given and all samples were cleaned with DMC and dried in the glovebox for a minimum of 12 h.
| Specification of Samples | Measured Thickness of the Active Layer (µm) |
|---|---|
| Pristine | 111 ± 1 |
| Immersed | 118 ± 1 |
| 1 cycle | 119 ± 1 |
| 3 cycles | 120 ± 1 |
| 50 cycles | 121 ± 1 |
Disclaimer/Publisher’s Note: The statements, opinions and data contained in all publications are solely those of the individual author(s) and contributor(s) and not of MDPI and/or the editor(s). MDPI and/or the editor(s) disclaim responsibility for any injury to people or property resulting from any ideas, methods, instructions or products referred to in the content. |
© 2023 by the authors. Licensee MDPI, Basel, Switzerland. This article is an open access article distributed under the terms and conditions of the Creative Commons Attribution (CC BY) license (https://creativecommons.org/licenses/by/4.0/).
Share and Cite
MDPI and ACS Style
Gupta, P.; Streb, M.; Siddiqui, A.; Klett, M.; Lindbergh, G.; Gudmundson, P. Layer-Resolved Mechanical Degradation of a Ni-Rich Positive Electrode. Batteries 2023, 9, 575. https://doi.org/10.3390/batteries9120575
AMA Style
Gupta P, Streb M, Siddiqui A, Klett M, Lindbergh G, Gudmundson P. Layer-Resolved Mechanical Degradation of a Ni-Rich Positive Electrode. Batteries. 2023; 9(12):575. https://doi.org/10.3390/batteries9120575
Chicago/Turabian StyleGupta, Priyank, Moritz Streb, Aamer Siddiqui, Matilda Klett, Göran Lindbergh, and Peter Gudmundson. 2023. "Layer-Resolved Mechanical Degradation of a Ni-Rich Positive Electrode" Batteries 9, no. 12: 575. https://doi.org/10.3390/batteries9120575
Note that from the first issue of 2016, this journal uses article numbers instead of page numbers. See further details here.