Article

Aging and Homogenized Mechanical Character of Quasi-Statically Charged Gr-Si and NMC Based Electrodes Using Damage Material Modeling

Fraunhofer Institute for Industrial Mathematics ITWM, Fraunhofer-Platz 1, 67663 Kaiserslautern, Germany
*
Authors to whom correspondence should be addressed.
Batteries 2023, 9(12), 582; https://doi.org/10.3390/batteries9120582
Submission received: 23 October 2023 / Revised: 14 November 2023 / Accepted: 27 November 2023 / Published: 6 December 2023
(This article belongs to the Special Issue Materials Design for Electrochemical Energy Storage)

Abstract

:
Silicon-based, high-energy-density electrodes show severe microstructural degradation due to continuous expansion and contraction upon charging and discharging. This mechanical degradation behaviour affects the cell’s lifetime by changing the microstructure morphology, altering transport parameters, and active volume losses. Since direct experimental observations of mechanical degradation are challenging, we develop a computer simulation approach that is based on real three-dimensional electrode microstructures. By assuming quasi-static cycling and taking into account the mechanical properties of the electrode’s constituents we calculate the heterogeneous deformation and resulting morphological changes. Additionally, we implement an ageing model that allows us to compute a heterogeneously evolving damage field over multiple cycles. From the damage field, we infer the remaining electrode capacity. Using this technique, an anode blend of graphite particles and silicon carbon composite particles (SiC-C) as well as a cathode consisting of Lithium-Nickel-Manganese-Cobalt Oxide with molar ratio of 8:1:1 (NMC811) are studied. In a two-level homogenization approach, we compute, firstly, the effective mechanical properties of silicon composite particles and, secondly, the whole electrode microstructure. By introducing the damage strain ratio, the degradation evolution of the graphite SiC-C anode blend is studied for up to 95 charge-discharge cycles. With this work, we demonstrate an approach to how mechanical damage of battery electrodes can be treated efficiently. This is the basis for a full coupling to electrochemical simulations.

Graphical Abstract

1. Introduction

Lithium-ion batteries are ubiquitous electrochemical energy storage devices and are widely used in applications starting from small portable devices to bigger items such as electric vehicles. During service life, the battery experiences capacity fades due to a variety of degradation mechanism [1]. Especially for silicon-based electrodes mechanical degradation is very significant [2,3,4]. Their large volume expansion during lithiation is still a challenge for building long-lived, high-energy batteries since it causes irreversible particle–particle detachment, delamination, and particle fracture, which accelerates the mechanical deterioration and capacity fading [5,6,7,8]. According to research done by Beaulieu [9] using atomistic simulations, amorphous silicon (Si) thin films’ lithiation can result in a 300% increase in thickness. Extreme volume changes can result in Si particle damage [10], recyclable lithium loss from solid–electrolyte interface (SEI) growth due to internal stresses [11], and loss of electrical contact as a result of Si particle detachment [12,13]. According to the literature on the negative electrode, these three factors are the main causes of cell ageing. The volume expansion studies [14,15] in positive, state-of-the-art NMC811 electrodes are also important, since mechanical failure becomes critical at higher operating voltages [16,17,18,19]. Multiple mechanically driven degradation phenomena have been reported at atomistic and particle level simulations to investigate the mechanical characteristics limiting the structural stability of cathode materials [14,17,20,21,22]. Pietsch et al. [23] determined that the microstructural changes in porous anodes have a comparable level of influence on service life as the spatial inhomogeneities resulting from the manufacturing process. As a result, the dynamics of microstructural changes can affect transport properties, local potential differences, and ultimately lead to lithium plating and degraded microstructure [24,25].
Previous studies have been conducted to investigate structural degradation phenomena at various scales, including atomistic, particle, and electrode level (effective and microscopic material models [2,26,27,28]). These studies have their own advantages and disadvantages. The atomistic level offers the most detailed view of the underlying processes, especially structural properties, but the simulations are computationally expensive and cannot capture the large scale degradation behaviour. On the level of a single particle, the intercalation-induced stresses and particle fracture can be considered, but the models are not able to capture the multi-particle interactions and electrode heterogeneities [29,30]. Approaches on the electrode scale, i.e., p4d models [31,32,33] can describe the effective mechanical properties, but at the cost of simplification and loss of detailed information, and they need user input from smaller scales. Through homogenization methods, efficient parametric study of complete electrode is also addressed by multi-scale approaches. However, most of them relate atomistic to effective simulation models [34] or particle to continuum scales [35,36] to reduce microstructural complexities which arise when geometries are resolved at a microstructure level. Currently, there is a growing trend in research towards the use of microscopic material modelling to understand structural degradation phenomena at the electrode level and to acquire significant insights into how to counteract degradation issues. One of the most promising approaches is three-dimensional image-based electrochemical and mechanical simulation [37,38,39,40], as it facilitates more precise modelling of electrode heterogeneities and their impact on cell performance and degradation. Performing direct modelling of electrode structures by utilizing images obtained through X-ray tomography or Focused Ion Beam Scanning Electron Microscopy (FIB-SEM) involves a significant cost to characterize each constituent. Additionally, to ensure statistical representativeness, the microstructure needs to be of a larger size, which leads to a restriction in the simulation time and cycles for the solution of electrochemical and mechanical equations.
The aim of the present research paper is two-fold: firstly, we describe our approach to predict macroscopic mechanical properties of electrode mixtures based on the bulk properties of the constituents. Secondly, we will present a model for mechanical degradation due to mechanical stresses. As negative electrode we consider a blend of graphite and silicon composite particles. The composite particles are assumed to consist of submicron silicon flakes embedded in a graphite matrix. Based on the mechanical bulk properties and on a three-dimensional, segmented voxel-image, which identifies graphite particles, matrix, and silicon flakes, we describe a two-step approach to compute the effective mechanical properties of the electrode for different states of lithiation. In a similar but simplified fashion we treat the positive NMC electrode. Concerning the mechanical degradation, we apply a model in a three-dimensional, microstructural simulation to predict the development of a phenomenological damage field. By considering quasi-static charging-discharging cycles and by using our software FeelMath (Available online: https://itwm.fraunhofer.de/feelmath (accessed on 1 November 2023)) [41,42,43,44] we are able to the study damage evolution over 100 cycles on a standard workstation.
The paper is structured as follows: in the next chapter we describe the battery cell that we are considering and outline the mathematical model and the methodology we apply. Afterwards, we discuss the results of our simulations. There, we successively discuss the mechanical properties of negative and positive electrodes, and finally present the mechanical damage evolution in the anode blend over many charging cycles. Finally, we finish with a conclusion.

2. Simulation Approach

To simulate the macroscopic mechanical response and degradation of an electrode we start off with a representative 3D microstructural image and apply the methods of continuum structural mechanics. In contrast to the NMC cathode, the process for the graphite-SiC-C anode is more complex: due to the sub-micrometer silicon flakes embedded in a graphite matrix we compute the effective properties in two steps, cf. Figure 1. First, representative subvolumes of the composite regions are selected, from which the effective mechanical properties are computed. In a second step the full microstructure is taken into account, but now with the homogenized SiC-C-properties. This approach is described in the following subsection. Afterwards the model for mechanical degradation is presented.

2.1. A General Approach for Mechanical Simulation at Continuum Scale

Strain energy is normally stored within the deformed electrode microstructure due to the rearrangement of Li-ions. For a given three-dimensional microstructure of active material the mechanical stresses σ for all material points can be calculated within the microstructure by simply implying Hooke’s law for a specific mechanical strain ϵ el . Hooke’s law incorporates the recoverable strain energy within the proportionality limit and can be defined by Lamé constants λ and μ such as:
σ = λ Tr [ ϵ el ] I + 2 μ ϵ el .
This is a constitutive equation for stress σ and elastic strain ϵ el (where I denotes the identity matrix). However, due to the intercalation of Li-ions, there is also an additional internal strain contribution, the chemical strain ϵ ch . In analogy to thermal expansion, ϵ ch describes the induced strain based on the distribution of lithium ions within the active material. It is characterized by a molar expansion coefficient Ω of the material. For a given concentration of Li-ions ( Δ c Li ) the chemical strain can be defined as
ϵ ch = Δ c Li Ω I .
The total strain ϵ is then given as sum of elastic and chemical strains
ϵ = ϵ el + ϵ ch .
Using (1)–(3) the elastic constitutive relation is
σ = λ Tr [ ϵ ϵ ch ] I + 2 μ ( ϵ ϵ ch ) .
Together with appropriate boundary conditions and assuming mechanical equilibrium (divergence of Cauchy stress tensor σ )
· σ = 0
this equation is solved for a given SOC with our software FeelMath [41,42,43,44] on the segmented three-dimensional image, where the individual material properties of the constituents are taken into account.
For a range of lithium concentrations Δ c Li within the active material (related to the SOC) the macroscopic electrode properties of the NMC cathode can be readily computed for different states of charge (cf. Section 3.2). To determine Δ c Li in the silicon composite particles, however, is more complex since it consists of two materials (graphite and silicon). We adopt the following two-step approach for the anode: First we discriminate between SiC-C (graphite with silicon flakes) and pure graphite particles (cf. Figure 1). We choose subvolumes inside the SiC-C particles in order to determine the effective SiC-C properties. In a second step we process the anode microstructure, assign the effective properties to the complete composite particles, and perform the computation on the complete electrode microstructure. However, in both steps there are two electrode materials involved, which differ in lithium content due to their individual OCV.We now explain how the respective lithium concentrations Δ c Li required for (1) are determined. If at a given SOC we can assume electrochemical equilibrium (i.e., the same potential between materials) the electrode charge QSiC-C distributes into charges Q Gr and Q Si in the graphite and silicon phase, respectively, such that
U Gr ( Q Gr ) = U Si ( Q Si ) , Q SiC - C = Q Gr + Q Si .
The potential satisfying (6) corresponds to the OCV of the composite U SiC - C ( Q SiC - C ) . In this way the OCV and in particular the lithium distribution of the composite is determined, see Figure 2. In a second step the OCV and ion distribution in the complete anode (consisting of graphite and SiC-C) is derived analogously. With this quasistatic approach the ion distribution for the full SOC range is determined and the mechanical Equations (1) and (2) can be solved. We note, however, that this approach neglects the dynamic effects and can only be considered as approximation valid for low C-rates. Once the concentration distribution of a given SOC is determined the mechanical problem is solved. We compute mechanical stresses as well as the effective mechanical moduli and expansion coefficients, as shown in Section 3.1.

2.2. Mechanical Degradation Model

The mechanical model presented above can not only be used to calculate the effective electrode properties, as it also yields the full stress and strain field for each voxel of the structure. Due to the complex electrode structure and the different expansion characteristics of the constituent materials (graphite and silicon) the local stresses are expected to vary strongly across the structure. Large local stresses may lead to local mechanical damage and, as a consequence, a reduction of electrode capacity. In this section we will present a mechanical degradation model that allows us to predict local damage over a large number of cycles.
Since damage initiation and evolution is a material property, additional damage parameters are introduced that govern permanent changes in the mechanical properties of the material. The damage state is calculated against the applied chemical strain and current damage strain history. Initially, the material is assumed to be elastic with a constant stiffness. Soon after it enters the damaged state, a scalar damage variable D is utilized to represent softening effects (reducing stiffness). The material’s stiffness tensor C will be affected by the damage variable in accordance with the following equation:
σ = ( 1 D ) C ϵ el .
Throughout the ageing simulation under applied chemical strain, the scalar damage variable D, defined in the interval [ 0 , 1 ] , governs the degradation criteria. During cyclic charging, this new state variable D accumulates the damage strain field within the electrodes. In the elastic region, the damage strain state must be constant and the damage strain rate will be zero. However, when the material becomes inelastic, the model requires an additional state equation that calculates the evolution of the damage variable with respect to the applied strain and damage history. This procedure is the subject of the following section.
Before computing the damage model, the total strain tensor ϵ i j is used to compute the equivalent damage strain d p in the elastic regime. When the equivalent damage strain exceeds the minimum damage strain threshold ( d 0 ), the material enters the damaged region. After this point, the elastic strain energy density is reduced due to the dissipation of energy used to create new surfaces in the damage mechanism. However, to keep the framework simple, the balance equations are omitted. All of the following damage modelling equations can be found in [46,47]. A general form of the Mazar’s damage model can be written as
D = | 1 d 0 ( 1 Δ D ) d ϵ Δ D e H ( d ϵ d p ) | d p > d 0 ,
where d ϵ is the equivalent total strain, d p is the total damage strain, and H is the damage evolution modulus. The following equations show the incremental form of this equation, which is implemented as a user material subroutine. The equivalent damage strain d p represents the 3D damage strain tensor as scalar value and can be calculated by the following phenomenological relationship:
d p = 2 ( I 1 2 E λ + E λ ( I 2 + I 3 ) ) .
This phenomenological relation is not derived from theoretical equations. Instead, this equation is empirically found to be a good approximation for brittle materials. The invariants of the strain tensor are denoted by I 1 , I 2 , and I 3 . These invariants describe hydrostatic, deviatoric, and volume-related deformations. This formulation applies only to isotropic cases and is derived from Mazar’s model [47]. The elastic moduli determine E λ as follows:
E λ = E ( 1 1 2 ν 1 1 + ν ) .
Here, E and ν are the Young’s modulus and Poisson ratio. Once the equivalent damage strain d p reaches the damage initiation threshold d 0 , the damage strain step is calculated by the following evolution equation.
Δ D = 1 e H ( d 0 d p ) .
As mentioned, the damage state of a material point ranges from zero to one, with zero indicating no damage and one indicating full damage. The material parameter H governs the evolution of the damaged state and can be fitted to match the damage behaviour of different materials.
There are few limitations to the current set of simulation performed in this work. First, all of the electrodes are deformed under boundary conditions (BC) with tangentially free or fixed boundary movement. Normally reaction forces within a realistic microstructure develop pressure along the edge or even more specifically electrodes are deformed preconditional under pressure BCs to influence the ageing behaviour. Secondly, effective mechanical response and cyclic damaged simulations are always calculated with the reference geometric state. As the material state evolves, particle detachments and contact information are lost.Third, the adjacent stresses between stacked electrodes are disregarded in these simulations since the electrodes are deformed separately from their pristine states in reference configuration. The fourth limitation is the lack of heterogeneous distribution of Li + ions concentration across the microstructure. The quasi-static charge distribution only ensures potential equilibrium but the local charge state does not explicitly vary across the grain thickness at intermittent charging states. Lastly, the transport properties are not directly linked with the morphological changes in ageing simulations. Nevertheless, the propagation of damage field in ageing simulations have shown the promising outcomes due to microscopic chemical deformation until mechanical degradation does not contribute any more.

3. Results

Following the description in Section 2.1 we show our results for the effective mechanical properties of the electrodes. We start the section with the anode properties and then present the cathode results. In the last subsection we show the degradation results according to the model of Section 2.2.

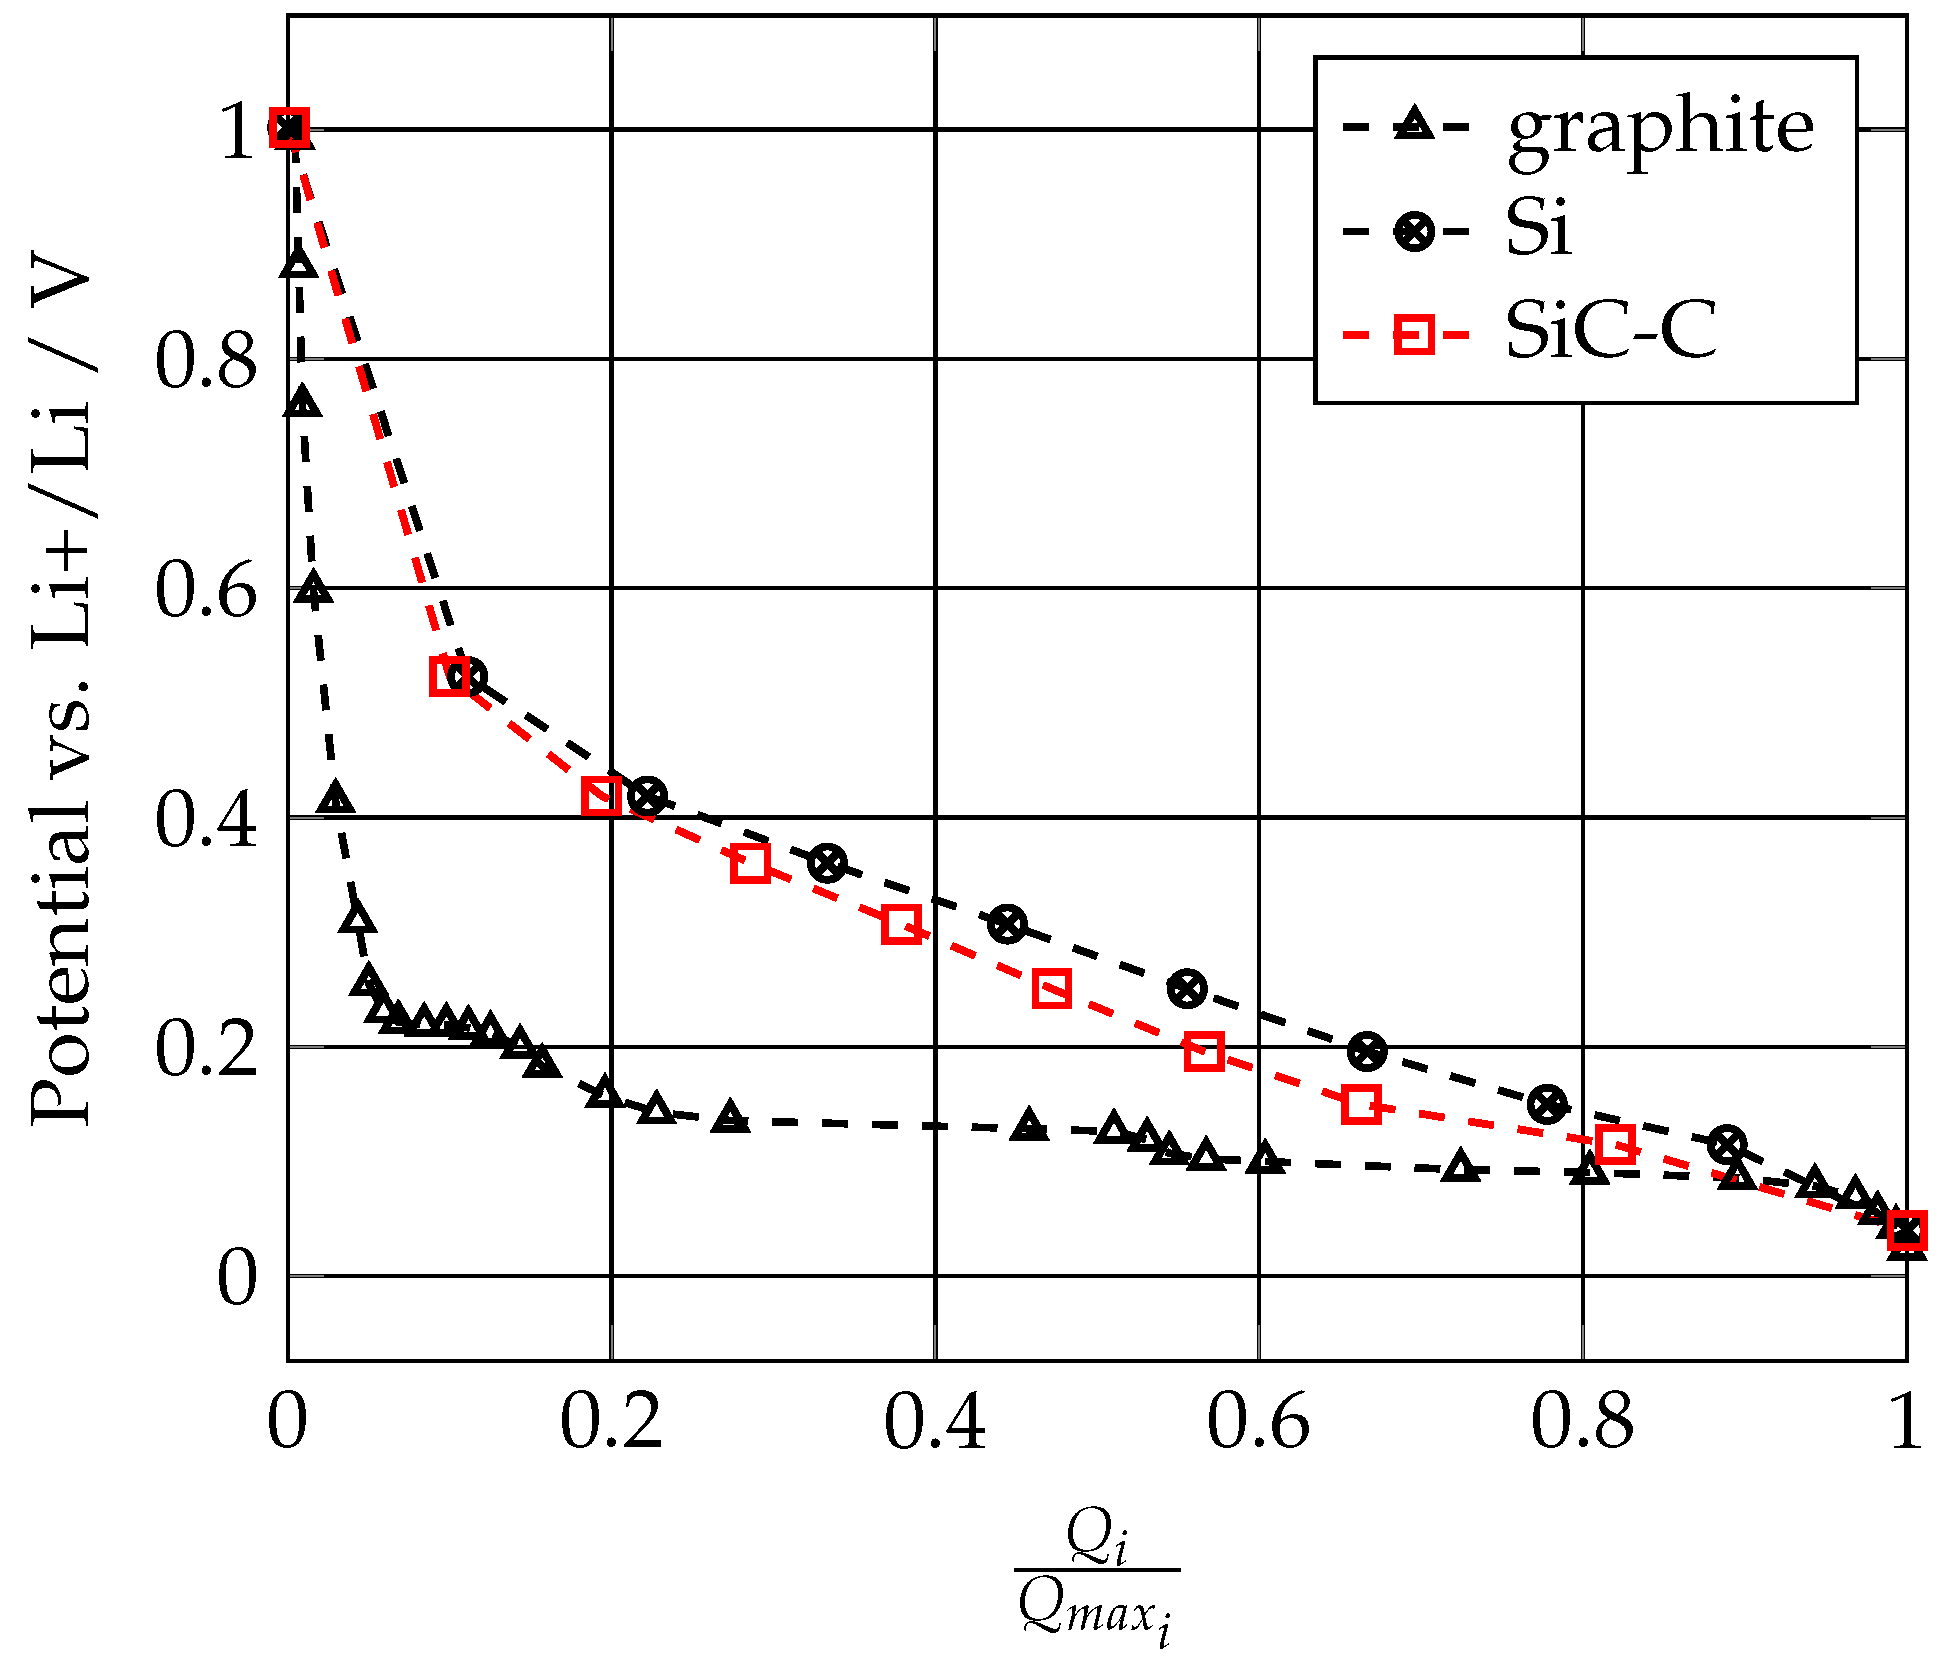
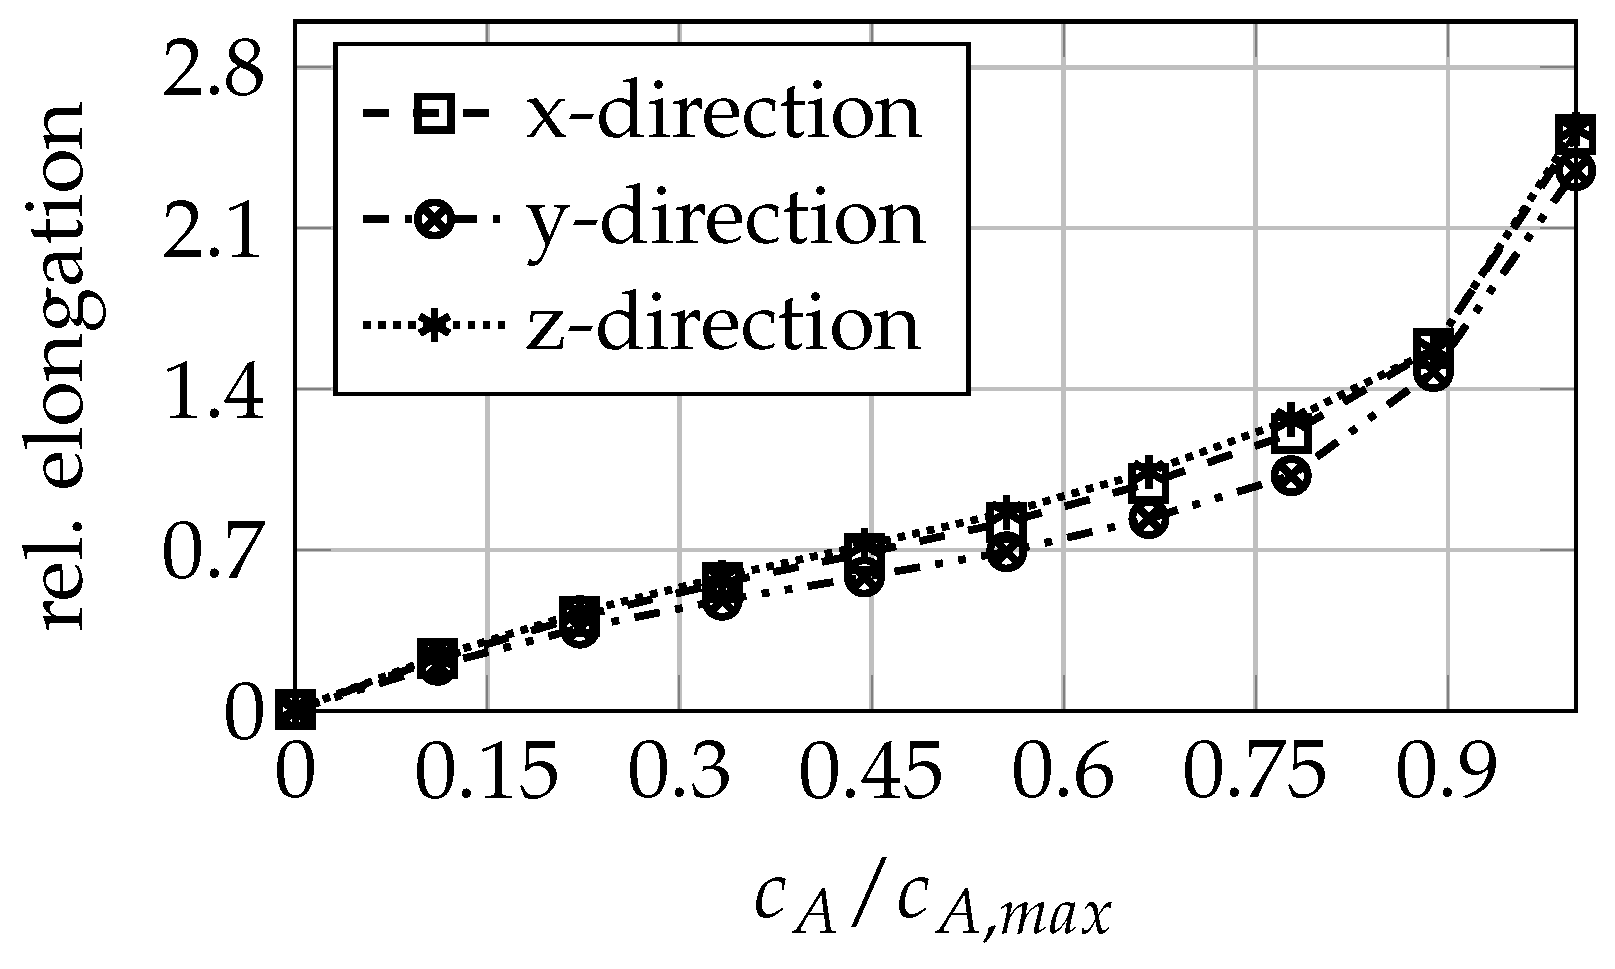
3.1. Anode Mechanical Properties

We build our simulation upon an electrode microstructure reconstructed from FIB-SEM images provided by Ref. [48] in the context of the EU-project DEFACTO [49]. The structure is shown in Figure 1 and consists of 39% pore space, 49% pure graphite, and 12% silicon-composite particles. The latter consist of 69% graphite matrix and 31% submicron silicon flakes. The geometry is spacially discretized into 2276 × 2200 × 2328 voxels. In order to make mechanical simulations in such a large dataset feasible, we proceed in two steps and start by considering subvolumes inside the graphite-silicon composite particles and compute their effective mechanical properties (cf. Section 2.1). As input we use the bulk properties of pure graphite and silicon. While the molar expansion coefficient of graphite Ω C = 1.51 cm 2 / mol is taken from literature [28,50], the silicon’s expansion coefficient of Ω S i = 3.68 cm 2 / mol is a result from atomistic simulations obtained by Ref. [51] in the DEFACTO project [49]. Similarly, the Young’s modulus E and Poisson ratio ν are obtained (Appendix A Table A1).
For six representative subvolumina (cf. Figure 1) we use our software FeelMath [41,42,43,44] to compute the effective properties based on (4) (cf. Appendix B). Going through the whole SOC range and averaging the six results we obtain for the SiC-C particles the SOC-dependent, effective properties listed in Table 1. Additionally, we compute c m a x , SiC - C = 104,280 mol/m 3 as maximum lithium concentration in the SiC-C particle and an SiC-C expansion coefficient of Ω SiC - C = 2.196 cm 3 /mol.
We note that the presented results assume isotropic behaviour such that two elastic constants are sufficient to describe the mechanical response. We checked the validity of this assumption by performing multi-directional mechanical loading steps on the selected subvolumes to compute all nine components of the stiffness tensor. The boundary conditions are defined in such a way that three normal directions are deformed with specific loading strains. The resultant stress values and given strains provide elastic moduli in respective directions. Similar approach is extended to further three shear loadings and the ratio of resultant stresses with the shear strains provided the component of anisotropic stiffness tensor of the composite material. As Table 2 shows, only minor anisotropy is detected in the SiC-C composite. As a result, the computed Young’s moduli and Poisson ratios can be regarded as good approximation to the SiC-C properties.
Having determined the effective properties of the composite particles, the electrode properties can be computed for the second step. To this end, the anode’s microstructure is processed such that the SiC-C particles can be treated as homogeneous, effective material with the parameters computed above (cf. Figure 1, right). Besides of SiC-C, also pure graphite as second species is to be considered. The homogenization of the SiC-C particles reduces the need for the original, very fine resolution. Hence, the geometry is coarsened to a 137 × 137 × 137 voxel grid with a voxel size of 0.32 µm, which significantly reduces the computational cost. The computation with FeelMath then basically proceeds as in the first step.
Since we require both the effective elastic moduli of the entire electrode and unrestricted expansion behaviour of the electrode, two different types of boundary conditions are used. First, free boundary conditions are applied to obtain the accurate expansion without any reaction force on the edges. It implies that electrode geometry can expand freely in all three directions. Secondly, the electrode is restrained in one direction and kept strain-free in the other normal direction in order to obtain the elastic moduli. This setup provides both the Young’s modulus and Poisson ratio using global stress and strain tensors.
Figure 3 illustrates the outcomes of the simulation setup for the effective elastic moduli. Up to an SOC of 80%, the stiffness of the electrode slightly decreases. After that, it nearly quadruples its initial values. Contrarily, the Poisson ratio remains constant between 20% and 80% state of charge. It is calculated by dividing the amount of axial compression with the amount of transversal elongation. The sudden rise of E is similar to the effective elastic behaviour of SiC-C particles (given in Table 1). One can see that the graphite concentration rises only after the silicon particles are charged more than 80%. Therefore, the influence of graphite’s elastic properties is only relevant at the end of the charging phase. In a second set of simulations we compute the electrode expansion in the full SOC range. Figure 4 shows the results of the anode swelling in different directions by taking the ratio between the new edge length and the original one. However, overall the expansion behaviour is very similar in all directions. We note that the swelling speed at low and in particular at high SOC is faster than at intermediate states of charge. As a result, it is reasonable to anticipate greater morphological changes in the former range, which will reduce structural integrity. After several charges, one can also anticipate an anisotropic expansion character especially if permanent damage is attributed in the cyclic charging; however, this is not the objective of current work. For the complete Gr-SiC-C anode we obtain the effective molar expansion coefficient of Ω = 0.8541 cm 3 / mol and an average maximum concentration of c m a x = 26,864.36 mol / m 3 .

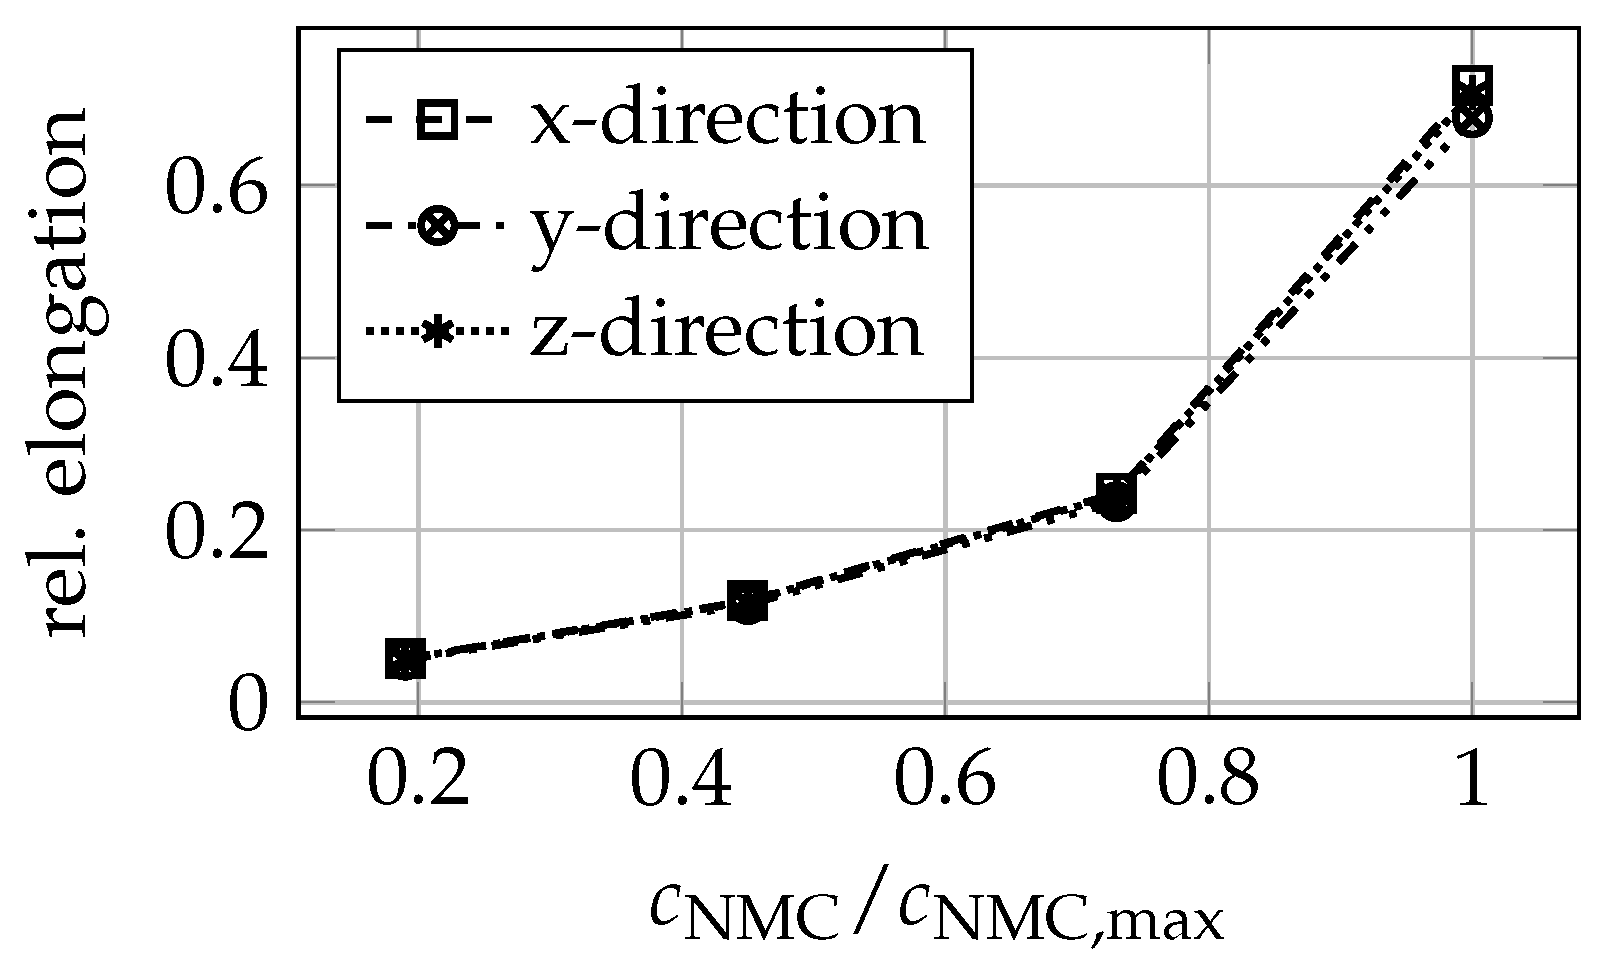
3.2. Cathode Mechanical Properties

In this section, the effective mechanical properties of the cathode are discussed. In principle, the positive electrode can be treated using the same process as described in the previous section. In contrast to the anode with its composite particles and submicron silicon flakes, the situation here is more straightforward because the effective parameters can be computed directly in a single step. Additionally the volume expansion of NMC is much less pronounced. In the following, we briefly summarize the mechanical properties of the cathode as well as its SOC-dependent swelling behaviour.
The positive electrode in Figure 5 consists of Lithium-Nickel-Manganese-Cobalt Oxide with molar ratio of 8:1:1. As the anode, the segmented structure based on FIB-SEM images is provided by Ref. [48] in the framework of the EU-project DEFACTO [49]. The provided voxel geometry is 44.16 × 43.54 × 43.5 µm in size with a voxel size of 0.32 µm. It consists of 59% NMC811, 6% additives and 35% pore space.
The maximum lithium concentration of NMC is taken to be c NMC = 48,583 mol/m 3 from [28]. Its molar expansion coefficient Ω NMC is much smaller than that of graphite or silicon but it has a nonlinear dependency on lithiation state, see Figure 6. The elastic moduli of NMC depend on state of charge: according to DFT simulations of the NMC811 unit cell the stiffness reduces with increasing lithiation [52]. The computed Poisson ratio, however, is reported to be basically constant at 0.3. We reproduce this data in Table A2. In contrast to the active material the additives do not expand as they do not store ions. Their mechanical behaviour is solely characterised by Young’s modulus and Poisson ratio, which are estimated to be E = 2.2 GPa and ν = 0.3 [53], respectively.
As in the anode case, we solve for the effective elastic response and the constitutive relation between chemical strain and internal stresses. Therefore, two types of boundary conditions are applied, as already addressed in the previous subsection. Simulations are performed at 10%, 17%, 45%, 75%, and 100% lithiation. The remaining stoichiometric states are not investigated due to a lack of elastic moduli data for NMC811. However, these are the most diverse regions when it comes to change in elastic moduli data and can produce satisfactory overall behaviour [54,55,56]. In Figure 7 the effective Young’s modulus E C and Poisson ratio ν C of the complete cathode microstructure are shown. The effective electrode stiffness is clearly reduced compared to NMC’s bulk properties due to the microstructure and the comparatively soft binder phase. The overall trend, however, follows the bulk behaviour. In contrast to the almost constant Poisson ratio of the bulk material, a slightly more pronounced dependency on lithiation is observed for the complete electrode.
Looking at the overall electrode expansion, an increasingly faster swelling is observed with a larger lithiation state, cf. Figure 8. Similar behaviour is observed in other studies [20,27] and reasoned for the combined behaviour of transition metal ions and M O 6 slabs. Moreover, after 40% SOC, M O 6 slabs generate repulsive forces, which are positively charged fields in highly delithiated states and create an expansion. On the other hand, the radius of transition metals reduces due to fewer electrons, and further contradiction can happen in transition metals at elevated valance. This competing phenomenon goes on until it reaches 70% SOC. Afterwards, NMC811’s contraction is mitigated and only expansion continues until it is fully charged. Since the expansion in the three Cartesian directions in Figure 8 lie on top of each other, it can be concluded that the structure does not introduce any anisotropic effects.

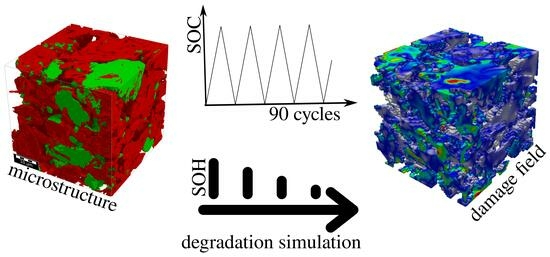
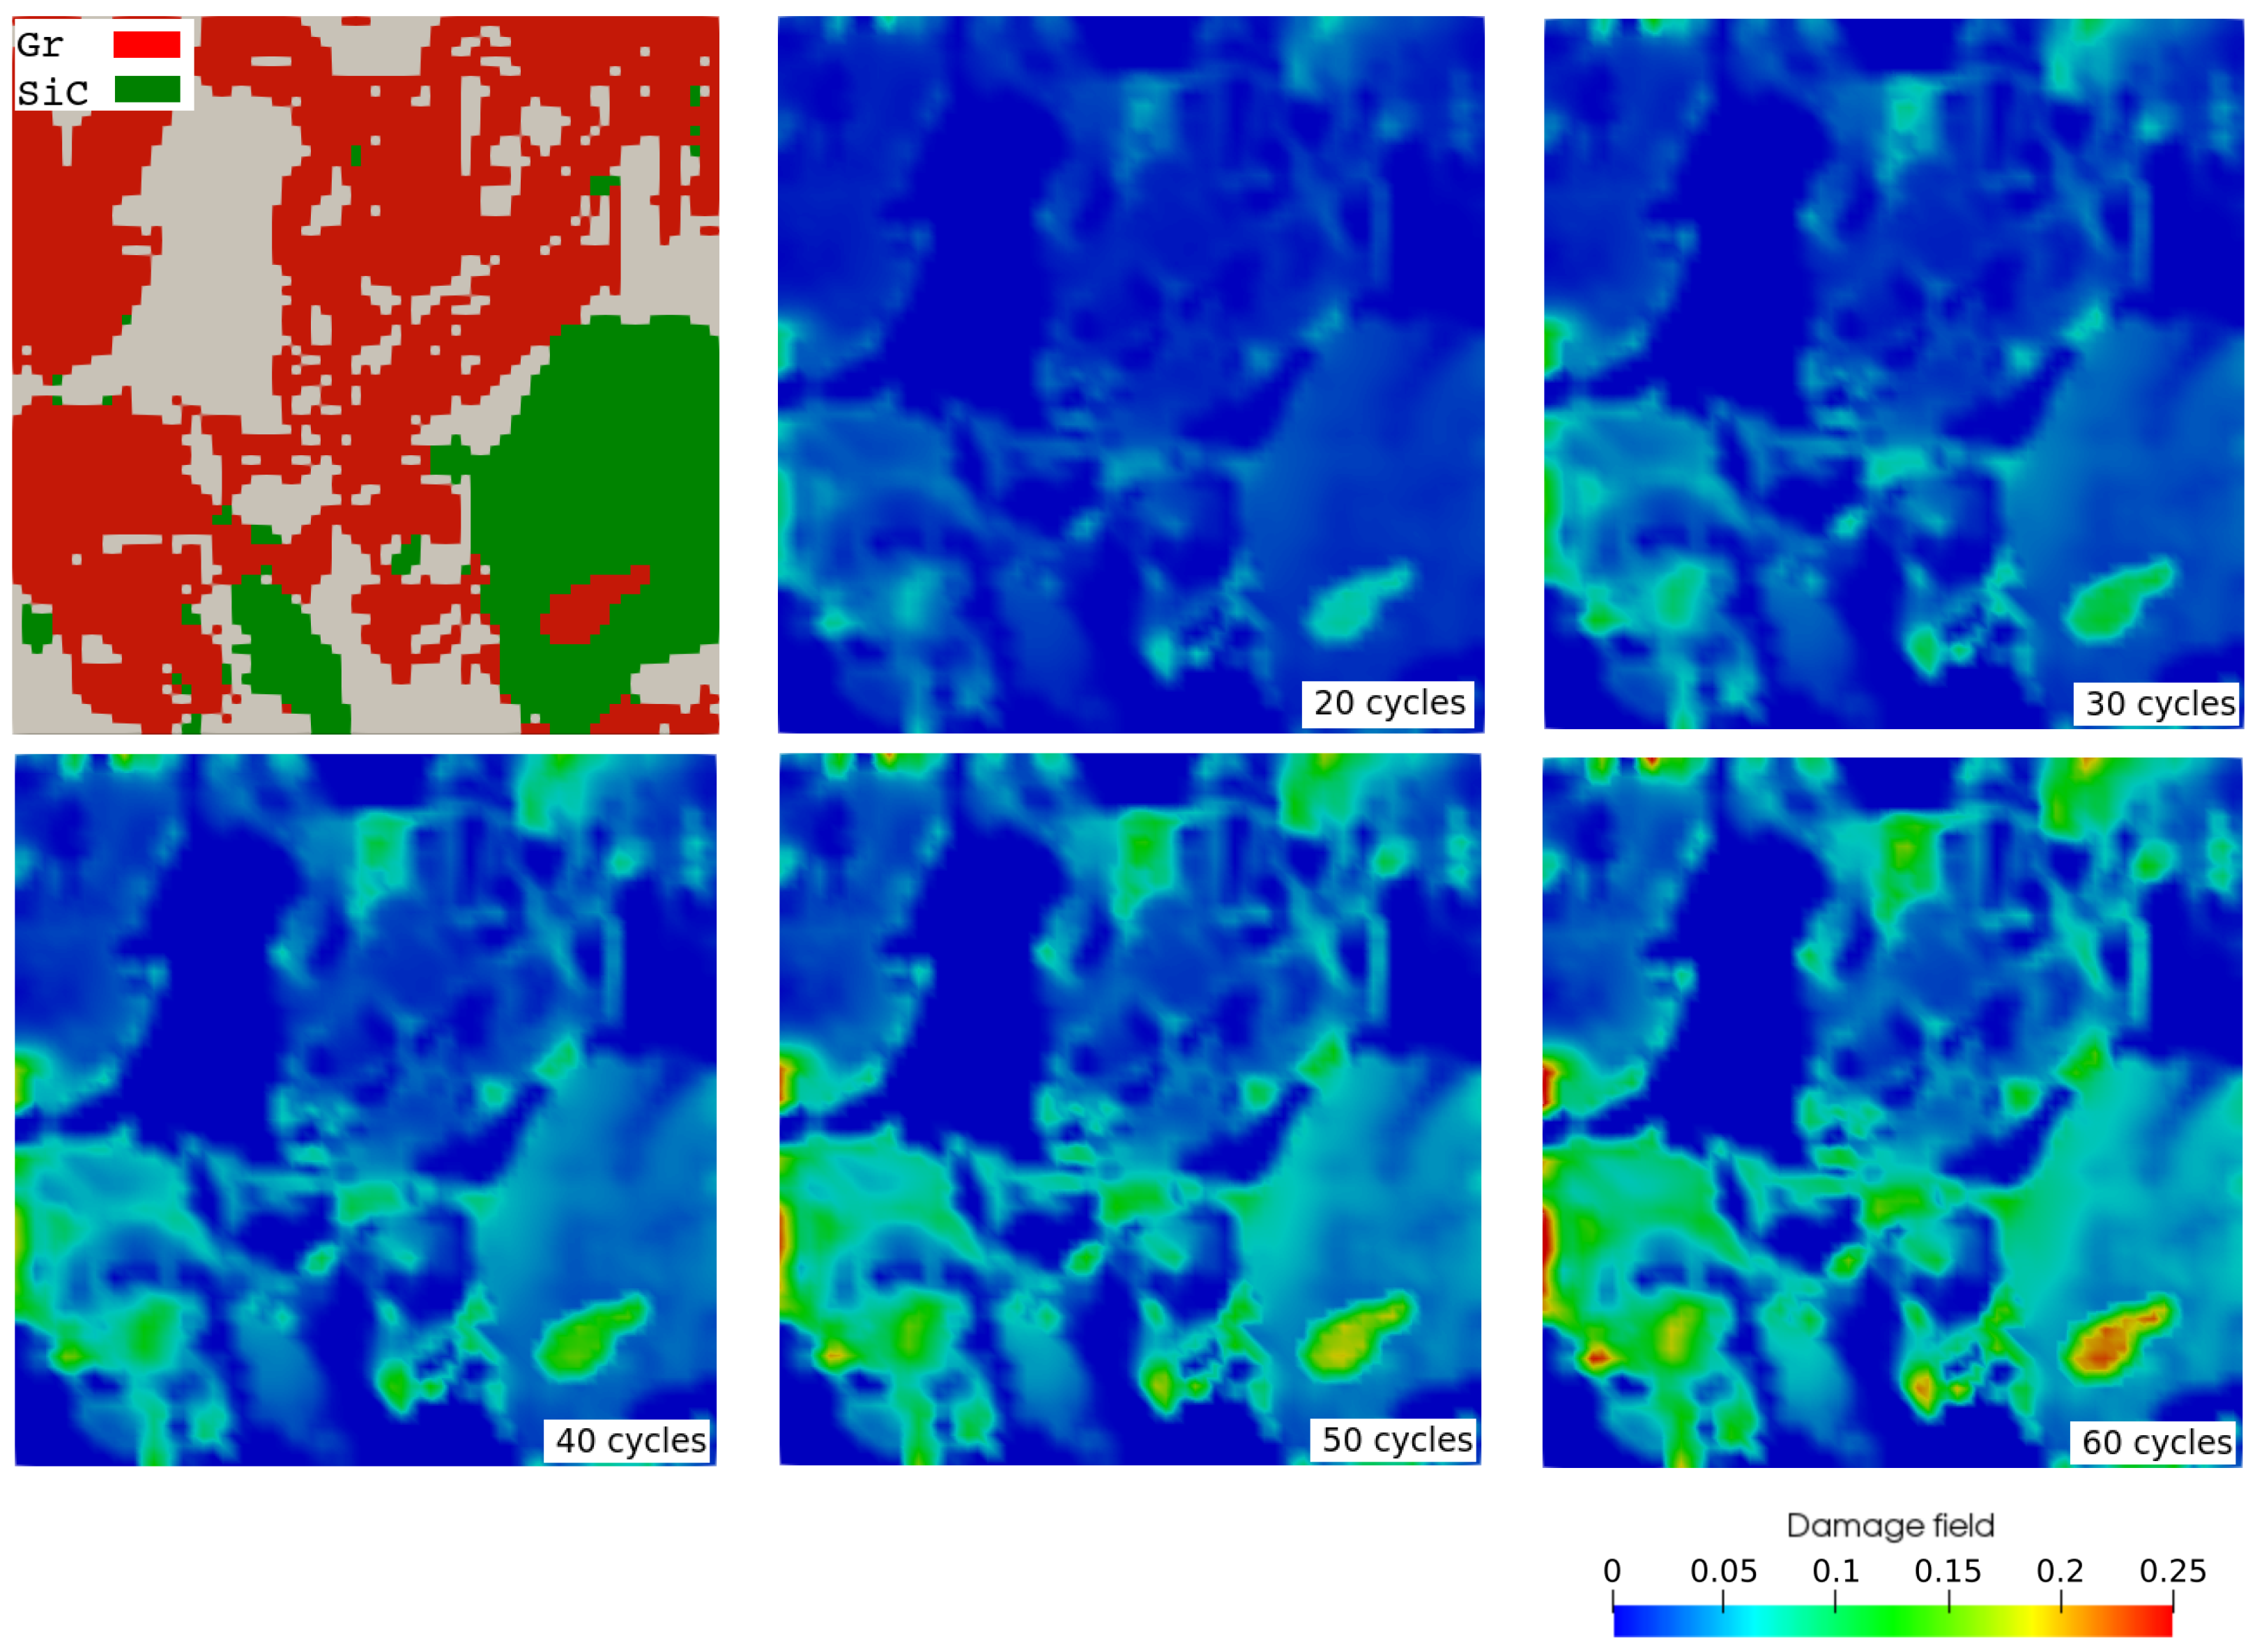
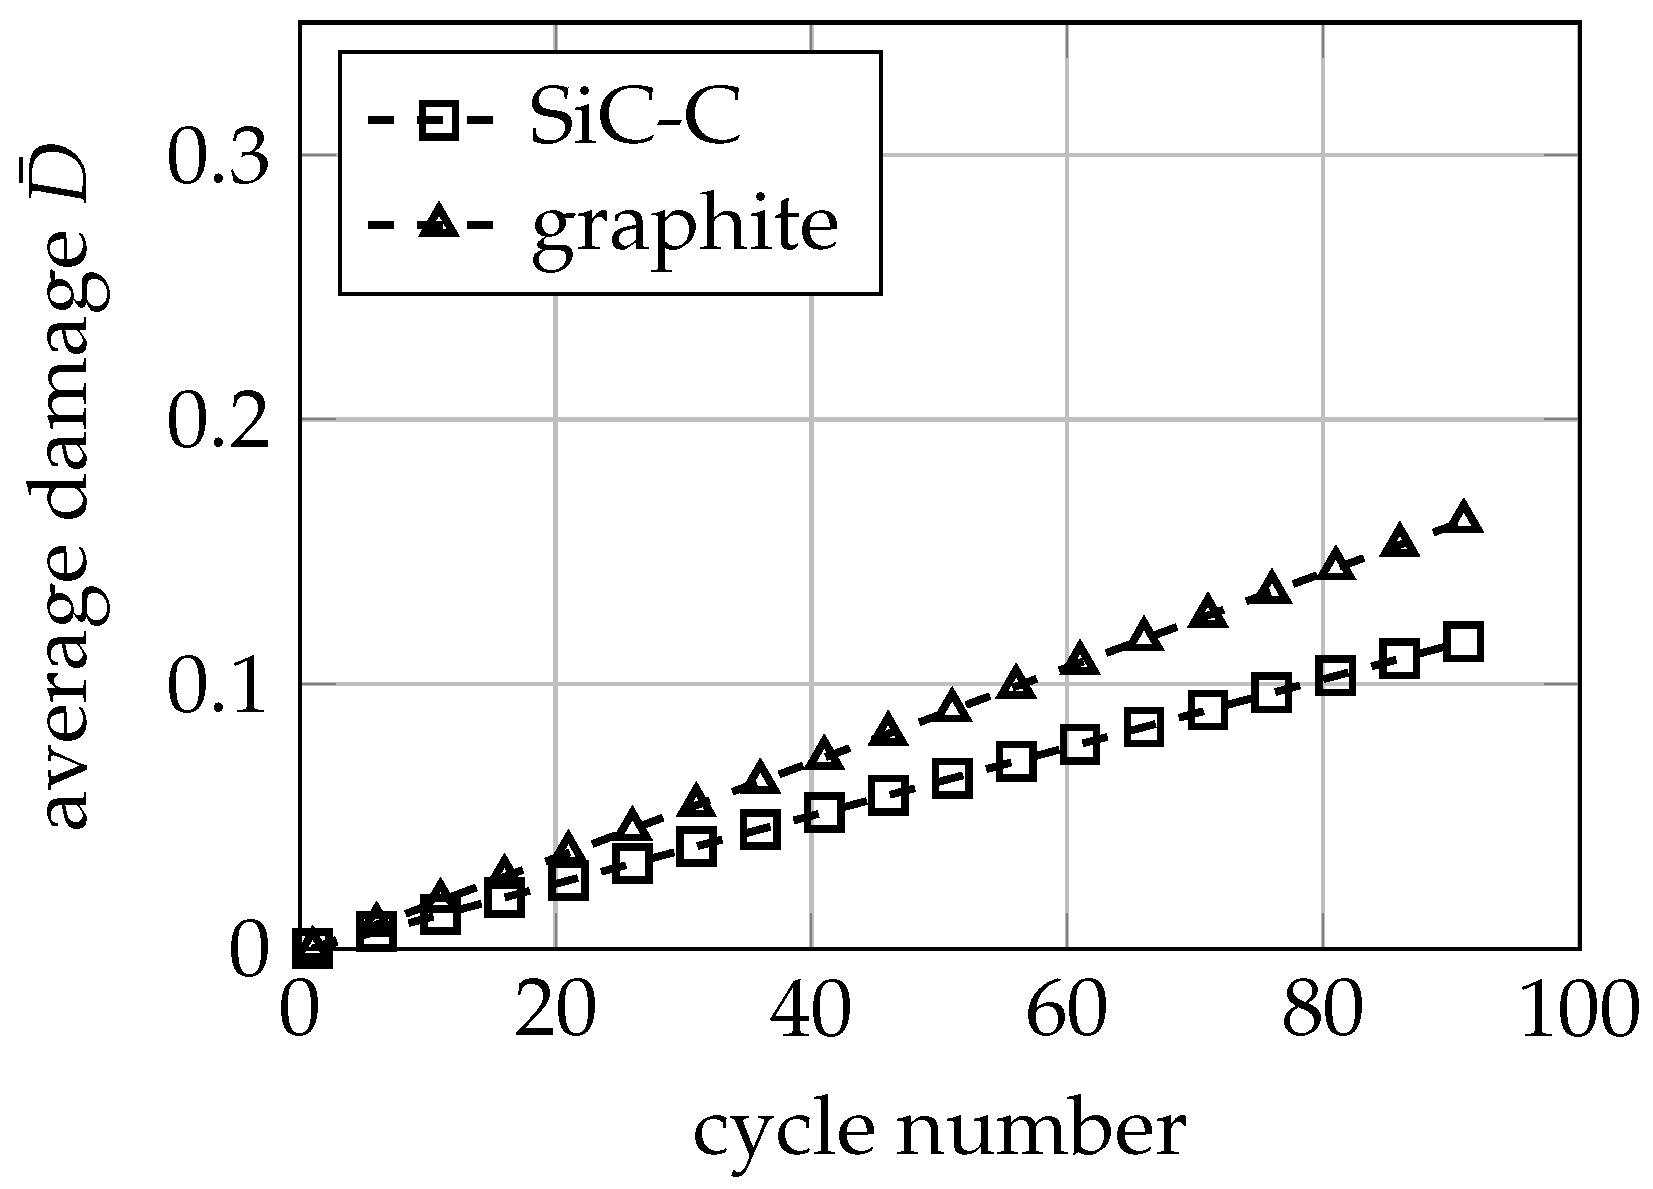
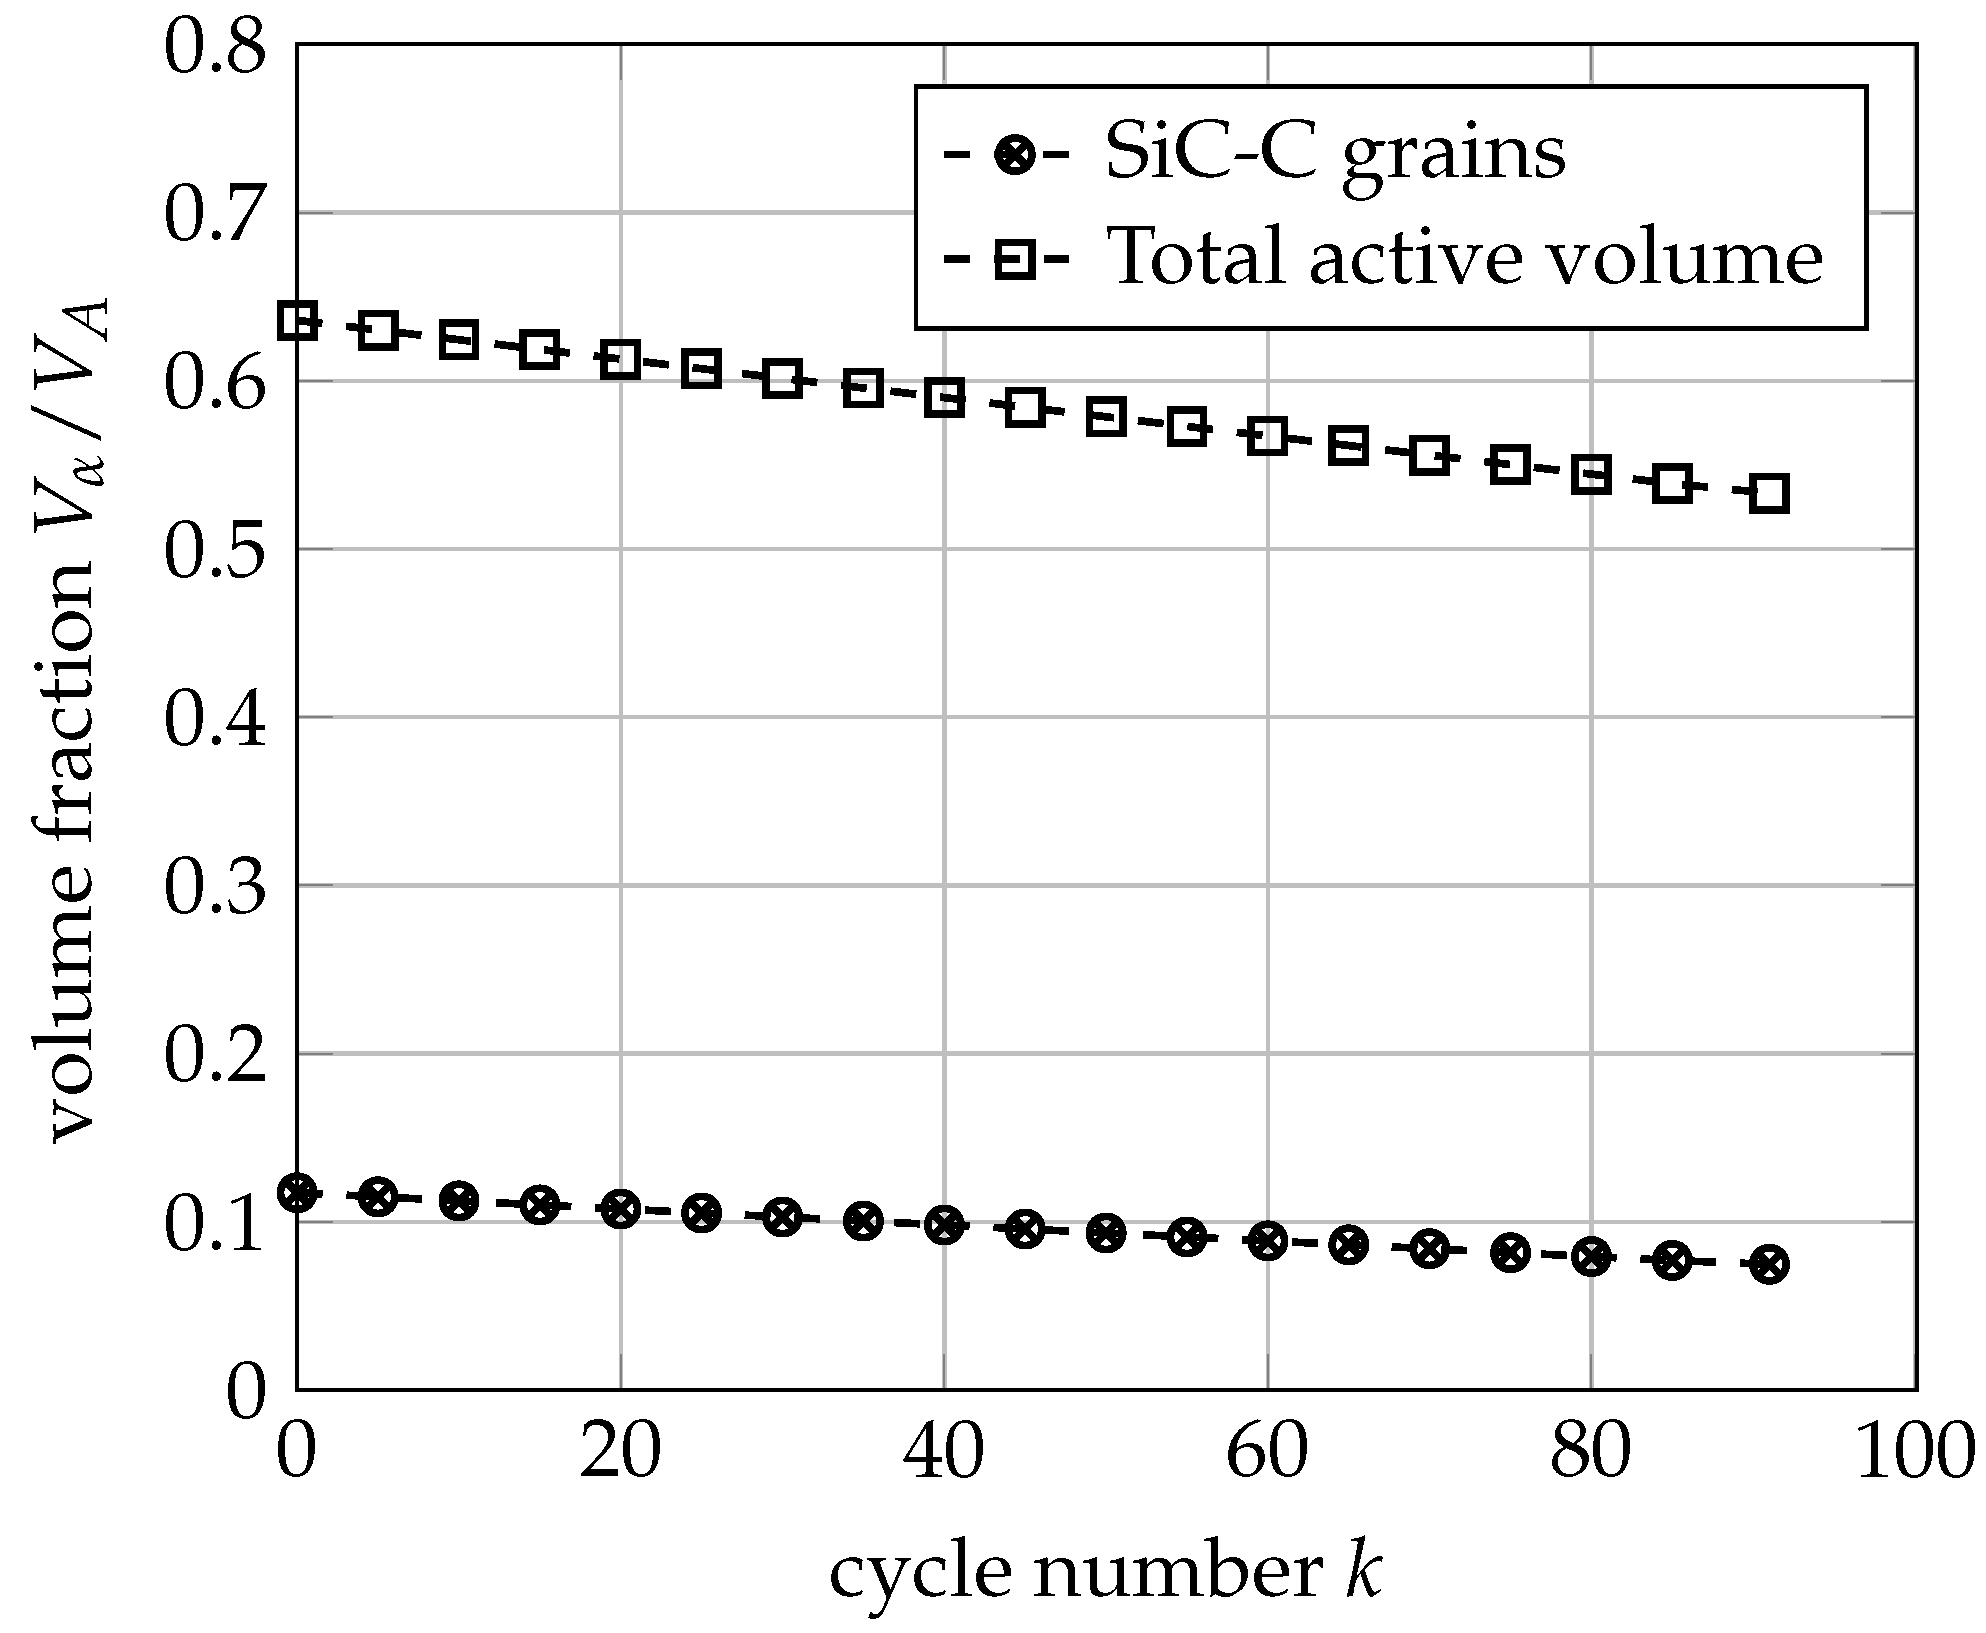
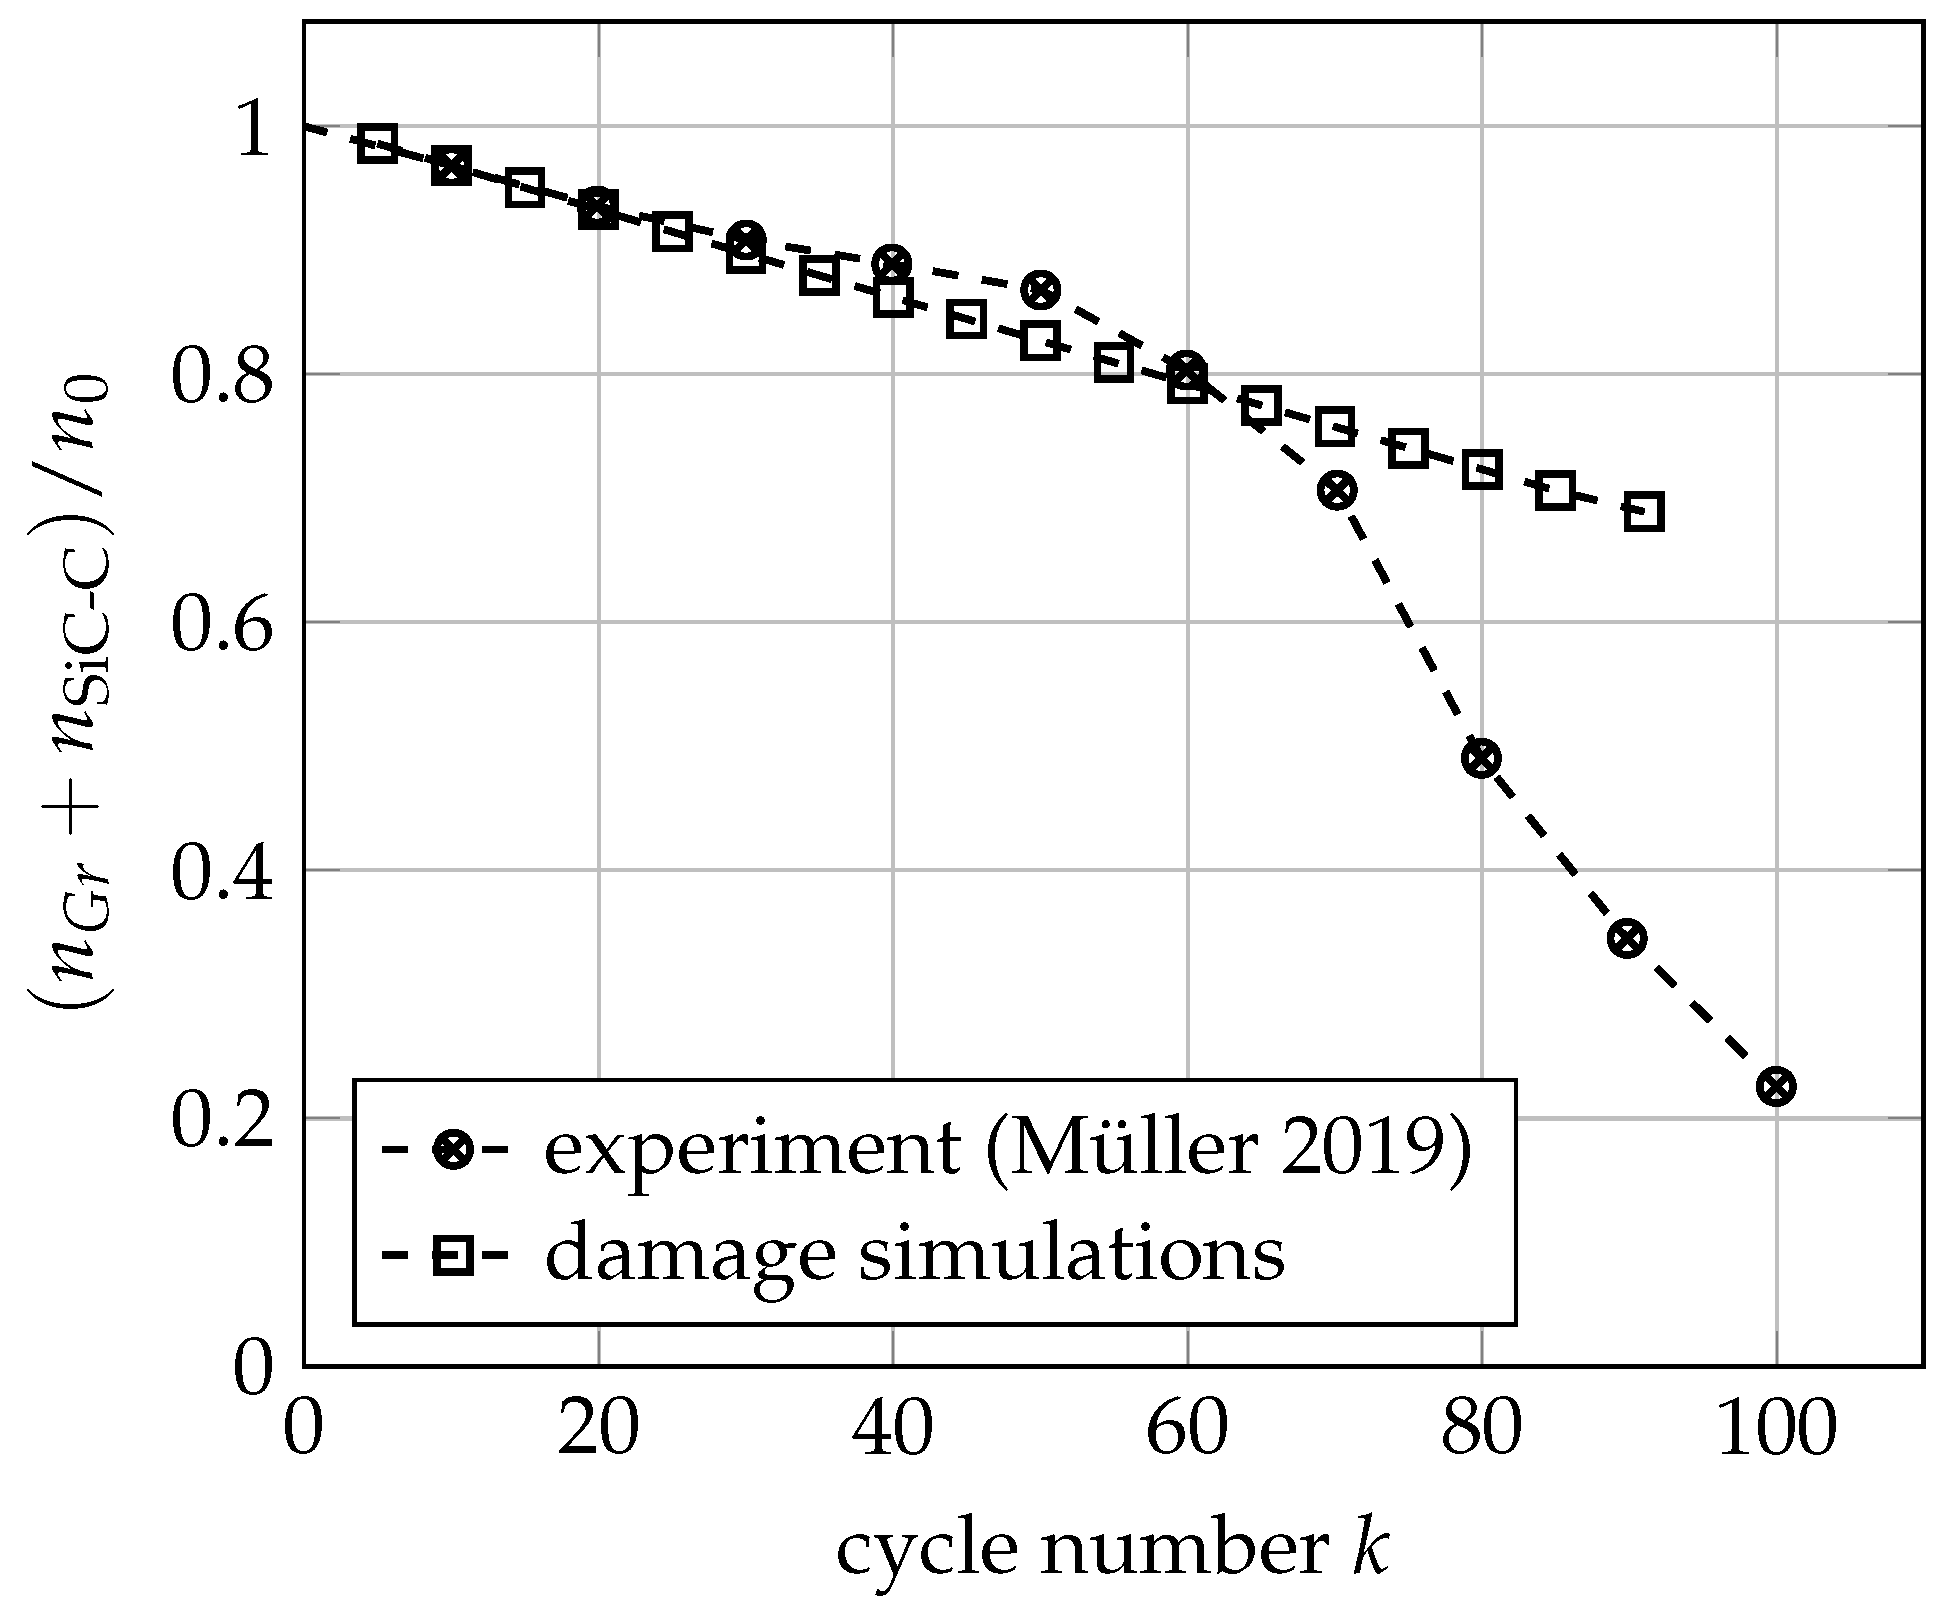
3.3. Mechanical Ageing Simulations for Gr-SiC-C Anode at Electrode Level

In this subsection we show results obtained with the mechanical degradation model of Section 2.2, which was implemented into our software FeelMath. For the computation, the homogenized, three-dimensional Gr-SiC-C anode microstructure from previously is considered, cf. Figure 1, right. From the large volume expansion of silicon, the different expansion coefficients of graphite and SiC-C and the complex microstructure, one can expect a very heterogeneous stress distribution from which the damage field is derived. Starting with an undamaged structure repeated charging and discharging will evolve the damage field and reduce structural integrity. Since coupling of a mechanical simulation with an electrochemical cycling simulation of anode microstructure would incur high computational costs, we use the quasi-static distribution of lithium ions, as described above. This means that at each evaluation point during the cycles we assume an equilibrium lithium distribution according to (6). Throughout 95 cycles the chemical strain is evaluated and the history of the damaged state evolved.
Eventually, the reference geometry and updated heterogeneous state variables are employed throughout the ageing simulation. A stress-free boundary condition is used in the degradation simulation. Alternatively, one can also use user-defined stress boundary condition. However, this may lead to a non existent solution due to the conflict between the externally defined stress state and the reducing stiffness within the damaged phases since the damage model alters the stiffness of the material. The damage initiation and evolution are controlled by the damage strain threshold d 0 and the damage evolution modulus H, which are phenomenological parameters by nature. These parameters are chosen in such a way that the microstructure matches the expected damage state: the damage threshold d 0 is set to be 0.002 for all materials, which is equivalent to 0.2% of strain for the onset of damage. The speed of damage evolution is tuned by H. The morphology of grains and the dissimilar expansion behaviour of particles create higher local strain fields and with a given H, the overall damage evolution is governed. In a first series of simulations we adapted H such that the damage evolution is in a realistic range in comparison to Ref. [26]. In the following results we selected H = 0.004 and H = 0.0012 for graphite and SiC-C, respectively.
In Figure 9 the computed damage field of a slice through the structure is shown after a different number of cycles. After 20 cycles, the damage strain starts growing at the interface of Gr-SiC-C due to the heterogeneous deformation behaviour. At this point, trapped graphite particles within SiC-C grains already start showing damage state. However, the non-confined graphite particles are uniformly damaged to a small extent. This means that the grain phase heterogeneity is higher in the beginning of the degradation process. Since, SiC-C has higher stiffness, trapped graphite particle is moved towards a higher damaged state. Morphological heterogeneities are also visible at the interfaces of grains. However, this starts becoming prominent after 30 cycles. The damage strain grows within the whole microstructure geometry in a similar fashion onward at 40 cycles. The distinction of damaged and non-damaged stains is widened after 50 cycles. On the bottom right side of the domain, the larger SiC-C particle shows damage strain with some delay since there are no adjacent SiC-C particles in the vicinity. Similarly, in the top right side of the contour during 50–60 cycles, graphite grains also exhibit a comparatively lesser damaged state since there are no silicon grains in the adjacent space. At this point, the trapped graphite particles has highest damaged state. These morphological patterns of damage strains lead to a fully damaged state of these confined grains. However, a further investigation into the damage strain contour is not provided since the effective damaged state after 60 cycles deviates from experimental values and will be provided in the next paragraph. In summary we observe that the damage strain is more severe in certain regions due to heterogeneous materials. This is followed by the morphological factors. This is attributed to the higher stiffness of the SiC-C composite, which leads to higher reaction forces to the neighbouring regions as well.
From the value D i of the damage variable in voxel i, the average damage D ¯ per species can be computed as
D ¯ α = 1 N α i α D i with α { Gr , SiC - C }
where N α is the number of voxels of species α . The result is shown in Figure 10. It can be seen that on average the graphite particles are damaged more than SiC-C, which is expected since, locally, graphite particles in the proximity of SiC-C particles receive considerable damage, as revealed by the analysis of the three-dimensional solution field (cf. Figure 9).
Assuming that the mechanical damage reduces the capacity of the electrode, we estimate the residual active volume of phase α at cycle k to be V α ( k ) and the lithium capacity n α ( k ) as
V α = i α ( 1 D i ) v i
n α = i α ( 1 D i ) v i c m a x , i with α { Gr , SiC - C }
where v i is the volume of voxel i and c m a x , i is the corresponding pristine maximum lithium concentration. Using (12), the total active volume fraction and the respective SiC-C fractions are evaluated as a function of the cycle number k, as shown in Figure 11. We note a very slight deceleration of volume loss with the number of cycles. The active part of material in total solid volume fraction decreases over the period of charging cycles. The SiC-C grains show a volume loss similar to the overall volume degradation trend. Since, the total damage ratio for both SiC-C and graphite does not reach a maximum limit, the volume degradation will be decreasing even after 95 cycles until these phases are completely damaged or detached.
In a similar way the residual capacity is estimated according to (13) and plotted in Figure 12. In correspondence to the loss of active volume the capacity also decreases. In the investigated number of 95 cycles it reduces to almost 70% of the initial capacity. Müller et al. [26] have experimentally studied the Si/C-NMC811 chemistry in pouch format under different pressure boundary conditions. At the beginning, the charge reduction curve slowly lowers. After few charging cycles, other factors, i.e, particle detachments and loss of electric contact, also come into effect. The higher damage strain in damage field contours around the grain boundaries can be the reason for electric contact loss. Their detachment from the rest of the active material, as a result, brings the overall battery performance to a lower discharge capacity state.
Our damage model is compared to the aforementioned experimental outcomes since our material definition is similar albeit design details and the microstructure composition might be different. By tuning the damage modulus H we could fit the simulated capacity loss to the initial phase of their experimental data. However, after 60 cycles, the experimental and simulation results start deviating. The experimental degradation drastically accelerates while we observe a steady decrease in the damage state in the simulations. This indicates the limitations of our model: firstly, our current setup is limited to quasi-static lithium concentration distribution, which means that no lithium transport is taken into account, such that contributions due to inhomogeneous lithium distributions cannot arise. Secondly, the particle-to-particle interactions are not considered in the constitutive equations of our model (e.g., sliding, rotation, detachment). Thirdly, other degradation effects might set in, possibly triggered by mechanical degradation, which are not accounted for here, e.g., particle breakage that reduces available capacity. Further electrochemical effects that we cannot address in the current scope are lithium reduction due to growth of the solid electrolyte interphase (SEI) and lithium plating as well as reduction of active material due to irreversible phase transitions.

4. Conclusions and Outlook

In this paper, a multiscale simulation methodology for computing effective mechanical properties and ageing phenomena with a damage strain model is presented for the electrodes, which can be applied to electrode blends such as the mixture of graphite and silicon composite particles. We computed the effective electrode properties based on three-dimensional microstructures and the individual properties of its constituents, taking into account the state-of-charge dependent material expansion. From elemental to effective scale, a two-step homogenization scheme is applied. We started with a homogenization of the SiC-C particles by considering different realizations of the composite particle substructures and computed the effective mechanical response of the homogenized particles. In the next step, full electrode simulations for both anode and cathode are performed, which give the effective mechanical properties on electrode scale. This data can be used in simulations of the full cell—be it purely mechanical or in the context of a pseudo-two-dimensional electrochemical cell model. Since this approach provides the deformed geometries for different SOC, a dependence of porosity can easily be derived. Furthermore, additional transport simulations in the deformed geometries can be carried out to determine the change in effective transport (quantified by tortuosity). Again, this will be an important input for p2d-models if expansion effects are taken into account without the idealized assumptions of spherical active particles, e.g., see Ref. [57].
The second focus of the present paper is the description of mechanical degradation effects. A scalar damage strain model is presented and implemented in the user material subroutine of our solver FeelMath. By quasi-statically cycling the anode up to 95 times between SOC 0 and 1, the microstructure deforms and accumulates damage strain. While the elastic parameters are taken from literature or atomistic simulation data, the damage moduli are treated as tunable parameters. We observed that damage is severe in electrode areas where the heterogeneity of different constituents is higher. In the future we want to replace the quasi-static cycling method with dynamical, three-dimensional ion transport simulations of our Battery and Electrochemistry Simulation Tool BEST [31,58]. In this case, more inhomogeneous lithium ion distributions are expected, which might lead to different stress and damage distributions. It needs to be evaluated to what extent this more detailed, but computationally more expensive, approach is relevant for the practical results. In addition, the opposite coupling is of interest: we will integrate the mechanical damage field D into BEST’s electrochemical transport model. The idea is to incorporate the effect of mechanical ageing into electrochemical cell simulations by making the model parameters in the transport equations such as ion capacity or the solid diffusion coefficient depending on the local damage variable. This way we cannot only evaluate the capacity loss but also consider how mechanical degradation affects the dynamical electrochemical behaviour of the electrodes. The mechanical model also needs to be developed further: since it does not treat the solid material as individual, discrete-element-like particles but as a single material phase, the model will be extended to account for particle–particle contact.

Author Contributions

Conceptualization and methodology: S.A. and J.Z.; software: S.A., H.G.-S. and M.K.; data analysis: S.A.; writing—original draft preparation: S.A.; writing—review and editing: J.Z. and M.K.; visualization: S.A., H.G.-S. and M.K.; supervision and project administration, J.Z.; funding acquisition: J.Z. All authors have read and agreed to the published version of the manuscript.

Funding

This work is part of DEFACTO project funded by the European Union’s Horizon 2020 research and innovation programme under grant agreement No: 875247.

Data Availability Statement

Most of the outcomes of the computations are already given in the manuscript with appropriate links. The microstructures and SOC based elastic moduli are not published yet. Therefore, these can be obtained through technical reports available in DEFACTO [49] project. In case of any special data, the authors can be contacted.

Acknowledgments

The authors are grateful to the Adrien Boulineau and Thomas David from CEA, France, for providing the segmented microstructures of electrodes. A special acknowledgment is necessary to Daniel Mutter, Leonhard Mayrhofer, and Manisha Poudel from Fraunhofer IWM, Germany, for calculating the mechanical properties of silicon by atomistic simulation. Similarly, the contribution of Arpit Mishra from ABEE, Belgium, is acknowledged for providing elastic moduli of NMC811 by atomistic simulation.

Conflicts of Interest

The authors declare no conflict of interest.

Abbreviations

The following abbreviations are used in this manuscript:
BCBoundary conditions
OCVOpen circuit voltage
SiC-CSilicon carbon composite
SOCState of Charge (of particular species)
FIB-SEMFocused Ion Beam Scanning Electron Microscopy
DEFACTOBattery Design and Manufacturing Optimization Project
p4dPseudo 4-Dimensional battery model

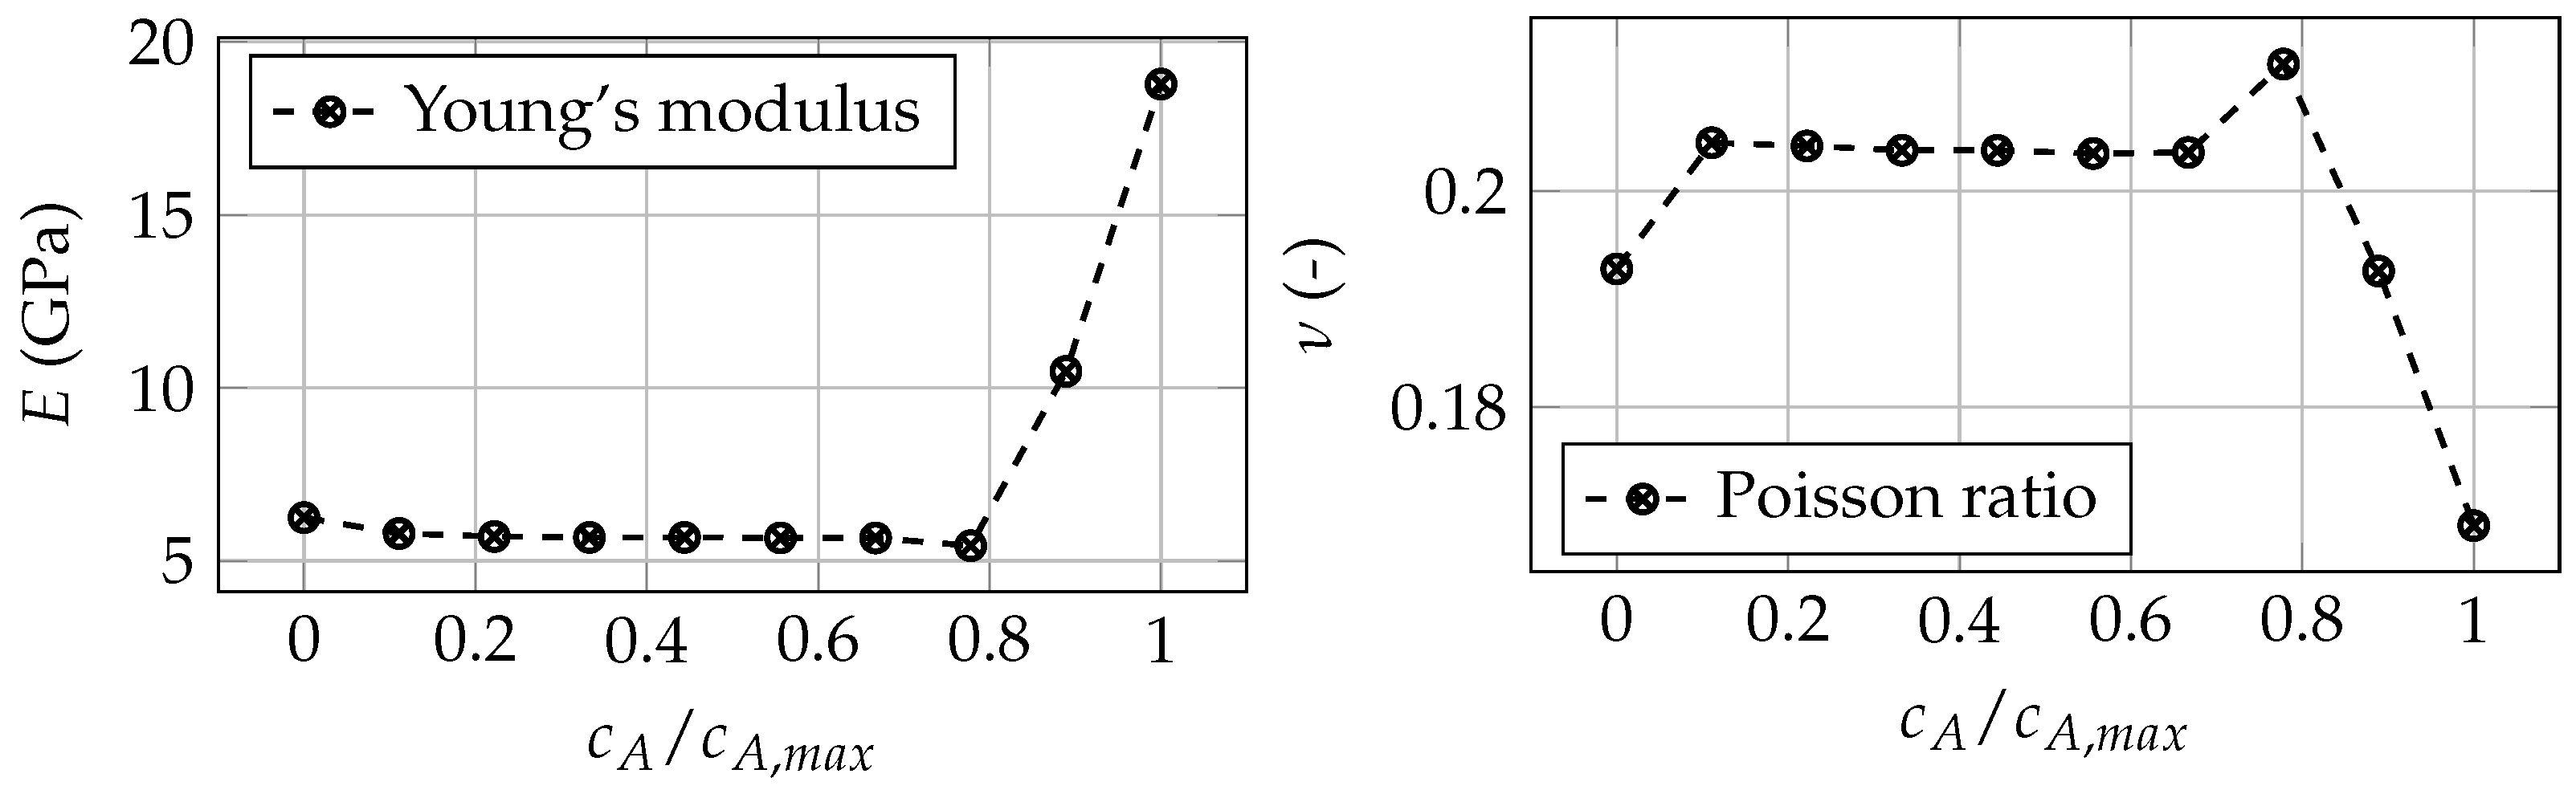
Appendix A. Dependence of Elastic Moduli on State of Charge

The outcome of atomistic simulations at an elemental level is given in the following. Using DFT methods, the elastic character of Si and NMC is calculated. In our simulations, these material behaviours are used to represent the mechanical properties of the electrodes at certain charged states.
Table A1. Bulk modulus (K) and shear modulus (G) of the silicon at different states of charge [51].
c Si c Si , max 0.010.110.220.320.430.480.580.690.791.0
K (GPa)81.1767.5854.4344.1635.9836.1036.3034.1031.8631.11
G (GPa)6047.935.532.9531.931.9831.7329.4027.7626.14
Table A2. Youngs modulus E and Poisson ratio ν of NMC811 at different states of charge [52].
c NMC / c NMC , max 0.190.450.731
E (GPa)145.1082.9577.2337.64
ν (-)0.2990.300.2990.301

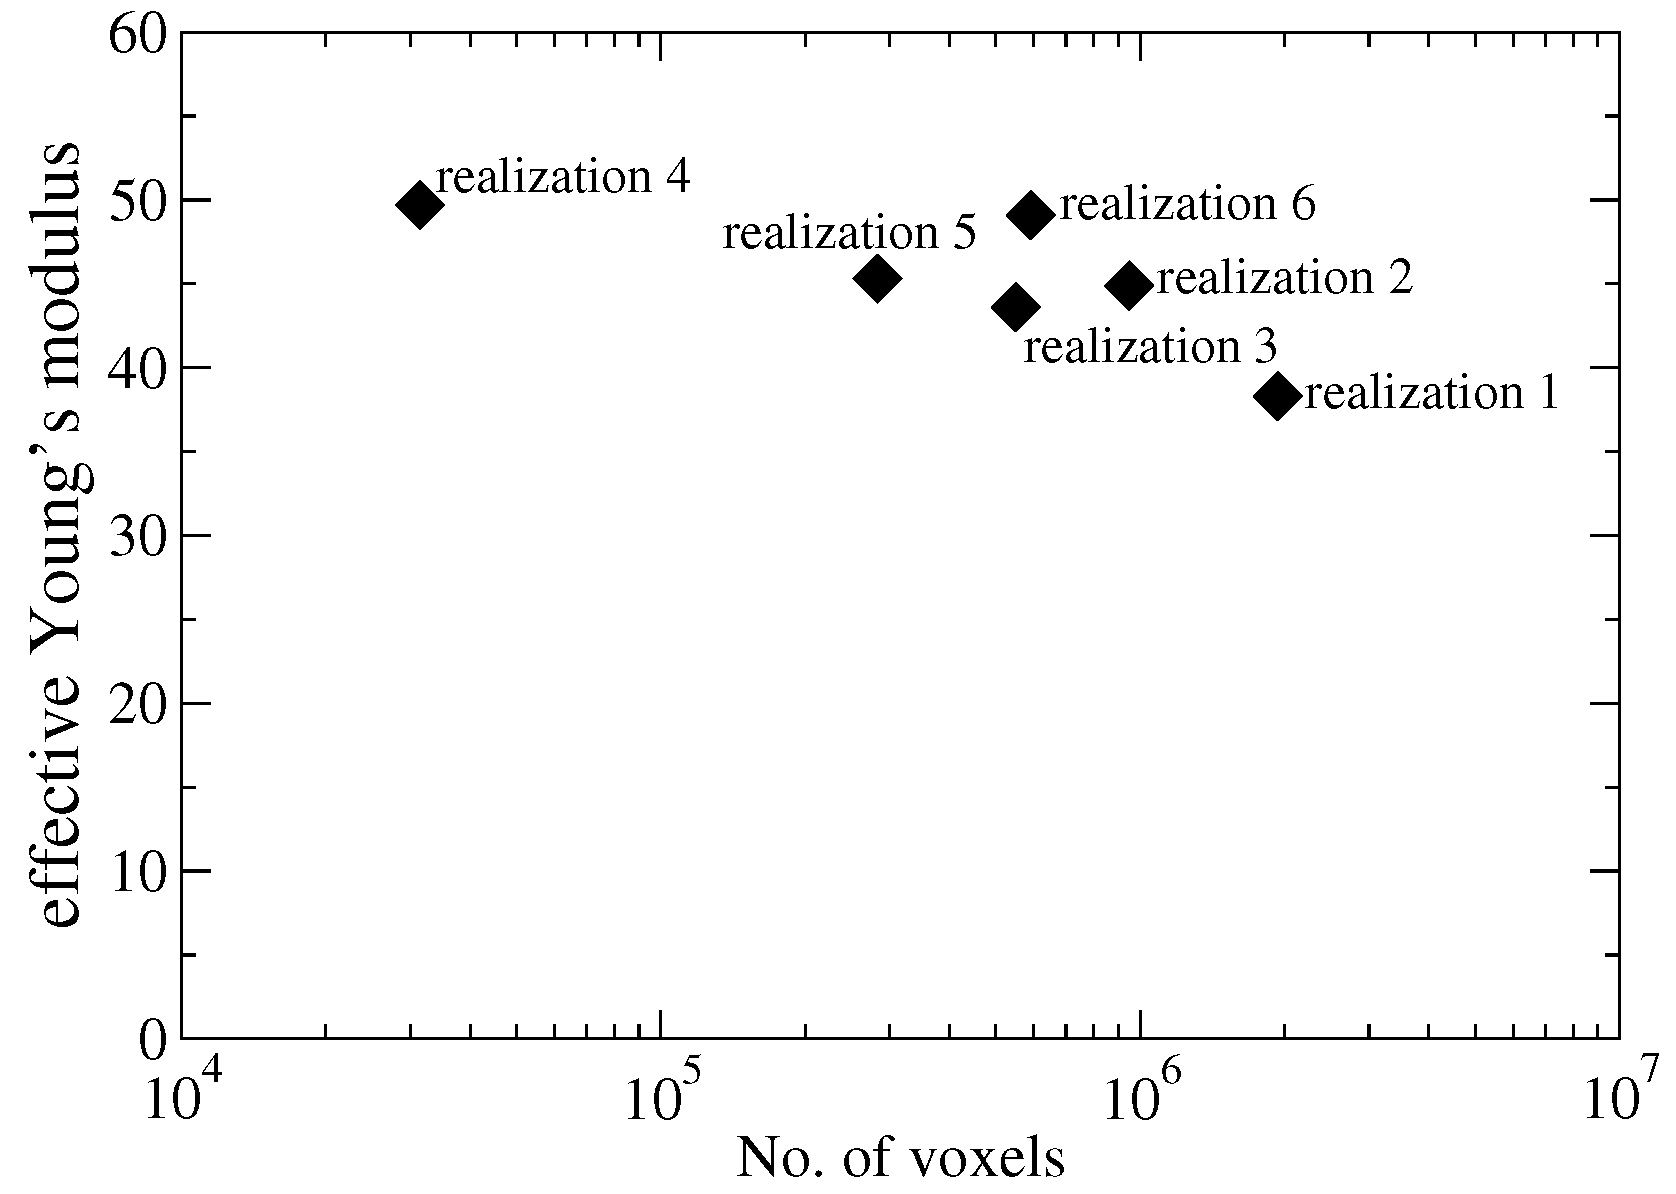
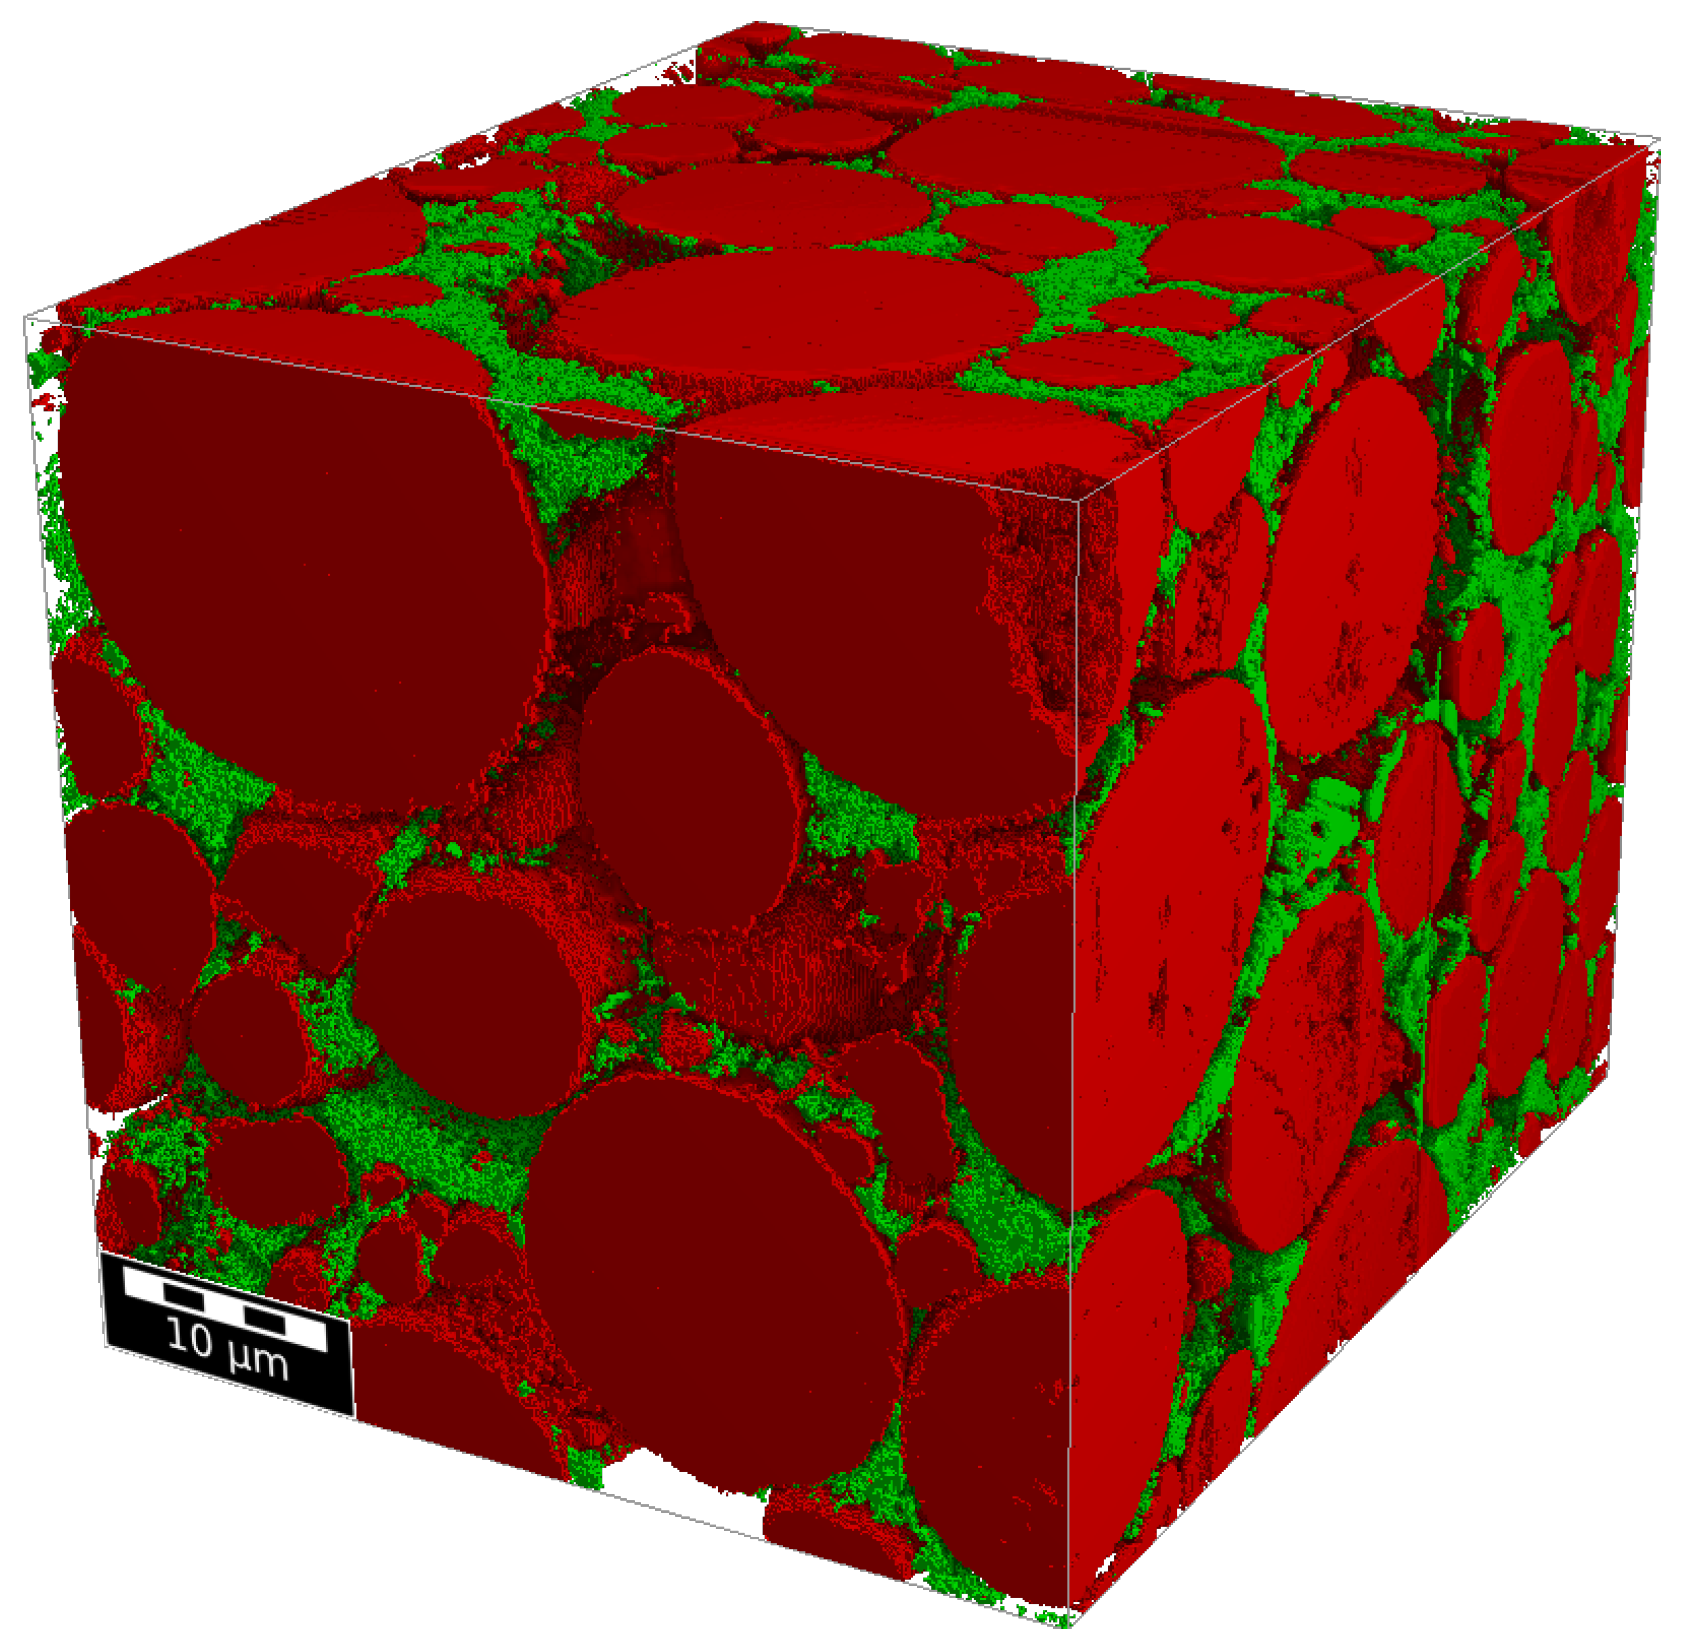
Appendix B. Selection of SiC-C Realizations

Since the silicon content within the SiC-C particles varies, we tried to select representative subvolumes for computing effective SiC-C properties. Therefore, we chose visually representative regions of a different size within the composite particles and computed their effective Young’s moduli. The results are shown in Figure A1. From the six realizations we used the average value for our further computations.
Figure A1. This image describes the calculated effective Young’s modulus for different SiC-C subvolumes of different sizes.
Batteries 09 00582 g0a1

References

  1. Barré, A.; Deguilhem, B.; Grolleau, S.; Gérard, M.; Suard, F.; Riu, D. A review on lithium-ion battery ageing mechanisms and estimations for automotive applications. J. Power Sources 2013, 241, 680–689. [Google Scholar] [CrossRef]
  2. Lee, Y.K.; Song, J.; Park, J. Multi-scale coupled mechanical-electrochemical modeling for study on stress generation and its impact on multi-layered electrodes in lithium-ion batteries. Electrochim. Acta 2021, 389, 138682. [Google Scholar] [CrossRef]
  3. Arora, P.; White, R.E.; Doyle, M. Capacity fade mechanisms and side reactions in lithium-ion batteries. J. Electrochem. Soc. 1998, 145, 3647. [Google Scholar] [CrossRef]
  4. Vetter, J.; Novák, P.; Wagner, M.R.; Veit, C.; Möller, K.C.; Besenhard, J.; Winter, M.; Wohlfahrt-Mehrens, M.; Vogler, C.; Hammouche, A. Ageing mechanisms in lithium-ion batteries. J. Power Sources 2005, 147, 269–281. [Google Scholar] [CrossRef]
  5. Zhang, W.J. Lithium insertion/extraction mechanism in alloy anodes for lithium-ion batteries. J. Power Sources 2011, 196, 877–885. [Google Scholar] [CrossRef]
  6. Luo, F.; Liu, B.; Zheng, J.; Chu, G.; Zhong, K.; Li, H.; Huang, X.; Chen, L. Nano-silicon/carbon composite anode materials towards practical application for next generation Li-ion batteries. J. Electrochem. Soc. 2015, 162, A2509. [Google Scholar] [CrossRef]
  7. McDowell, M.T.; Lee, S.W.; Nix, W.D.; Cui, Y. 25th anniversary article: Understanding the lithiation of silicon and other alloying anodes for lithium-ion batteries. Adv. Mater. 2013, 25, 4966–4985. [Google Scholar] [CrossRef] [PubMed]
  8. Yu, D.Y.; Zhao, M.; Hoster, H.E. Suppressing vertical displacement of lithiated silicon particles in high volumetric capacity battery electrodes. ChemElectroChem 2015, 2, 1090–1095. [Google Scholar] [CrossRef]
  9. Beaulieu, L.; Hatchard, T.; Bonakdarpour, A.; Fleischauer, M.; Dahn, J. Reaction of Li with alloy thin films studied by in situ AFM. J. Electrochem. Soc. 2003, 150, A1457. [Google Scholar] [CrossRef]
  10. Wang, Y.; Liu, Y.; Zheng, J.; Zheng, H.; Mei, Z.; Du, X.; Li, H. Electrochemical performances and volume variation of nano-textured silicon thin films as anodes for lithium-ion batteries. Nanotechnology 2013, 24, 424011. [Google Scholar] [CrossRef]
  11. Louli, A.; Ellis, L.; Dahn, J. Operando pressure measurements reveal solid electrolyte interphase growth to rank Li-ion cell performance. Joule 2019, 3, 745–761. [Google Scholar] [CrossRef]
  12. Yoon, T.; Nguyen, C.C.; Seo, D.M.; Lucht, B.L. Capacity fading mechanisms of silicon nanoparticle negative electrodes for lithium ion batteries. J. Electrochem. Soc. 2015, 162, A2325. [Google Scholar] [CrossRef]
  13. Wetjen, M.; Pritzl, D.; Jung, R.; Solchenbach, S.; Ghadimi, R.; Gasteiger, H.A. Differentiating the degradation phenomena in silicon-graphite electrodes for lithium-ion batteries. J. Electrochem. Soc. 2017, 164, A2840. [Google Scholar] [CrossRef]
  14. Liu, W.; Oh, P.; Liu, X.; Lee, M.J.; Cho, W.; Chae, S.; Kim, Y.; Cho, J. Nickel-rich layered lithium transition-metal oxide for high-energy lithium-ion batteries. Angew. Chem. Int. Ed. 2015, 54, 4440–4457. [Google Scholar] [CrossRef] [PubMed]
  15. Sun, Y.K.; Myung, S.T.; Park, B.C.; Prakash, J.; Belharouak, I.; Amine, K. High-energy cathode material for long-life and safe lithium batteries. Nat. Mater. 2009, 8, 320–324. [Google Scholar] [CrossRef]
  16. Armand, M.; Tarascon, J.M. Building better batteries. Nature 2008, 451, 652–657. [Google Scholar] [CrossRef]
  17. Manthiram, A.; Knight, J.C.; Myung, S.T.; Oh, S.M.; Sun, Y.K. Nickel-rich and lithium-rich layered oxide cathodes: Progress and perspectives. Adv. Energy Mater. 2016, 6, 1501010. [Google Scholar] [CrossRef]
  18. Kim, H.; Kim, M.G.; Jeong, H.Y.; Nam, H.; Cho, J. A new coating method for alleviating surface degradation of LiNi0.6Co0.2Mn0.2O2 cathode material: Nanoscale surface treatment of primary particles. Nano Lett. 2015, 15, 2111–2119. [Google Scholar] [CrossRef]
  19. Song, B.; Sui, T.; Ying, S.; Li, L.; Lu, L.; Korsunsky, A.M. Nano-structural changes in Li-ion battery cathodes during cycling revealed by FIB-SEM serial sectioning tomography. J. Mater. Chem. 2015, 3, 18171–18179. [Google Scholar] [CrossRef]
  20. Du, R.; Bi, Y.; Yang, W.; Peng, Z.; Liu, M.; Liu, Y.; Wu, B.; Yang, B.; Ding, F.; Wang, D. Improved cyclic stability of LiNi0.8Co0.1Mn0.1O2 via Ti substitution with a cut-off potential of 4.5 V. Ceram. Int. 2015, 41, 7133–7139. [Google Scholar] [CrossRef]
  21. Lim, B.B.; Myung, S.T.; Yoon, C.S.; Sun, Y.K. Comparative study of Ni-rich layered cathodes for rechargeable lithium batteries: Li [Ni0.85Co0.11Al0.04] O2 and Li [Ni0.84Co0.06Mn0.09Al0.01] O2 with two-step full concentration gradients. ACS Energy Lett. 2016, 1, 283–289. [Google Scholar] [CrossRef]
  22. Miller, D.J.; Proff, C.; Wen, J.; Abraham, D.P.; Bareño, J. Observation of microstructural evolution in Li battery cathode oxide particles by in situ electron microscopy. Adv. Energy Mater. 2013, 3, 1098–1103. [Google Scholar] [CrossRef]
  23. Pietsch, P.; Westhoff, D.; Feinauer, J.; Eller, J.; Marone, F.; Stampanoni, M.; Schmidt, V.; Wood, V. Quantifying microstructural dynamics and electrochemical activity of graphite and silicon-graphite lithium ion battery anodes. Nat. Commun. 2016, 7, 12909. [Google Scholar] [CrossRef] [PubMed]
  24. Müller, S.; Pietsch, P.; Brandt, B.E.; Baade, P.; De Andrade, V.; De Carlo, F.; Wood, V. Quantification and modeling of mechanical degradation in lithium-ion batteries based on nanoscale imaging. Nat. Commun. 2018, 9, 2340. [Google Scholar] [CrossRef] [PubMed]
  25. Lagadec, M.F.; Zahn, R.; Wood, V. Designing polyolefin separators to minimize the impact of local compressive stresses on lithium ion battery performance. J. Electrochem. Soc. 2018, 165, A1829. [Google Scholar] [CrossRef]
  26. Müller, V.; Scurtu, R.G.; Richter, K.; Waldmann, T.; Memm, M.; Danzer, M.A.; Wohlfahrt-Mehrens, M. Effects of mechanical compression on the aging and the expansion behavior of Si/C-composite| NMC811 in different lithium-ion battery cell formats. J. Electrochem. Soc. 2019, 166, A3796. [Google Scholar] [CrossRef]
  27. Lim, J.M.; Kim, H.; Cho, K.; Cho, M. Fundamental mechanisms of fracture and its suppression in Ni-rich layered cathodes: Mechanics-based multiscale approaches. Extrem. Mech. Lett. 2018, 22, 98–105. [Google Scholar] [CrossRef]
  28. Wenzler, N.; Rief, S.; Linden, S.; Biebl, F.; Rütsche, S.; Glatt, I.; Streit, A.; Zahn, R.; Fingerle, M.; Wood, V. 3D Electrochemical-Mechanical Battery Simulation Tool: Implementation with Full Cell Simulations and Verification with Operando X-ray Tomography. J. Electrochem. Soc. 2023, 170, 020511. [Google Scholar] [CrossRef]
  29. Christensen, J.; Newman, J. A mathematical model of stress generation and fracture in lithium manganese oxide. J. Electrochem. Soc. 2006, 153, A1019. [Google Scholar] [CrossRef]
  30. Zhang, X.; Shyy, W.; Sastry, A.M. Numerical simulation of intercalation-induced stress in Li-ion battery electrode particles. J. Electrochem. Soc. 2007, 154, A910. [Google Scholar] [CrossRef]
  31. Fraunhofer Institute for Industrial Mathematics ITWM. The Battery and Electrochemistry Simulation Tool BEST. Available online: https://itwm.fraunhofer.de/best (accessed on 1 November 2023).
  32. Latz, A.; Zausch, J. Multiscale modeling of lithium ion batteries: Thermal aspects. Beilstein J. Nanotechnol. 2015, 6, 987–1007. [Google Scholar] [CrossRef] [PubMed]
  33. Ciria Aylagas, R.; Ganuza, C.; Parra, R.; Yañez, M.; Ayerbe, E. cideMOD: An Open Source Tool for Battery Cell Inhomogeneous Performance Understanding. J. Electrochem. Soc. 2022, 169, 090528. [Google Scholar] [CrossRef]
  34. Golmon, S.; Maute, K.; Dunn, M.L. Numerical modeling of electrochemical–mechanical interactions in lithium polymer batteries. Comput. Struct. 2009, 87, 1567–1579. [Google Scholar] [CrossRef]
  35. Wu, B.; Lu, W. A battery model that fully couples mechanics and electrochemistry at both particle and electrode levels by incorporation of particle interaction. J. Power Sources 2017, 360, 360–372. [Google Scholar] [CrossRef]
  36. Wu, B.; Lu, W. A consistently coupled multiscale mechanical–electrochemical battery model with particle interaction and its validation. J. Mech. Phys. Solids 2019, 125, 89–111. [Google Scholar] [CrossRef]
  37. Wu, L.; Xiao, X.; Wen, Y.; Zhang, J. Three-dimensional finite element study on stress generation in synchrotron X-ray tomography reconstructed nickel-manganese-cobalt based half cell. J. Power Sources 2016, 336, 8–18. [Google Scholar] [CrossRef]
  38. Mendoza, H.; Roberts, S.A.; Brunini, V.E.; Grillet, A.M. Mechanical and electrochemical response of a LiCoO2 cathode using reconstructed microstructures. Electrochim. Acta 2016, 190, 1–15. [Google Scholar] [CrossRef]
  39. Xu, R.; Yang, Y.; Yin, F.; Liu, P.; Cloetens, P.; Liu, Y.; Lin, F.; Zhao, K. Heterogeneous damage in Li-ion batteries: Experimental analysis and theoretical modeling. J. Mech. Phys. Solids 2019, 129, 160–183. [Google Scholar] [CrossRef]
  40. Hofmann, T.; Westhoff, D.; Feinauer, J.; Andrä, H.; Zausch, J.; Schmidt, V.; Müller, R. Electro-chemo-mechanical simulation for lithium ion batteries across the scales. Int. J. Solids Struct. 2020, 184, 24–39. [Google Scholar] [CrossRef]
  41. Schneider, M.; Ospald, F.; Kabel, M. Computational homogenization of elasticity on a staggered grid. Int. J. Numer. Methods Eng. 2016, 105, 693–720. [Google Scholar] [CrossRef]
  42. Kabel, M.; Fliegener, S.; Schneider, M. Mixed boundary conditions for FFT-based homogenization at finite strains. Comput. Mech. 2016, 57, 193–210. [Google Scholar] [CrossRef]
  43. Grimm-Strele, H.; Kabel, M. FFT-based homogenization with mixed uniform boundary conditions. Int. J. Numer. Methods Eng. 2021, 122, 7241–7265. [Google Scholar] [CrossRef]
  44. Grimm-Strele, H.; Kabel, M. Runtime optimization of a memory efficient CG solver for FFT-based homogenization: Implementation details and scaling results for linear elasticity. Comput. Mech. 2019, 64, 1339–1345. [Google Scholar] [CrossRef]
  45. Lory, P.F.; Mathieu, B.; Genies, S.; Reynier, Y.; Boulineau, A.; Hong, W.; Chandesris, M. Probing Silicon Lithiation in Silicon-Carbon Blended Anodes with a Multi-Scale Porous Electrode Model. J. Electrochem. Soc. 2020, 167, 120506. [Google Scholar] [CrossRef]
  46. Mazars, J.; Pijaudier-Cabot, G. Continuum damage theory—Application to concrete. J. Eng. Mech. 1989, 115, 345–365. [Google Scholar] [CrossRef]
  47. Mazars, J.; Hamon, F.; Grange, S. A new 3D damage model for concrete under monotonic, cyclic and dynamic loadings. Mater. Struct. 2015, 48, 3779–3793. [Google Scholar] [CrossRef]
  48. Mathieu, B.; Gerard, M.; Daniel, L.; Boulineau, A. WP 2: Periodic Technical Report—Part B; Technical Report; The French Alternative Energies and Atomic Energy Commission (CEA): Grenoble, France, 2022. [Google Scholar]
  49. DEFACTO—Battery Design and Manufacturing Optimization through Multiphysics Modelling. Battery Design and Manufacturing Optimization Project. Funded by the European Union through Horizon 2020. Available online: https://defacto-project.eu (accessed on 1 November 2023).
  50. He, Y.L.; Hu, H.; Song, Y.C.; Guo, Z.S.; Liu, C.; Zhang, J.Q. Effects of concentration-dependent elastic modulus on the diffusion of lithium ions and diffusion induced stress in layered battery electrodes. J. Power Sources 2014, 248, 517–523. [Google Scholar] [CrossRef]
  51. Mutter, D.; Mayrhofer, L.; Poudel, M. Atomistic Simulations for Silicon at Different Lithiation States; Technical Report; IWM Fraunhofer: Freiburg im Breisgau, Germany, 2022. [Google Scholar]
  52. Mishra, A. WP 5: Periodic Technical Report—Part B; Technical Report; Avesta Battery and Energy Engineering (ABEE): Brussels, Belgium, 2023. [Google Scholar]
  53. Math2Market GmbH. MaterialDataBase Included in GeoDict2023. Available online: https://www.math2market.com (accessed on 1 November 2023).
  54. Li, J.; Downie, L.E.; Ma, L.; Qiu, W.; Dahn, J.R. Study of the Failure Mechanisms of LiNi0.8Mn0.1Co0.1O2 Cathode Material for Lithium Ion Batteries. J. Electrochem. Soc. 2015, 162, A1401. [Google Scholar] [CrossRef]
  55. Hwang, S.; Kim, S.M.; Bak, S.M.; Chung, K.Y.; Chang, W. Investigating the Reversibility of Structural Modifications of LixNiyMnzCo1-y-zO2 Cathode Materials during Initial Charge/Discharge, at Multiple Length Scales. Chem. Mater. 2015, 27, 6044–6052. [Google Scholar] [CrossRef]
  56. Ghanty, C.; Markovsky, B.; Erickson, E.M.; Talianker, M.; Haik, O.; Tal-Yossef, Y.; Mor, A.; Aurbach, D.; Lampert, J.; Volkov, A.; et al. Li-ion Extraction/Insertion of Ni-Rich Electrodes: In Situ XRD and Raman Spectroscopy Study. ChemElectroChem 2015, 2, 1406. [Google Scholar] [CrossRef]
  57. Rieger, B.; Erhard, S.V.; Rumpf, K.; Jossen, A. A New Method to Model the Thickness Change of a Commercial Pouch Cell during Discharge. J. Electrochem. Soc. 2016, 163, A1566–A1575. [Google Scholar] [CrossRef]
  58. Latz, A.; Zausch, J. Thermodynamic consistent transport theory of Li-ion batteries. J. Power Sources 2011, 196, 3296–3302. [Google Scholar] [CrossRef]
Figure 1. FIB-SEM image segmentation of a graphite SiC-C anode blend. In the structure on the left the SiC-C particles are identified by particles with green silicon flakes included. The pure red particles consist of graphite alone. The six small cubes are SiC-C substructures used for effective property computation. On the right we show the same structure, but with SiC-C homogenized.
Batteries 09 00582 g001
Figure 2. Resulting open-circuit-voltage (OCV) for SiC-C particles (red) based on the OCVs of pure graphite and silicon (black) [45].
Batteries 09 00582 g002
Figure 3. Computed effective Young’s modulus E (left) and Poisson ratio ν (right) for the graphite SiC-C anode blend’s relative lithium content c A / c A , m a x .
Batteries 09 00582 g003
Figure 4. Relative thickness change of the graphite SiC-C anode blend vs. lithium content.
Batteries 09 00582 g004
Figure 5. FIB-SEM image of the NMC811 microstructure provided by Ref. [48]. Red voxels represent NMC811 while green areas are conductive additives and binder.
Batteries 09 00582 g005
Figure 6. Dependence of the molar expansion coefficient of NMC811 on the lithiation state, based on Ref. [28].
Batteries 09 00582 g006
Figure 7. Effective mechanical properties of the NM811 microstructure for the different lithiation states. Left: Young’s modulus E C . Right: Poisson ratio ν C .
Batteries 09 00582 g007
Figure 8. Relative thickness change of the cathode NMC811 vs. lithium content.
Batteries 09 00582 g008
Figure 9. Top left: Slice through the pristine microstructure (gray: pore). The remaining images show the damage strain field D after the indicated number of cycles.
Batteries 09 00582 g009
Figure 10. Average value of the damage strain D ¯ in graphite and SiC-C particles during quasi-static cycling.
Batteries 09 00582 g010
Figure 11. Decrease of active volume ratio V α / V A during cycling due to mechanical degradation. Here, V A is the total volume of the pristine anode structure, including pores.
Batteries 09 00582 g011
Figure 12. Decrease of the relative capacity during cycling. Here n 0 is the capacity of the pristine electrode. Experimental data from [26].
Batteries 09 00582 g012
Table 1. Computed effective elastic moduli of the SiC-C composite at different states of charge. For completeness we also include the corresponding relative concentration c / c m a x in the respective phases.
SOC%01119293847576682100
c SiC - C c SiC - C , m a x 00.10.19390.28600.37900.47200.56600.66300.81991.0
c G r c G r , m a x 00.0710.0860.0940.1020.1100.1450.21680.51080.9711
E SiC - C /GPa52.9646.9542.61741.36841.36840.74940.660339.88238.033791.0
ν SiC - C 0.2720.3080.31590.30850.30850.30120.302390.30310.32990.22
Table 2. Components of anisotropic elastic stiffness tensor of SiC-C in GPa.
C 11 C 12 C 13 C 23 C 22 C 33 C 44 C 55 C 66
62.6727.5827.3927.3862.8261.1218.018.0118.21
Disclaimer/Publisher’s Note: The statements, opinions and data contained in all publications are solely those of the individual author(s) and contributor(s) and not of MDPI and/or the editor(s). MDPI and/or the editor(s) disclaim responsibility for any injury to people or property resulting from any ideas, methods, instructions or products referred to in the content.

