Article

Optimisation of Industrially Relevant Electrode Formulations for LFP Cathodes in Lithium Ion Cells

Warwick Manufacturing Group, University of Warwick, Coventry CV4 7AL, UK
*
Author to whom correspondence should be addressed.
Batteries 2023, 9(4), 192; https://doi.org/10.3390/batteries9040192
Submission received: 24 February 2023 / Revised: 17 March 2023 / Accepted: 18 March 2023 / Published: 23 March 2023

Abstract

:
The electrode formulation has a significant effect on the performance of lithium ion cells. The active material, binder, and conductive carbon all have different roles, and finding the optimum composition can be difficult using an iterative approach. In this study, a design of experiment (DoE) methodology is applied to the optimisation of a cathode based on lithium iron phosphate (LFP). The minimum LFP content in the electrodes is 94 wt%. Seventeen mixes are used to evaluate adhesion, resistivity, and electrochemical performance. The coating adhesion increases with binder content, and the coating conductivity increases with carbon nano-tube content. The best coatings achieve 5C:0.2C capacity ratios above 50%, despite the relatively high coat weight. Models based on just the component mixture do not replicate the discharge capacities at high rates. However, a combined mixture + process model can fit the data, and is used to predict an optimum formulation.

1. Introduction

Most papers on lithium iron phosphate (LFP) cathode materials have titles along the lines of “A new synthetic method for carbon coated LFP”, or “Understanding the reaction mechanisms of LFP cathodes”. This paper is not one of them. Instead, it is focused on making the best possible cathode, with lithium iron phosphate as the active material. Energy density is the most important characteristic of any battery, and therefore we are interested in industrially relevant electrode formulations and coat weights. Inevitably, this leads to design compromises, between energy density and power density, and between adhesion and resistivity.
Lithium iron phosphate (LiFePO4) with an olivine structure was first used as a lithium ion battery cathode material in 1997 [1,2,3,4,5]. It has a different structure and a different operating mechanism to the layered cathode material family (LCO = LiCoO2, NCA = LiNi0.8Co0.15Al0.05O2 and NMC = LiNi1−x−yMnxCoyO2). The latter operate via de-intercalation and re-intercalation of lithium ions, with a corresponding change in the oxidation state of the transition metals. LFP cathodes work via a particle-by-particle conversion between the LiFePO4 and FePO4 phases. This leads to a number of unusual effects, which are now increasingly understood [6]. It also means that solid-state diffusion is not an important part of the process, over the majority of the state of charge range.
The main advantage of LFP over NMC cathodes is cost; iron is significantly cheaper than nickel and especially cobalt. Another advantage is safety; the layered cathode materials have a thermal decomposition temperature of 220–300 °C, depending on composition [7]. In forced thermal runaway tests on 18650 cylindrical cells, the LFP cathode cells had the highest onset temperature and the lowest maximum temperature [8]. Cathode decomposition is one of several possible exothermic reactions during the heating of lithium ion cells, so LFP batteries cannot be considered safe under all conditions (no battery is). LFP has a lower reversible capacity than NMC materials, particularly as the nickel content increases. However, the main technical issue with LFP materials is their low electronic conductivity.
Cathodes using layered materials, such as NMC, are usually formulated with the active material, a polymeric binder, and one or more conductive carbon additives. Carbon black nano-particles are used to give short-range conduction, with carbon nano-tubes or flakes providing longer-range conduction pathways. Most LFP materials are supplied as individually carbon-coated particles, but further carbon is still required in the electrode. To help with the reaction kinetics, LFP materials are prepared as nano-particles. These primary particles can be used directly, or incorporated into micron sized secondary particles. The latter are generally considered easier to mix and coat.
Given these restrictions, the manufacture of high-quality LFP cathodes requires careful optimisation of the electrode formulation and mixing protocol. The formulations used in several hundred LFP publications were surveyed and analysed [9]. The vast majority used poly vinylidene fluoride (PVDF) as the binder, and NMP as the coating solvent (N-methyl pyrrolidone). The most common combination of active:binder:carbon ratios was 80:10:10 wt%. This is acceptable when evaluating the product of a new synthetic route, but commercial cell makers now expect an active material content of >90%. The highest active content formulation found was 94:3:3 [10]. The coat weights (and hence areal capacities) of the coatings were not reported, but would be expected to be >2 mA h cm−2 for a power cell, and >3 mA h cm−2 for an energy cell. For example, the LFP cathode in the A123 18650 M1A high-power cell has a coat weight of 140 gsm, and an areal capacity of 1.3 mA h cm−2 [11].
There are several commercial manufacturers of LFP materials, and each produces multiple grades. Some contain just sub-micron-sized primary particles, while others are larger secondary particles, assembled from primary particles. Both types can have different particle size distributions. The other main differentiator is the amount of conductive carbon, and the precursor used to prepare it.
NMP is the standard solvent for PVDF binders. Ideally, it should be replaced by a non-toxic solvent with a lower boiling point, preferably water. This either means using a water-compatible version of PVDF [12,13], or changing to a different binder system [14,15,16,17,18,19,20]. However, even if such a binder system can be proven, there are potential issues of hydrolysis of the LFP active material during mixing and coating. There are conflicting opinions about whether carbon-coated LFP is damaged by exposure to water, e.g., adsorbed water forms LiOH and oxidises iron(II) to iron(III). LFP manufacturers typically include the relative humidity during storage in their specification documents. The key is probably the drying step after coating with an aqueous binder, e.g., 170 °C is better than 120 °C [16]. In the work described here, we continued to use NMP as the coating solvent.
Various studies looked at the influence of different carbon additives in LFP electrodes [21]. For example, five carbon blacks with different surface areas were evaluated in electrodes with a LFP:PVDF:CB = 91:5:4 wt% formulation [22]. The best results were obtained for the carbon black with an intermediate surface area of 160 m2 g−1. Carbon coated LFP materials were coated with extra Super P® carbon, using a mechano-fusion process [23]. The best performance was for LFP materials with an extra 1.4 wt% carbon.
Mixing, coating, and calendering each have an important impact on the quality of the electrode. The rheological properties of a series of aqueous LFP mixes were extensively studied [16]. Drying temperatures from 60 to 120 °C were investigated for a LFP:PVDF:Super P® = 80:10:10 wt% coating [24]. The preferred temperature range of 80–100 °C was attributed to an optimum distribution of the PVDF binder. The properties of LFP:PVDF:C65 = 90:5:5 wt% coatings were investigated, before and after calendering down to 26% porosity [25]. Calendering made a big difference to the rate performance and the impedance spectra.
A design of experiments (DoE) approach is frequently used during the optimisation of many types of processes, including the development of lithium ion batteries [26]. Values for the input or control parameters are selected within a specific range. The modelling software then defines values for those parameters to be used in a set of experiments. This allows a significant reduction in the number of tests that have to be performed, compared to the full possible test matrix. Each combination of parameters tested is likely to be sub-optimum. However, the software can then calculate the optimum parameter set, to minimise or maximise one or more of the output parameters.
In the work described here, the DoE was designed to identify the best mix formulation for an LFP cathode containing an active material (LFP), a binder (PVDF), graphite (KS6L), and single-wall carbon nano-tubes (SWCNT). As such, the DoE was inherently a “mixture” or formulation DoE [27,28,29]. The intention was to keep all other aspects of the mixing, coating, and testing constant. However, for reasons discussed later, this was difficult to achieve in practice. Therefore, some processing inputs were also included in a “mixture + process” or KCV model [30]. There is a brief introduction to these types of models in the Supplement Information document [27,28,30,31,32]. SWCNT are more expensive than carbon black, but are used in relatively small quantities, and offer better long-range conduction pathways for the carbon coated LFP particles.
Previously, a DoE approach was applied to LFP electrode formulations [29]. The mixes contained LFP as the active material, C65 and/or carbon nano-fibres as the conductivity enhancing agent, and one of three binders; PVDF, HNBR, or TPE (HNBR = hydrogenated nitrile butadiene rubber, TPE = terpolymer of ethylene, ethyl acrylate, and maleic anhydride). The formulation ranges were AM (75–95 wt%), C65 (0–20 wt%), CNF (0–10 wt%), and binder (3–20 wt%). A DoE approach was also applied to NMC-622 mixes, with AM (80–95 wt%), PVDF (2–5 wt%), graphite (1–5 wt%), and C65 (2–10 wt%) [33]. The graphite content had the greatest impact on the discharge capacity at C/20, followed by the carbon black, and then a triple combination of all three inactive components. Recently, formulation optimisation strategies were developed for cathodes with three cathode materials; NMC-622, LFP, and LiMn2O4 spinel [34]. For LFP, the formulations used were LFP:PVDF:C65 = 88:10:2, 91.5 ± 1:6.5:2 ± 1, and 95:3:2 wt%. Adhesion, electronic conductivity, and various electrochemical measurements were made, as first the binder content and then the carbon black content were optimised.
In contrast, the maximum binder content used in our studies was 3 wt%. This paper describes the experimental and modelling work involved in implementing a DoE for cathode formulation. Successfully fitting a model to the data allows us to understand how the input features influence electrode properties and predict the performance of an optimised formulation. In particular, we can achieve 5C:0.2C capacity ratios above 50%, for relatively high coat-weight electrodes. Mixture only models are very powerful, but given the complexity of lithium ion cell manufacturing, process features will also have an impact, as the active material content is maximised. To the best of our knowledge, this is the first time that a Scheffé-type mixture + process and multiple linear regression model has been applied to lithium ion manufacturing research.

2. Materials and Methods

2.1. Modelling Approach

The minimum and maximum values selected for the binder and carbon additives are shown in Table 1. The active material content was adjusted to give a total of 100 wt%. The DoE software Design-Expert produced an initial set of fifteen mixes, and the compositions are listed in Table S1. Experimentally, Mix02 had low adhesion, particularly after calendering, which made it difficult to manufacture coin cells. Therefore, two further mixes were added to the list, with similar compositions to Mix02.
As already mentioned, the intention was to keep all the other process steps constant, but this was difficult in practice. This led to a range of coat weight values, and a spread of porosity values after calendering. These two parameters were therefore introduced as “process” variables in the modelling process.

2.2. Experimental

The components used in the mixes were LFP (Aleees A19, D50 = 11 ± 2 um), PVDF (Solvay 5130, molecular weight = 1.3 MDa), KS6L graphite (Imerys, D50 = 3.4 um), and SWCNT (Tuball). The PVDF was pre-dissolved in NMP as an 8 wt% solution. The carbon nano-tubes were supplied pre-dispersed at 0.4 wt% in a mixture of NMP with 2 wt% PVDF. This meant that any mix combinations with a high SWCNT content and a low PVDF content could not be produced.
The materials were mixed using a Thinky® mixer. Extra NMP was added to give the same 50.5% solids content in all 17 mixes. This produced a wide range of viscosities, but all the mixes could be coated. The mix viscosities were measured using a TA Instruments HR20 rheometer. The mixes were coated onto 12 um aluminium foil using an Erichsen draw down coater. The target coat weight was 170 gsm (g m−2). The coater used coating bars with fixed blade gaps. If the target coat weight was between two coating bars, then the coating speed was adjusted. For mixes with normal solid contents, increasing the coating speed reduces the coat weight slightly [35].
After drying on a hot plate at 80 °C inside a fume cupboard, the coatings were calendered using an Innovative Machines calender set to 85 °C. The target porosity was 40%. However, calendering was stopped at the point where the coatings began to crack or delaminate. This meant that coatings with good adhesion were calendered to a lower porosity than those with poor adhesion.
The calendered and uncalendered coatings were characterised using two techniques. Adhesion was measured with a Zwick 0.5 kN device, in a 180° pull test configuration. Resistivity was measured using a Hioki RM2610 device, which operates on actual coatings and does not require special coatings on an insulating substrate. The finite volume model supplied with the device calculates two parameters, a volumetric resistivity for the coating, and an interface resistance between the coating and the metal foil. Total through-plane resistance values were calculated from the volumetric resistivity x coating thickness + interface resistance.
Disks of calendered coating were cut to make coin cell half-cells, with a lithium metal counter electrode. After vacuum drying the electrodes overnight at 120 °C, the coin cells were constructed in an argon filled glove box. The separator was Celgard® H1609, and the electrolyte was 1 mol dm−3 LiPF6 in EC:EMC = 3:7 vol% + 1 wt% VC (EC = ethylene carbonate, EMC = ethyl methyl carbonate, and VC = vinylene carbonate). The coin cells were tested using BioLogic BCS-805 units, with the cells inside environmental test chambers set at 25 °C. The test program contained a number of sections, with a slow formation cycle, discharge tests at different rates, area-specific impedance (ASI) [36] and impedance measurements at different states of charge, and a limited period of cycling. Details of the individual steps are summarised in Table S2. During the formation and conditioning cycles, the cell capacities were calculated based on a material capacity of 160 mA h g−1. A battery capacity determination cycle was then used to define the actual cell capacities for the rate tests.

3. Results

3.1. Electrode Properties

The formulations of the seventeen mixes are illustrated in Figure 1. It soon became apparent that the carbon nano-tube content was the most important input parameter, influencing many of the output parameters. For convenience, some of the results were grouped based on SWCNT content; low (0.05 wt%, Mixes 02, 05, 08, 14, and 16), intermediate (0.08–0.12 wt%, Mixes 03, 07, 09, 12, 13, and 17), and high (0.14–0.20 wt%, Mixes 01, 04, 06, 10, 11, and 15). An example of this is the mix viscosities, as plotted in Figure S1. As expected, the viscosities increased with both PVDF and SWCNT content. However, the trends with PVDF were easier to interpret after the results were first grouped by their SWCNT content.
Coating adhesion depended almost entirely on PVDF content, again in line with expectations. The maximum values obtained from three to five tests on each coating are tabulated in Table S3, and plotted in Figure 2. In 15 out of 17 cases, the adhesion increased after calendering.
The results from the resistance measurements are collected in Table S4 and plotted in Figure S3. As already mentioned, the Hioki RM2610 data models produce two outputs. The volumetric resistivity values are equivalent to the results obtained with a standard four-point probe. However, the tests are performed on the actual coatings, with the same morphology as used in all the other tests. The interface resistances were particularly interesting, in that they dominated the total through-plane resistance values, and reduced significantly after calendering. Again, as expected, both resistances decreased with increased SWCNT content.
The increases in adhesion and decreases in interface resistance after calendering suggest that significant changes occurred during calendering. Aluminium is known to have a surface coating of Al2O3. It seems likely that although LFP secondary particles tend to deform during calendering, they also broke through the alumina layer. This would reduce the interface resistance and create a roughened, more adhesive interface layer. This was observed experimentally, when aluminium foils were examined after the removal of calendered LFP coatings [25].

3.2. Electrochemical Tests

The coatings were used to make coin cell half-cells, which were subjected to a sequence of electrochemical tests. During cell building, the weights and thicknesses of each electrode disk were recorded to calculate the coat weights and porosities. Figure S4 shows the average values for the three cells made with each coating (only one cell from Mix02, due to delamination). The majority of the coatings were around the 170 gsm target value, though with three low values and one high one. There was also a spread of porosity values: the higher the PVDF content, the lower the porosity. This was linked to ending calendering before the point of delamination.
The results from the various electrochemical tests are summarised in Tables S5 and S6, and illustrated in Figures S5–S9. However, the most important output parameter was considered to be the discharge capacity at high rates. This becomes increasingly important as coat weights are increased and carbon contents are reduced, both to increase the energy density of the cell. Figure 3 plots the average discharge capacities for three coatings, with one each from the low, intermediate, and high SWCNT groups. Error bars of ± one standard deviation are shown only when they are larger than the marker symbol.
Ragone-style plots of this type are very useful in identifying the limiting reaction mechanisms in lithium ion electrodes. Typically, there is a transition at 1–2C, from resistance control at low rates (gentle slope) to mass transport control at high rates (steep slope). The mass transport controlled process can be electronic or ionic conduction (or both), and is highly dependent on coat weight, and hence coating thickness. The results in Figure 3 show a region with an intermediate slope, between the gently and steeply sloped regions. This may be due to the unusual reaction mechanism of LFP materials, e.g., the transition from sequential to parallel particle conversion [37].
One clear indication from Figure 3 is that the discharge capacities at higher rates increased with SWCNT content. This was also observed in the 5C:0.2C capacity ratios (Figure S6) and ASI measurements (Figure S7). There was no variation in first cycle loss with SWCNT content. Introducing high surface area conductive carbons into anode coatings can increase the FCL, due to the extra surface area for SEI growth. However, the first cycle loss on cathode materials is due to other factors. The influence of the PVDF content on the 5C:0.2C ratio and the ASI values was more complicated. For intermediate and high SWCNT contents, the values were independent of the PVDF content. However, for low SWCNT contents, the resistances increased with increased PVDF content.
To help characterise the cycling performance, two ratios were defined. D50:D01 was the ratio of the discharge capacities on cycles 1 and 50. The cycling was performed at ± C/2, but single ± C/10 cycles were performed before and after. The D51:D00 ratio was for the discharge capacities on these slower cycles. Both these ratios are plotted in Figure S8 as a function of coat weight. There were some weaker cells, and all three Mix16 cells were poor. However, most of the cells with high SWCNT content (shown in red) had high values for both ratios.
Impedance spectra were recorded at three states of charge, before and after cycling. The data was fitted to an equivalent circuit model, with a series resistance, three resistor//CPE combinations, and a low-frequency CPE tail (CPE = constant phase element). Some results for a typical cell are plotted in Figure S9. The low-frequency tail was not required at 90% and 50% state of charge, and the third R//CPE combination was not required at 10% SoC. The most surprising aspect of these spectra was the reduction in resistance at 10% SoC, after cycling. LFP materials operate via a phase conversion rather than diffusion in a particle mechanism, which is why the low-frequency tail only appeared at 10% SoC. Impedance spectra in this SoC range are very dependent on the actual state of charge. The flat voltage profile of LFP cathodes makes it difficult to determine the actual rather than nominal SoC.

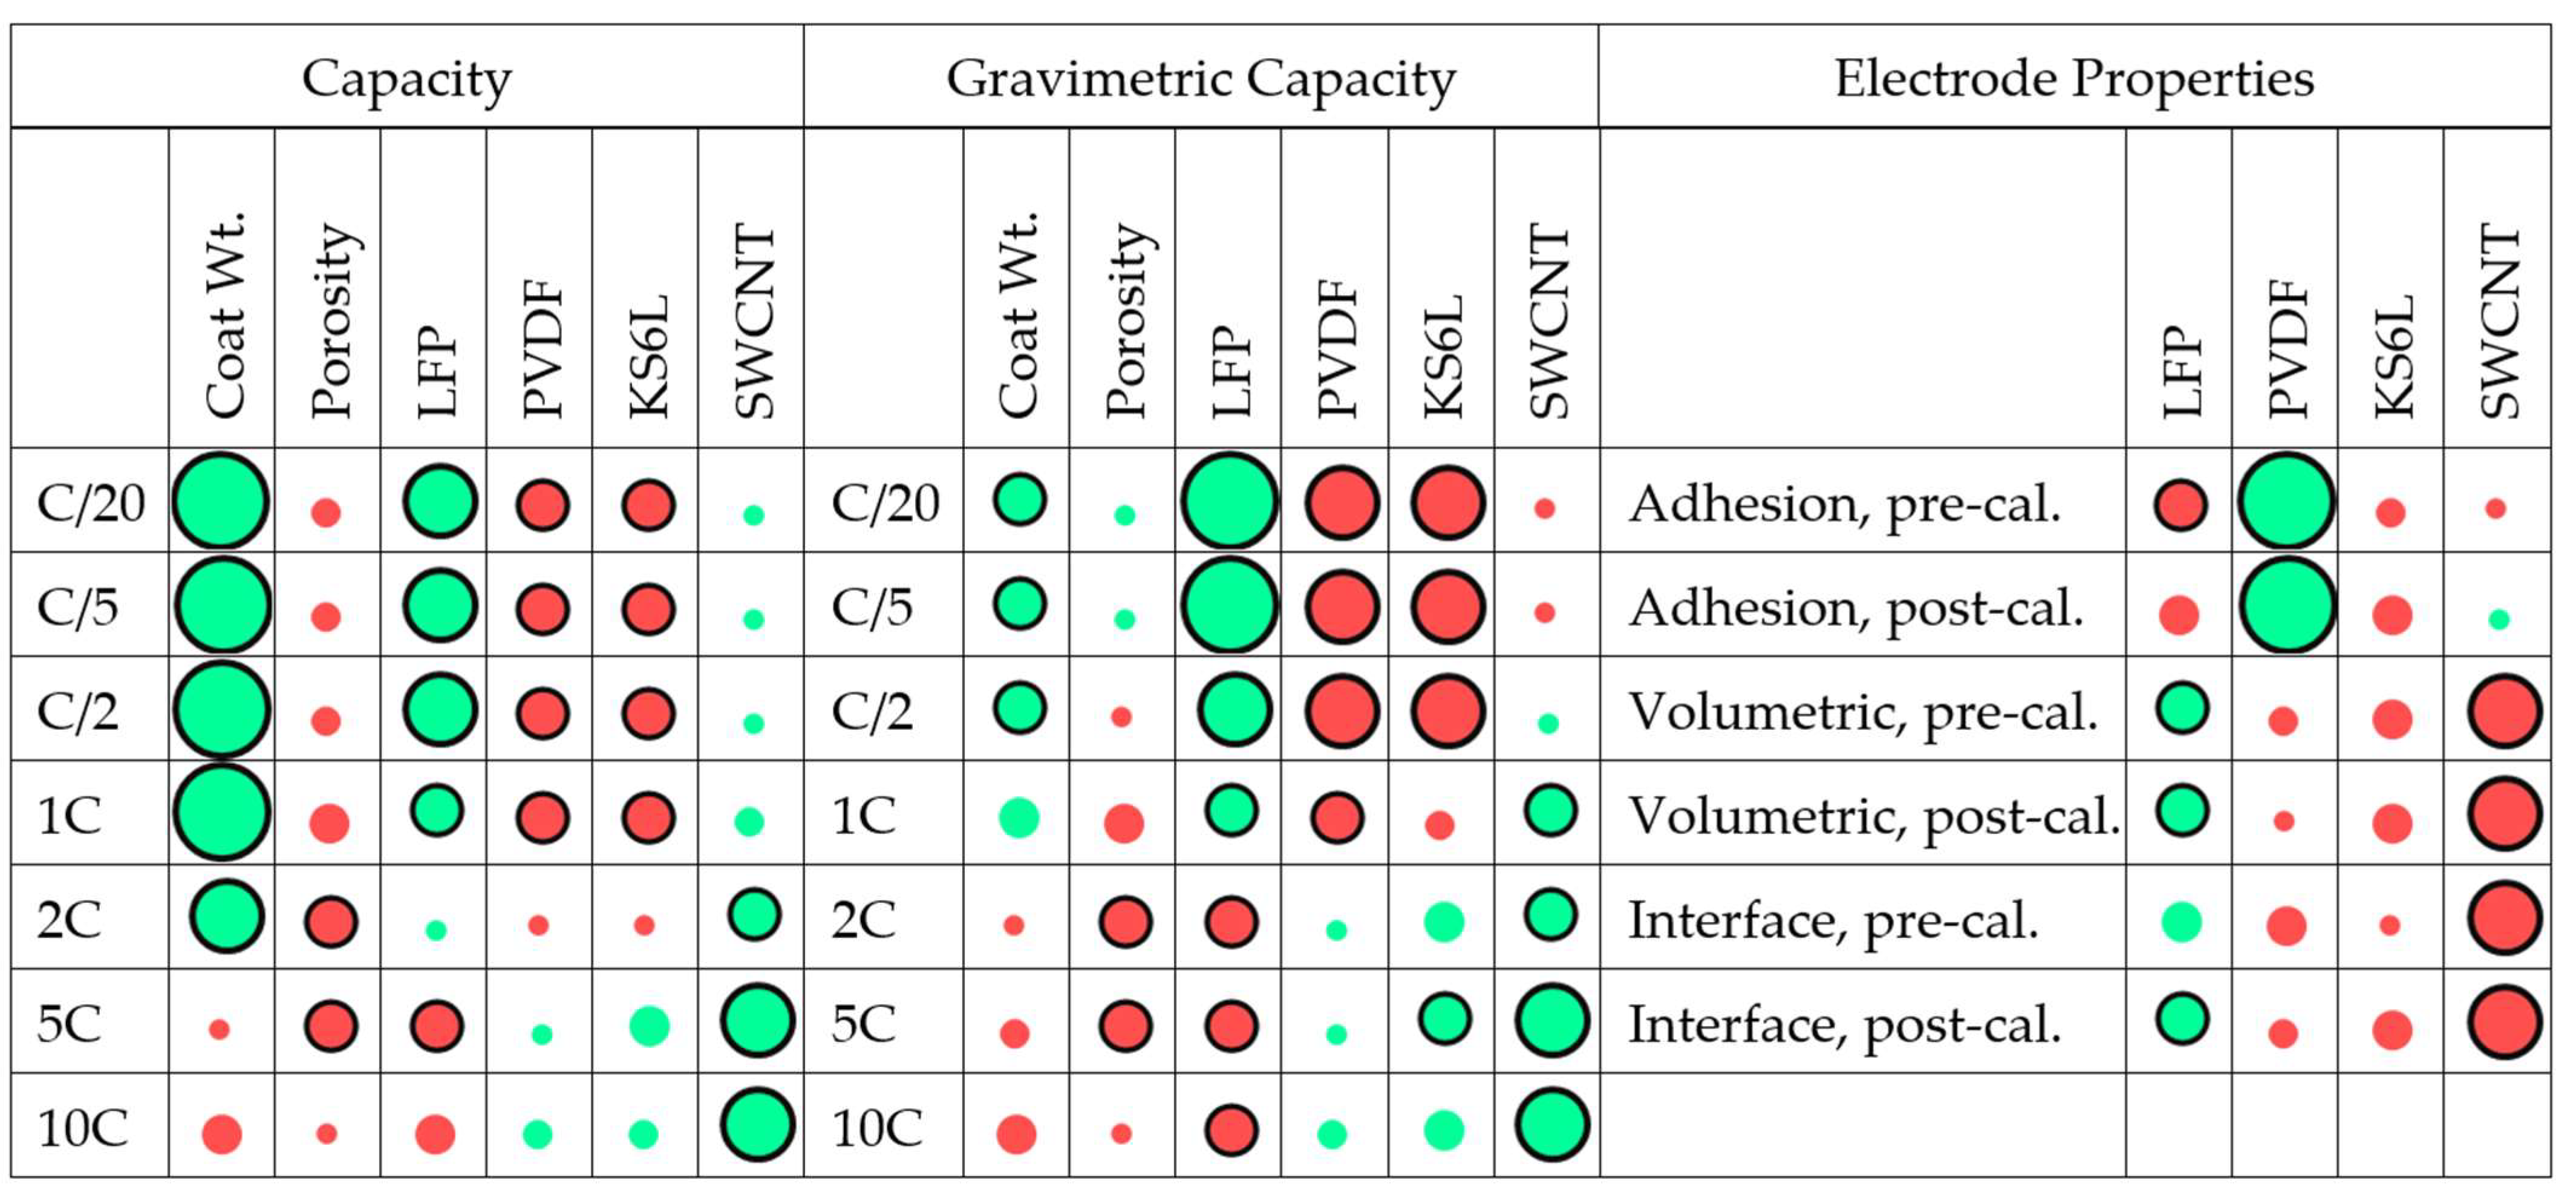
3.3. Single Variate Analysis

The results described in the previous two sections show a variety of trends, but most of them are in line with expectations. The first part of the more formal modelling process was to look at single-variable analysis between one input and one output parameter. The inputs are listed in Table 1, and the outputs are summarised in Table 2. A convenient analytical technique is to calculate Pearson’s coefficients, as defined in Equation (S1) and plotted in Figure 4. The green circles are for positive correlations, and the red circles for negative correlations. The stronger the correlation, the larger the circle. A black solid line indicates that the results are statistically significant, with an alpha value of less than 0.05.
For the individual cell capacities at low discharge rates, increasing the proportion of active material in the mix increased the cell capacity, as did increasing the actual coat weight. The change in limiting mechanisms, discussed in the previous section, was clearly indicated by the difference between 1C and 2C. For higher rates, the carbon nano-tube content was the key positive factor. At 2C and 5C, the capacity decreased as the porosity increased. This implies that the limiting process was electronic rather than ionic conduction.
Several of the same trends were observed for the gravimetric capacities. To reflect the influence of all four electrode components, these were based on the weight of the whole coating, and not just the active material. At lower rates, coat weight became less important, and PVDF content had a negative impact. For the electrode properties, more PVDF increased the adhesion, and more SWCNT reduced the resistance. Increasing the KS6L content also reduced the resistances, though with less impact than the carbon nano-tubes.

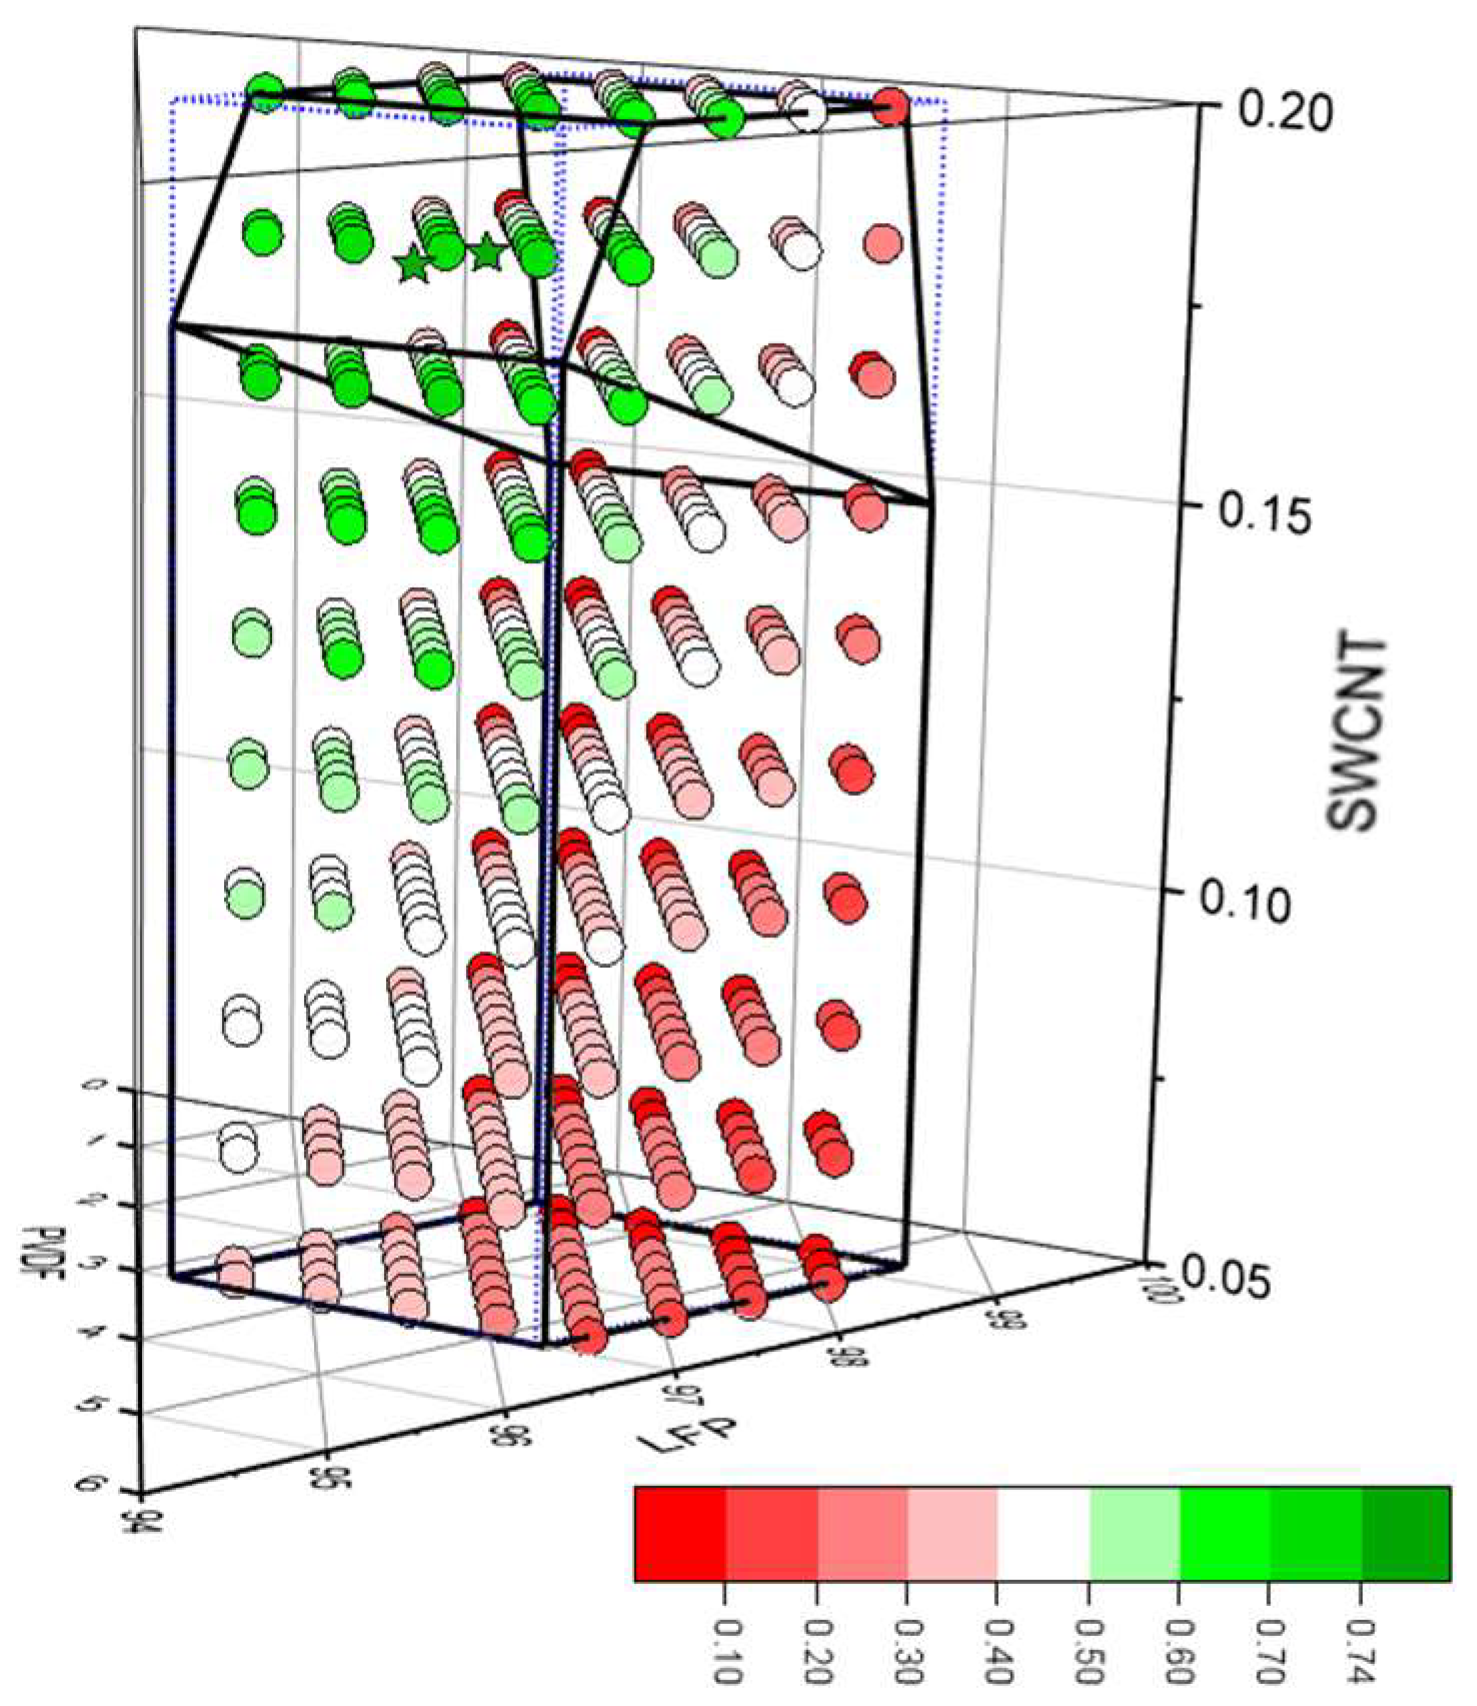
3.4. Multi-Variate Analysis (Mixture Only)

One of the big advantages of using the DoE approach is being able to apply multi-variate analysis, and investigate the interactions of multiple input parameters with each other. Obviously, it is important to assess the validity of the model, and this was achieved using two approaches:
-
Calculation of R2adj as a goodness of fit value;
-
Using some of the data for training the model, and some for testing it.
The coefficient of determination factors (R2) were adjusted for the number of terms in the model (R²adj), as indicated in Equation (S2). The results obtained with the mixtures only model are collected in Table S7, with the β and λ coefficients tabulated in Tables S9, S11 and S13. The R²adj values are also plotted in Figure 5, along with the calculated values for the gravimetric capacity during a 2C discharge. It can be seen that the R²adj values for the cell capacities were below the 0.7 confidence limit at all rates. For the gravimetric capacities, 2C was the highest discharge rate above this level of confidence. Figure S10 plots predicted vs. actual capacity values using the mixture only model at three discharge rates. The training data are shown in grey, and the test data in red.
A useful technique to assess the effect of each input on the model is to plot accumulated local effect (ALE) graphs. The calculation methodology for ALE values is introduced in the Supplementary Information. One-dimensional and two-dimensional ALE graphs are presented in Figures S12 and S13. Green is used to indicate a positive effect, and red a negative effect. Normally, the interaction of different inputs would be assessed using the β coefficients. However, for a mixture model, the component content values are highly correlated with each other. ALE plots avoid this issue by calculating the marginal effects of each component. For the mixture only model, the 1D ALE plots were more informative.
The mixture only model was much more successful with the adhesion and resistance data. This is illustrated in Table S8, Figures S14 and S15. There was only one cross-correlation factor for all six output parameters.

3.5. Multi-Variate Analysis (Mixture + Process)

The multi-variate analysis with the mixture only model did not achieve the required confidence level for any of the cell capacity values, nor for the gravimetric capacities at higher discharge rates. Discharge capacities at high rates are known to be strongly dependent on coat weight. Some of the coatings did not achieve their target porosities, due to adhesion problems. Therefore, it is not that surprising that coat weight and porosity had to be included as input parameters. In consequence, a mixture + process model was developed, including the two extra input variables. Figure 6 shows the calculated goodness of fit values and values calculated by the model for the gravimetric capacities at 5C. Most of the R²adj values were above the 0.7 confidence level, apart from in the transition region at 1C. Overall, the model was a significantly better fit to the data than the mixture only model.
In line with the single variate analysis, the SWCNT content had the greatest impact on the 5C capacity. The contribution of the KS6L can also be seen, particularly for the region with low SWCNT content. The R²adj values are also collected in Table S7, with fitting coefficient values in Tables S10, S12 and S14. Plots of goodness of fit for the training and test data are presented in Figure S11, with the ALE plots again in Figures S12 and S13. For the mixture + process model at high rates, the 2D ALE plots revealed a complicated set of interactions. For example, increasing the LFP or KS6L contents usually decreased the SWCNT content, which in turn reduced the 5C discharge capacities.

3.6. Multi-Output Optimisation

By the very nature of the DoE process, all seventeen of the mixes are likely to be sub-optimum. However, the models can be used to calculate an optimum formulation for each output parameter. Table 3 shows these formulations for the two models and three output parameters. For the mixture only model, the predicted gravimetric capacity at 2C was 118 mA h gcoat−1. However, the predicted adhesion for this composition was only 133 kPa. For the mixture + process models, the predicted capacities at 5C were 91 mA h gcoat−1 and 2.64 mA h, but with different compositions. The predicted adhesion values were 160 and 300 kPa, respectively, reflecting the increased PVDF content.
The trade off between high rate discharge capacity and adhesion is already evident. Table 3 also includes the formulations for the two best performing mixes, and a multi-output model (see below). Multi-output optimisation is a common requirement in modelling, but a simpler approach is through spider plots (also known as radar plots). These are shown for five output parameters in Figure 7, with the mixes again grouped according to their SWCNT content. Each parameter is plotted with a range of 0–100%. The corresponding ranges for the five parameters were; adhesion (calendered, 0–600 kPa), total through-plane resistance (calendered, 0–6 S cm−2), 5C:0.2C ratio (0–65%), ASI resistance (minimum, discharge, 0–0.05 S cm−2), and cycling ratio D50:D01 (90–101%). Both resistances were plotted as conductivities, so that 100% corresponds to the lowest resistance. Mix11 had the best overall performance. Mix04 had lower resistance and better cycling, but only moderate adhesion. The choice between them would depend on a practical assessment: is the adhesion for Mix04 good enough to survive the cell manufacturing process without delamination?
Multi-objective optimisation [38,39] was also applied using the DoE modelling software. Four parameters were given a priority rating from 1 (low) to 3 (high): the 5C discharge capacity in mA h gcoat−1 (3), the adhesion (2), the total through-plane resistance (2), and the area-specific impedance (1). For each formulation, the software then generated a desirability value for each parameter, and an overall desirability as a weighted average. This produced the desirability distribution plotted in Figure 8, and the M. O. O. optimum formulation included in Table 3. The optimum formulation had a desirability factor of 0.74, compared to 0.35 for the model formulation recommended for just the 5C discharge gravimetric capacity. There was a second optimum, with a slightly different composition, and a desirability factor of 0.73. Further details are collected in Tables S15 and S16. Using this multi-output optimisation required additional models to be created for the total through-plane resistance and the area-specific impedance. It was not possible to create a valid model for the D50:D01 cycling data, so cycling had to be excluded from the multi-objective optimisation.

4. Discussion

A series of mixes was prepared with >94 wt% lithium iron phosphate as the active material, and varying amounts of PVDF binder and two types of conductive carbon. The mixes were coated, calendered, characterised, and used to make coin cells for a sequence of electrochemical tests. Using a design of experiments approach reduced the large number of potential formulations to a manageable practical number. Single-variable analysis produced trends that were in line with expectations:
  • The mix viscosity increased with both SWCNT and PVDF content;
  • The coating adhesion increased with PVDF content;
  • The coating conductivity increased with carbon nano-tube content;
  • The nano-tubes had a greater impact on resistivity and electrochemical resistance than the other graphitic carbon additive;
  • The best formulations achieved 5C:0.2C capacity ratios above 50% for 170 gsm coatings.
At high discharge rates, the capacities increased for lower coating porosities. This implied that in these coatings with a high active material content, electronic conductivity was the limiting mass transport process, rather than ionic conductivity.
Multi-variate analysis allowed the interactions between the different components to be evaluated. To fit the data with a high degree of confidence, it was necessary to adapt the initial mixture only model to a mixture + process model. This model was then used to predict an optimum formulation for maximum capacity at high rates of discharge, while still maintaining sufficient adhesion for manufacturability. A multi-objective optimisation formulation was also produced based on four output parameters. These formulations are now suitable for scaling up, both in terms of the size of the mix and the size and capacity of the cells made with it.
The optimum electrode formulation is for a specific grade of lithium iron phosphate, though it should work for similar materials. The same DoE approach can be used for other grades of LFP, and for emerging materials such as LMFP (LiMnxFe1−xPO4).

Supplementary Materials

The following supporting information can be downloaded at: https://www.mdpi.com/article/10.3390/batteries9040192/s1, Table S1: design of experiment mix formulations; Table S2: electrochemical cell test sequence; Table S3: electrode mixing, coating and adhesion; Table S4: coating resistivity measurements; Table S5: electrode performance; Table S6: rate performance measurements; Table S7: adjusted regression coefficients for different models and output parameters; Table S8: multi-variate regression fitting to adhesion and resistance output parameters; Table S9: multi-variate regression fitting coefficients (capacity); Table S10: multi-variate regression fitting coefficients (capacity); Table S11: multi-variate regression fitting coefficients (gravimetric, active); Table S12: multi-variate regression fitting coefficients (gravimetric, active); Table S13: multi-variate regression fitting coefficients (gravimetric, coating); Table S14: multi-variate regression fitting coefficients (gravimetric, coating); Table S15: multi-objective optimisation electrode formulations; Table S16: multi-objective optimisation desirability scores; Figure S1: variation in mix viscosity with SWCNT and PVDF content in mix; Figure S2: adhesion and porosity plots; Figure S3: variations in volumetric resistivity and interface resistance with SWCNT content; Figure S4: experimentally measured variations in coatings; Figure S5: results from formation cycle at ± C/20; Figure S6: results from rate tests; Figure S7: results from ASI measurements; Figure S8: results from cell cycling measurements; Figure S9: impedance spectra for cell EE358; Figure S10: goodness of fit plots (mixture only); Figure S11: goodness of fit plots (mixture + process); Figure S12: 1D ALE plots on capacity; Figure S13: 2D ALE plots on capacity; Figure S14: model predictions for adhesion and resistances; and Figure S15: 1D and 2D ALE plots for adhesion.

Author Contributions

Conceptualisation, G.A., M.H. and M.C.; methodology, G.A. and M.H.; software, M.H. and R.H.; investigation, G.A., D.D., R.H. and M.H.; data curation, M.H., R.H. and M.L.; writing—original draft preparation, M.H. and M.L.; writing—review and editing, All; supervision, M.C. and J.M.; funding acquisition, J.M. All authors have read and agreed to the published version of the manuscript.

Funding

This research was funded by the Faraday Institution, FIRG015, as part of the Nextrode project.

Data Availability Statement

There are no publicly archived datasets associated with this work.

Acknowledgments

The authors would also like to thank Noah Bryan for assisting with data processing, and Grace Bridgewater for useful discussions.

Conflicts of Interest

The authors declare no conflict of interest.

References

  1. Padhi, A.K.; Nanjundaswamy, K.S.; Goodenough, J.B. Phospho-olivines as positive electrode materials for rechargeable lithium batteries. J. Electrochem. Soc. 1987, 144, 1188–1194. [Google Scholar] [CrossRef]
  2. Zaghib, K.; Guerfi, A.; Hovington, P.; Vijh, A.; Trudeau, M.; Mauger, A.; Goodenough, J.B.; Julien, C.M. Review and analysis of nano-structured olivine based lithium rechargeable batteries: Status and trends. J. Power Sources 2012, 232, 357–369. [Google Scholar] [CrossRef]
  3. Satyavani, T.V.S.L.; Kumar, A.S.; Subba Rao, P.S.V. Methods of synthesis and performance improvement of LFP for high rate lithium ion batteries: A review. Eng. Sci. Technol. Int. J. 2016, 19, 178–188. [Google Scholar] [CrossRef] [Green Version]
  4. Ahsan, Z.; Ding, B.; Cai, Z.; Wen, C.; Yang, W.; Ma, Y.; Zhang, S. Recent progress in capacity enhancement of LFP cathodes for lithium ion batteries. J. Electrochem. Energy Convers. Storage 2021, 18, 010801. [Google Scholar] [CrossRef]
  5. Balakrishnan, N.T.M.; Paul, A.; Krishnan, M.A.; Das, A.; Raphaez, L.R.; Ahn, J.-H.; Fatima, J.J.; Prasanth, R. LFP as high performance cathode material for lithium ion batteries. Environ. Chem. Sustain. World 2021, 62, 35–73. [Google Scholar] [CrossRef]
  6. Bazant, M.Z. Theory of chemical kinetics and charge transfer based on non-equilibrium thermodynamics. Acc. Chem. Res. 2013, 46, 1144–1160. [Google Scholar] [CrossRef]
  7. Noh, H.-J.; Youn, S.; Yoon, C.S.; Sun, Y.-K. Comparison of the structural and electrochemical properties of layered NCM (111, 523, 622, 811) cathode material for lithium ion batteries. J. Power Sources 2013, 233, 121–130. [Google Scholar] [CrossRef]
  8. Golubkov, A.W.; Fuchs, D.; Wagner, J.; Wiltsche, H.; Stangl, C.; Fauker, G.; Voitic, G.; Thaler, A.; Hacker, V. Thermal runaway experiments on consumer lithium ion batteries with metal oxide and olivine type cathodes. RSC Adv. 2014, 4, 3633–3642. [Google Scholar] [CrossRef] [Green Version]
  9. Gören, A.; Costa, C.M.; Silva, M.M.; Lanceros-Méndez, S. State of the art and open questions on cathode preparation based on carbon coated LFP. Compos. Part B 2015, 83, 333–345. [Google Scholar] [CrossRef]
  10. Huang, Y.; Zheng, F.; Zhang, X.; Li, Y.; Yin, J.; Li, Q. Tween40 surfactant effect on the formation of nano-sized LFP/C powder via a solid state reaction and their cathode properties. Solid State Ion. 2013, 249–250, 158–164. [Google Scholar] [CrossRef]
  11. Lain, M.J.; Brandon, J.; Kendrick, E. Design strategies for high power vs. high energy lithium ion cells. Batteries 2019, 5, 64. [Google Scholar] [CrossRef] [Green Version]
  12. Biso, M.; Oriani, A.V.; Carella, S.; Cojocaru, P. Aqueous Electrode Binders for Lithium Ion Batteries. U.S. Patent 16/472,190, 12 December 2019. [Google Scholar]
  13. Li, J.; Daniel, C.; An, S.J.; Wood, D. Evaluation residual moisture in lithium ion battery electrodes and its effect on electrode performance. MRS Adv. 2016, 1, 1029–1035. [Google Scholar] [CrossRef] [Green Version]
  14. Lingappan, N.; Kong, L.; Pecht, M. The significance of aqueous binders in lithium ion batteries. Renew. Sustain. Energy Rev. 2021, 147, 111227. [Google Scholar] [CrossRef]
  15. Cai, Z.P.; Liang, Y.; Li, W.S.; Xing, L.D.; Liao, Y.H. Preparation and performances of LFP cathode in aqueous solvent with PAA as a binder. J. Power Sources 2009, 189, 547–551. [Google Scholar] [CrossRef]
  16. Porcher, W.; Lestriez, R.; Jouanneau, S.; Guyomard, D. Design of aqueous processed thick LFP composite electrode for high energy lithium battery. J. Electrochem. Soc. 2009, 156, A133–A144. [Google Scholar] [CrossRef]
  17. Lux, S.F.; Schappacher, F.; Balducci, A.; Passerini, S.; Winter, M. Low cost, environmentally benign binders for lithium ion batteries. J. Electrochem. Soc. 2010, 157, A320–A325. [Google Scholar] [CrossRef]
  18. Huang, S.; Huang, X.; Huang, Y.; He, X.; Zhuo, H.; Chen, S. Rational design of effective binders for LFP cathodes. Polymers 2012, 13, 3146. [Google Scholar] [CrossRef] [PubMed]
  19. Li, J.; Armstrong, B.L.; Kiggans, J.; Daniel, C.; Wood, D.L. Lithium ion cell performance enhancement using aqueous LFP cathode dispersions and polyethleneimine dispersant. J. Electrochem. Soc. 2013, 160, A201–A206. [Google Scholar] [CrossRef] [Green Version]
  20. Qiu, L.; Shao, Z.; Wang, D.; Wang, F.; Wang, W.; Wang, J. Novel polymer lithium ion binder CMC derivative enhanced electrochemical performance for lithium ion batteries. Carbohydr. Polym. 2014, 112, 532. [Google Scholar] [CrossRef]
  21. Gong, C.; Xue, Z.; Wen, S.; Ye, Y.; Xie, X. Advanced carbon materials/olivine LFP composites cathode for lithium ion batteries. J. Power Sources 2016, 318, 93–112. [Google Scholar] [CrossRef]
  22. Qi, X.; Blizanac, B.; DuPasquier, A.; Oljaca, M.; Li, J.; Winter, M. Understanding the influence of conductive carbon additives surface area on the rate performance of LFP cathodes for lithium ion batteries. Carbon 2013, 64, 334–340. [Google Scholar] [CrossRef]
  23. Huang, C.-Y.; Kuo, T.-R.; Youngbaré, S.; Lin, L.-Y. Design of LFP and porous carbon composites with excellent high rate charging performance for lithium ion secondary battery. J. Colloid Interface Sci. 2022, 607, 1457–1465. [Google Scholar] [CrossRef] [PubMed]
  24. Gören, A.; Cintora-Juarez, D.; Martins, P.; Ferdov, S.; Silva, M.M.; Tirado, J.L.; Costa, C.M.; Lanceros-Méndez, S. Influence of solvent evaporation rate in the preparation of carbon coated LFP cathode films on battery performance. Energy Technol. 2016, 4, 573–582. [Google Scholar] [CrossRef]
  25. van Bommel, A.; Divigalpitiya, R. Effect of calendering LFP electrodes. J. Electrochem. Soc. 2012, 159, A1791–A1795. [Google Scholar] [CrossRef]
  26. Román-Ramírez, L.A.; Marco, J. Design of experiments applied to lithium ion batteries: A literature review. Appl. Energy 2022, 320, 119305. [Google Scholar] [CrossRef]
  27. Scheffé, H. Experiments with mixtures. J. R. Stat. Soc. Ser. B 1958, 20, 344–360. [Google Scholar] [CrossRef]
  28. Rynne, O.; Dubarry, M.; Molson, C.; Lepage, D.; Prébé, A.; Aymé-Perrot, D.; Rochefort, D.; Dollé, M. Design of experiments for beginenrs—A quick start guide for application to electrode formulation. Batteries 2019, 5, 72. [Google Scholar] [CrossRef] [Green Version]
  29. Rynne, O.; Dubarry, M.; Molson, C.; Nicolas, E.; Lepage, D.; Prébé, A.; Aymé-Perrot, D.; Rochefort, D.; Dollé, M. Exploiting materials to their full potential, a lithium ion battery electrode formulation optimisation study. Appl. Energy Mater. 2020, 3, 2935–2948. [Google Scholar] [CrossRef]
  30. Kowalski, S.; Cornell, J.A.; Vining, G.G. A new model and class of designs for mixture experiments with process variables. Commun. Stat. -Theory Methods 2000, 29, 2255–2280. [Google Scholar] [CrossRef]
  31. Box, G.E.P.; Cox, D.R. An analysis of transformation. J. R. Stat. Soc. Ser. B 1964, 26, 211–243. [Google Scholar] [CrossRef]
  32. Bozdogan, H. Model selection and Akaike’s information criterion (AIC): The general theory and its analytical extensions. Psychometrika 1987, 52, 345–370. [Google Scholar] [CrossRef]
  33. Fathi, A.R.; Riahifar, R.; Raissi, B.; Yaghmaee, M.S.; Ghorbanzadeh, M. Optimisation of cathode material components by means of experiment design for lithium ion batteries. J. Electron. Mater. 2020, 49, 6547–6558. [Google Scholar] [CrossRef]
  34. Weichert, A.; Göken, V.; Fromm, O.; Beuse, T.; Winter, M.; Börner, M. Strategies for formulation optimisation of composite positive electrodes for lithium ion batteries based on layered oxide, spinel and olivine type active materials. J. Power Sources 2022, 551, 232179. [Google Scholar] [CrossRef]
  35. Niri, M.F.; Reynolds, C.; Román-Ramírez, L.A.A.; Kendrick, E.; Marco, J. Systematic analysis of the impact of slurry coating in the manufacture of lithium ion battery electrodes via explainable machine learning. Energy Storage Mater. 2022, 51, 223–238. [Google Scholar] [CrossRef]
  36. Gallagher, K.G.; Nelson, P.A.; Dees, D.W. Simplified calculation of the area specific impedance for battery design. J. Power Sources 2011, 196, 2289–2297. [Google Scholar] [CrossRef]
  37. Zhang, X.; van Hulzen, M.; Singh, D.P.; Brownrigg, A.; Wright, J.P.; van Dijk, N.H.; Wagemaker, M. Direct view on the phase evoluation in individual LFP nano-particles during lithium ion battery cycling. Nat. Commun. 2015, 6, 8333. [Google Scholar] [CrossRef] [Green Version]
  38. Derringer, G.; Suich, R. Simultaneous optimisation of several response variables. J. Qual. Technol. 1980, 12, 214–219. [Google Scholar] [CrossRef]
  39. Kornas, T.; Wittmann, D.; Daub, R.; Meyer, O.; Weihs, C.; Thiede, S.; Hermann, C. Multi-criteria optimisation in the production of lithium ion batteries. Procedia Manuf. 2020, 43, 720–727. [Google Scholar] [CrossRef]
Figure 1. Location of the 17 mixes in the formulation design space with model training (red) and model testing (yellow) points.
Batteries 09 00192 g001
Figure 2. Variation in adhesion with PVDF content in mix (uncalendered and calendered).
Batteries 09 00192 g002
Figure 3. Variation in discharge capacity with discharge rate for three coatings with different carbon nano-tube contents.
Batteries 09 00192 g003
Figure 4. Pearson’s coefficients for cell capacity, gravimetric capacity, and electrode properties.
Batteries 09 00192 g004
Figure 5. Calculations from mixture only model; (a) goodness of fit values, and (b) discharge capacities (mA h g−1) at 2C.
Batteries 09 00192 g005
Figure 6. Calculations from the mixture + process model; (a) goodness of fit values, and (b) discharge capacities (mA h g−1) at 5C.
Batteries 09 00192 g006
Figure 7. Spider plots for mixes with different carbon nano-tube contents, (a) low, (b) intermediate, and (c) high.
Batteries 09 00192 g007
Figure 8. Desirability scores for the four-parameter model.
Batteries 09 00192 g008
Table 1. Inputs to the model.
CodeParameterUnitsMinimumMaximum
ALFP contentwt%94.0398.50
BKS6L contentwt%0.702.80
CSWCNT contentwt%0.050.20
DPVDF contentwt%0.753.00
ECoat weightgsm152.0188.5
FPorosity%36.543.5
Table 2. Outputs used in single-variable and multi-variable analysis.
I.D.ParameterUnitDetails
#1Discharge capacitymA hDischarge at; C/20, C/5,
C/2, C, 2C, 5C and 10C
#2Gravimetric capacitymA h g−1
#3AdhesionkPaCalendered and
uncalendered
#4Volumetric resistivityΩ cm
#5Interface resistanceΩ cm2
Table 3. Model recommendations (component wt%).
ModelParam.LFPPVDFKS6LSWCNT
Mixture2C, mA h g−195.81.22.80.20
M + P5C, mA h g−196.71.12.00.20
M + P5C, mA h94.92.12.80.20
Mix04Experimental94.72.32.80.20
Mix11Experimental94.93.01.90.16
M. O. O.Four parameter95.32.91.60.18
Disclaimer/Publisher’s Note: The statements, opinions and data contained in all publications are solely those of the individual author(s) and contributor(s) and not of MDPI and/or the editor(s). MDPI and/or the editor(s) disclaim responsibility for any injury to people or property resulting from any ideas, methods, instructions or products referred to in the content.

