Article

Simulation and Optimization of Lithium-Ion Battery Thermal Management System Integrating Composite Phase Change Material, Flat Heat Pipe and Liquid Cooling

1
Hubei Research Center for New Energy & Intelligent Connected Vehicle, School of Automotive Engineering, Wuhan University of Technology, Wuhan 430070, China
2
Chongqing Research Institute, Wuhan University of Technology, Chongqing 401135, China
3
School of Mechanical and Automotive Engineering, Shanghai University of Engineering Science, Shanghai 201620, China
*
Authors to whom correspondence should be addressed.
Batteries 2023, 9(6), 334; https://doi.org/10.3390/batteries9060334
Submission received: 23 May 2023 / Revised: 13 June 2023 / Accepted: 15 June 2023 / Published: 20 June 2023
(This article belongs to the Special Issue Thermal Management System for Lithium-Ion Batteries)

Abstract

:
A large-capacity prismatic lithium-ion battery thermal management system (BTMS) combining composite phase change material (CPCM), a flat heat pipe (FHP), and liquid cooling is proposed. The three conventional configurations analyzed in this study are the BTMSs using only CPCM, CPCM with aluminum thermal diffusion plates, and CPCM with FHPs. In addition, a CPCM–FHP assisted with liquid cooling at the lateral sides is established to enhance the thermal performance of large-capacity batteries. Moreover, the influences of coolant temperature, the number of FHPs and cooling pipes, and the coolant direction on the temperature field of a BTMS are discussed. Finally, the orthogonal design method is used for the multi-level analysis of multiple factors to improve the light weight of the system. The optimal parameter combination is obtained to achieve the best thermal performance of the BTMS, with the maximum temperature and the temperature difference at 43.17 °C and 3.36 °C, respectively, under a maximum discharge rate of 2C and a high-temperature environment of 37 °C. The optimal scheme is further analyzed and affirmed through the comprehensive balance method.

1. Introduction

Electric vehicles can significantly reduce dependence on fossil energy and have the advantages of energy conservation and emission reduction, compared with traditional fuel vehicles, which are the critical link to achieving the double carbon goal and green development. As the power source of most electric vehicles, the lithium-ion battery (LIB) is easily affected by operation temperature during work. Therefore, the battery thermal management system (BTMS), which is energy-saving, efficient, and safe, could effectively enhance the thermal safety and stable operation of electric vehicles.
The cooling mediums of BTMSs mainly include air, liquid, heat pipe, and phase change material (PCM). Li et al. [1] established an electric thermal model based on fluid dynamics and studied the model under natural ventilation conditions. Then, the output training and optimization design of the battery module were carried out through a model based on an artificial neural network (ANN). The results showed better optimization of the battery layout and cooling efficiency. Yamanaka et al. [2] proposed an equivalent circuit model and applied it to a BTMS based on liquid cooling. The simulation results were fitted well with the experiment results. Furthermore, the accuracy of the relationship between the coolant flow rate and the pressure drop or heat transfer coefficient was high. Chen et al. [3] put forward three structures of BTMSs: Structure 1, which is based on hollow spoiler prisms with batteries; Structure 2, which adds a PCM to Structure 1; and Structure 3, which adds aluminum fins based on Structure 2. The first two structures have better thermal performance than conventional air cooling systems, and Structure 3 possesses the best cooling performance.
The requirements for the BTMS are more urgent with the continuous development of electric vehicles and the increase in energy density of battery modules or the driving of cars under high-temperature and rapid discharging rate conditions. Currently, a BTMS that combines active and passive cooling is a very effective cooling method. The most common ways are to combine composite phase change material (CPCM) with air cooling [4,5,6,7], liquid cooling [8,9,10,11], or heat pipes [12,13,14].
Khan et al. [15] used air with different flow rates to cool cylindrical batteries inside PCM and studied the effects of cross-sectional shapes on PCMs at room temperature. The results indicated that the increase in air flow rate could decrease the battery’s temperature and enhance the heat transfer performance of the PCM. Faizan et al. [16] designed two structures of BTMSs with PCM and liquid cooling under high discharge rates and room temperature. The first is the PCM sandwiched between the batteries, and the second is the PCM wrapped around the batteries. The effects of the coolant velocity, the volume fraction of the nanofluid, and the flow direction were analyzed. The results showed that the latter had better thermal performance than the BTMS. Abbas et al. [12] proposed two types of BTMS based on the PCM and HPs under room temperature and a high heat generation rate, including the indirect/direct contact between the heat pipe evaporation section and the battery. It was verified through experiments that the latter had a better temperature control effect on the BTMS. For the HP-based BTMS, the range of the temperature difference was small, and the range of the maximum temperature was significantly lower than the heat transfer characteristics of the HP during the actual discharging. In addition, the heat transfer coefficient of the HP is generally stable within a specific field and has no significant volatility. Therefore, the simplified heat transfer model in this work is adopted [17,18,19,20], simplifying the HP into a flat plate 2 mm in width with the same length and height as the battery and high thermal conductivity as the actual HP. The heat transfer mode is adopted during the heat transfer, ignoring the complex internal heat transfer, mass transfer, vapor-liquid flow, and momentum transfer, and the copper HP is selected [21].
Xu et al. [22] compared the heat generation of a single large-capacity prismatic battery and a small-capacity cylindrical battery with the influence of the depth of discharge (DOD) at different discharge rates and environmental temperatures. The results showed that the heat production of the prismatic battery was higher than that of the cylindrical battery when the DOD was below 0.7 and lower in the later stage of discharge due to the large polarization internal resistance of the cylindrical battery. The thermal performance of the BTMS based on 106 large-sized batteries [23,24] was studied under room temperature and high discharge rates using the hybrid cooling of a PCM and a liquid. However, a high-temperature environment was not considered. In addition, thermoelectric cooling using thermoelectric coolers is a novel method for battery cooling applications. Sun et al. [25] pointed out that thermoelectric coolers have a wide range of potential applications in miniaturized electronics and have a better temperature control effect on battery cooling than liquid cooling and natural convection methods at room temperature.
Most studies focus on the thermal characteristics of small-capacity batteries under low environmental temperatures and high discharge rates or high environmental temperatures and low discharge rates. Compared with small-capacity batteries, the thermal management requirements are higher with grouped large-capacity batteries. There are few studies on large-capacity battery modules under high-temperature environments and high discharge rate conditions. In addition, many factors affect the heat dissipation of batteries in BTMSs. Quantitative analysis based solely on parameter research cannot comprehensively evaluate system performance. Appropriate optimization methods should be selected to conduct a qualitative analysis of the influencing factors to design the optimal structure and improve the light weight, economy, and safety of a BTMS.
In this work, a large-capacity prismatic BTMS integrating CPCM, FHPs, and liquid cooling is established. The thermal characteristics of the BTMS based on only CPCM, CPCMs with aluminum thermal diffusion plates (ATDPs), and CPCMs with FHPs were compared first. Then, the liquid cooling was assisted in the CPCM–FHP model to further improve thermal performance at the maximum discharge rate of 2C and the high temperature of 37 °C. In addition, the effects of the number of FHPs, the coolant temperature, the number of cooling pipes, and the coolant flow direction were optimized through the orthogonal design method. Finally, the parameter combination that enabled the BTMS to have optimal thermal performance was obtained.

2. Physical Model and Mathematical Formulation

2.1. Physical Model of Battery Modules

In this work, the thermal performance of the combined CPCM, FHPs, and liquid cooling are examined through numerical simulation compared with the schemes without combined liquid cooling techniques. Four schemes of BTMSs are proposed: Scheme 1 with CPCM cooling only; Scheme 2 with combined CPCMs and ATDPs; Scheme 3 with combined CPCMs and FHPs; and Scheme 4 with combined CPCMs, FHPs, and liquid cooling, as shown in Figure 1a–d, respectively.
Six nickel–cobalt–manganese LIBs with a 50 Ah capacity were connected electrically in series to form the battery module. The width, height, and depth of the battery were 148 mm, 92 mm, and 27 mm, respectively. The CPCMs (the blue part) 4 mm in thickness, made from a mixture of paraffin wax and EG by Shenzhen HM New Material Technology Co., Ltd., were sandwiched between batteries in Scheme 1. A total of 12 ATDPs (the brown part) 4 mm thickness were sandwiched between batteries in Scheme 2. FHPs (the green part) 2 mm thickness were set up to study the impact of the heat pipe on the thermal performance of the BTMS in Scheme 3. Furthermore, Scheme 4 added liquid cooling on both sides of the battery module based on Scheme 3, with four cooling channels with a diameter of 6 mm inside each Al plate. Furthermore, the comparison of the cooling methods in the four schemes is shown in Table 1. The parallel flow on the same side of the battery module was set inlet while the other side was set outlet, and water was chosen as the coolant. In addition, the thermophysical properties of the components in the battery module are shown in Table 2. The melting temperature and the latent heat of the CPCM were 37 °C~40 °C and 150 kJ/kg, respectively. Considering that 37 °C is the critical temperature of phase change of PCM, this work studied the thermal performance of large-capacity BTMSs under a high-temperature environment of 37 °C and a maximum discharge rate of 2C to prevent the occurrence of thermal runaway.

2.2. Mathematical Formulation

Solid heat transfer of the BTMS models involving batteries, CPCMs, ATDPs, FHPs and the energy conservation equations involved is as follows:
ρ b c p , b T b t = k b T b + Q VOL
ρ PCM c p ,   eff T PCM t = k PCM T PCM
ρ ATDP c p ,   ATDP T ATDP t = k ATDP T ATDP
ρ FHP c p ,   FHP T FHP t = k FHP T FHP
where ρ, cp, and k represent the density, specific heat capacity, and thermal conductivity of the different materials, respectively, and QVOL represents the heat generation rate of the battery.
Moreover, the velocity of cooling water is 0.1 m/s, the corresponding Reynolds number is 598.92, and the laminar model is employed for cooling flow. The mass, momentum, and energy equations of the liquid cooling are shown as follows, respectively:
ρ w t + ρ w v = 0
t ρ w v + ρ w v v = P + μ v
t ρ w C p , w T w + ρ w C p , w v T w = k w T w
where ρ w , v , C p , w , k w , and P are the density, velocity vector, specific heat capacity, thermal conductivity, and static pressure, respectively.

2.3. Boundary and Initial Conditions

We employed COMSOL Multiphysics [25] to set the interfacial boundary conditions. The interfacial boundary conditions between the battery and the CPCM, the battery and the ATDP, the battery and the FHP, the FHP and the CPCM, the Al plate and the cooling pipe were set as follows:
k b T b n b = k PCM T PCM n PCM
k b T b n b = k ATDP T ATDP n ATDP
k b T b n b = k FHP T PCM n PCM
k PCM T PCM n PCM = k FHP T PCM n PCM
where n represents the direction along the normal of the outer surface of each component, and the ∂T/∂n represents the temperature gradient of each component.
k PCM T PCM n PCM = h T PCM T amb
k FHP T FHP n FHP = h T FHP T amb
where h is the convection heat transfer coefficient between PCM or FHP and ambient.
The initial condition is T = T0 and v = v0 at t = 0, where T0 is the ambient temperature, while v0 is the inlet velocity, set as 0.1 m/s. The inlet temperature of the coolant was 37 °C. Moreover, the coolant inlet was set as the velocity inlet boundary condition, the coolant outlet was set as the pressure outlet boundary condition, and the other surfaces adopted the no-slip boundary condition.

3. Model Verification and Comparison

3.1. Verification of Heat Generation Rate

The experimental data of heat generation rates [26] is used for the verification of the simulation model for this application. Figure 2 displays the comparison of the temperature rise trend using the simulation of dynamic and average heat generation rates with the experimental results at the discharge rates of 0.5C, 1C, 1.5C, and 2C and the environmental temperatures of −5 °C, 10 °C, 25 °C, and 40 °C. The dynamic heat generation rate is the transient value obtained from the discharging experiment. The average heat generation rate is the average value of the dynamic heat generation rate during the discharge process. Based on the dynamic heat generation rate, the calculation accuracy of the battery thermal model is the highest, with the maximum temperature difference within 1 °C. Though the battery temperature values were slightly underestimated, the average heat generation model yielded an acceptable engineering accuracy of 5%.
The simulation result based on the average heat generation rate was lower than the experimental result at the beginning of discharge. There was contact thermal resistance during the experiment, which was ignored during the simulation. Moreover, the reaction heat was not considered in the simulation model. The increase in polarization resistance of the battery led to a rise in polarization heat in the later stage of discharge, resulting in a slightly higher simulation result than the experimental result. There were also specific errors between various devices in the experiment. However, the overall trend between the simulation and experiment results is consistent. The experimental value and the simulated one are almost the same, finally. Therefore, balancing the accuracy and efficiency of calculation, the battery thermal model based on the average heat generation rate will be established in the subsequent work.

3.2. Result Comparison of Battery Modules

Figure 3a,b display the mesh model of Scheme 3 and the independent analysis of the grid number in Scheme 3 under a 1C discharge rate and 25 °C ambient temperature and natural convection environment.
The tetrahedral and hexahedral grids of the battery module were divided using COMSOL Multiphysics. The grid independence study was examined using the number of grids, including 49,423, 108,896, 295,348, 478,898, 675,556, and 1,096,202. It is seen that the maximum temperature decreased with the increase in the grid cells, whose trend was stable at grid number 478,898. Furthermore, the independent analysis of the time step at 25 s was also simulated.
Figure 3c,d are the comparisons of the battery temperatures in Scheme 1, Scheme 2, and Scheme 3 with 12 FHPs under a 2C discharge rate and ambient temperatures of −5 °C, 10 °C, 25 °C, and 37 °C, respectively. It was verified that the maximum temperature and temperature difference of Scheme 3, the combined CPCM with FHPs, were lower than in Schemes 1 and 2. It is ascertained that the BTMS with CPCM and FHPs owned better thermal performance. However, it could not keep the maximum temperature of the batteries within the normal temperature range (50 °C) [4,27,28] under a maximum discharge rate of 2C and a high temperature of 37 °C. Therefore, liquid cooling was assisted in the CPCM–FHP system in the following study to improve thermal performance.

4. Scheme Design and Parameter Discussion

4.1. Scheme Design

From the previous analysis, it can be seen that Scheme 4 has optimal thermal performance. This section proposes three more schemes based on Scheme 4 for comparative verification. The CPCMs in Scheme 4 are set as mica plates, namely, Scheme 4-1. The CPCMs in Scheme 4 are set as air, namely, Scheme 4-2. In addition, all the CPCMs are removed from Scheme 4, namely, Scheme 5, using a combination of seven FHPs and liquid cooling. Figure 4 displays the battery temperatures in the schemes under the 2C discharge rate and 37 °C ambient temperature. It can be seen that the temperatures of the schemes meet the temperature requirements of the BTMS, and the maximum temperature of Scheme 4 is the lowest. In addition, from the perspective of structural simplification, the design of Scheme 5 is also acceptable. To further study the thermal performance of the BTMS, integrating CPCM, FHPs, and liquid cooling, parameter study and optimization will be conducted based on Scheme 4 in the subsequent work.

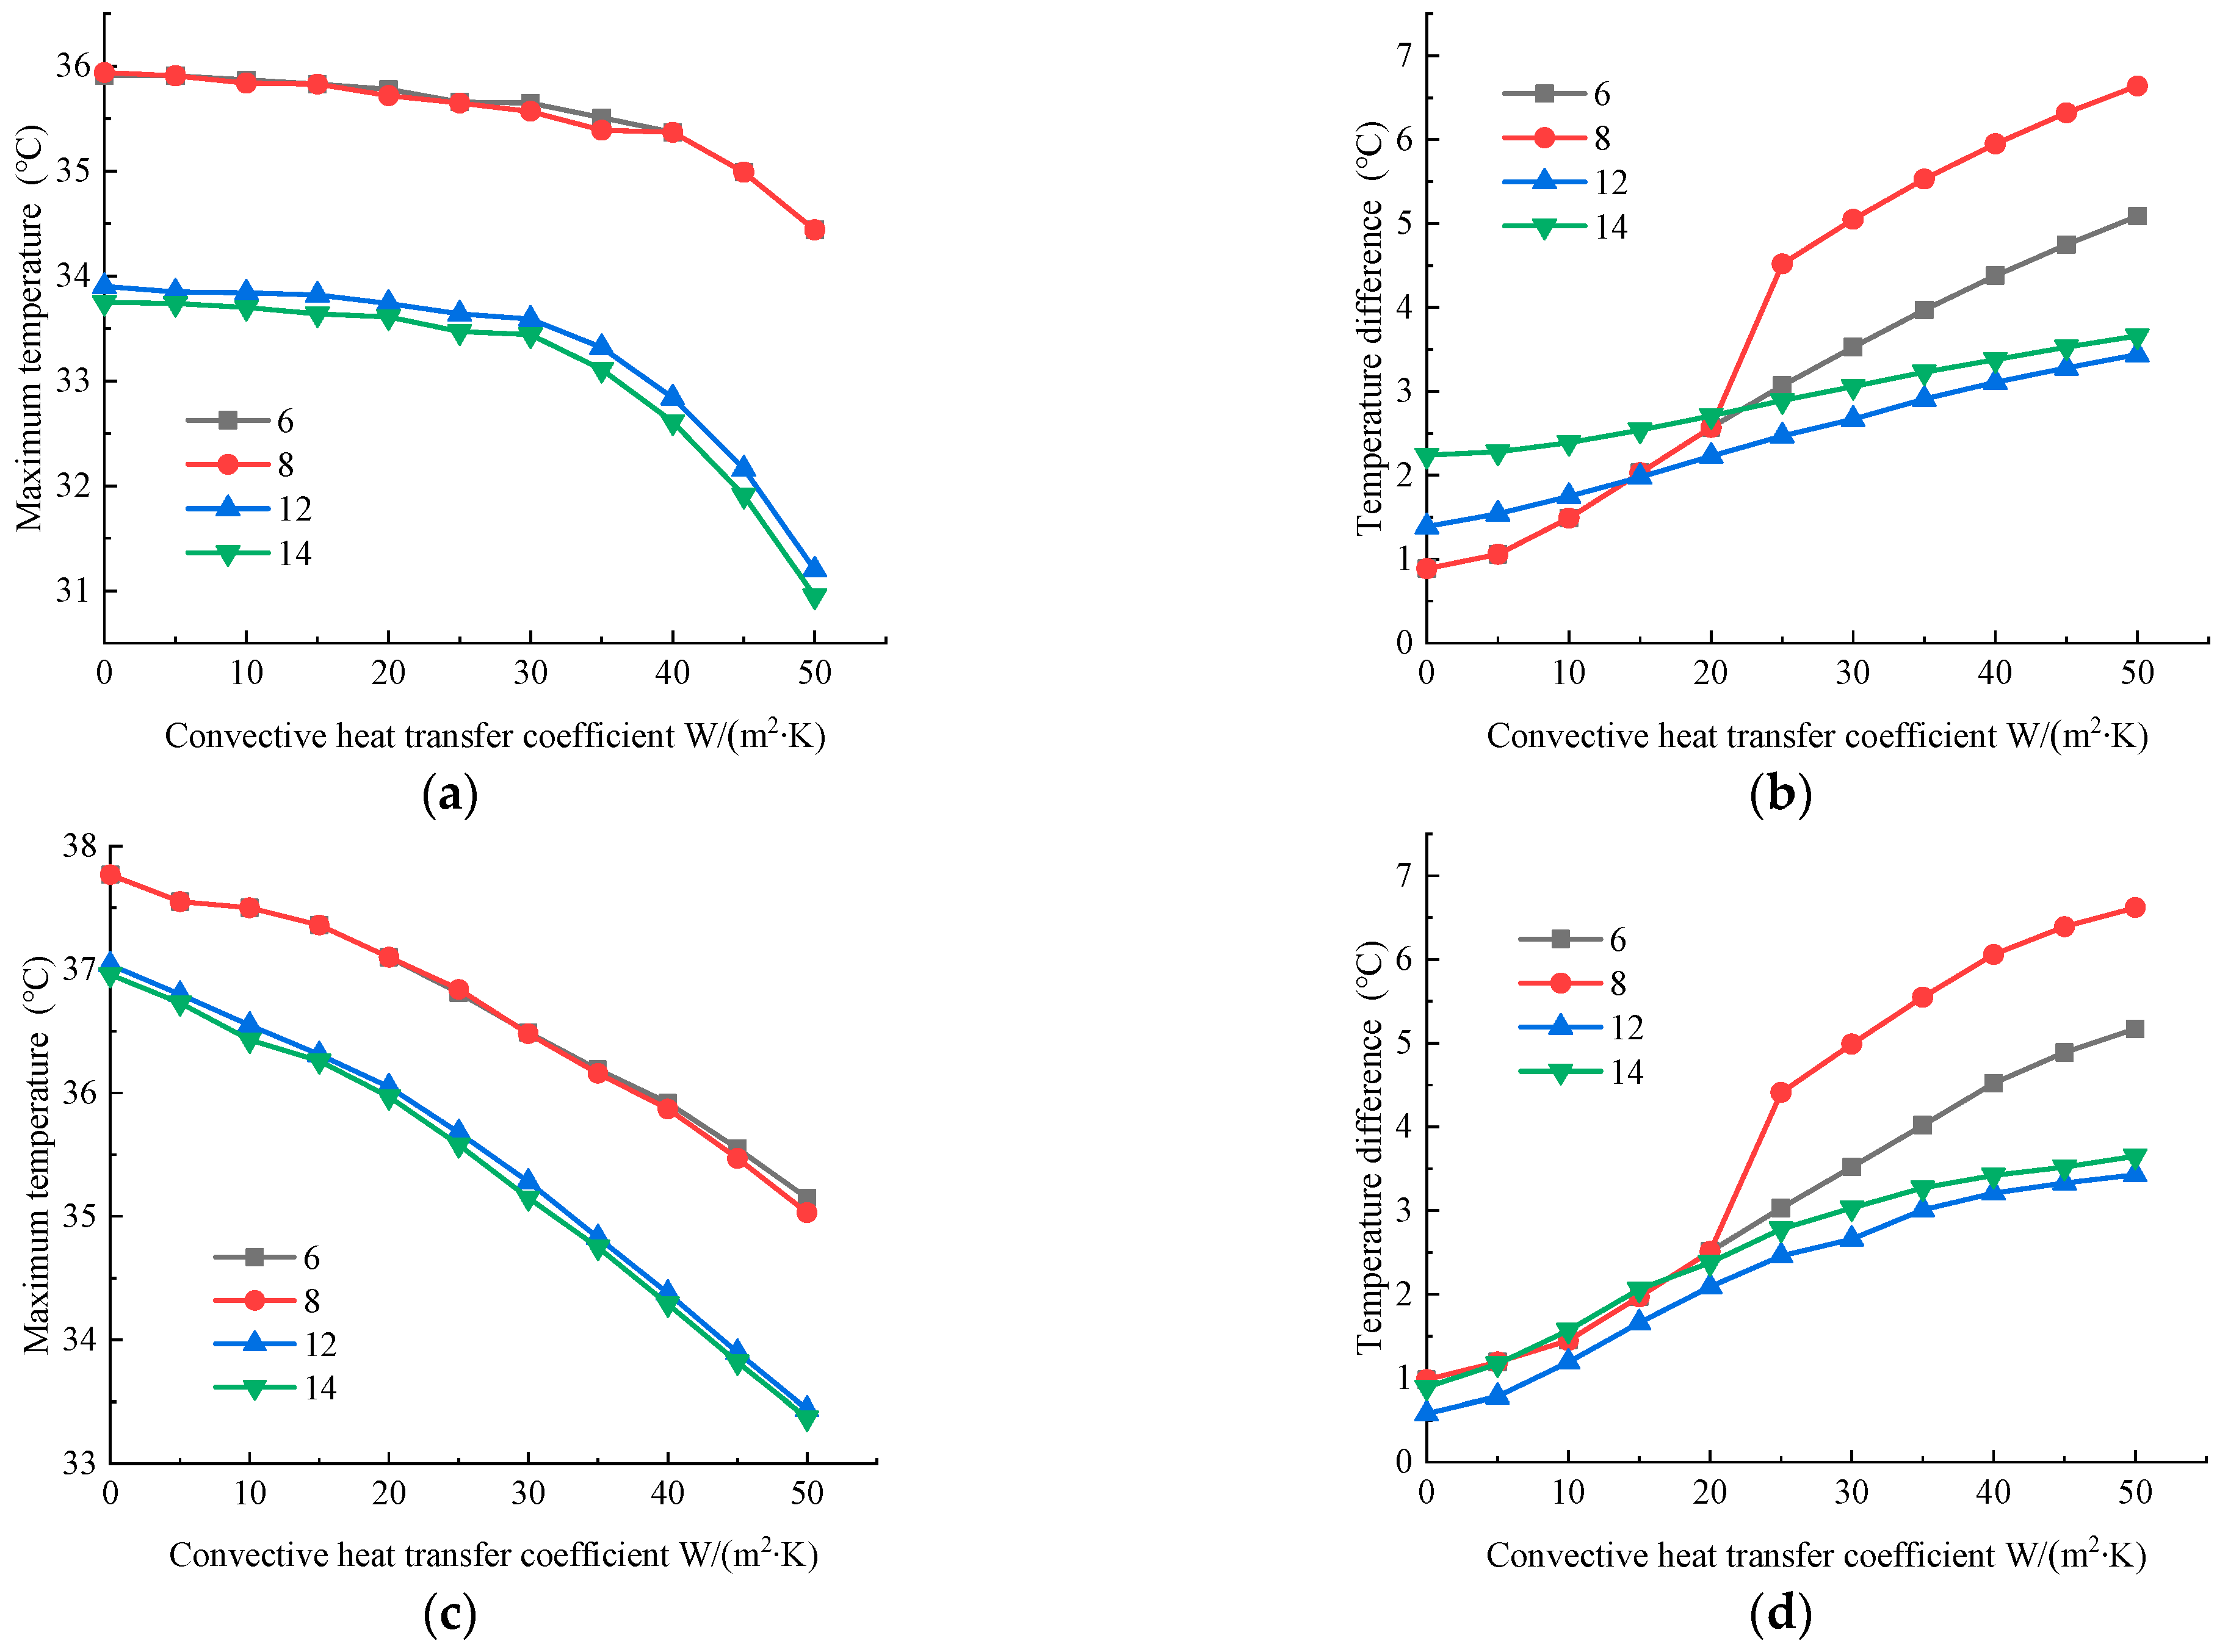
4.2. Effect of FHP Number

The FHPs are applied between batteries in the BTMS based on CPCM to improve thermal performance. Therefore, the FHP number is set to 6, 8, 12, and 14, respectively, shown in Figure 5, to improve the temperature uniformity of the BTMS. Six FHPs are decorated in Figure 5a, attached to one side of the six batteries. Eight FHPs are set in Figure 5b, which are placed on both sides of the four middle batteries to strengthen the cooling capacity of the battery module. Twelve FHPs are employed in Figure 5c on both sides of the six batteries. Moreover, Figure 5d is a combination of Figure 5c and two FHPs on the two outsides of the battery module.
Air cooling based on forced convection is also a common cooling method of BTMSs. According to Figure 3c, the BMTS using CPCM and FHPs cannot meet the operating temperature requirements. Therefore, the BTMS using CPCM–FHP combined with air cooling and liquid cooling were studied, respectively, in this work.
Figure 6 are the maximum battery temperatures (a,c,e,g) and temperature differences (b,d,f,h) in Scheme 3 versus convective heat transfer coefficient under a 2C discharge rate, different numbers of FHPs and different ambient temperatures of −5 °C (a,b), 10 °C (c,d), 25 °C (e,f), and 37 °C (g,h). It can be seen from Figure 6a,c,e,g that the maximum temperature of the battery module shows a negative correlation with the number of FHPs, decreasing with more FHPs. Moreover, the temperature difference of the battery module with eight FHPs is slightly higher than that with six FHPs. The main reason is that the eight FHPs are arranged on both sides of the middle four batteries, and the outermost two batteries do not have a strong heat dissipation effect. The temperature difference further increases, especially after the CPCM begins to melt. However, the six FHPs are evenly distributed on one side of the six batteries. Hence, the temperature uniformity at the end of the discharge process is good because of the large thermal conductivity of the FHPs. In addition, the temperature difference of the battery modules with six and eight FHPs continues to rise at the convective heat transfer coefficient of 20 ~ 30 W/(m2·K) due to the CPCM beginning to melt to complete liquidity.
When the number of FHPs increases to 12, the maximum temperature of the battery module shows a significant downward trend, which is decreased by 2 °C compared to 6 FHPs, especially in a low-temperature environment of −5 °C and adiabatic conditions. In addition, it shows a similar trend with 14 FHPs but with better temperature uniformity. The main reason is that the 12 FHPs are evenly arranged on both sides of the 6 batteries. The heat released by the batteries is dissipated in a timely manner and stored in the CPCM, leading to a low temperature difference. The 2 additional FHPs in the battery module with 14 FHPs reduce the maximum temperature of the batteries and the minimum temperature of the outermost batteries, resulting in a larger temperature difference.
In addition, it can be seen from Figure 6b,d,f,h that the maximum temperature of the battery module decreases with the convective heat transfer coefficient increasing while the temperature difference increases. Furthermore, the temperature difference of the battery module is significantly impacted by the convective heat transfer coefficient, especially when the FHP number is set to be 6 and 8, and it is decreased when the number of FHPs increases to 12 and 14 because of the higher thermal conductivity of the FHPs. It is indicated that the FHPs can effectively reduce the maximum temperature while significantly improving the temperature uniformity of the BTMS.
Figure 7a–d display the temperature fields of the different FHP numbers on battery temperature under a 2C discharge rate and 37 °C ambient temperature. For the battery modules with six FHPs, the maximum temperature appears near the middle batteries with a slight temperature difference due to the average distribution of FHPs and batteries. For the battery modules with eight FHPs, the temperature of the middle batteries is lower, while that on both sides is higher. The main reason is that the FHPs are set on both sides of the four batteries in the middle. Furthermore, the temperature distribution of the battery module is relatively uniform with the FHPs increased to 12. In addition, the outermost two batteries of the battery module are supercooled when the FHP number is increased to 14, resulting in a larger temperature difference.
All temperature differences of the battery modules with 12 FHPs and 14 FHPs are maintained within 5 °C, meeting the temperature uniformity requirements of a BTMS [29,30,31] under different ambient temperatures and convective heat transfer coefficients. However, the temperature differences in the battery modules with six FHPs and eight FHPs ultimately exceed 5 °C with the convective heat transfer coefficient increase. Based on the above analysis, the battery module with 12 FHPs has a better maximum temperature and temperature uniformity.

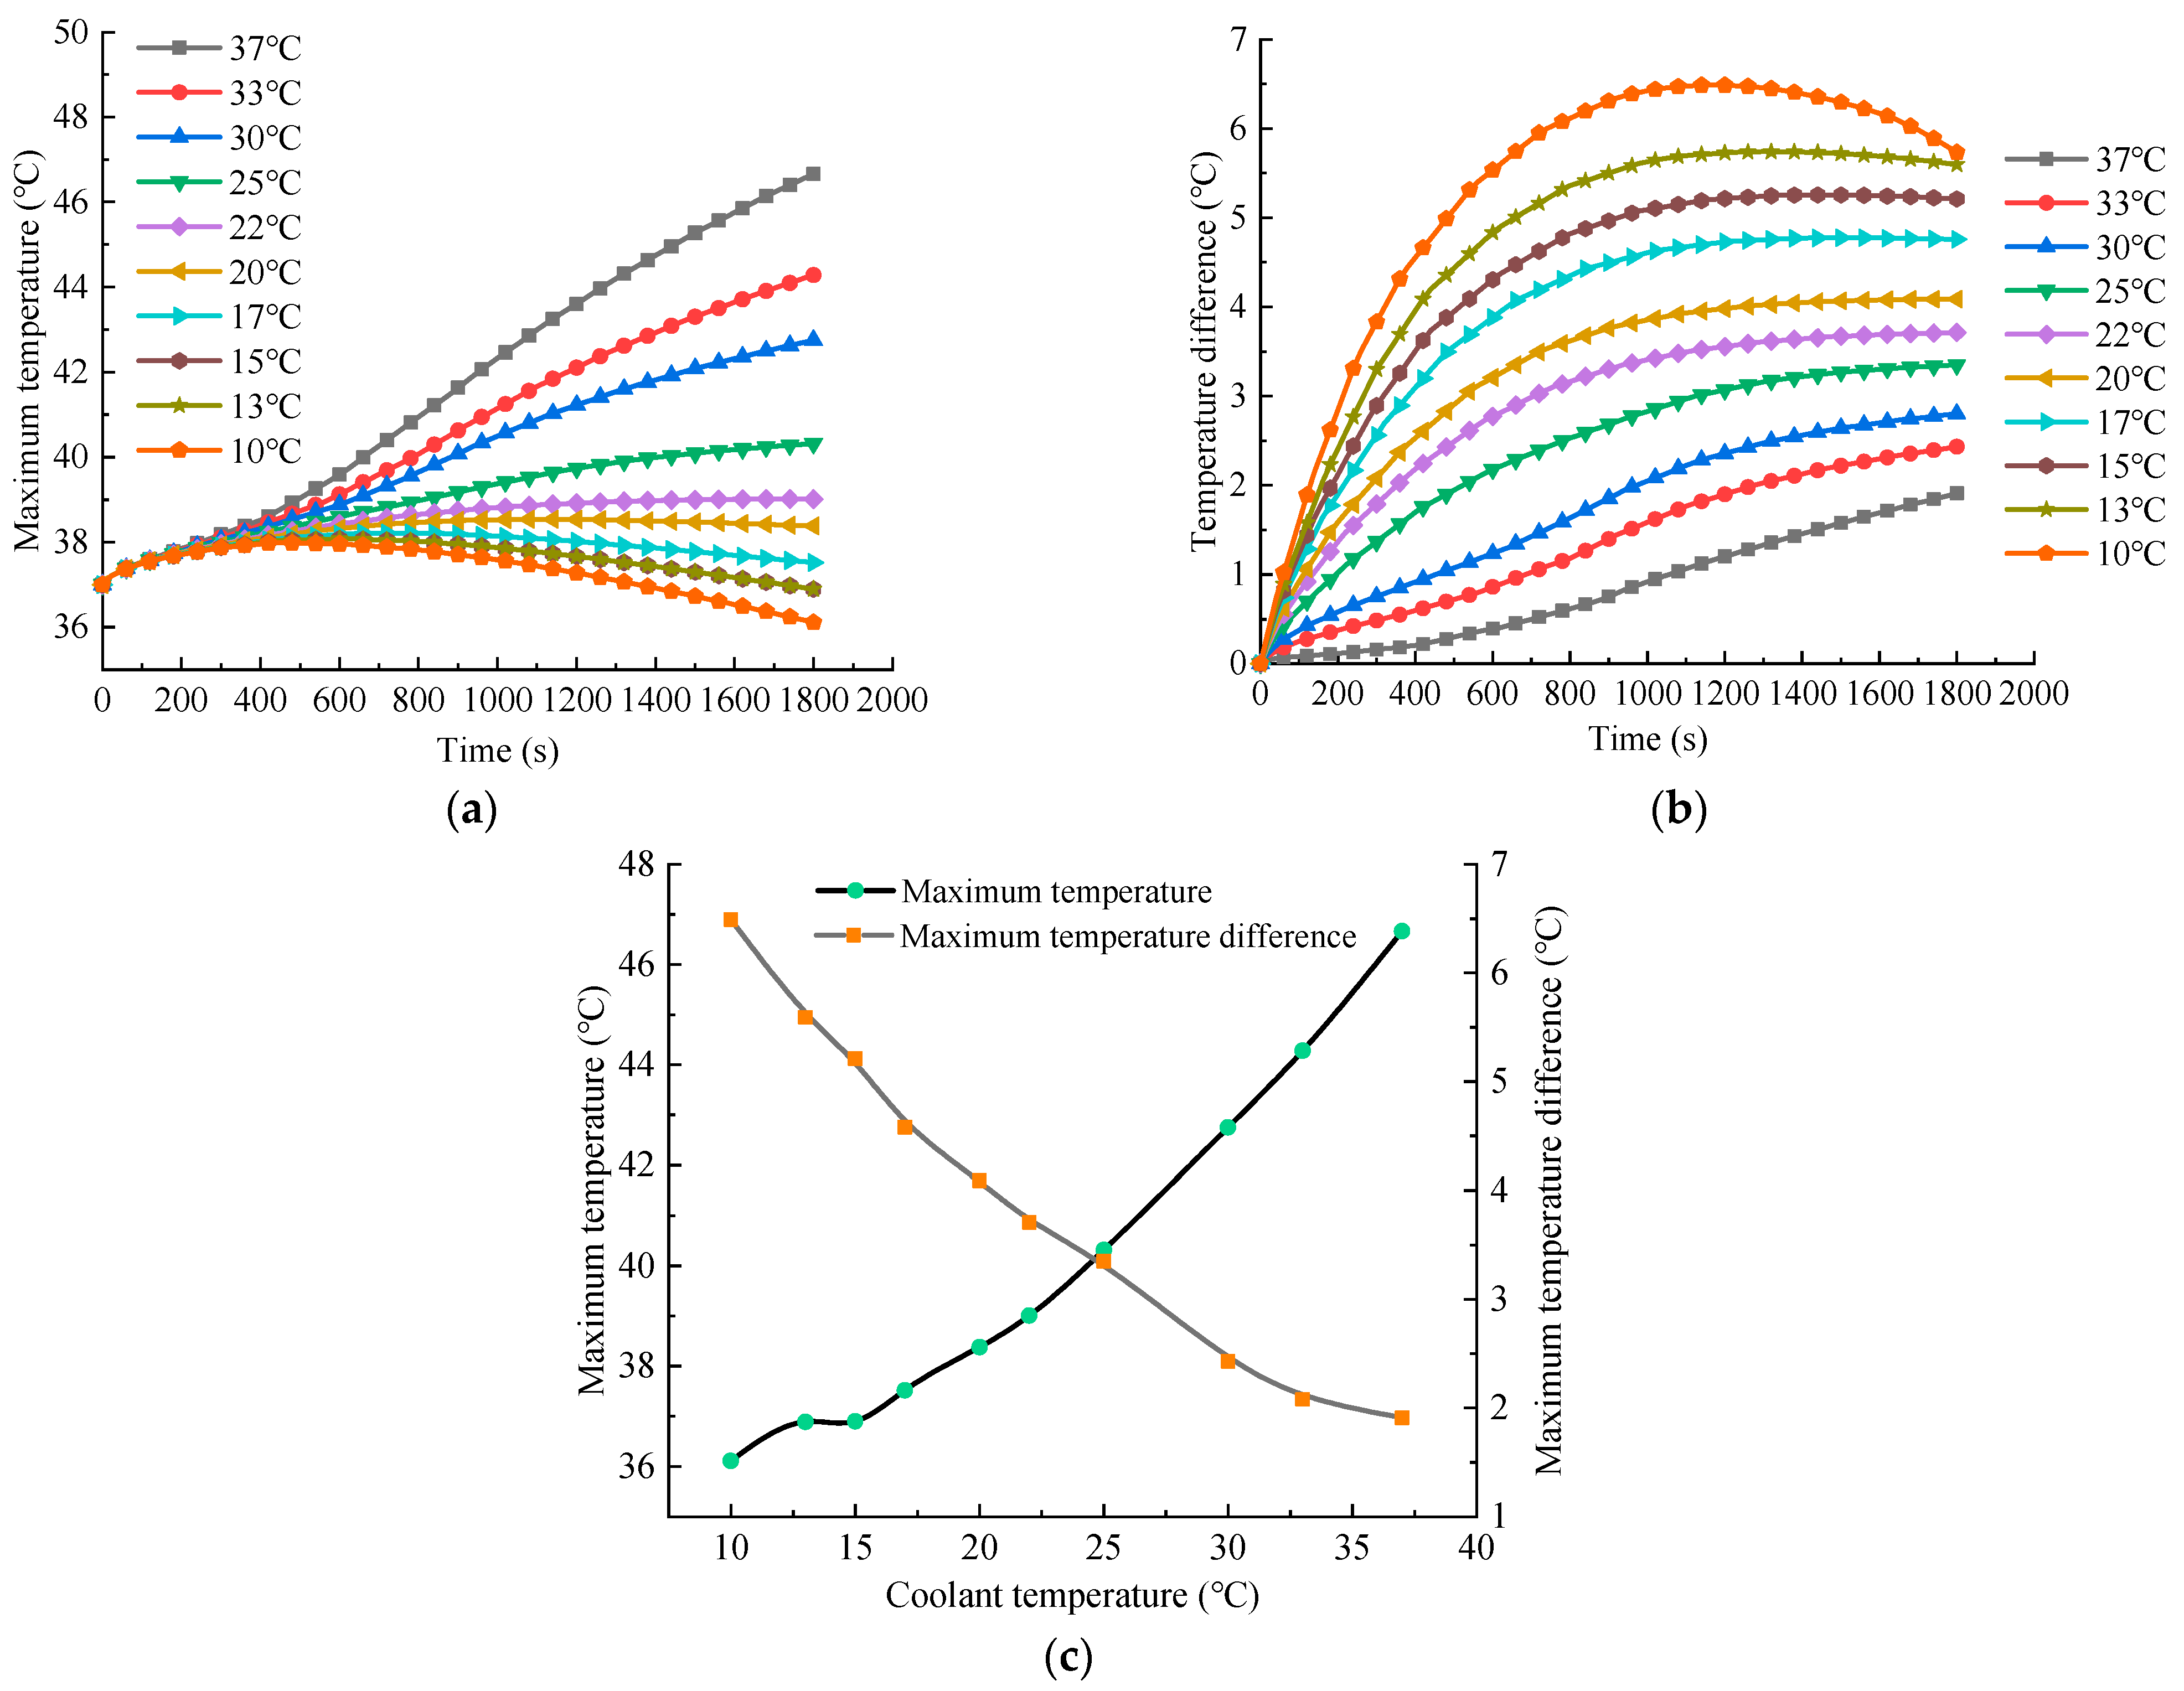
4.3. Effect of Coolant Temperature

It is known that Scheme 3, using CPCM and FHPs, has a maximum temperature of over 50 °C under a high-temperature environment of 37 °C and a maximum discharge rate of 2C. Therefore, liquid cooling is added on two sides of the battery module to assist the heat dissipation of Scheme 3 in Figure 1d. Figure 8 shows the change in battery temperature with different coolant temperatures under the 2C discharge rate and 37 °C ambient temperature.
Figure 8a shows that the maximum temperature of the battery module will be affected by the coolant temperature, and the two are positively correlated. Still, the temperature difference has an opposite trend. The maximum temperature reaches 46.67 °C, 6.56 °C lower than that of the BTMS, based on the coupling of CPCM and the FHPs under the coolant temperature of 37 °C, showing that liquid cooling has a good effect on improving the heat dissipation performance of the BTMS. Liquid cooling takes away more and more heat as the coolant temperature decreases. Moreover, the rate of decline is relatively large until the coolant temperature drops to 22 °C. It shows that the heat taken away by the coolant has reached a balance with the heat generated by the battery module. Even if the coolant temperature continues to be lowered, it cannot cool down more effectively. Currently, the maximum temperature of the battery module remains near the initial ambient temperature. In addition, it remains near the phase change temperature of CPCM at 13 °C and 15 °C coolant temperatures due to the melting of the CPCM.
In addition, Figure 8b shows that the maximum temperature of the battery module decreases while decreasing the coolant temperature. In contrast, the temperature difference increases, reaching its lowest at 1.91 °C at the coolant temperature of 37 °C, consistent with the ambient temperature. In comparison, it reaches its highest at 4.76 °C at the coolant temperature of 17 °C. Furthermore, the temperature difference of the battery module will exceed 5 °C if we suppose the coolant temperature continues to be lowered, which cannot meet the temperature uniformity requirements of the BTMS during regular operation. Relying solely on reducing the coolant temperature cannot improve the thermal performance of a BTMS. Therefore, the coolant temperature, close to the ambient temperature, should be preferred to balance the maximum temperature and maximum temperature difference of the BTMS.

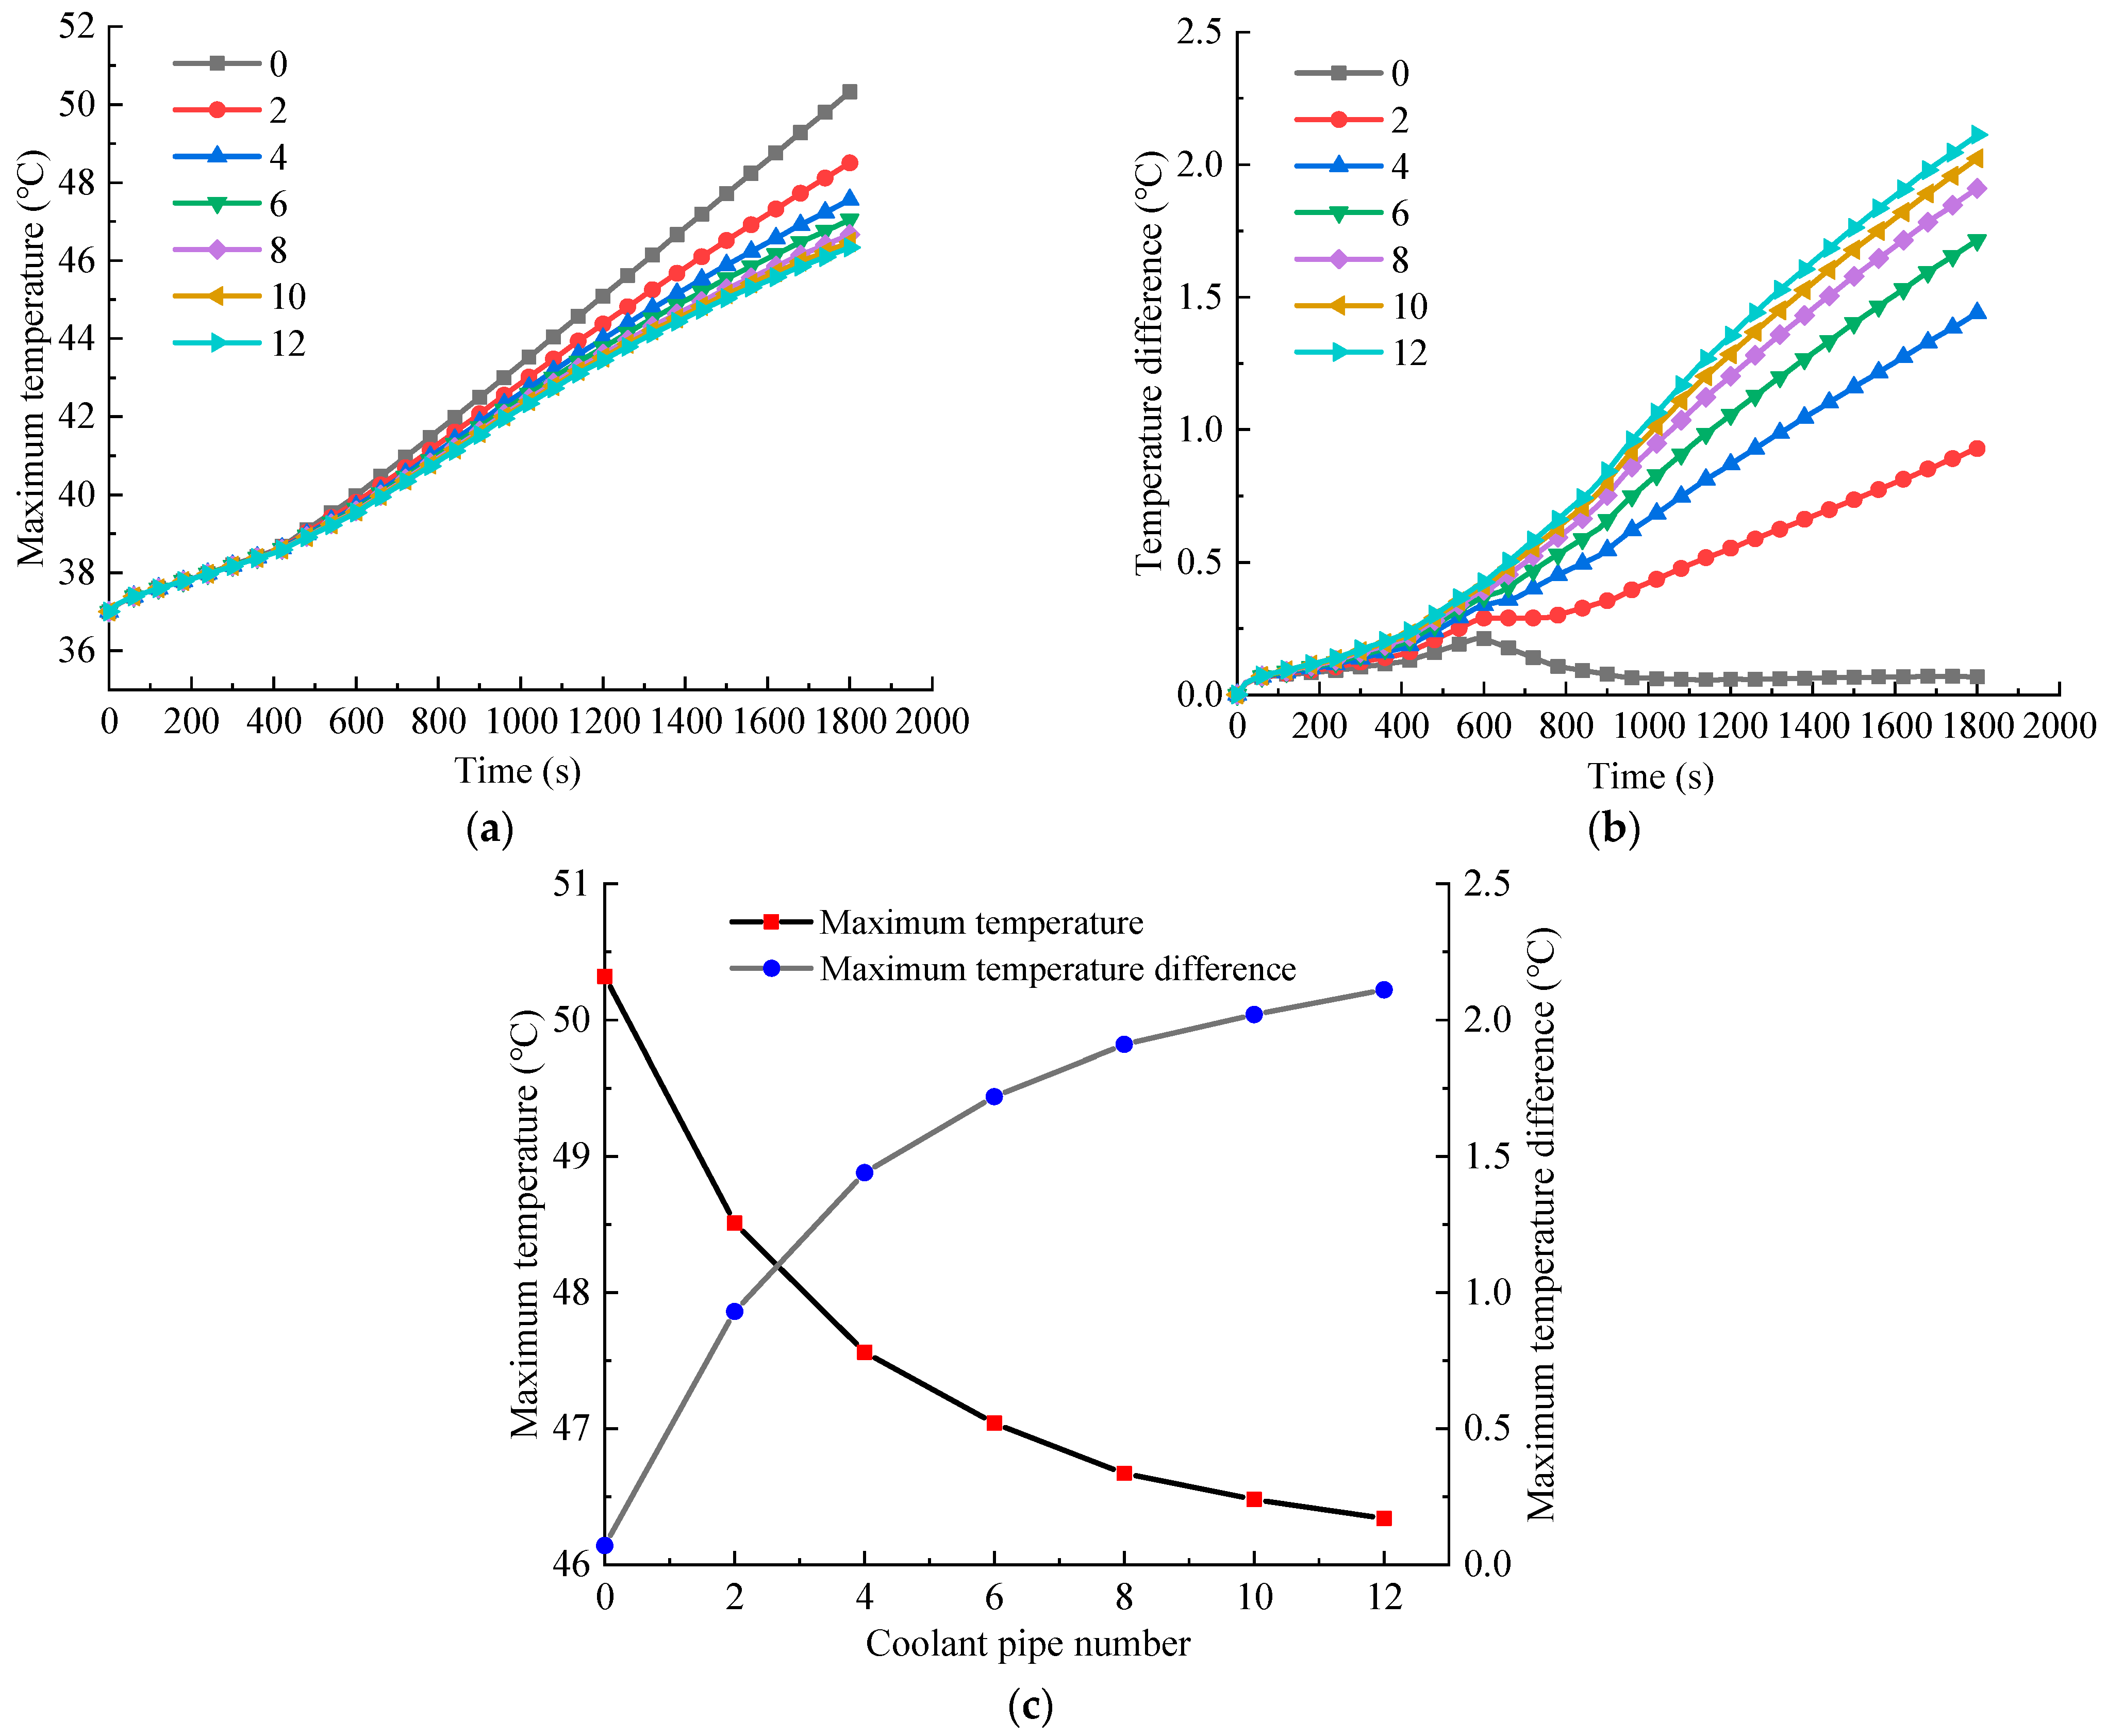
4.4. Effect of Coolant Pipe Number

Figure 9 shows the change in battery temperature with the number of cooling pipes being 0, 2, 4, 6, 8, 10, and 12 under a 2C discharge rate, 37 °C ambient temperature, and a coolant velocity of 0.1 m/s. The maximum temperature of the battery module decreases with the larger number of cooling pipes. It reaches up to 50.32 °C without liquid cooling, which exceeds the working temperature of the BTMS. Furthermore, it continues to decrease with the increasing number of cooling pipes. The main reason is that more cooling pipes can take more battery heat.
The drop-tends of the battery temperature will be flat when the number of cooling pipes increases to eight or more. The coolant takes the heat away and reaches a balance with the heat from the battery; continuing to increase the flow of the coolant will not further reduce the maximum temperature of the battery module. Figure 9b shows that the battery temperature difference increases with the number of cooling pipes. However, the increasing trend of the temperature difference tends to be stable as the decreasing trend of the maximum temperature tends to be stable. In addition, it is seen from Figure 9c that the maximum temperature and temperature difference exhibit opposite trends with the increased number of cooling pipes. Therefore, selecting the appropriate number of cooling pipes should be considered comprehensively. Based on the above analysis, a BTMS with eight cooling pipes is preferred for the following study under a high discharge rate of 2C, a high-temperature environment of 37 °C, and a 0.1 m/s velocity.

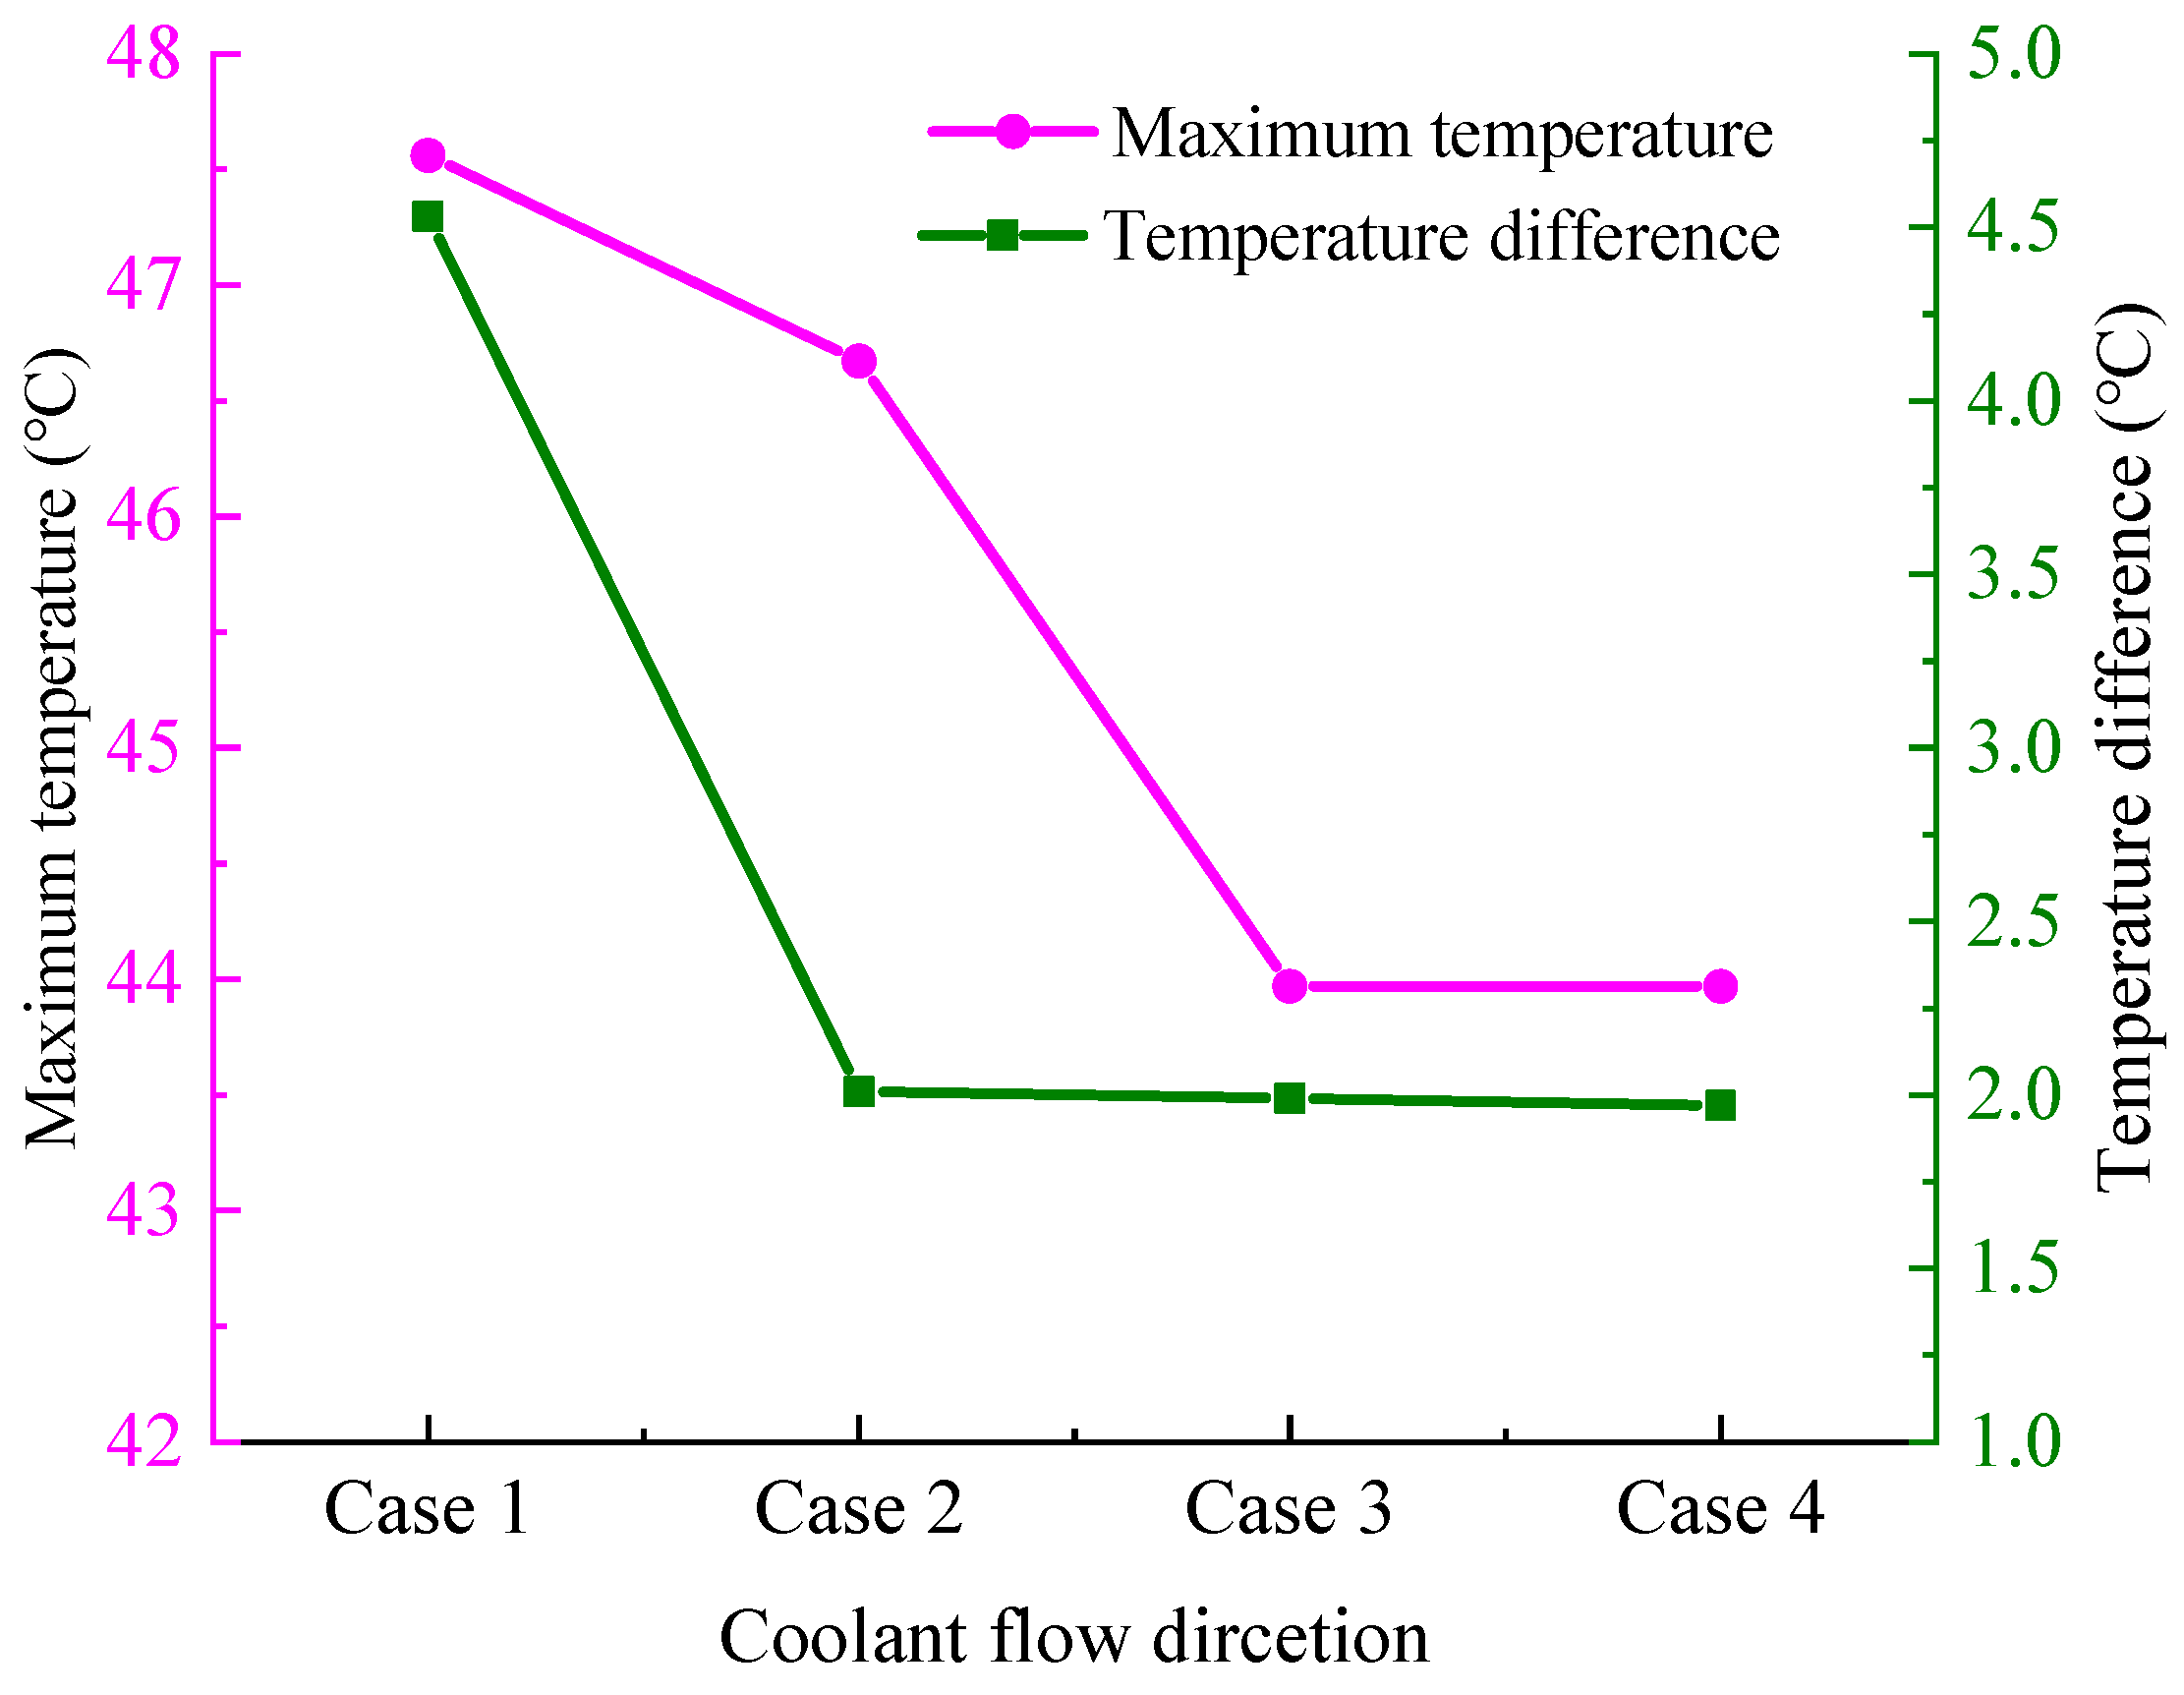
4.5. Effect of Coolant Direction

Figure 10 shows the structure diagram of Scheme 4 in Figure 1d with four coolant flow directions under the 2C discharge rate, 37 °C ambient temperature, and 0.1 m/s coolant velocity. Figure 10a shows the directions of eight cooling pipes set as parallel flow, namely, Case 1; Figure 10b shows the four cooling pipes on one side as inlets while the four cooling pipes on the other side are outlets, namely, Case 2; Figure 10c is the directions of the four cooling pipes on one side as the counter flow and four cooling pipes on the other side in the horizontal direction, namely, Case 3; Figure 10d is the directions of eight cooling pipes, all as counter flow, namely, Case 4. The difference between Case 3 and Case 4 is that the coolant flow direction on both sides of the horizontal direction is consistent in Case 3 while it is different in Case 4.
Figure 11 displays the battery temperature in the four coolant flow direction cases in Figure 10. It can be seen that the maximum temperature and temperature difference of the battery module is lower with a counter flow of the coolant than with a parallel flow. The main reason is that the coolant inlet temperature is the same as that of the battery module. In contrast, the coolant outlet temperature rises due to the heat absorption from the battery module. The temperature difference between the two ends of the battery module is balanced through the counter flow of the coolant. Therefore, the counter flow direction in Case 3 owns better thermal performance of the BTMS to account for the complexity of the system structure and the light weight of the vehicle and is used for the following work.

5. Optimization Based on Orthogonal Design Method

5.1. Orthogonal Design

The orthogonal design method employs a table to realize multi-factor and multi-variable experiments. A representative test plan is obtained, and further comparisons are made to form the best approach. Therefore, the effects of different factors on the test results can be clarified, which can be used to predict the development trend of related variables. The advantage of the method is that it can obtain the optimal parameter combination that meets the experimental requirements through fewer tests quickly and accurately [32,33].
The methods of range analysis and variance analysis are mainly used in analyzing the test results, which are the numerical tests in orthogonal design, and the basic principles and applicability of the two are significantly different. The range analysis method is simple and intuitive. The importance of factors can be judged according to the size of the range value. In addition, the range analysis method can also quickly obtain the optimal factor combination but cannot accurately determine the effect of various factors on the experimental results. The analysis of variance can not only estimate the experimental error but also judge the impact of the error, so it makes up for the defects of the former method to a certain extent. In addition, it can still obtain the influence of various factors and interactions on the test results, even with many levels and interactions.
The orthogonal test aims to select the optimal parameter combination in the previous parameter study to design a more efficient BTMS structure and better temperature control to prevent thermal safety problems caused by excessive temperatures. The lowest maximum temperature and the lowest temperature difference of the battery module are set as the evaluation indicators in the orthogonal test design under the maximum discharge rate of 2C and a high-temperature environment of 37 °C.
The coolant temperature has a significant impact on the maximum temperature and the temperature difference of the battery module. Therefore, it is necessary to find a suitable coolant temperature under different operating conditions when designing the BTMS. In general, the coolant temperature changes with the ambient temperature, but it can also be controlled with thermoelectric precooling, which is set as an optimized design variable. Therefore, the FHP number, the coolant temperature, and the cooling pipe number are selected for the design. It was concluded that the optimal values of the three factors with four levels appear within a specific range from the previous single-factor analysis. We replaced each factor with a letter: A, FHP number; B, coolant temperature; C, cooling pipe number. There was no interaction among the factors when judging the preliminary experiments, so the influence of interaction is not considered. Therefore, there are three factors and four levels in the orthogonal test. The specific factor levels are shown in Table 3.
The orthogonal table is mainly selected with a small number that can meet the experimental requirements according to the number of factors and levels in an orthogonal test design. This test has three factors and four levels, so the L16 (45) orthogonal table is employed to determine 16 test schemes. A reasonable header design needs to arrange all factors in the table. There are three factors in this test, so the two extra columns are used as empty columns, designed as error columns, and placed at the end of the orthogonal table. The required orthogonal test schemes can be obtained by combining the previous analyses. The results were obtained using COMSOL Multiphysics and analyzed for range and variance. The orthogonal test schemes and simulation results are shown in Table 4.

5.2. Results and Discussion

5.2.1. Range Analysis

The order of significance of the various factors on the maximum temperature of the battery module was B-coolant temperature > C-coolant pipe number > A-FHP number to take the maximum temperature as the evaluation index. The range analysis data for the maximum temperature are shown in Table 5.
The order of significance of the various factors on the temperature difference was A-FHP number > B-coolant temperature > C-coolant pipe number to take the temperature difference of the battery module as the evaluation index. The range analysis data for the temperature difference are shown in Table 6.

5.2.2. Variance Analysis

According to variance analysis, the coolant temperature had a more significant impact on the experimental results when the maximum temperature was used as the evaluation index, as shown in Table 7. The significance labeled with more stars stands for higher significance. Moreover, the number of FHPs significantly impacted the experimental results when the temperature difference was selected as the evaluation index, as shown in Table 8.

5.2.3. Optimal Solution Analysis

According to the range and variance analysis results, the optimal solutions determined are different under different test indicators. It is obvious that a high FHP number, low cooling temperature, and a large number of pipes can decrease the maximum battery temperature. In this situation, the A4B1C4 condition (Table 3) is obviously optimal without using a range or variance analysis approach. The optimal solution for the minimum temperature difference in the battery is A3B4C2, resulting in the lowest temperature difference but, somehow, a higher maximum temperature.
Although a high FHP number and low cooling temperature can decrease the maximum battery temperature, more FHP numbers will increase system weight. A lower coolant temperature will increase the temperature difference of the battery module and the pump power consumption. Therefore, the final scheme is obtained as A1B4C4 to target the minimum temperature difference between the maximum temperature of the battery module and the coolant temperature, which meets the requirements of the maximum temperature and temperature difference of the BTMS and greatly reduces the weight and power consumption of the system.
In addition, the original scheme in Figure 11 of Case 3 (number of FHPs: 12, coolant temperature: 37 °C, and number of coolant pipes: 8) is A3B4C2. The results of A4B1C4, A3B4C2, and A1B4C4 are shown in Table 9. Figure 12 displays the temperature fields of the original scheme and A1B4C4 on battery temperature under the 2C discharge rate and 37 °C ambient temperature. The maximum temperature in A1B4C4 is lower than the original scheme, and the temperature distribution of the middle batteries is more uniform. Moreover, the number of FHPs in scheme A1B4C4 is fewer than in the original scheme, significantly reducing system weight and improving system economy and safety. Finally, the optimal solution is selected as A1B4C4 based on the actual situation of the BTMS and the simulation results.
The comprehensive balance method was employed to conduct the optimal solution analysis. The formulas for calculating the estimated value of the test indicator are as follows:
y ^ 1 = μ ^ + a ^ 1 + b ^ 1 + c ^ 1 y ^ 2 = μ ^ + a ^ 2 + b ^ 2 + c ^ 2 y ^ 3 = μ ^ + a ^ 3 + b ^ 3 + c ^ 3 y ^ 4 = μ ^ + a ^ 4 + b ^ 4 + c ^ 4 y ^ 13 = μ ^ + a ^ 13 + b ^ 13 + c ^ 13 y ^ 14 = μ ^ + a ^ 14 + b ^ 14 + c ^ 14 y ^ 15 = μ ^ + a ^ 15 + b ^ 15 + c ^ 15 y ^ 16 = μ ^ + a ^ 16 + b ^ 16 + c ^ 16
where μ ^ is the estimated value of mathematical expectation in the experimental data, a ^ k (k = 1, 2, 3, 4) is the effect of factor A (FHP number) corresponding to level k, b ^ m (m = 1, 2, 3, 4) is the effect of factor B (coolant temperature) corresponding to level m, and c ^ n (n = 1, 2, 3, 4) is the effect of factor C (coolant pipe number) corresponding to level n.
The estimated value of the test indicator based on optimal combination factors obtained using the comprehensive balance method is expressed by the following formulas:
μ ^ = y ¯ = 1 16 i = 1 16 y i a ^ k = y A k ¯ y ¯ b ^ m = y B m ¯ y ¯ c ^ n = y C n ¯ y ¯
It can be ascertained that the average estimated values of the mathematical expectation of the orthogonal test are 41.51 °C and 4.14 °C, respectively, when the maximum temperature and temperature difference are used as the evaluation indexes, respectively. Moreover, the average value of the experimental indicators corresponding to the levels of each factor can be calculated, as shown in Table 10.
The estimated values obtained through the optimal combination scheme A1B4C4 are 43.10 °C and 3.14 °C, respectively, when the evaluation indexes used are the maximum temperature and temperature difference of the battery module. The above results are similar to the data obtained from the previous simulation model A1B4C4 (43.17 °C and 3.36 °C), with errors of 0.07 °C and 0.22 °C, respectively. Therefore, the effectiveness and rationality of the selected optimal combination scheme A1B4C4 (number of FHPs: 6, coolant temperature: 37 °C, and number of coolant pipes: 12) can be proved.

6. Conclusions

Three schemes of BTMSs using only CPCM (Scheme 1), CPCMs with ATDPs (Scheme 2), and CPCMs with FHPs (Scheme 3) were analyzed for thermal performance in this work. Then, the liquid cooling was added to further assist in the heat dissipation of the CPCM–FHP model. In addition, the effects of the number of FHPs and cooling pipes, the coolant temperature, and the coolant flow direction on the thermal characteristics of battery modules were discussed. Finally, the orthogonal design method was used for optimization tests on multiple factors and levels to improve the light weight of the system while ensuring that the battery module met the requirements of maximum temperature and temperature difference. The conclusions are as follows:
(1)
It was found that Scheme 3 could control the maximum temperature and temperature difference of the battery module to a certain extent compared to Scheme 1 and Scheme 2, regardless of the discharge rate or environmental temperature. However, it was unsuitable for high discharge rates and high environmental temperatures.
(2)
A BTMS, combined with liquid cooling with CPCM–FHP, can significantly reduce the maximum temperature of the battery module, with a decrease in the coolant temperature and an increase in the number of cooling pipes. Moreover, the maximum temperature and temperature difference of the battery module was lower with a counter flow direction than with a parallel flow.
(3)
The number of FHPs, cooling pipes, and the coolant temperature were selected for multi-factor and multi-level analysis in the orthogonal design method. The optimal parameter combinations, with an FHP number of 6, a coolant temperature of 37 °C, and a cooling pipe number of 12, were obtained to achieve the best thermal performance of the BTMS. The maximum temperature and temperature difference were kept at 43.17 °C and 3.36 °C, respectively, under the maximum discharge rate of 2C and the high-temperature environment of 37 °C. The optimal solution analysis of the optimal scheme was conducted further, proving the effectiveness and rationality of selecting the optimal parameter combination.

Author Contributions

Conceptualization, J.X. and T.Y.; methodology, T.Y. and H.Z.; software, Q.X.; validation, Q.X.; formal analysis, T.Y.; investigation, Q.X.; resources, J.X. and H.Z.; data curation, Q.X. and T.Y.; writing—original draft preparation, Q.X. and T.Y.; writing—review and editing, J.X., H.Z., and J.Z.; visualization, Q.X.; project administration, J.X. and J.Z.; funding acquisition, J.X. and H.Z. All authors have read and agreed to the published version of the manuscript.

Funding

This research was funded by the Research Project of Wuhan University of Technology Chongqing Research Institute (YF 2021-08), the Science and Technology Development Foundation of CMVR from China Merchants Testing Certification Vehicle Technology Research Institute Co., Ltd. (20AKC3), the National Natural Science Foundation of China (51876113), the 111 Project of China (B17034), and the Innovative Research Team Development Program of Ministry of Education of China (IRT_17R83).

Data Availability Statement

The data are contained within the article.

Acknowledgments

Thanks should be given to Yang Jiaxing for his helpful discussions on the experimental validation of the model.

Conflicts of Interest

The authors declare that they have no known competing financial interest or personal relationships that could have appeared to influence the work reported in this paper.

References

  1. Li, A.; Yuen, A.C.Y.; Wang, W.; Chen, T.B.Y.; Lai, C.S.; Yang, W.; Wu, W.; Chan, Q.N.; Kook, S.; Yeoh, G.H. Integration of computational fluid dynamics and artificial neural network for optimization design of battery thermal management system. Batteries 2022, 8, 69. [Google Scholar] [CrossRef]
  2. Yamanaka, T.; Kihara, D.; Takagishi, Y.; Yamaue, T. Multi-Physics equivalent circuit models for a cooling system of a lithium ion battery pack. Batteries 2020, 6, 44. [Google Scholar] [CrossRef]
  3. Chen, W.; Hou, S.; Shi, J.; Han, P.; Liu, B.; Wu, B.; Lin, X. Numerical analysis of novel air-based li-ion battery thermal management. Batteries 2022, 8, 128. [Google Scholar] [CrossRef]
  4. Ling, Z.; Wang, F.; Fang, X.; Gao, X.; Zhang, Z. A hybrid thermal management system for lithium ion batteries combining phase change materials with forced-air cooling. Appl. Energy 2015, 148, 403–409. [Google Scholar] [CrossRef] [Green Version]
  5. Xie, Y.; Tang, J.; Shi, S.; Xing, Y.; Wu, H.; Hu, Z.; Wen, D. Experimental and numerical investigation on integrated thermal management for lithium-ion battery pack with composite phase change materials. Energy Convers. Manag. 2017, 154, 562–575. [Google Scholar] [CrossRef] [Green Version]
  6. Jiang, G.; Huang, J.; Liu, M.; Cao, M. Experiment and simulation of thermal management for a tube-shell Li-ion battery pack with composite phase change material. Appl. Therm. Eng. 2017, 120, 1–9. [Google Scholar] [CrossRef]
  7. Anqi, A.; Li, C.; Dhahad, H.; Sharma, K.; Attia, E.-A.; Abdelrahman, A.; Mohammed, A.G.; Alamri, S.; Rajhi, A.A. Effect of combined air cooling and nano enhanced phase change materials on thermal management of lithium-ion batteries. J. Energy Storage 2022, 52, 104906. [Google Scholar] [CrossRef]
  8. Rao, Z.; Wang, Q.; Huang, C. Investigation of the thermal performance of phase change material/mini-channel coupled battery thermal management system. Appl. Energy 2016, 164, 659–669. [Google Scholar] [CrossRef]
  9. Bai, F.; Chen, M.; Song, W.; Yu, Q.; Li, Y.; Feng, Z.; Ding, Y. Investigation of thermal management for lithium-ion pouch battery module based on phase change slurry and mini channel cooling plate. Energy 2019, 167, 561–574. [Google Scholar] [CrossRef]
  10. Ling, Z.; Cao, J.; Zhang, W.; Zhang, Z.; Fang, X.; Gao, X. Compact liquid cooling strategy with phase change materials for Li-ion batteries optimized using response surface methodology. Appl. Energy 2018, 228, 777–788. [Google Scholar] [CrossRef]
  11. Abdelkareem, M.; Maghrabie, H.; Abo-Khalil, A.; Adhari, O.H.K.; Sayed, E.T.; Radwan, A.; Elsaid, K.; Wilberforce, T.; Olabi, A.G. Battery thermal management systems based on nanofluids for electric vehicles. J. Energy Storage 2022, 50, 104385. [Google Scholar] [CrossRef]
  12. Abbas, S.; Ramadan, Z.; Park, C. Thermal performance analysis of compact-type simulative battery module with paraffin as phase-change material and flat plate heat pipe. Int. J. Heat Mass Transf. 2021, 173, 121269. [Google Scholar] [CrossRef]
  13. Wang, Q.; Rao, Z.; Huo, Y.; Wang, S. Thermal performance of phase change material/oscillating heat pipe-based battery thermal management system. Int. J. Therm. Sci. 2016, 102, 9–16. [Google Scholar] [CrossRef]
  14. Wayan, S.; Muhamad, A.; Made, A. The application of battery thermal management system based on heat pipes and phase change materials in the electric bike. J. Energy Storage 2022, 56, 106014. [Google Scholar]
  15. Khan, M.; Dhahad, H.; Alamri, S.; Ali, E.A.; Sharma, K. Air cooled lithium-ion battery with cylindrical cell in phase change material filled cavity of different shapes. J. Energy Storage 2022, 50, 104573. [Google Scholar] [CrossRef]
  16. Faizan, M.; Pati, S.; Randive, P. Implications of novel cold plate design with hybrid cooling on thermal management of fast discharging lithium-ion battery. J. Energy Storage 2022, 53, 105051. [Google Scholar] [CrossRef]
  17. Yuan, Q.; Xu, X.; Tong, G.; Ding, H. Effect of coupling phase change materials and heat pipe on performance enhancement of Li-ion battery thermal management system. Int. J. Energy Res. 2020, 45, 5399–5411. [Google Scholar] [CrossRef]
  18. Elnaggar, M.; Abdullah, M.; Munusamy, S. Experimental and numerical studies of finned L-shape heat pipe for notebook PC cooling. IEEE Trans. Compon. Packag. Manuf. Technol. 2013, 3, 978–988. [Google Scholar] [CrossRef]
  19. Chen, W. Research on Heat Control System for Vehicular Power Battery Pack Based on Heat Pipe Technology. Master’s thesis, South China University of Technology, Guangzhou, China, 2014. [Google Scholar]
  20. Wei, K. Structure Design and Themal Analysis of Power Battery Thermal Management Based on Flat Heat Pipes. Master’s thesis, Beijing Jiaotong University, Beijing, China, 2019. [Google Scholar]
  21. Li, R. Study on the Heat Dissipation Performance of Power Battery Liquid Cooling Thermal Management System of Electric Vehicle Based on Flat Heat Pipe. Master’s thesis, Jiangsu University, Zhenjiang, China, 2019. [Google Scholar]
  22. Xu, X.; Zhang, H.; Cao, L.; Yi, Z.; Li, P.; Guo, H. Heat generation and surrogate model for large-capacity nickel-rich prismatic lithium-ion battery as against 18650 battery. J. Loss Prev. Process Ind. 2022, 77, 104783. [Google Scholar] [CrossRef]
  23. Zhang, H.; Wu, X.; Wu, Q.; Xu, S. Experimental investigation of thermal performance of large-sized battery module using hybrid PCM and bottom liquid cooling configuration. Appl. Therm. Eng. 2019, 159, 113968. [Google Scholar] [CrossRef]
  24. Song, L.; Zhang, H.; Yang, C. Thermal analysis of conjugated cooling configurations using phase change material and liquid cooling techniques for a battery module. Int. J. Heat Mass Transf. 2019, 133, 827–841. [Google Scholar] [CrossRef]
  25. COMSOL Multiphysics®. Available online: https://www.comsol.com (accessed on 16 June 2023).
  26. Xin, Q.; Yang, T.; Zhang, H.; Yang, J.; Zeng, J.; Xiao, J. Experimental and numerical study of lithium-ion battery thermal management system using composite phase change material and liquid cooling. J. Energy Storage 2023, in press. [Google Scholar]
  27. Liu, H.; Wei, Z.; He, W.; Zhao, J. Thermal issues about Li-ion batteries and recent progress in battery thermal management systems: A review. Energy Convers. Manag. 2017, 150, 304–330. [Google Scholar] [CrossRef]
  28. Wang, Q.; Ping, P.; Zhao, X.; Chu, G.; Sun, J.; Chen, C. Thermal runaway caused fire and explosion of lithium ion battery. J. Power Sources 2012, 208, 210–224. [Google Scholar] [CrossRef]
  29. Paul, S.; Diegelmann, C.; Kabza, H.; Tillmetz, W. Analysis of ageing inhomogeneities in lithium-ion battery systems. J. Power Sources 2013, 239, 642–650. [Google Scholar] [CrossRef]
  30. Yang, X.; Tan, S.; Liu, J. Thermal management of Li-ion battery with liquid metal. Energy Convers. Manag. 2016, 117, 577–585. [Google Scholar] [CrossRef]
  31. Chen, K.; Song, M.; Wei, W.; Wang, S. Structure optimization of parallel air-cooled battery thermal management system with U-type flow for cooling efficiency improvement. Energy 2018, 145, 603–613. [Google Scholar] [CrossRef]
  32. Xie, J.; Zang, M.; Wang, S.; Ge, Z. Optimization investigation on the liquid cooling heat dissipation structure for the lithium-ion battery package in electric vehicles. Proc. Inst. Mech. Eng. Part D J. Automob. Eng. 2017, 231, 1735–1750. [Google Scholar] [CrossRef]
  33. Li, N. Design and Optimization of Heat Dissipation Structure for Thermal Management System of Lithium Ion Batteries. Master’s thesis, Southwest Jiaotong University, Chengdou, China, 2019. [Google Scholar]
Figure 1. Four schemes of battery module structures: Scheme 1 with CPCM only (a), Scheme 2 with CPCMs and ATDPs (b), Scheme 3 with CPCMs and FHPs (c), and Scheme 4 combined CPCMs, FHPs, and liquid cooling (d).
Batteries 09 00334 g001
Figure 2. Comparison of battery temperatures obtained using simulation of the dynamic and average heat generation rates with experimental results at environmental temperatures of (a) −5°C, (b) 10°C, (c) 25°C and (d) 40°C under discharge rates of 0.5C, 1C, 1.5C and 2C (distinguished in colours).
Batteries 09 00334 g002
Figure 3. Mesh of Scheme 3 (a), independence analysis of grid in Scheme 3 under 1C discharge rate and 25 °C ambient temperature and natural convection (b), and comparisons of maximum battery temperatures (c) and temperature differences (d) in Scheme 1, Scheme 2, and Scheme 3 with 12 FHPs under a 2C discharge rate and ambient temperatures of −5 °C, 10 °C, 25 °C, and 37 °C.
Batteries 09 00334 g003
Figure 4. Maximum temperature and temperature difference in the battery module of different schemes under 2C discharge rate and 37 °C ambient temperature.
Batteries 09 00334 g004
Figure 5. Battery module with different numbers 6, 8, 12 and 14 (ad) of FHPs in Scheme 3.
Batteries 09 00334 g005
Figure 6. Maximum battery temperatures (a,c,e,g) and temperature differences (b,d,f,h) in Scheme 3 versus convective heat transfer coefficient under a 2C discharge rate, different numbers of FHPs and different ambient temperatures of −5 °C (a,b), 10 °C (c,d), 25 °C (e,f), and 37 °C (g,h).
Batteries 09 00334 g006aBatteries 09 00334 g006b
Figure 7. Temperature fields of the battery module with different FHP numbers: 6 (a), 8 (b), 12 (c) and 14 (d) under a 2C discharge rate and 37 °C ambient temperature.
Batteries 09 00334 g007
Figure 8. History curves of maximum temperatures (a) and temperature differences (b) under the conditions of 2C discharge rate, 37 °C ambient temperature, 0.1 m/s velocity and different coolant temperatures of 10 °C, 13 °C, 15 °C, 17 °C, 20 °C, 22 °C, 25 °C, 30 °C, 33 °C and 37 °C, and peak maximum temperature and maximum temperature difference versus coolant temperature (c).
Batteries 09 00334 g008
Figure 9. History curves of maximum temperatures (a) and temperature differences (b) under the conditions of 2C discharge rate, 37 °C ambient temperature, 0.1 m/s velocity and different cooling pipe numbers of 0, 2, 4, 6, 8, 10, and 12, and peak maximum temperature and maximum temperature difference versus cooling pipe number (c).
Batteries 09 00334 g009
Figure 10. Four cases based on different coolant flow directions of Scheme 4 under a discharge rate of 2C, ambient temperature of 37 °C and coolant flow rate of 0.1 m/s, (a) Case 1, eight cooling pipes are a parallel flow; (b) Case 2, four cooling pipes on one side as inlets while four are on the other side as outlets; (c) Case 3, four cooling pipes on one side as counter flow while the remaining in the direction on the other side are consistent; (d) Case 4, eight cooling pipes as counter flow.
Batteries 09 00334 g010
Figure 11. Maximum battery temperature and temperature difference of Scheme 4 in four cases of coolant flow direction, as shown in Figure 10.
Batteries 09 00334 g011
Figure 12. Temperature fields of the battery module in the original scheme (A3B4C2) (a) and A1B4C4 (b) under a 2C discharge rate and 37 °C ambient temperature.
Batteries 09 00334 g012
Table 1. Comparison of cooling methods of the four schemes.
Design SchemesCooling Methods
Scheme 1Only 7 CPCMs
Scheme 27 CPCMs and 12 ATDPs
Scheme 37 CPCMs and 12 FHPs
Scheme 47 CPCMs, 12 FHPs, and liquid cooling
Table 2. Thermophysical properties of components in the battery module.
MaterialsDensity
(kg/m3)
Specific Heat Capacity
(J/(kg·K))
Thermal Conductivity
(W/(m·K))
Battery2300107218.5, 18.5, 1.5
Aluminum2719871202.4
Water998.241280.6
Heat pipe89783816000
CPCM100020001.2
Table 3. Values of factors at different levels for the orthogonal test.
LevelA (FHP Number)B (Coolant Temperature), °CC (Coolant Pipe Number)
16256
28308
3123310
4143712
Table 4. COMSOL simulation results of all tests in the orthogonal test scheme.
TestA
(FHP Number)
B
(Coolant Temperature)
C
(Coolant Pipe Number)
Tmax (°C)ΔT (°C)
1625637.985.50
2630839.114.24
36331040.093.21
46371243.173.36
5825837.605.98
6830641.635.89
78331240.354.13
88371045.154.58
912251034.293.97
1012301237.603.01
111233641.793.27
121237844.182.26
1314251233.483.62
1414301038.233.35
151433840.422.63
161437645.032.77
Table 5. Range analysis of the maximum temperature of the battery module.
Serial NumberA (FHP Number)B (Coolant Temperature)C (Coolant Pipe Number)e1e2
Mean value 140.0935.8441.6140.1940.29
Mean value 241.1839.1440.3339.8839.69
Mean value 339.4740.6639.4440.0939.85
Mean value 439.2944.3838.6539.8840.20
Range1.898.552.960.310.59
Table 6. Range analysis of the temperature difference of the battery module.
Serial NumberA (FHP Number)B (Coolant Temperature)C (Coolant Pipe Number)e1e2
Mean value 14.084.774.363.813.93
Mean value 25.154.123.783.933.78
Mean value 33.133.313.783.743.75
Mean value 43.093.323.6533.963.99
Range2.051.530.830.220.25
Table 7. Variance analysis uses the maximum temperature as the evaluation index.
FactorSum of Squares of DeviationsDegree of
Freedom
Ratio of FCritical Value of
F
Significance
A (FHP number)8.79314.274.76*
B (Coolant temperature)150.833245.054.76***
C (Coolant pipe number)19.31331.374.76**
Error1.236
Note: The number of stars labelled in the last column stands for the significance, whereas the “***” stands for the highest significance, the “**” stands for the moderate significance, and the “*” stands for the low significance.
Table 8. Variance analysis uses the temperature difference as the evaluation index.
FactorSum of Squares of DeviationsDegree of FreedomRatio of
F
Critical Value of
F
Significance
A (FHP number)11.30377.384.76***
B (Coolant temperature)6.31343.194.76**
C (Coolant pipe number)1.48310.144.76*
Error0.296
Note: The number of stars labelled in the last column stands for the significance, whereas the “***” stands for the highest significance, the “**” stands for the moderate significance, and the “*” stands for the low significance.
Table 9. Comparison of simulation results of the four schemes.
Design SchemesTmax (°C)ΔT (°C)
A4B1C433.483.62
A3B4C244.182.26
A1B4C443.173.36
Table 10. Average estimated value y ^ μ of indicators (maximum temperature and temperature difference) compared with optimal value.
ParameterEffect to TmaxEffect to ΔT
a ^ 1 0.080.22
b ^ 3 4.37−0.61
c ^ 3 −1.36−0.33
y ^ μ (Estimated)43.10 °C3.14 °C
A1B4C4 (Optimal)43.17 °C3.36 °C
Disclaimer/Publisher’s Note: The statements, opinions and data contained in all publications are solely those of the individual author(s) and contributor(s) and not of MDPI and/or the editor(s). MDPI and/or the editor(s) disclaim responsibility for any injury to people or property resulting from any ideas, methods, instructions or products referred to in the content.

