
Techno-Economic Analysis of Different Battery Cell Chemistries for the Passenger Vehicle Market

Institute of Vehicle Concepts, German Aerospace Center (DLR), Wankelstraße 5, 70563 Stuttgart, Germany
*
Author to whom correspondence should be addressed.
Batteries 2023, 9(7), 379; https://doi.org/10.3390/batteries9070379
Submission received: 16 May 2023
/
Revised: 28 June 2023
/
Accepted: 13 July 2023
/
Published: 15 July 2023
Abstract
:The introduction of battery electric vehicles on the global market has triggered a sustained upheaval in the automotive industry. In this process, the new properties of a battery-electric powertrain lead to a different set of central requirements, such as increasing the range, lifetime or the fast-charging capability of the vehicle battery. This paper develops a bottom-up systematic model to assess the current and future impact of different battery technologies on vehicle costs. For this purpose, it summarises the scientific findings of automotive battery cell chemistries and, flanked by novel expert interviews and teardown data, derives key values for them. Based on the data obtained, modelling is carried out to demonstrate the technical and economic suitability of the identified cell chemistries and their impact on the range and total cost of electric vehicles. Lithium iron phosphate batteries appear to be able to achieve a price saving of up to 21% in the small vehicle segment compared to nickel-rich cell chemistries, provided that customers are prepared to accept a reduced range. At the same time, further efficiency improvements of the powertrain lead us to expect that, in combination with future high-energy cells, ranges of more than 800 km can be achieved even in the mid-size vehicle segment. It turns out that depending on whether the focus of the vehicle is on cost, range or performance, different battery technologies are likely to be used in the future.
1. Introduction
The automotive industry is currently facing the challenges of the trend towards electromobility [1]. In recent decades, the internal combustion engine held a monopoly position as a vehicle drive. This was due, among other things, to the high energy density and global availability of liquid fuel, as well as the technical reliability of the drive and the cost-effective use by end customers [2]. Electrification of the powertrain has increased significantly in automobiles in recent years. The reasons for this are ecological and societal developments and the strict regulations that accompany them [1]. The developments result from the major disadvantage of vehicles with internal combustion engines (ICEVs). These produce local emissions and carbon dioxide. Carbon dioxide is one of the main greenhouse gases and thus has a major impact on climate change [2]. As a result, the European Union has imposed regulatory requirements on vehicle manufacturers (original equipment manufacturers, OEMs) with regard to CO2 fleet limits, which has led to an increase in powertrain electrification [3].
The launch of battery electric vehicles (BEVs) on the global market has triggered a sustained change in the automotive industry. On the one hand, the new properties of a battery-electric powertrain lead to new central requirements, such as increasing the vehicle’s range or the fast-charging capability of its battery [4]. On the other hand, electric powertrain components are not yet optimised in terms of technical and economic aspects, which leads to a change in the cost structure of BEVs compared to ICEVs.
Within a battery electric drivetrain the battery itself is primarily responsible for the central requirements of the vehicle and also accounts for a significant proportion of the overall vehicle costs [5]. In order not to lose one of the vehicle’s most important sources of value creation, some traditional car manufacturers are now developing their own battery cells [6,7,8], while new market players already trying to rethink the entire battery design by integrating the cells directly to the pack or the vehicle chassis [9] and other manufacturers run the risk of becoming dependent on the large cell manufacturers as buyers of battery cells. However, all OEMs and battery suppliers are equally dependent on the electrochemical properties of the various cell types. Since the market entry of the first rechargeable lithium ion cell in 1991 [10], numerous different material combinations for the battery’s anode and cathode have been developed. Currently, the most common cell chemistries in the automotive market are lithium nickel manganese cobalt oxides (NMC) in various composition ratios, lithium nickel cobalt aluminum oxides (NCA) and lithium iron phosphate (LFP). These differ greatly in key areas such as energy density, lifetime and cost. Therefore, various OEMs are already planning to optionally use different cell chemistries for the same vehicle model in the future, either to save costs or to increase the range [11,12].
To understand the complexity of the market and to identify possible application areas for different cell chemistries, this work deals with current and future developments of automotive traction batteries. In order to work out the differences between the various cell chemistries, an intensive literature review was first carried out. This was verified by expert interviews, teardown analyses and a comparison to the current battery strategies of the OEMs leading to technology portfolios for the different cell chemistries with their most important key performance indicators (KPIs). Based on these derived indicators a model was developed to identify the impact of using different battery chemistries and technologies on passenger cars.
The model investigates the influence of vehicle-specific parameters, such as vehicle weight, aerodynamics and efficiency of the powertrain components on the overall energy consumption and range of a vehicle. In addition to the simulated energy consumption to determine the resulting vehicle range when using different cell technologies, the vehicle model also contains a bottom-up cost calculation to be able to compare the different technologies techno-economically. Future developments of the KPIs of the battery technologies can be continuously adjusted and provide information about the influence on costs, energy consumption and range. This allows the model to show the strengths and weaknesses of the individual battery technologies at the overall vehicle level. It also points out the potential that lies in future developments within the battery, but also within the components of the entire vehicle.
This paper develops a bottom-up systematic model to assess the current and future impact of different battery technologies on vehicle costs. While current scientific literature mainly focuses on specific cell chemistries, a mix of cell chemistries and battery technologies can be expected in the future passenger car market. With the development of our vehicle model we want to evaluate which cell chemistries can practically be used for future battery electric vehicles. Therefore, key technical indicators were defined as input variables to the model based on an intensive literature review combined with novel expert interviews and yet unpublished teardown data for many different cell chemistries and technologies. Based on the newly determined performance indicators for different cell chemistries and our bottom-up vehicle model, we are now able to estimate the use of different cell chemistries within a vehicle segment. Furthermore, the newly gathered insights on chemistry, vehicle range and energy consumption are contextualized and evaluated with the current strategies of the major vehicle manufacturers. The paper thus bridges the gap between scientific theory and technological implementation. Furthermore, this work serves as a basis for making predictions about the future value creation potential and raw material requirements of different cell chemistries in further work.
2. Materials and Methods
In order to provide a comprehensive overview of all current and future cell chemistries and to obtain meaningful data on the most important KPIs of the cell chemistries to be investigated, a database was created as part of this work. Based on different technical literature, conference presentations and publications of recent years, we analysed the most important cell chemistries currently used in battery electric vehicles and the most promising for future vehicles. In the literature search, we focused on the most recent literature containing relevant information for the European traction battery market. For this purpose, existing scientific databases were manually searched, as well as statements and announcements from vehicle and battery manufacturers collected. Table 1 and Table 2 show a summary of the extracted data with the linked sources.
The literature review was followed by four expert interviews. Due to the market proximity of the experts (from battery manufacturing, consulting and research), the interviews serve as the basis for the data and for validating existing data. The experts were also asked for their assessments of possible market launches of the technology and the associated state of development. The questionnaire is presented in Appendix A. In addition, experts close to the market were interviewed about the future price development of various cell chemicals. The experts’ statements are summarised and anonymised in this paper.
The analysis was rounded off with teardown data from the A2Mac1 battery reports [13], in which the cell chemistry of 14 series production vehicles from the European market were analysed and described in detail.
There are a number of different materials for the positive and negative electrodes that could be used in a battery for electric vehicles. The technological limits as well as the advantages and disadvantages of the respective active materials allow a number of possible combinations. In the end, a compromise of the requirements for battery systems must be found to enable their use in a BEV. The performance parameters worked out in this paper were taken from batteries designed for use in a passenger vehicles. Cost data refers primarily to the costs of the battery/vehicle in Germany, but also accounts for the cost data collected from other European Union members. For other countries, vehicle, battery and component costs may differ as shown in [14].
2.1. KPIs of Current Batteries Based on Literature Reviews, Tear-Down Reports and Expert Interviews
NMC batteries (LiNixMnyCozO2) are one of the most successful Li-ion systems [10]. Currently, the most popular NMC batteries on the market are NMC-111, NMC-532, and NMC-622 [5]. The number combination indicates the quantity ratio of nickel, manganese and cobalt in the cathode. In the case of NMC-811, this would be 80% nickel, 10% manganese and 10% cobalt. NMC batteries have a nominal voltage of 3.6–3.7 V and can be designed for high specific energy or high power. The decisive factor is the combination of nickel and manganese. An increased nickel content is responsible for a higher energy density, since nickel is able to hold more lithium ions. NMC-111 cells, for example, have a typical gravimetric energy density of 140–190 Wh/kg [15,16,17,18]. NMC-532 are slightly above this at 220–250 Wh/kg [13,17,19], while the NMC-622 cell chemistry, that is currently used in many vehicles such as the VW ID.3, Mercedes EQC and Renault Zoe [13] is at energy densities of 255–290 Wh/kg [13,15,17,20]. The latest BEVs are already using NMC-811 batteries [21] which promise an even higher energy density of 244–300 Wh/kg [13,15,17,19,22,23,24]. However, this also results in a shorter life cycle, since nickel is more reactive to the electrolyte [25]. Manganese forms a spinel structure that stabilizes the overall system. This results in a low internal resistance, which leads to higher performance [26]. In the future, nickel-rich electrodes are likely to be used increasingly, which will lead to a reduction in the cobalt content, among other things. Due to the high cost of cobalt, batteries could thus be produced more cost-effectively in the future. This results in a cost difference between NMC-532 battery cells, which according to the experts interviewed are around 110–130 EUR/kWh, and NMC-811 cells is up to 30 EUR/kWh.
Compared with other current cell chemistries, NMC batteries currently offer the best compromise between cost on the one hand and high gravimetric and volumetric energy density on the other [25]. As a result, NMC batteries are currently used in lots of battery electric vehicles such as the VW ID.3, the Renault Zoe, the Hyundai Ioniq 5, the Peugeot 208e and the Mercedes EQS and will probably continue to dominate the market in the future [13].
As one of the main drivers of electrification, Tesla, together with Panasonic, has brought the NCA battery to mass production for battery electric vehicles [26]. The cathode of the NCA battery consists of the eponymous lithium nickel cobalt aluminium oxide (LiNixCoyAlzO2). The currently most common NCA batteries consist of 84% nickel, 12% cobalt and 4% aluminum and, like NMC batteries, belong to the cathode materials with a layered structure [27]. An NCA battery delivers a high discharge capacity of 200 mAh/g, which is the highest capacity among the currently mature lithium ion battery (LIB) [26]. In addition to the increased capacity, NCA batteries, due to the nominal voltage of 3.7 V, also bring a high energy density of 200–322 Wh/kg [5,17,28,29,30] as well as a high power density [31]. Furthermore, they have good cycling stability even at elevated temperatures of up to 60 C [26]. This can be justified by the added aluminum, which strengthens the structure of the cathode. NCA batteries also have a long life span of 1000–1500 life cycles [17,28]. Despite the low cobalt content, NCA batteries are comparably expensive to manufacture as NMC batteries [25]. One disadvantage is the safety of the battery, so that the battery needs additional special safety monitoring measures for use in electric vehicles [25]. NCA batteries have a strong tendency to form oxygen in an exothermic reaction at elevated temperature, which causes the NCA battery to further increase in temperature and begin to burn in the event of overheating. This results in what is known as “thermal runaway” [31]. At elevated temperatures, additional undesirable reactions occur between NCA particles and non-aqueous electrolytes. These reactions produce chemicals that deposit on the separator and block the path of the lithium ions, which leads to a loss of capacity and thus to rapid ageing of the battery. To reduce these known drawbacks of NCA as a cathode material, researchers are focusing on combining NCA with other cathode materials and modifying the surface of the NCA particles [32].
LFP batteries are a design of lithium-ion batteries in which the cathode is made of lithium iron phosphate (LiFePO4). Lithium can be stably intercalated in the basic iron phosphate framework [33]. Iron phosphate is a cost-effective and environmentally friendly material [28]. Resulting in cell costs of 54–110 EUR/kWh according to the experts interviewed. The rated voltage of LFP batteries is 3.3 V, which is lower than that of NMC and NCA batteries [33]. Due to their lower nominal voltage, LFP batteries have a comparatively low energy density on cell level of 90–190 Wh/kg [13,16,17,22,28,29,34,35,36] and lose power quickly at low temperatures [37]. Characteristic of LFP batteries is a high structural and cyclic stability. This results in high safety and a long service life of 2000–4000 life cycles [10,22,28,38]. Even in the event of overcharging or undercharging, this has only a minor effect on the life cycle of the LFP battery [37]. In addition, since the material does not decompose thermally, it is difficult to ignite and is therefore characterized by excellent thermal stability [26]. LFP cathodes support high voltages and correspondingly high currents, making them suitable for use in fast-charging LIBs [33]. The sometimes serious drop in performance at low temperatures and the high self-discharge are issues on which intensive research is being conducted. These effects can be mitigated by using an intelligent battery management system and high-quality cells, but this also increases the cost of the battery pack [26]. One way to increase energy density is to increase the operating voltage by replacing all or part of the iron phosphate with other metals, for example the metal manganese. So-called LMFP batteries (lithium manganese iron phosphate) have a higher voltage potential of up to 4.1 V, which results in an increase in energy density of approx. 15% [34].
According to the experts interviewed, LFP batteries can be more easily used in a “cell-to-pack” technology due to their high intrinsic safety, thus partially making up for the disadvantage of lower energy density at the cell level compared to other lithium-ion batteries at the system level. LFP cells are well suited for large format cells like blade battery OF BYD due to good thermal stability [34,36]. In the mobility sector, LFP batteries have so far mainly been used in buses and trucks due to its low energy density. However, Tesla and other manufacturers such as BYD have been developing this technology for a number of years and are now able to produce cars with a better overall energy density at the pack level, so that a useful vehicle range can be achieved now also with LFP battery cells [26]. As a result, LFP batteries are currently used in some production vehicles the BYD Tang, the Tesla Model 3 Standard range and the MG 4 [13].
The cathode of LMO batteries (LiMn2O4) is made of lithium manganese oxide and is known for its spinel structure. The spinel structure provides LMO cathodes with high thermal stability and improved safety compared to other LIBs. In addition, the three-dimensional architecture improves ion flow at the electrode, resulting in lower internal resistance and high discharge rate [5]. LMO cathodes are among the low-cost cathodes because they contain neither cobalt nor nickel [26], costing 70–130 EUR/kWh according to the experts interviewed. Disadvantages include low capacity and the associated low energy density. LMO batteries do not have a high cycle and calendar life because increased operating temperature leads to dissolution of the manganese by the electrolyte and thus to a high loss of capacity [5]. The industry is focusing on combinations of LMO cathodes with other cathode materials to increase the cycle life and specific energy of a LMO battery. LMO-NMC combinations have already been successfully used in some vehicles such as the BMW i3 or the VW e-Golf [5]. However, it can be assumed that, due to its low energy density of 100–150 Wh/kg [17,28,30,39], the market share will decrease in the coming years in favor of NMC batteries and LFP batteries [26].
While the cathode of a battery has a major influence on the technical and economic parameters and is therefore usually the focus of current and future developments, the performance of a battery cannot only be increased by optimising the cathode. Up to now, anodes have mainly been made of synthetic or natural graphite. However, synthetic graphite is gaining more and more market share due to its higher quality and falling costs. Natural graphite is cheaper, but is classified as critical by the European Union and the USA due to the emissions that arise during its production or mining [5]. A new trend is the modification of the anode by incorporating silicon into the graphite matrix. Silicon is able to hold significantly more lithium ions, which leads to an increase in the energy capacity of a battery. The biggest challenge in using silicon is the volume expansion that occurs when lithium ions are transferred into the silicon structure [40]. This can lead to high mechanical stress and thus damage to the battery. According to the current state of the art, silicon amounts of 10–20% are possible in the anode, and even these quantities generate great progress in terms of battery capacity, so that a gradual increase of the Si content in the graphite anode is expected [26].
In addition to graphite as anode material, lithium titanate is also used. The lithium titanate electrode has a much higher effective surface compared to graphite, which is why very high charge and discharge currents are possible [41]. However, these cells only offer a low cell voltage and a resulting low energy density, which is why it can be assumed that they will be used in high-power applications rather than in the high-energy application of a BEV [5].
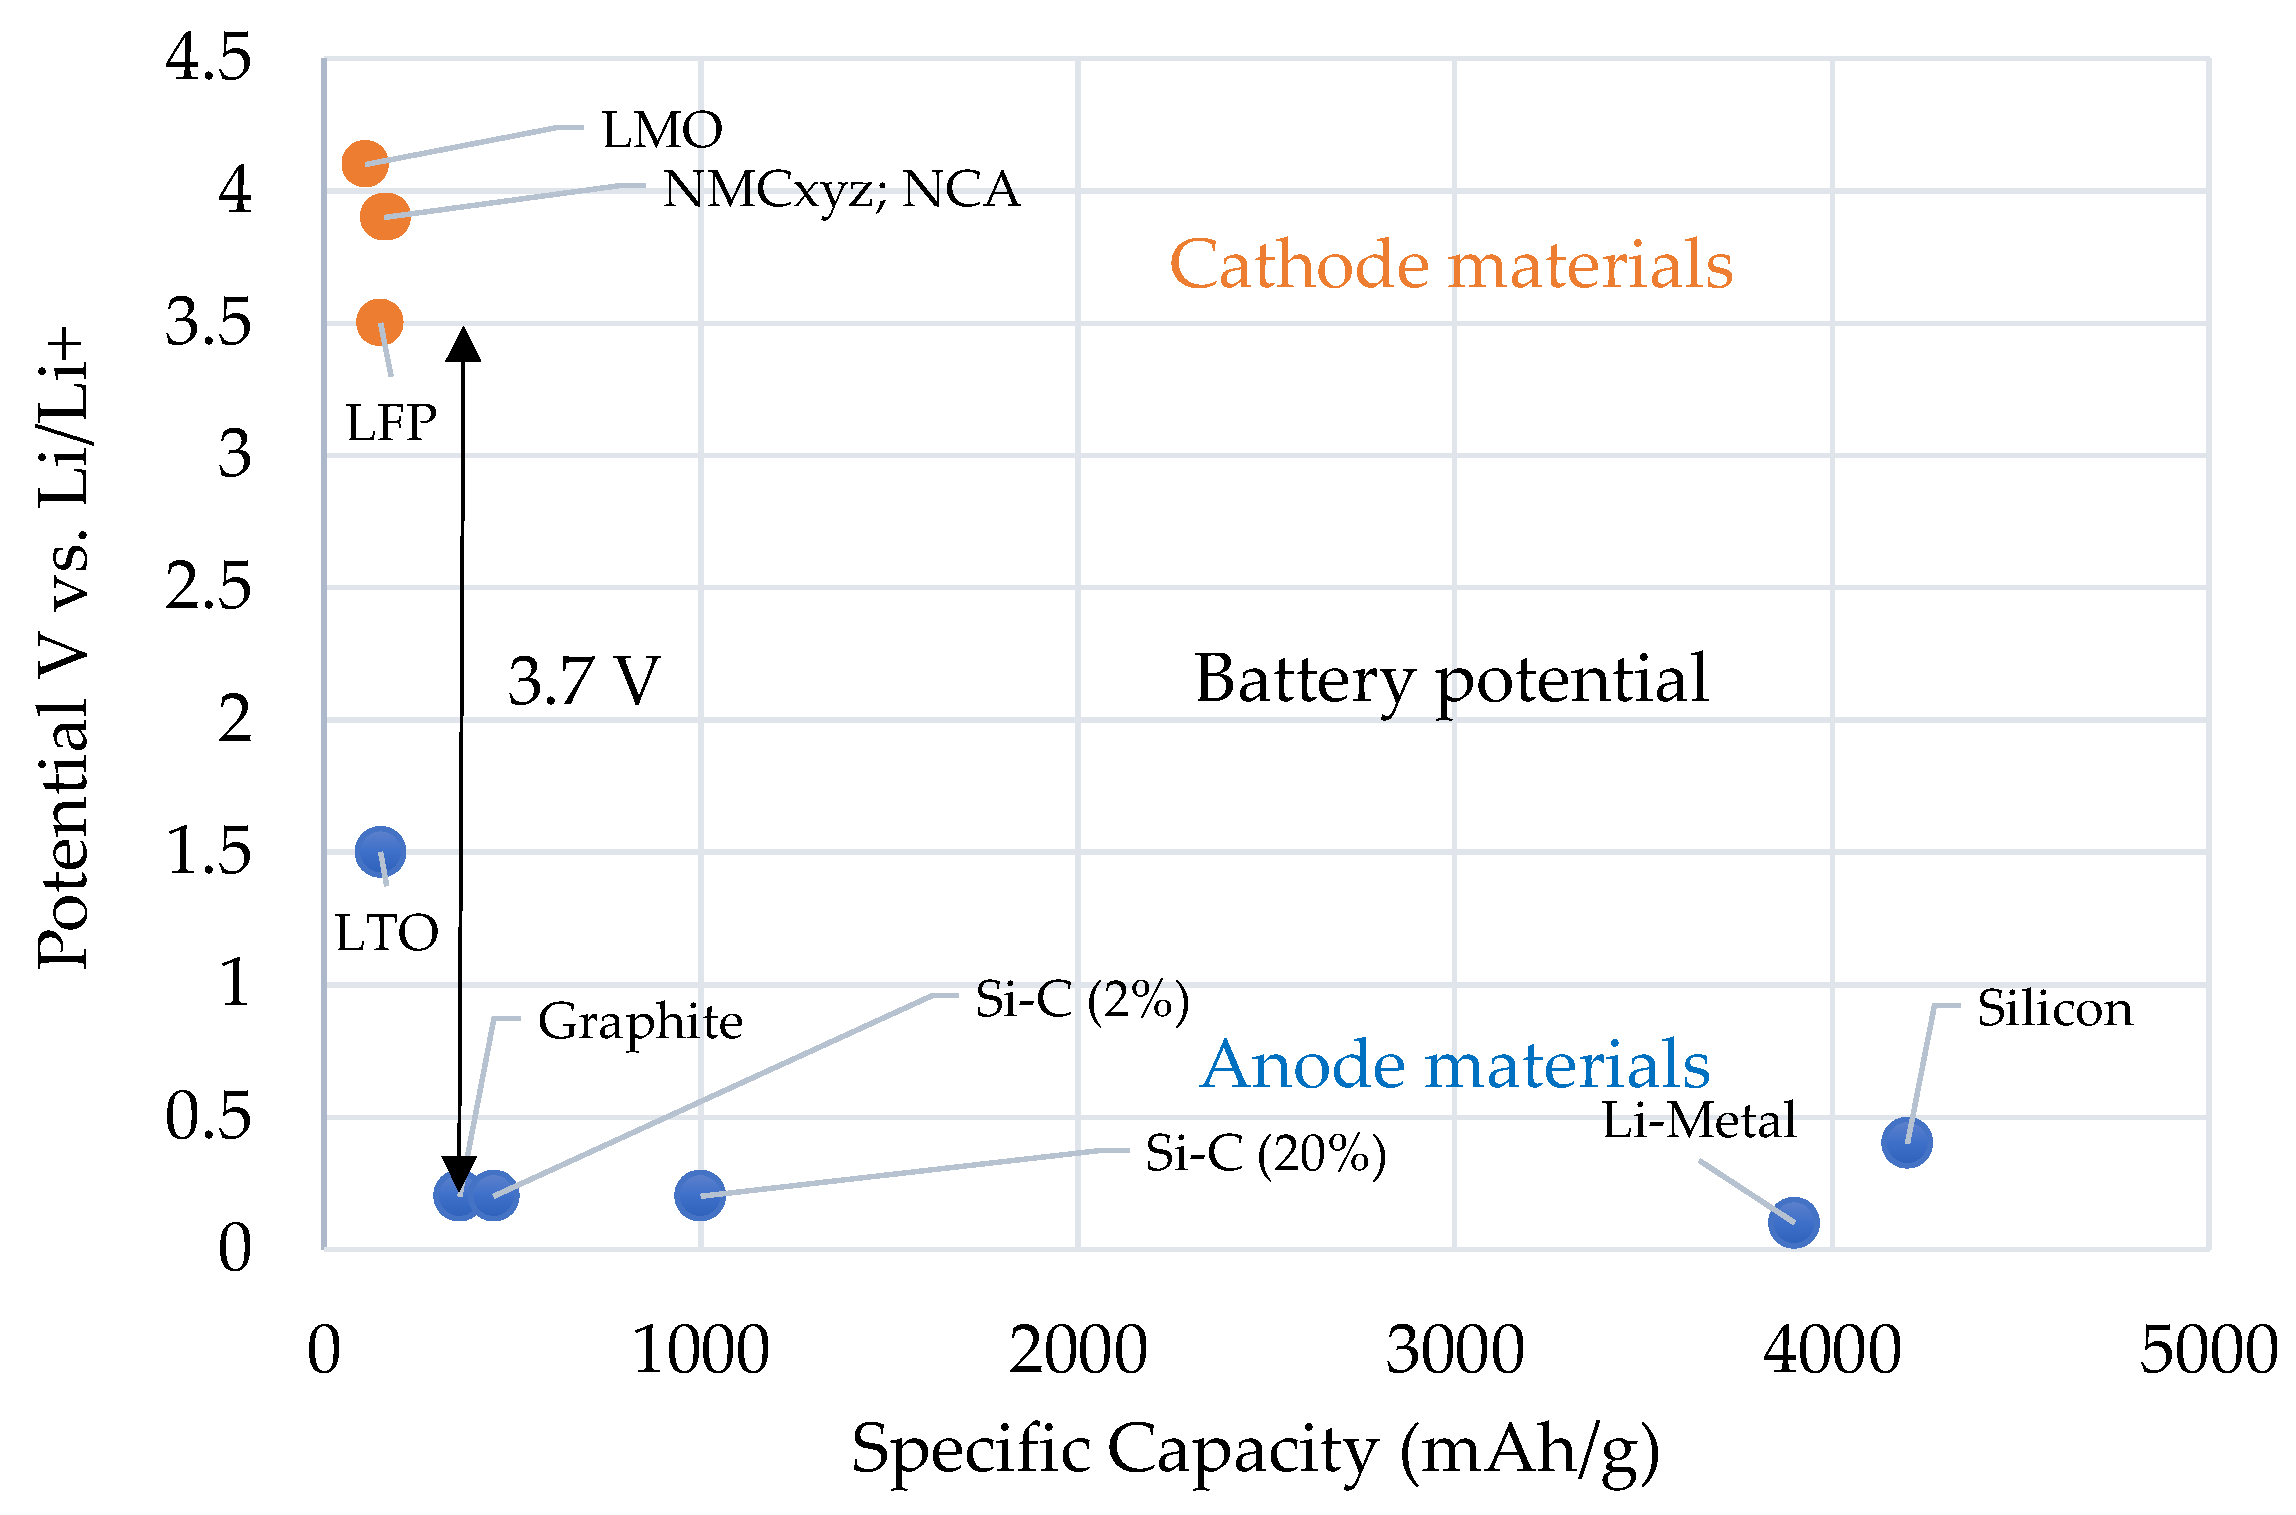
High future potential is expected for solid lithium-metal anodes [34]. The application of such anodes would result in a strong increase in energy density at the cell level, as the theoretical capacity of a metallic lithium anode is 3860 mAh/g. For comparison, graphite has a capacity of 360 mAh/g [34]. But metallic lithium generally tends to form dendrites, which could grow to the cathode and can thus cause an electrical short circuit. For this reason, the use of a suitable solid electrolyte is indispensable [26]. The development of future battery chemistries is described in more detail in Section 2.2.
Figure 1 shows a comparison of the most important electrode potentials and specific capacities of different active materials analysed within this work. The graph illustrates why, for example, lithium titanate is hardly used in battery electric passenger cars and that lithium metal anodes and silicon anodes have great potential for future developments due to their high specific capacity.
The KPIs described for the different battery types are shown again in detail and with the corresponding sources in Table 1. The uncertainty of this market can be clearly seen from the sometimes very large range of the KPIs. We thus listed all the identified sources in the table and then also reported the input variable to the model as “model assumption”.

Table 1.
Overview of the key performance indicators (KPIs) of current cell chemistries considered within this paper.
Table 1.
Overview of the key performance indicators (KPIs) of current cell chemistries considered within this paper.
| KPI | Source | NMC-111 | NMC-532 | NMC-622 | NMC-811 | LFP | NCA |
|---|---|---|---|---|---|---|---|
| Gravimetric Energy Density Wh/kg | Literature | 140–170 [15] | 235–250 [19] | 280 [15] | 270 [22] | 175 [22] | 200–250 [28] |
| 193 [16] | 250 [17] | 260–290 [20] | 300 [15] | 90–140 [28] | 322 [29] | ||
| 170 [17] | 219–227 [13] | 260 [17] | 300 [23] | 160–180 [34] | 200–260 [30] | ||
| 174 [18] | 255–270 [13] | 244 [24] | 130–190 [29] | 236–260 [5] | |||
| 270–300 [19] | 168 [16] | 260–280 [17] | |||||
| 280 [17] | 185 [35] | 250–280 [44] | |||||
| 265–290 [44] | 150 [17] | ||||||
| 252 [13] | 166 [36] | ||||||
| 160–200 [44] | |||||||
| 165 [13] | |||||||
| Experts | 150–190 | 170–220 | 200–280 | 240–340 | 190 | 240–340 | |
| 150–180 | 180–220 | 220–260 | 260–280 | 160–180 | 260–280 | ||
| Model assumption | 180 | 220 | 260 | 280 | 185 | 280 | |
| Volumetric Energy Density Wh/l | Literature | 230–410 [15] | 530–570 [19] | 650 [15] | 740 [22] | 380 [22] | 673–683 [26] |
| 567 [16] | 445–453 [13] | 680–800 [20] | 700 [15] | 457 [16] | 630–670 [45] | ||
| 490 [46] | 649–693 [13] | 680 [23] | 430 [35] | 700–850 [20] | |||
| 352 [18] | 660–700 [19] | 395 [46] | 866 [46] | ||||
| 737 [46] | 448 [36] | 550 [44] | |||||
| 735 [44] | 449 [38] | ||||||
| 532 [13] | 390 [44] | ||||||
| 362 [13] | |||||||
| Experts | 300–450 | - | - | 550–740 | - | - | |
| 350–400 | 450–500 | 550–650 | 650–700 | 320–360 | 700–750 | ||
| Model assumption | 400 | 500 | 650 | 700 | 430 | 750 | |
| Lifecycles | Literature | 1750 [19] | 1250 [23] | 3500 [22] | 1000–1500 [28] | ||
| 1750 [19] | 2000 [28] | 1000 [17] | |||||
| 1500 [44] | 4000 [38] | 1000 [44] | |||||
| Experts | 1800 | 1500 | 1500 | 1200 | 3500 | 800–1600 | |
| 1000 | 1000 | 1000 | 1000 | 3000 | 800–1000 | ||
| Model assumption | 1500 | 1200 | 1200 | 1000 | 3500 | 1000 | |
| Cost EUR/kWh | Literature | 75–85 [24] | 80–90 [24] | 90–100 [24] | 90 [22] | 65–75 [24] | |
| 108 [44] | 112 [44] | 90 [47] | |||||
| 102 [44] | |||||||
| Experts | 145 | 130 | 100 | 90 | 70–110 | 80–130 | |
| 117–135 | 108–126 | 90–108 | 81–90 | 54–81 | 72–90 | ||
| Model assumption | 145 | 130 | 100 | 90 | 80 | 90 |
2.2. KPIs of Future Batteries Based on Literature Reviews and Expert Interviews
In order to be able to estimate how the passenger car market could develop in the future, the possible development of battery cells was also analysed in the course of the work. This chapter hence analyses the evolution of the currently established cell chemistries NMC, NCA and LFP as well as the potential future KPIs of the solid-state battery, sodium-ion battery and lithium-sulphur battery. As part of this work, we have analysed the potential maturity levels: technology (TRL) and market readiness level (MRL) based on [48,49] for the different future battery types. We then focused on the KPIs that could be achieved within our reference year 2030.
NMC batteries are currently the most successful active cathode material and are accordingly mature and in mass production. Further developments such as NMC-811 are increasingly penetrating the market in the near future and will in all likelihood become established [50]. The term NMC2030 is used here and in the further course of the work for the NMC battery in the year 2030 and includes all development steps of the next few years. According to the experts interviewed, these will mainly take place on the anode side and will be accompanied by an increase in the silicon content.
As described above, the energy density of LFP batteries can be increased by up to 15% through the supplementation of manganese, as this raises the cell voltage to up to 4.1 V [34]. In 2022 CATL announced to start mass production of a LMFP battery called M3P battery. They currently state that the newly developed cell will be having an energy density of 210 kWh/kg [51].
One of the current focus of research and development for battery systems in electric cars is solid-state batteries. In solid-state batteries, the usually liquid organic electrolyte of a classical battery is replaced by an ion-conducting solid. They therefore have no liquid components and the use of a separator, as used in liquid electrodes, becomes unnecessary. A distinction can be made between three categories of solid electrolytes. These are polymeric, hybrid and ceramic solid electrolytes [34]. The focus of electromobility is on sulfides and garnet-like oxides [5]. Depending on the parameters to be achieved, solid electrolytes can be combined with all established electrode materials. The major advantage of using solid electrolytes in batteries is that lithium metal anodes can be used. This would allow a significant increase in energy density at the cell level, as the theoretical capacity of a metallic lithium anode is 3860 mAh/g. For comparison, graphite has a capacity of 360 mAh/g [34]. Metallic lithium generally tends to form dendrites, which could grow to the cathode and thus cause an electrical short circuit. For this reason, the use of a suitable solid electrolyte is essential to prevent dendrite growth [26]. Solid state batteries are non-flammable, have a long life span, and can usually deliver normal performance even under high temperature fluctuations [34]. The choice of electrolyte usually requires trade-offs between cycle life, operating temperature, safety, etc. Disadvantages of sulfide and oxide electrolytes include lower ionic conductivity, higher internal resistance, and consequently lower current. Especially the transition of the solid-solid interfaces causes problems, because high currents can only be transferred poorly. In addition, high current densities lead to volume changes, which can damage the cell [34]. Currently, solid state batteries are more expensive compared to batteries with liquid electrolyte. The main reason for this is the still early development status as well as economies of scale due to the low production capacity [26]. Solid state batteries are considered promising for further development of next generation energy storage. The broad market introduction is estimated by experts to be between 2025 and 2030. Mercedes-Benz and Stellantis announced plans to work with U.S. company Factorial Energy to develop a solid-state battery for electric cars and launch it in 2027 [52]. Volkswagen AG is also going down this path and took a stake in QuantumScape Corporation, which is also working on solid-state lithium metal batteries. QuantumScape’s solid-state battery is expected to achieve up to 80% greater range compared to today’s lithium-ion batteries and enable 80% capacity on a 15-min charge. The solid-state battery will initially be used in the premium segment. Volkswagen expects a broad market launch between 2025 and 2030 [53]. Other OEMs such as BMW and Ford are investing together in the solid-state battery manufacturer Solid Power [54]. There also needs to be a full build-up of processes and supply structures before there will be a broad market introduction of the solid state battery [34]. The experts interviewed are more pessimistic about an early market launch than the OEM announcements. In their view, too many technical details and cost-specific aspects are still unresolved, which is why they assume only a very small market share in 2030.
The sodium-ion battery (SIB) is a potential low-cost alternative to the lithium-ion battery because of the wide availability of sodium [55]. The NIB works according to the same principle as the LIB. With the difference that sodium ions are used for charge exchange instead of lithium ions. The large ionic radius results in hindered movement of a sodium ion compared to a lithium ion within comparable electrolytes. The sodium ions can also damage the graphite structure at the anode [56]. For the cathode material, CATL used prussian white for the SIBs they presented in 2021, and a porous carbon material for the anode. The selection of these materials ensured fast movement and good storage of sodium ions in the electrodes. As a result, the sodium-ion battery should be chargeable to 80% within 15 min [57]. A NIB has the advantage of being completely lithium-free and the copper current collector can be made from aluminum in the future. Another advantage is that the cells can be produced on the same production lines as LIBs [56]. They are also hardly sensitive to cold and retain 90% of their output at temperatures of minus 20 degrees Celsius [58]. Furthermore, SIBs tend to be less flammable than LFP batteries, for example, which are already regarded as particularly robust [59]. Because of their high temperature resistance, sodium-ion cells can be packed tightly and require less cooling [58]. This enables the use of sodium-ion batteries for cell-to-pack battery systems [57]. Currently, research is concentrating on optimising the anode and developing new electrolytes [60]. CATL and AMTE state the energy density of their own sodium-ion battery to be 160 Wh/kg [59]. The next generation of SIBs from CATL should enable energy densities of 200 Wh/kg [57]. The volumetric energy density ranges at 350 Wh/l [61]. Increasing life cycles was the biggest focus in the development of SIBs a few years ago [56]. By selecting appropriate materials, CATL states to achieve 1000 life cycles with their SIB today [57]. According to the interviewed experts, this trend will continue and in 2030 the battery should survive 2500 charging cycles. Several sources indicate a cost advantage of the sodium-ion battery over conventional lithium-ion batteries of 15–40%. CATL quotes a price of 35 USD/kWh once the sodium-ion battery enters mass production [57].
To meet the future demand for energy storage systems with high energy densities and low costs, researchers are also focusing on the lithium-sulphur battery (Li-S battery) [5]. As with the solid-state battery, metallic lithium is used as the anode. Elemental sulphur is used as the cathode. The theoretically very high energy density of 2600 Wh/kg is considered one of the main reasons why a lot of research work is invested in this cell chemistry [56]. Current prototypes achieve gravimetric energy densities of 350–400 Wh/kg [62]. The greatest challenge in the development of Li-S batteries lies in overcoming the discrepancy between theoretical and practical KPIs. Above all, the volumetric energy density of 400 Wh/L and the cycle stability of 100 cycles are not sufficient to enable use in electromobility [62]. The search for a suitable organic electrolyte to improve the electrochemical performance is in the foreground, as well as possibilities for the reduction of surplus material. In addition, lithium uptake at the sulphur cathode causes volume expansion, which leads to structural collapse of the electrode. Efforts to improve stability have so far only been achieved at the expense of lifetime and energy density. The listed points are only a part of the future challenges to bring Li-S batteries to market maturity.
The KPIs described for the different potential future battery types are shown again in detail and with the corresponding sources in Table 2. The uncertainty of this market can be clearly seen from the sometimes very large range of the KPIs. We thus listed all the identified sources in the table and then also reported the input variable to the model as “model assumption”.
Table 2.
Overview of the key performance indicators (KPIs) of potential future cell chemistries considered within this paper.
Table 2.
Overview of the key performance indicators (KPIs) of potential future cell chemistries considered within this paper.
| KPI | Source | NMC2030 | LFP2030/ LMFP2030 | Solid State Battery | Sodium-Ion Battery | Lithium-Sulfur Battery |
|---|---|---|---|---|---|---|
| Gravimetric energy density Wh/kg | Literature | 300–350 [34] | 200–250 [34] | 300–450 [44] | 150 [44] | 400 [34] |
| 300–370 [20] | 210 [51] | 400 [63] | 150–160 [59] | 500 [44] | ||
| 325 [64] | 400 [65] | 160 [61] | 590 [16] | |||
| 343 [16] | 400–420 [64] | 160–200 [57] | ||||
| 350 [17] | 433 [16] | |||||
| 330 [66] | ||||||
| Experts | 380 | 220 | 380 | 220 | 500 | |
| 300–360 | 350–500 | 160–200 | ||||
| Model assumption | 350 | 220 | 400 | 200 | 500 | |
| Volumetric energy density Wh/l | Literature | 750 [66] | 780 [65] | 190 [44] | 400 [34] | |
| 800–1000 [20] | 800 [44] | 350 [61] | 600 [44] | |||
| 1000 [34] | 800–1000 [34] | 931 [16] | ||||
| 1054 [16] | 900 [64] | |||||
| 1044 [46] | ||||||
| Experts | 950 | 900 | - | |||
| 800–1000 | >1000 | 360–500 | ||||
| Model assumption | 950 | 500 | 1000 | 350 | ||
| Life Cycles | Literature | 1500 [66] | 2500 [65] | 1000 [60] | 100 [34] | |
| 800–1000 [64] | 1000 [59] | |||||
| Experts | 1500 | 5000 | 300 | 2500 | 800 | |
| – | 400–800 | 3500 | ||||
| Model assumption | 1500 | 5000 | 500 | 3500 | ||
| Cost EUR/kWh | Literature | 70–100 [34] | 60 [61] | 500 [34] | ||
| 95 [14] | 24–33 [58] | |||||
| Experts | 70 | 50–75 | 120–180 | |||
| 70–90 | 50–70 | 61–82 | ||||
| Model assumption | 70 | 60 | 150 | 50 |
2.3. Techno-Economic Model
In order to enable a comparison of the battery technologies on the basis of the defined evaluation criteria of range and vehicle costs, a model is needed with the help of which the range of a vehicle can be calculated under the influence of the battery technology to be investigated. The calculated ranges of the vehicles can then be compared with each other and the potential of the technologies analysed. In order to determine the influence of the battery technologies under investigation on the total vehicle costs, the range model is combined with a cost model. This enables a techno-economic comparison of the different battery technologies. This allows conclusions to be drawn about the future market potential for battery electric vehicles.
In order to take into account the influence of the battery technology, a detailed modelling of the vehicle is required. This enables an investigation of the influence of different technologies on vehicles from different segments. For this purpose, in a first step, different vehicle models were built that are representative of the vehicle segments Small, Medium and Large. The vehicles are based on example vehicles from the respective vehicle segments. The Renault Zoe forms the basis for the S segment, the Volkswagen ID.3 for the M segment and the Mercedes EQS for the L segment. These example vehicles also serve as reference vehicles for the model. Since this work is not only about an evaluation of current technologies, but also an evaluation of future technologies, vehicle models representative of the year 2030 are also built. These are subject to the expected improvements in vehicle-specific parameters, such as the cw value through future aerodynamic adjustments, an improvement in the coefficient of friction through, for example, improved tyres or efficiency improvements of the components along the drive train. The improvements are derived from a comparison of the Mercedes EQS and the Mercedes EQXX and transferred to the representative vehicles for the year 2030. The data can be taken from Table 3.
Based on the technical data shown in the table, the energy consumption of the different vehicles within the Worldwide harmonized Light vehicles Test Procedure (WLTP) is calculated. Since the conversion of the energy carried in the form of electrical energy is lossy, the efficiencies of the e-motor, battery and power electronics must be considered. The efficiencies are considered not only during acceleration of the vehicle but also during recuperation. The efficiency of an electric drive consists of the efficiency of the battery , the power electronics and the electric motor and is referred to as in the following.
In addition to the efficiencies of the drive components described above, the efficiency of the transmission must be considered. The efficiencies of the drive components assumed within this work can be found in Table 3. If all influencing factors are considered, the correlation for the en-route energy consumption E can be represented as follows (based on [63]):
In this context, the term describes the rolling resistance based on the mass m and the rolling resistance coefficient of the vehicle as well as the gravity g and the pitch angle which is is set to zero, as the consumption and range calculation does not include a gradient.
The term describes the air resistance which is made up of the density of the air , the speed v and the vehicle-specific data, drag coefficient and vehicle frontal area A.
Furthermore, the term describes the acceleration resistance based on the vehicle mass m, the mass factor and the acceleration a.
The mass of the vehicle m depends on the particular cell chemistry used and its gravimetric energy density . It is assumed that the maximum possible battery quantity is installed depending on the available installation space for the battery pack and the different cell-to-pack (CtP) factors for the various vehicle classes. This then results in the mass of the vehicle according to the following equation:
The cell-to-pack factor results from the quotient of the battery capacity of the reference vehicle and its weight divided by the gravimetric energy density of the used cell chemistry used (analogous with volume reference). Depending on the different reference vehicles the gravimetric cell-to-pack factor ranges between 0.6–0.62. Based on [75], who gives a gravimetric energy density of 140 Wh/kg at pack level for the BYD Han, a CtP factor of 0.82 was determined for the cell-to-pack system architecture.
The battery technologies to be investigated are integrated into the existing installation space of the vehicle model and thus influence the vehicle weight and the battery capacity carried. Resulting in a different energy consumption and vehicle range regarding each battery chemistry. The range s as one key performance indicator is thus calculated as a function of the particular battery technology based on the capacity and the calculated consumption E according to the following formula:
The technical improvements in range that correlate with new battery technologies are usually offset by increased costs that delay or prevent a broad market introduction. For this reason, a cost analysis is carried out in addition to the range determination. In addition to the costs of the individual components, a bottom-up cost model is created that enables a cost comparison of the technologies used at the overall vehicle level. Vehicles from the segments small, medium and large as well as example vehicles for the year 2030 are considered. The costs for the entire vehicle are made up of the costs for the vehicle excluding the battery and the costs for the battery .
The costs for the vehicle consist of the costs for the “rest of vehicle” , the costs for the power electronics , the costs for the charger and the costs for the electric motor. The costs for the electric motor depend on the motor type and the power of the vehicle . The exact composition of the individual components is listed in Table 4. The contribution margin and the margins for the manufacturer and the dealer are also considered.
The costs for the battery result from the total battery capacity of the vehicle , the costs of the installed cell and the cell-to-pack cost ratio . This ratio is needed to simplify the bottom-up calculation in order to infer from the cell costs to the pack costs of a battery and is set to 1.34 according to recent evaluations by BloombergNEF [76]. The battery pack includes the thermal management, the housing for modules and pack, the battery management system and wiring.
In addition, the margins for the OEM and the dealer as well as the contribution margin are also considered when calculating the battery costs. The same margins are assumed for the battery production as for the vehicle costs. Subsequently, the current is also considered in order to conclude the sales price of the vehicle .
Table 4.
Relevant input data of the cost model.
| Component | S-Segment | M-Segment | L-Segment | Source |
|---|---|---|---|---|
| Battery pack | Depending on used cell chemistry | Table 1 and Table 2 | ||
| Charger | 381 EUR | [77] | ||
| Electric motor | PSM: 6.31 EUR/kW | |||
| ASM: 5.14 EUR/kW | [73] | |||
| SSM: 5.32 EUR/kW | ||||
| Power electronics | 323 EUR | 760 EUR | 1235 EUR | [77] |
| Rest of Vehicle | 7506 EUR | 13,687 EUR | 26,115 EUR | [77] |
| Contribution margin | 20% | 20% | 20% | [77] |
| OEM Margin | 5% | 10% | 15% | [77] |
| Dealer Margin | 15% | 15% | 15% | [77] |
3. Results
The presented model offers the possibility to evaluate different technologies with regard to their potentials by calculating and comparing the ranges of vehicles under the influence of the respective cell chemistries. This chapter describes the validation of the model. Furthermore, the results of the investigation of the influence of the battery technologies presented in Section 2.1 on the range and costs of a vehicle are presented. In addition, the influence of the overall efficiency of the powertrain of a BEV and the influence of an improvement of the cell-to-pack factor on the consumption and the range of a vehicle are examined.
3.1. Model Validation
Validation of the model is the basis for obtaining valid and reliable results when comparing two vehicles. The model is validated with regard to the three reference vehicles and their fuel consumption and range in the WLTP cycle as well as their list prices. The results of the model validation are shown in the following Table 5.
Deviations in the calculated energy consumption compared to the actual vehicle data may occur due to different efficiencies of the drive components in the reference vehicles. In order not to go beyond the scope of the model, the same efficiency levels of the drive components were assumed for all calculations (see Table 3). However, it can be assumed that the components of a Mercedes EQS have a higher efficiency than the components of a Renault Zoe. This could be the reason why the consumption of the EQS in the calculations is higher compared to the real energy consumption. Differences in range can partly be explained by the test procedure used. Whereas in this study the range is determined using the calculated energy consumption, the manufacturer determine the range in a modified form. After two WLTP cycles and two city cycles, a constant speed of 100 km/h is specified. This procedure has a positive effect on BEVs with high battery capacity, as the constant speed lasts longer for these vehicles and they consume less energy [79]. For this reason, the range calculated by the model is slightly below the value determined by the real test procedure. The deviations in the total vehicle costs can be explained by the fact that the costs of the various vehicle components are based on data in which average values are calculated for each component across the various segments. Even if the comparison between the model results and the real values shows slight deviations, the model does allow qualitative statements to be made about the different battery technologies within the different segments.
3.2. Comparison of Current Cell Chemistries
Figure 2 shows that also in the small vehicle segment long ranges of over 300 km are possible with high-nickel batteries compared to LFP batteries. The reason for this is the increased gravimetric and volumetric energy density that high-nickel batteries have. However NMC batteries are more expensive than LFP batteries, which is reflected in the total cost of a vehicle. The costs amount to about 22,000 EUR for a vehicle with LFP battery and a range of 223 km. A vehicle with NMC batteries costs about 26,800 EUR to 28,300 EUR with a range of 208 km (with NMC111 chemistry) and 360 km (with NMC811). Compared to the NMC721 chemistry that was used in the reference vehicle Renault Zoe it would be possible to reduce the price up to 21% if LFP batteries would be used. The range, which would then be about a third lower, could be compensated for by using cell-to-pack technology. If comparable cells such as the blade cells of the BYD Han were used for the vehicle, the range would only be reduced by 20%, under the defined boundary conditions, with a subsequent price reduction of more than 16%.
The same trend can be observed in the M and L segments and the results are shown in Figure A7 and Figure A8 in the Appendix B. With cell-to-pack technology, ranges of almost 400 km can be achieved in the M segment when using LFP cells. Without cell-to-pack technology, the vehicles would achieve around 16% less range. The NMC-811 battery as well as the NCA battery enable long ranges of more than 500 km, but increase the vehicle price to 48–50 thousand EUR. Vehicles with LFP batteries are about 20% less expensive. Due to an even longer wheelbase an increased battery volume can be build into a vehicle of the large segment resulting in possible ranges of nearly 640 km as realized with the Mercedes EQS. If LFP batteries are used, the range would drop to 400 km or 475 km with cell-to-pack technology.
3.3. Comparison of Future Cell Chemistries
If the potential vehicles and technologies of the year 2030 are considered and compared, then additional cell chemistries could become relevant to the market. The NMC2030 battery is representative of the next technological step of the NMC battery. A vehicle in the S segment equipped with this battery and with the efficiency technologies considered as shown in Table 3, could achieve a range of around 600 km as shown in Figure 3. Only vehicles with the solid-state battery would achieve similar ranges. For comparison, a current NMC-811 battery is also considered here. A vehicle in the S segment equipped with this battery would reach 450 km in 2030. This would be about 150 km less range than vehicles equipped with the NMC2030 battery, but still about 90 km more range than compared to current vehicles (see Figure 2). The reason for this is the lower assumed efficiency of the drive components and the associated lower energy consumption. With the solid-state battery, due to the higher assumed cell costs, the vehicle price would increase to around 41,000 EUR and thus cost around 14,000 EUR more than a vehicle with an NMC2030 battery. By using LFP or sodium-ion batteries, the price for a S-segment vehicle could be reduced to less than 22,000 EUR and less than 19,000 EUR, respectively, and would thus be in the range of current conventional combustion vehicles. This price reduction makes the use of the lower-cost cells attractive in the small car segment. While still providing acceptable ranges. For the LFP and sodium-ion batteries shown, the cell-to-pack technology was applied, as it can be assumed that this technology will establish itself on the market in the next few years, especially as these cell technologies are predestined for use in CTP configurations due to the high level of safety they induce. Vehicles with a lithium-sulphur battery would achieve similar range values as vehicles with the solid-state battery or the NMC2030 battery. However, the price for a vehicle would increase so much due to the currently high assumed cell costs that it would not be suitable for use and is therefore no longer considered within this work.
Figure 4 shows the supposed influence of cell chemistries on vehicles in the M-segment in 2030. With cell-to-pack technology, vehicles with LFP or sodium-ion batteries could achieve ranges of 567 km and 410 km, respectively. These ranges are partly due to the low consumption of the vehicles in 2030, which is assumed in this model due to the high efficiencies shown in Table 3. A medium sized vehicle with a LFP battery thus has a consumption of 12.7 kWh/100km with a battery capacity of 73 kWh, which would be achievable with the cell-to-pack technology. The price would not rise above 40,000 EUR. Vehicles with future high-nickel batteries or with solid-state batteries could achieve ranges of over 850 km. Which is around 30% more than the range that would be possible with a current NMC811 battery. Vehicles with a solid-state battery could achieve a range of 937 km. Bbut with a cost assumption of 150 EUR/kWh as stated in Section 2.2, the price of the vehicle would increase to nearly 70,000 EUR. This is over 50% more than a vehicle with a NMC2030 battery, which would also allow ranges of over 850 km.
In the L-segment in 2030, a range of over 1000 km can be expected with high-nickel or solid-state batteries. The price for the entire vehicle would be around 80,000 to just under 110,000 EUR as shown in Figure A9 in the Appendix B. Vehicles with LFP batteries or sodium-ion batteries would also be a cost-effective alternative at 60,000 to 70,000 EUR, but would have a range of 697 km or 495 km, which is about 50% less. In addition, LFP batteries have a negative impact on the battery weight of a vehicle due to their lower gravimetric energy density. If you would include an LFP battery with the same battery capacity as the atual EQS to get the same range, the LFP batteries would then weight more than 1000 kg. This would cause increased consumption and thus have a negative impact on the associated performance of the vehicle. In addition, OEMs would have to consider the impact on the overall vehicle weight. With a LFP battery and unchanged performance parameters, the EQS from Mercedes-Benz would have a total weight of around 3000 kg and would thus almost reach the limit of the permissible total weight of a passenger car of 3500 kg.
4. Discussion
The model shows the strengths and weaknesses of different, current and future cell chemistries on a total vehicle level with respect to the energy consumption, range and price of the vehicle. It can be seen that several battery technologies have the potential to gain market share in the growing battery market for BEVs.
It should be noted that the structure of the vehicles in the various segments has been based on reference vehicles. However, since not every vehicle is identical and has different vehicle-specific parameters, the model cannot be transferred directly to every vehicle. Assumptions were also made that are necessary for better comparison of the cell chemistries, but make it difficult to draw exact conclusions. For example, the same efficiency per drive component was assumed for each vehicle. In addition, the KPIs of the cell chemistries can deviate from the assumed values in reality.
4.1. Model Outputs
For current vehicles, high-nickel batteries are advantageous due to their high gravimetric and volumetric energy density, in terms of vehicle range. However, with LFP batteries, the cost of vehicles can be greatly reduced in some cases. Especially in the small vehicle segment, the use of LFP in batteries is conceivable, since small vehicles tend to be used in urban traffic and high ranges are of less importance. In addition, s-segment vehicles are mostly volume vehicles or serve as entry-level vehicles for which a low price is crucial. In the large vehicle segment, the model delivers comparable results as the studies in the s-segment. However, high ranges are of greater importance in that vehicle segment. In addition, other negative characteristics of the LFP battery such as the reduced performance at low temperatures and the possible additional vehicle weight and the resulting lower sportiness are more critical in this segment, which is why high nickel batteries are more likely to be used in upper and luxury class vehicles, where low costs are less of a concern. In the M segment, the focus could be on either high range or low cost, depending on the configuration or vehicle variant.
Under the assumed improvements for vehicles in 2030, energy consumption decreases, reducing the need to install ever larger batteries in vehicles. Future vehicles in all segments could also achieve high ranges with LFP batteries, especially if they focus on cell-to-pack technologies keeping vehicle prices low. With high-nickel batteries, ranges in the 1000 km range are realistic. With the assumptions made regarding the solid-state battery, only slightly longer ranges can be expected than for vehicles with high-nickel batteries. Moreover, vehicle prices would be higher due to the higher cell costs assumed. However, it is not yet possible to predict which KPIs can be achieved when the solid-state battery is introduced to the market. Furthermore, the results of the work raise the question of whether there is a need for a solid-state battery. Given the next development steps of high-nickel batteries, very long ranges in combination with presumably low overall consumption are possible. Then the solid-state battery could possibly only compete on the basis of increased safety and the presumably lower battery weight.
4.2. Expert Estimates and Strategies of Automotive Manufacturers
The experts interviewed see the majority of the battery market for BEVs in 2030 divided into high-nickel batteries and LFP batteries. LFP batteries are an attractive battery for OEMs due to their low cost, high safety and good environmental performance, especially in the entry and volume segments. This is also shown by the strategies of automotive manufacturers. In addition to Volkswagen AG and Tesla, Mercedes Benz and Stellantis want to rely on LFP and LMFP batteries in the future [80,81,82,83]. In addition to LFP and LMFP batteries, sodium-ion batteries would also be suitable for future low-cost vehicles due to their similar properties. However, it is not yet possible to predict how the market share of this type of battery will develop, as it has not yet entered the market on a significant scale. High-nickel batteries will continue to be used by many OEMs due to their high energy density. The study has shown that the assumed development steps of the battery and the vehicle can enable ranges of over 1000 km in some cases. In addition, they currently offer the best price/performance ratio thanks to scaling effects and the trend towards reducing the cobalt and magnesium content. Due to the higher costs and the only slightly higher energy densities than future high-nickel batteries, the experts interviewed forecast that the market share of solid-state batteries will only be around 1–2% in 2030. However, the analysis in Section 2.2 showed that many OEMs are still intensively involved in the development of solid-state batteries.
Automotive manufacturers rely on different battery technologies depending on the vehicle segment. This is also shown in Figure 5 which summarizes different press releases and strategy papers of OEMs on their plans for future battery technologies. In the future, the market will probably be divided into further developments of existing high-nickel and LFP or LMFP chemistries, but also include market shares of solid-state and sodium-ion batteries.
5. Conclusions
The share of battery-electric vehicles will increase steadily in the coming decades due to political requirements. In order to win a share of the passenger car market in the future, or avoid losing it to the competition, automotive manufacturers must meet the main customer requirements for battery electric vehicles. These include low prices, long ranges and lifetime as well as the possibility of fast charging. At this point the battery plays the most significant role within the vehicle. This paper provides an overview of current and possible future battery technologies for passenger cars and analyses them from a technical and economic point of view.
In order to identify important, current and future battery technologies in passenger car applications, the focus was placed on current technical literature and publications from recent years. Based on this, the most important performance parameters were determined and verified and supplemented by experts from research and industry. In terms of batteries, so far only the lithium-ion battery meets the requirements of a BEV. In addition to current Li-ion cell chemistries such as NMC, NCA and LFP, other possible future battery technologies were analysed, including the solid state battery, the sodium-ion battery and the sulphur battery.
To analyse the different battery chemistries, a model was developed in the course of the work to evaluate the technologies at the overall vehicle level. The model examines the influence of vehicle-specific parameters such as vehicle weight, aerodynamics and efficiency of the powertrain components on overall energy consumption and range. Furthermore, a bottom-up cost calculation is included which provides conclusions on the economic viability of the different types of battery technologies. In this way, the model shows the potential that lies in future developments within the battery, but also in the components of the entire vehicle. Future developments in the KPIs can be continuously adjusted and provide information about the influence on costs, consumption and range.
The most important finding here is that different battery technologies are available to vehicle manufacturers based on the vehicle segment. Depending on whether the focus of the vehicle is on cost or range or performance, different battery technologies can be used. In all likelihood, the LFP or LMFP battery will be increasingly used in low-cost vehicles, while the more expensive vehicle segments will rely on high-nickel batteries with a long range. In addition, solid-state batteries and sodium-ion batteries will represent further alternatives for OEMs in the future. The experts interviewed also see most market shares in 2030 for high-nickel batteries and LFP or LMFP batteries. Likewise, the comparison of the model results with an analysis of the battery strategies of important car manufacturers shows that a diversification of the market for battery electric vehicles is already in full swing.
Author Contributions
S.H.: Conceptualization, Methodology, Data Curation, Software, Validation, Visualization, Writing—Original Draft Preparation. M.M.: Methodology, Data Curation, Software, Validation, Visualization, Writing. I.Ö.: Methodology, Validation. All authors have read and agreed to the published version of the manuscript.
Funding
This research was funded by the DATAMOST project of the German Aerospace Center.
Data Availability Statement
Data available on request from the authors.
Conflicts of Interest
The authors declare that they have no known competing financial interest or personal relationship that could have appeared to influence the work reported in this paper.
Nomenclature
The following abbreviations are used in this manuscript:
| BEV | Battery Electric Vehicle |
| CtP | Cell-to-Pack |
| ICEV | Internal Combustion Engine Vehicle |
| KPI | Key Performance Indicator |
| LFP | Lithium Iron Phosphate |
| LIB | Lithium Ion Battery |
| LMFP | Lithium Manganese Iron Phosphate |
| LMO | Lithium Manganese Oxide |
| MRL | Market Readiness Level |
| NCA | Lithium Nickel Cobalt Aluminium Oxide |
| NMC | Lithium Nickel Manganese Cobalt Oxide |
| OEM | Original Equipment Manufacturer |
| SIB | Sodium-Ion Battery |
| TRL | Technology Readiness Level |
| WLTP | Worldwide Harmonized Light Vehicles Test Procedure |
Appendix A
The following pictures show the questionnaire on the basis of which the expert interviews took place.
Figure A1.
The first page of the questionnaire.

Figure A2.
The second page of the questionnaire.

Figure A3.
The third page of the questionnaire.

Figure A4.
The fourth page of the questionnaire.

Figure A5.
The fifth page of the questionnaire.

Figure A6.
The sixth page of the questionnaire.

Appendix B
Appendix B.1
Figure A7 and Figure A8 show the comparison of the model results for medium and large vehicles with respect to different current cell chemistries.
Figure A7.
Comparison of the influence of different cell chemistries on thevehicle price and the calculated range of a vehicle in the medium vehicle segment.
Figure A7.
Comparison of the influence of different cell chemistries on thevehicle price and the calculated range of a vehicle in the medium vehicle segment.

Figure A8.
Comparison of the influence of different cell chemistries on the vehicle price and the calculated range of a vehicle in the large vehicle segment.
Figure A8.
Comparison of the influence of different cell chemistries on the vehicle price and the calculated range of a vehicle in the large vehicle segment.

Appendix B.2
Figure A9 shows the comparison of the model results for large vehicles with respect to potential future cell chemistries.
Figure A9.
Comparison of the influence of potential future cell chemistries on the vehicle price and the calculated range of a vehicle in the large vehicle segment.
Figure A9.
Comparison of the influence of potential future cell chemistries on the vehicle price and the calculated range of a vehicle in the large vehicle segment.

References
- Hagedorn, M.; Hartmann, S.; Heilert, D.; Harter, C.; Olschewski, I.; Eckstein, L.; Baum, M.; Henzelman, J. Automobile Wertschöpfung 2030/2050; Bundesministeriums für Wirtschaft und Energie-Endbericht: Frankfurt, Germany, 2019.
- Tschöke, H.; Gutzmer, P.; Pfund, T. Elektrifizierung des Antriebsstrangs; Springer: Berlin/Heidelberg, Germany, 2019. [Google Scholar] [CrossRef]
- Bundesministerium für Umwelt, Naturschutz und Nukleare Sicherheit. Das System der CO2-Flottengrenzwerte für PKW und Leichte Nutzfahrzeuge. Available online: https://www.bmuv.de/fileadmin/Daten_BMU/Download_PDF/Luft/zusammenfassung_co2_flottengrenzwerte.pdf (accessed on 31 March 2022).
- Aral Aktiengesellschaft. Aral Studie. Trends beim Autokauf 2021; Aral Aktiengesellschaft: Bochum, Germany, 2021. [Google Scholar]
- Vekić, N. Lithium-Ionen-Batterie für die Elektromobilität: Status, Zukunftsperspektiven, Recycling; ThinkTank Industrial: Birmingham, UK, 2020. [Google Scholar]
- Volkswagen. Power Day: Volkswagen präsentiert Technology-Roadmap für Batterie und Laden bis 2030; Volkswagen: Wolfsburg, Germany, 2021. [Google Scholar]
- Mercedes-Benz Group AG. Mercedes-Benz Strategy: Update: Electric Drive; Mercedes-Benz: Stuttgart, Germany, 2021. [Google Scholar]
- Werwitzke, C. Toyota Skizziert Batterie-Roadmap bis 2030. Available online: https://www.electrive.net/2021/09/08/toyota-skizziert-batterie-roadmap-bis-2030/ (accessed on 24 March 2022).
- Köllner, C. Was ist Die Cell-to-Pack-Technologie? Available online: https://www.springerprofessional.de/batterie/automobilproduktion/was-ist-die-cell-to-pack-technologie-/23684340 (accessed on 22 March 2023).
- Korthauer, R. Handbuch Lithium-Ionen-Batterien, 1st ed.; Springer: Berlin/Heidelberg, Germany, 2013. [Google Scholar]
- Sebastian Schaal. Daimler plant mit LFP-Zellen ab 2024. Available online: https://www.electrive.net/2021/10/28/daimler-plant-mit-lfp-zellen-ab-2024/ (accessed on 22 March 2023).
- Mercedes-Benz Group AG. Der neue EQS: Die Traktionsbatterie (1). Available online: https://group-media.mercedes-benz.com/marsMediaSite/de/instance/ko/Der-neue-EQS-die-Traktionsbatterie1.xhtml?oid=49582033 (accessed on 21 March 2022).
- A2MAC1. Automotive Benchmarking: xEV Powertrain: Battery Cell Analysis; A2MAC1: Boulogne-Billancourt, France, 2023. [Google Scholar]
- IHS Markit. Battery Cost Trends in the European Union and Mainland China. WHITEPAPER, 27 July 2021.
- Volkswagen, A.G. Leistungsstark und Skalierbar. Available online: https://www.volkswagen-newsroom.com/de/storys/leistungsstark-und-skalierbar-4244 (accessed on 19 March 2022).
- Yang, C. Running battery electric vehicles with extended range: Coupling cost and energy analysis. Appl. Energy 2022, 306, 118116. [Google Scholar] [CrossRef]
- Battery 2030 + Roadmap. Battery2030—Inventing the Sustanable Batteries of the Future: Research Needs and Future Actions; EU: Brussel, Luxembourg, 2020.
- Lima, P. Samsung SDI 94 Ah Battery Cell Full Specifications. Available online: https://pushevs.com/2018/04/05/samsung-sdi-94-ah-battery-cell-full-specifications/ (accessed on 4 April 2022).
- Lima, P. CATL Archieves 304 Wh/kg in New Battery Cells. Available online: https://pushevs.com/2019/03/30/catl-achieves-304-wh-kg-in-new-battery-cells/ (accessed on 2 April 2022).
- Schmuch, R.; Wagner, R.; Hörpel, G.; Placke, T.; Winter, M. Performance and cost of materials for lithium-based rechargeable automotive batteries. Nat. Energy 2018, 3, 267–278. [Google Scholar] [CrossRef]
- BMW i-Future Electric Cars ans SUVs. Available online: https://www.just-auto.com/features/bmw-i-future-electric-cars-and-suvs/ (accessed on 11 March 2022).
- Karch, M. Advantages and disadvantages of different battery cell chemistries. Real life Scenarios, Presentation, Lead Battery Technology. E-Force One AG, 8 December 2021. [Google Scholar]
- Butcher, L. ShoreDot Exceeds 1000 Cycles with Silicon-Anode Li-Ion Batterie. Available online: https://www.enginetechnologyinternational.com/news/electric-powertrain-technologies/storedot-exceeds-1000-cycles-with-silicon-anode-li-ion-batteries.html#prettyPhoto (accessed on 2 April 2022).
- McKinsey & Company. Building Better Batteries: Insights on Chemistry and Design from China. Available online: https://www.mckinsey.com/industries/automotive-and-assembly/our-insights/building-better-batteries-insights-on-chemistry-and-design-from-china (accessed on 2 April 2022).
- Miao, Y.; Hynan, P.; von Jouanne, A.; Yokochi, A. Current Li-Ion Battery Technologies in Electric Vehicles and Opportunities for Advancements. Energies 2019, 12, 1074. [Google Scholar] [CrossRef] [Green Version]
- Ding, Y.; Cano, Z.P.; Yu, A.; Lu, J.; Chen, Z. Automotive Li-Ion Batteries: Current Status and Future Perspectives. Electrochem. Energy Rev. 2019, 2, 1–28. [Google Scholar] [CrossRef]
- Nam, G.W.; Park, N.Y.; Park, K.J.; Yang, J.; Liu, J.; Yoon, C.S.; Sun, Y.K. Capacity Fading of Ni-Rich NCA Cathodes: Effect of Microcracking Extent. ACS Energy Lett. 2019, 4, 2995–3001. [Google Scholar] [CrossRef]
- Zubi, G.; Dufo-López, R.; Carvalho, M.; Pasaoglu, G. The lithium-ion battery: State of the art and future perspectives. Renew. Sustain. Energy Rev. 2018, 89, 292–308. [Google Scholar] [CrossRef]
- Huang, J. Ein Vergleich von NMC / NCA Lithium-Ionen-Akku und LFP-Batterie. Available online: https://poworks.com/de/ein-vergleich-von-nmc-nca-lithium-ionen-akku-und-lfp-batterie (accessed on 2 April 2022).
- Wissenschaftliche Dienste—Deutscher Bundestag. Energiespeicher der Elektromobilität: Entwicklung der Energiedichten; Deutscher Bundestag: Bonn, Germany, 2020.
- Thielmann, A.; Sauer, A.; Wietschel, M. Gesamt-Roadmap Energiespeicher für die Elektromobilität; Fraunhofer: Munich, Germany, 2015. [Google Scholar]
- Purwanto, A.; Yudha, C.S.; Ubaidillah, U.; Widiyandari, H.; Ogi, T.; Haerudin, H. NCA cathode material: Synthesis methods and performance enhancement efforts. Mater. Res. Express 2018, 5, 122001. [Google Scholar] [CrossRef]
- Mielke, W. Modellierung von Kennlinien, Impedanzspektren und Thermischem Verhalten einer Lithium-Eisenphosphat-Batterie; Universität Stuttgart: Stuttgart, Germany, 2011. [Google Scholar]
- Thielmann, A.; Neef, C.; Hettesheimer, T.; Döscher, H.; Wietschel, M.; Tübke, J. Energiespeicher-Roadmap (Update 2017): Hiochenergie-Batterien 2030+ und Perspektiven Zukünftiger Batterietechnologien; Fraunhofer: Munich, Germany, 2017. [Google Scholar]
- Svolt Energy Technology (Europe) GmbH. 2. Battery day: Svolt kündigt Produktions-Kapazitäten von 600 GWh bis 2025 an. Available online: https://svolt-eu.com/2-battery-day-svolt-kuendigt-produktions-kapazitaeten-von-600-gwh-bis-2025-an/ (accessed on 3 March 2022).
- Lima, P. This Is Why BYD Blade Battery Is Ahead of Competition. Available online: https://pushevs.com/2021/08/10/this-is-why-byd-blade-battery-is-ahead-of-competition/ (accessed on 4 April 2022).
- Hannan, M.A.; Hoque, M.M.; Hussain, A.; Yusof, Y.; Ker, P.J. State-of-the-Art and Energy Management System of Lithium-Ion Batteries in Electric Vehicle Applications: Issues and Recommendations. IEEE Access 2018, 6, 19362–19378. [Google Scholar] [CrossRef]
- Lima, P. The comeback of LFP Batteries. Available online: https://pushevs.com/2019/08/16/the-comeback-of-lfp-batteries/ (accessed on 5 April 2022).
- Battery University. BU-216: Summary Table of Lithium-Based Batteries. Available online: https://batteryuniversity.com/article/bu-216-summary-table-of-lithium-based-batteries (accessed on 11 March 2022).
- Cui, Y. Silicon anodes. Nat. Energy 2021, 6, 995–996. [Google Scholar] [CrossRef]
- PK Components GmbH. Lithium-Titanat-Batterien von Shengquan. Available online: https://www.pk-components.de/ressourcen/empfohlene-bauelemente/lithium-titanat-batterien-lto-batterien.html (accessed on 1 April 2022).
- Osiak, M.; Geaney, H.; Armstrong, E.; O’Dwyer, C. Structuring materials for lithium-ion batteries: Advancements in nanomaterial structure, composition, and defined assembly on cell performance. J. Mater. Chem. A 2014, 2, 9433. [Google Scholar] [CrossRef]
- Intertek. Solid-State Lithium Ion Batteries—The Challenges. Available online: https://www.intertek.com/blog/2019-05-21-lion/ (accessed on 5 May 2022).
- Volta Foundation. Annual Battery Report (2022); Volta Foundation: San Francisco, CA, USA, 2022. [Google Scholar]
- Schaal, S. Samsung erhöht Nickel-Anteil in NCA-Batterien. Available online: https://www.electrive.net/2021/06/11/samsung-erhoeht-nickel-anteil-in-nca-batterien/ (accessed on 3 April 2022).
- Rathi, A.; Murray, P.; Dottle, R. The Hidden Science Making Batteries Better, Cheaper and Everywhere. Available online: https://www.bloomberg.com/graphics/2021-inside-lithium-ion-batteries/?cmpid=BBD042721_hyperdrive&utm_medium=email&utm_source=newsletter&utm_term=210427&utm_campaign=hyperdrive (accessed on 4 April 2022).
- Stanek, R.; Gallus, D.; Konersmann, B.; Ferstl, F. Tesla Battery Day 2020—Technology Announcement Analysis; P3 Technology Report; P3 Automative: Stuttgart, Germany, 2020. [Google Scholar]
- NASA. Technology Readiness Level Definitions. appenB. Available online: https://www.nasa.gov/pdf/458490main_TRL_Definitions.pdf (accessed on 26 March 2022).
- Automotive Coucil. Automotive-Technology and Manufactruring Readiness-Level. Available online: https://www.smmt.co.uk/wp-content/uploads/sites/2/Automotive-Technology-and-Manufacturing-Readiness-Levels.pdf (accessed on 26 March 2022).
- The National Academies of Sciences, Engineering, Medicine. Assessment of Technologies for Improving Light-Duty Vehicle Fuel Economy 2025–2035; National Academies Press: Washington, DC, USA, 2021. [Google Scholar] [CrossRef]
- Daniel Bleakley. Tesla Supplier CATL to Produce M3P Batteries That Will Deliver Big Boost in Range for EVs. Available online: https://thedriven.io/2023/03/27/tesla-supplier-catl-to-produce-m3p-batteries-that-will-deliver-big-boost-in-range-for-evs/ (accessed on 28 March 2023).
- Schaal, S. Mercedes und Stellantis Steigen bei Feststoffakkuentwickler Factorial Energy ein. Available online: https://www.electrive.net/2021/12/01/mercedes-und-stellantis-steigen-bei-feststoffakku-entwickler-factorial-energy-ein/ (accessed on 25 March 2022).
- Volkswagen. Volkswagen erhöht Anteil an QuantumScape; Volkswagen: Wolfsburg, Germany, 2020. [Google Scholar]
- BMW. Neue Zelltechnologie für Neue Klasse: BMW Group stärkt Batteriekompetenzen als Teil der Initiative European Battery Innovation; BMW: Munich, Germany, 2021. [Google Scholar]
- Battery University. BU-212: Future Batteries: Sodium-ion (Na-Ion). Available online: https://batteryuniversity.com/article/bu-212-future-batteries (accessed on 29 March 2022).
- Ma, J.; Li, Y.; Grundish, N.S.; Goodenough, J.B.; Chen, Y.; Guo, L.; Peng, Z.; Qi, X.; Yang, F.; Qie, L.; et al. The 2021 battery technology roadmap. J. Phys. D Appl. Phys. 2021, 54, 183001. [Google Scholar] [CrossRef]
- CATL. CATL Unveils Its Latest Breakthrough Technology by Releasing Its First Generation of Sodium-ion Batteries. Available online: https://www.catl.com/en/news/665.html (accessed on 29 March 2022).
- Wunderlich-Pfeiffer, F. CATL Stellt Erste Natrium-Ionen-Akkus Für Autos Vor. Available online: https://www.golem.de/news/akkutechnik-catl-stellt-erste-natrium-ionen-akkus-fuer-autos-vor-2107-158529.html (accessed on 29 March 2022).
- Wunderlich-Pfeiffer. Natrium-Ionen-Akkus Werden echte Lithium-Alternative. Available online: https://www.golem.de/news/akkutechnik-und-e-mobilitaet-natrium-ionen-akkus-werden-echte-lithium-alternative-2106-156863.html (accessed on 29 March 2022).
- Richert, F. New Sodium-Ion Battery Advance Could Challenge Lithium-Ion: Battery Development. Available online: https://www.power-and-beyond.com/new-sodium-ion-battery-advance-could-challenge-lithium-ion-a-941730/ (accessed on 29 March 2022).
- Hackmann, M. Current Technology Roadmap: LI-ION and next-Gen Technology Solutions for the Automotive Industry. Reuters, 13 October 2021. [Google Scholar]
- Deutsches Zentrum für Luft- und Raumfahrt, e.V. Technologiekalender—Strukturwandel Automobil Baden-Würtemberg: Technologiesteckbriefe. Available online: https://verkehrsforschung.dlr.de/public/documents/2020/Technologiesteckbriefe_TKBW_2020.pdf (accessed on 3 April 2022).
- Doppelbauer, M. Grundlagen der Elektromobilität; Springer Fachmedien Wiesbaden: Wiesbaden, Germany, 2020. [Google Scholar] [CrossRef]
- International Energy Agency. Global EV Outlook 2020: Entering the Decade of Electric Drive? International Energy Agency: Paris, France, 2020.
- Sion Power. Sion Power Demonstrates More Than 2500 Cycles in Licerion Rechargeble Battery Technology. Available online: https://sionpower.com/2022/sion-power-demonstrates-more-than-2500-cycles-in-licerion-rechargeable-battery-technology/ (accessed on 4 April 2022).
- Kost, J. Farasis hat Nächste Generation von EV Batteriezellen mit Energiedichte von Mehr als 330 Wh/kg Entwickelkt und Erfolgreich Validiert. Available online: https://www.presseportal.de/pm/131934/4874105 (accessed on 4 April 2022).
- ADAC. Renault Zoe R110 Z.E. 50 (52 kWh) Life (inkl. Batterie) (10/19–02/22). Available online: https://www.adac.de/rund-ums-fahrzeug/autokatalog/marken-modelle/renault/zoe/1generation-facelift/301605/#technische-daten (accessed on 24 April 2022).
- ADAC. VW ID.3 Pro S (77 kWh) (4-Sitzer) (ab 05/21). Available online: https://www.adac.de/rund-ums-fahrzeug/autokatalog/marken-modelle/vw/id3/1generation/320813/#technische-daten (accessed on 24 April 2022).
- Leichsenring, S. VW ID.3 enthüllt: Da ist sie, die Serienversion. Available online: https://de.motor1.com/news/369580/vw-id3-enthullt-serienversion/ (accessed on 24 April 2022).
- Leichsenring, S. Mercedes EQS: 245 Oder 385 kW—und eine Perfomance-Version. Available online: https://insideevs.de/news/499098/Mercedes-EQS--mehr-technische-Daten/ (accessed on 24 April 2022).
- Stegmaier, G. Alles über den Zukunfts-Antrieb. Available online: https://www.auto-motor-und-sport.de/tech-zukunft/cw-wert-rekorde-bei-elektroautos-reichweite-mercedes-eqs-vergleich-s-klasse/ (accessed on 24 April 2022.).
- Markus Grabitz. E-Auto EQXX besteht 1000-Kilometer-Test. Stuttgarter Zeitung, 14 April 2022.
- Stanek, R.; Kirchen, J.; Klein, A.; Rupp, M.; Flemming, J.; Steiner, L.; Knecht, T. Wertschöpfungspotenziale von E-Motoren für den Automobilbereich in Baden-Würtemberg: Themenpapier Cluster; Elektromobilität Süd-West: Stuttgart, Germany, 2021. [Google Scholar]
- Kurzweil, P.; Dietlmeier, O. Elektrochemische Speicher: Superkondensatoren, Batterien, Elektrolyse-Wasserstoff, Rechtliche Rahmenbedingungen, 2nd ed.; Aktualisierte und Erweiterte Auflage, Ed.; Lehrbuch, Springer Vieweg: Wiesbaden, Germany; Berlin/Heidelberg, Germany, 2018. [Google Scholar] [CrossRef]
- Yang, X.G.; Liu, T.; Wang, C.Y. Thermally modulated lithium iron phosphate batteries for mass-market electric vehicles. Nat. Energy 2021, 6, 176–185. [Google Scholar] [CrossRef]
- BloombergNEF. Hitting the EV Inflection Point: Electric Vehicle Price Parity and Phasing out Combustion Vehicle Sales in Europe; BloombergNEF: London, UK, 2021. [Google Scholar]
- Institute of Vehicle Concepts. VECTOR21: Scenario and Market Analysis Software for Simulating Future Vehicle Markets; Institute of Vehicle Concepts: Stuttgart, Germany, 2022. [Google Scholar]
- ADAC. Mercedes-Benz EQS 450+ (ab 10/21). Available online: https://www.adac.de/rund-ums-fahrzeug/autokatalog/marken-modelle/mercedes-benz/eqs/297/320198/#technische-daten (accessed on 6 May 2022).
- Schwarzer, C.M. Wie Die WLTP-Reichweite von Elektroautos Ermittelt Wird. Available online: https://www.electrive.net/2022/04/02/wie-die-wltp-reichweite-von-elektroautos-ermittelt-wird/ (accessed on 6 May 2022).
- Sebastian Schaal. “Power Day”: Volkswagen plant Einheits-Batteriezelle: Sechs Europa-Gigafabriken, 18.000 Schnellladepunkte und Bidirektionales Laden Sind Geplant. Available online: https://www.electrive.net/2021/03/15/power-day-volkswagen-plant-einheits-batteriezelle-ab-2023/ (accessed on 21 March 2022).
- Stefan Leichsenring. Mercedes EQA und EQB Bekommen ab 2024/2025 LFP-Batterien: Günstigere Akkus mit Weniger Energiedichte für die nächste Generation von EQA und EQB. Available online: https://insideevs.de/news/544605/mercedes-eqa-eqb-lfp-batterien/ (accessed on 21 March 2022).
- Stellantis. Stellantnis Presents Its Elektrification Strategy. Available online: https://www.stellantis.com/en/investors/events/ev-day-2021 (accessed on 25 March 2022).
- Schaal, S. Battery Day: Tesla Zeigt Neue 4680-Batteriezelle: Tesla könnte mit der Neuen Zelle die Grenzen von 50 USD/kWh Batteriesystemkosten Knacken. Available online: https://www.electrive.net/2020/09/23/battery-day-tesla-zeigt-neue-4680-batteriezelle/ (accessed on 22 March 2022).
- Leichsenring, S. “Ford+”: BEVs Sollen so Profitabel Werden wie Verbrenner: Dazu Sollen die Batteriekosten bis 2025 μm 40 Prozent auf 100 Dollar pro kWh Sinken. Available online: https://insideevs.de/news/509794/delivering-ford-elektrozukunft-batteriekosten-plattformen/ (accessed on 24 March 2022).
Figure 1.
Overview of the electrode potentials and specific capacities of various active materials. Own representation based on [42,43].

Figure 2.
Comparison of the influence of different cell chemistries on the vehicle price and the calculated range of a vehicle in the small vehicle segment.
Figure 2.
Comparison of the influence of different cell chemistries on the vehicle price and the calculated range of a vehicle in the small vehicle segment.

Figure 3.
Comparison of the influence of potential future cell chemistries on the vehicle price and the calculated range of a vehicle in the small vehicle segment.
Figure 3.
Comparison of the influence of potential future cell chemistries on the vehicle price and the calculated range of a vehicle in the small vehicle segment.

Figure 4.
Comparison of the influence of potential future cell chemistries on the vehicle price and the calculated range of a vehicle in the medium vehicle segment.
Figure 4.
Comparison of the influence of potential future cell chemistries on the vehicle price and the calculated range of a vehicle in the medium vehicle segment.

Figure 5.
Strategies of automotive manufacturers regarding different battery chemistries for future battery electric passenger vehicles based on press releases and strategy papers. Illustrated on their share of the German passenger car market [6,7,12,80,81,82,83,84].

Table 3.
Vehicle-specific data for the small, medium and large vehicle segment. Based on the example vehicles Renault Zoe, Volkswagen ID.3 and Mercedes EQS [67,68,69,70,71]. The values for 2030 result, among other things, from possible future developments as realised in the Mercedes EQXX [72,73,74].
| Variable | Symbol | Unit | Renault Zoe | Volkswagen ID.3 | Mercedes EQS | |||
|---|---|---|---|---|---|---|---|---|
| Vehicle power | P | kW | 80 | 150 | 300 | |||
| Vehicle mass (w/o battery) | kg | 1251 | 1440 | 1798 | ||||
| Battery weight (reference) | kg | 326 | 495 | 682 | ||||
| Battery capacity (reference) | kWh | 55 | 82 | 114 | ||||
| Battery volume | l | 325 | 369 | 546 | ||||
| Frontal area | A | m2 | 2.27 | 2.36 | 2.51 | |||
| Variable | Symbol | Unit | S-Segment | M-Segment | L-Segment | |||
| 2022 | 2030 | 2022 | 2030 | 2022 | 2030 | |||
| Drag coefficient | - | 0.33 | 0.28 | 0.27 | 0.23 | 0.20 | 0.18 | |
| Rolling resistance coefficient | - | 0.009 | 0.0077 | 0.009 | 0.0077 | 0.009 | 0.0077 | |
| Efficiency of electric motor | - | 0.95 | 0.98 | 0.95 | 0.98 | 0.95 | 0.98 | |
| Battery charging efficiency (AC) | - | 0.95 | 0.99 | 0.95 | 0.99 | 0.95 | 0.99 | |
| Battery discharge efficiency | - | 0.95 | 0.99 | 0.95 | 0.99 | 0.95 | 0.99 | |
| Efficiency Power electronics | - | 0.95 | 0.99 | 0.95 | 0.99 | 0.95 | 0.99 | |
| Efficiency Transmission | - | 0.98 | 0.99 | 0.98 | 0.99 | 0.98 | 0.99 | |
| Overall efficiency | - | 0.84 | 0.95 | 0.84 | 0.95 | 0.84 | 0.95 | |
Table 5.
Results and comparison of the calculated reference vehicles with the actual vehicle data [67,68,78].
| Property | Unit | Segment S (Renault Zoe) | Segment M (VW ID3) | Segment L (Mercedes EQS) |
|---|---|---|---|---|
| Cell chemistry | NMC-721 | NMC-721 | NMC-811 | |
| Gross battery capacity | kWh | 55 | 82 | 114 |
| Calculated consumption | kWh/100 km | 16.3 | 16.3 | 17.6 |
| WLTP consumption | kWh/100 km | 17.2 | 15.7 | 16.1 |
| Deviation | −5% | 4% | 9% | |
| Calculated range | km | 336 | 497 | 644 |
| WLTP range | km | 395 | 525 | 768 |
| Deviation | −15% | −5% | −16% | |
| Assumed cost of battery cell | EUR/kWh | 95 | 95 | 90 |
| Calculated cost of battery | EUR | 7001 | 10,439 | 13,728 |
| Calculated sales price vehicle | EUR | 27,969 | 48,923 | 83,376 |
| List price vehicle | EUR | 31,990 | 42,460 | 107,326 |
| Deviation | −13% | 15% | −22% |
Disclaimer/Publisher’s Note: The statements, opinions and data contained in all publications are solely those of the individual author(s) and contributor(s) and not of MDPI and/or the editor(s). MDPI and/or the editor(s) disclaim responsibility for any injury to people or property resulting from any ideas, methods, instructions or products referred to in the content. |
© 2023 by the authors. Licensee MDPI, Basel, Switzerland. This article is an open access article distributed under the terms and conditions of the Creative Commons Attribution (CC BY) license (https://creativecommons.org/licenses/by/4.0/).
Share and Cite
MDPI and ACS Style
Hasselwander, S.; Meyer, M.; Österle, I. Techno-Economic Analysis of Different Battery Cell Chemistries for the Passenger Vehicle Market. Batteries 2023, 9, 379. https://doi.org/10.3390/batteries9070379
AMA Style
Hasselwander S, Meyer M, Österle I. Techno-Economic Analysis of Different Battery Cell Chemistries for the Passenger Vehicle Market. Batteries. 2023; 9(7):379. https://doi.org/10.3390/batteries9070379
Chicago/Turabian StyleHasselwander, Samuel, Markus Meyer, and Ines Österle. 2023. "Techno-Economic Analysis of Different Battery Cell Chemistries for the Passenger Vehicle Market" Batteries 9, no. 7: 379. https://doi.org/10.3390/batteries9070379
Note that from the first issue of 2016, this journal uses article numbers instead of page numbers. See further details here.