
Implementing Reversible Swelling into the Numerical Model of a Lithium-Ion Pouch Cell for Short Circuit Prediction


Vehicle Safety Institute, Graz University of Technology, 8010 Graz, Austria
*
Author to whom correspondence should be addressed.
Batteries 2023, 9(8), 417; https://doi.org/10.3390/batteries9080417
Submission received: 7 July 2023
/
Revised: 31 July 2023
/
Accepted: 8 August 2023
/
Published: 9 August 2023
(This article belongs to the Section Battery Modelling, Simulation, Management and Application)
Abstract
:Mechanical simulation models have become crucial for understanding Li-ion battery failure and degradation mechanisms. However, existing safety assessment models lack the implementation of SOC-dependent thickness variations referred to as reversible swelling. Reversible swelling affects the applied preload force on a constrained pouch cell, potentially impacting its safety. To investigate this, a finite element RVE model was developed in LS-Dyna. Two swelling models, simplified homogenous expansion (HE) and locally resolved expansion (LE), were implemented along with a reference basis model (BM) without expansion. Six different stress- or strain-based short circuit criteria were calibrated with abuse test simulations at different SOCs and preload forces. Short circuit prognosis improved on average by 0.8% and 0.7% for the LE and HE model compared to the BM, with minimum principal stress being the most suitable criterion. The LE model exhibited a softer mechanical response than the HE model or BM, accounting for the pouch cell surface unevenness at small indentations. This study demonstrated the feasibility and usefulness of implementing an expansion model in a commercial FE solver for improved short circuit predictions. An expansion model is crucial for simulating aged battery cells with significant geometry changes strongly affecting the preload force of a constrained battery cell.
1. Introduction
Lithium ion batteries (LIBs) are currently mainly used in electric vehicles (EVs). LIBs pose various risks (e.g., thermal runaway [1,2]) that need to be investigated in order to guarantee safe mobility. Numerical simulation methods are a tool for the investigation of various safety-relevant issues.
Numerical simulation covers, among other fields, the electrical, thermal, and mechanical representation of an LIB. Mechanical deformations are potentially applied to the LIBs as the result of a vehicle crash [3]. Mechanical simulations of LIBs allow for a deeper understanding of failure mechanisms and can be used to optimally design battery systems in EVs.
Several researchers created mechanical simulation models. Reviews and literature by Zhu et al. [3,4], Kermani and Sahraei [5], and Liu et al. [6] summarize relevant publications in the area of the safety-related numerical modelling of LIBs. The simulation models found in the literature can be divided into detailed models representing all components within the LIB [7] and homogenization approaches [8] or models with representative volume elements (RVE) [9]. Depending on the research focus, different approaches might be preferred and dependencies such as strain rate [10,11,12] or load orientation [13,14] have to be implemented in the simulation model. A detection of short circuits is often of interest in order to evaluate the safety of an LIB under conditions of mechanical abuse.
In the case of homogenized or RVE models, a representative short circuit criterion has to be defined in order to make a statement on the LIB’s safety, as the separator is not modelled in detail. These criteria are mostly based on strain- or stress-based quantities such as equivalent von Mises stress [6,15,16]. Homogenized or RVE models found in the literature, however, neglect influencing factors such as state-of-charge (SOC) dependent or lifetime-dependent geometry variations distorting the prediction quality when simulating constrained LIBs.
SOC-dependent geometry changes are the result of the intercalation and deintercalation of lithium ions into the electrodes’ active materials [17,18] and are also referred to as reversible swelling. The thickness of pouch cells, for instance, changes cyclically during charging and discharging, being in the order of up to 3% or more for NMC/graphite pouch cells [17,19,20,21,22].
Degradation mechanisms during electrochemical cycling lead to the formation of passivation layers such as the solid electrolyte interface (SEI). SEI growth or lithium plating are mechanisms leading to an irreversible thickness increase, also referred to as irreversible swelling, during the lifetime of an LIB [19,23,24,25].
Swelling mechanisms have so far been investigated in the literature in terms of experiments and simulation models. The simulation models have focused on the expansion behavior on a particle level [26,27], electrode level [28,29,30], macroscopic level, or on realizing a coupling between multiple scales [31,32,33,34,35]. The focus has lain mostly on a deeper understanding of the coupling between chemical processes and mechanical loads in order to optimize battery performance, or on the mapping of the expansion behavior in order to design battery module components.
Swelling mechanisms were implemented by several researchers in macroscopic simulation models using an empirical or phenomenological approach [36,37,38]. The strain increment caused by reversible swelling can be modelled with the partial molar volume and the change in molar lithium concentration according to Equation (1)
with denoting the Kronecker delta, where and correspond to the x-, y-, and z-directions. The Kronecker delta is 1 when equals and is 0 otherwise. In a macroscopic simulation, the partial molar volume corresponds to the volumetric expansion factor and the change in molar lithium concentration corresponds to the SOC. The equation structure of the reversible swelling strain increment is similar to the strain increment caused by thermal expansion. Using thermal expansion to apply SOC-dependent thickness variations has already been demonstrated in the literature [36,39,40] and simplifies the implementation in a commercial finite element (FE) code.
Both reversible and irreversible swelling mechanisms and associated thickness variations translate into variations of the preload force of a constrained LIB [17,22,41,42]. A preload force was found to cause internal stress to pouch cells affecting its mechanical and failure behavior upon out-of-plane indentation tests [43,44]. Applying a preload force resulted in a mechanically stiffer behavior and earlier failure during out-of-plane mechanical indentation tests. This can lead to the derivation of incorrect safety-critical load limits of an LIB. These results suggest the need for including SOC- and lifetime-dependent thickness variations into simulation models, as the preload force is affected and thus the internal stress during a mechanical abuse load is affected too.
However, swelling mechanisms, to the authors’ best knowledge, have not yet been implemented in a macroscopic homogenized numerical model of a constrained pouch cell in order to investigate the influence of the SOC-dependent preload force variations (caused by reversible swelling) on the mechanical abuse behavior. Two different expansion models were compared to a state-of-the art simulation model in order to evaluate the mechanical behavior during an indentation and to quantify a potential improvement of a short circuit prediction by implementation of an SOC-dependent geometry variation.
2. Methods
In this study, a commercial pouch cell was numerically modelled with a RVE approach. A basis model (BM) was used as reference representing a state-of-the-art model. The BM was extended by two different types of expansion model to obtain the local expansion (LE) model and the homogeneous expansion (HE) model. Both expansion models were calibrated with measurement data from Michelini et al. [22] in order to map the SOC-dependent thickness variations. The mechanical material model of the simulation model was decoupled from the expansion model by an additive modelling approach. The calibration of the mechanical material model was performed with out-of-plane indentation tests performed on unconstrained pouch cells with measurement data from Höschele et al. [44]. The validation of the overall models was undertaken by out-of-plane indentation tests performed on constrained pouch cells of the same type considering data from the same publication [44]. Six different stress- and strain-based short circuit criteria were investigated in order to determine the influence of the expansion model on the prediction quality of the short circuit. The best performing short circuit criterion was selected in order to compare the predicted with the measured indentation [44] at internal short circuit occurrence.
LS-DYNA with explicit time integration (Version R9.0.1) was used as finite element solver. A local computer (Windows 10 Enterprise 64-bit) with 8 CPUs (Intel(R) Core(TM) i7-8700K CPU 3.70 GHz) was used to perform the calculations. LS-PrePost (Version 4.8-x64) was used for pre- and post-processing of the simulation results.
2.1. Basis Model
The geometry of the pouch cell was modelled in a simplified manner (basis geometry) and consisted of two parts, namely the pouch foil and the jellyroll.
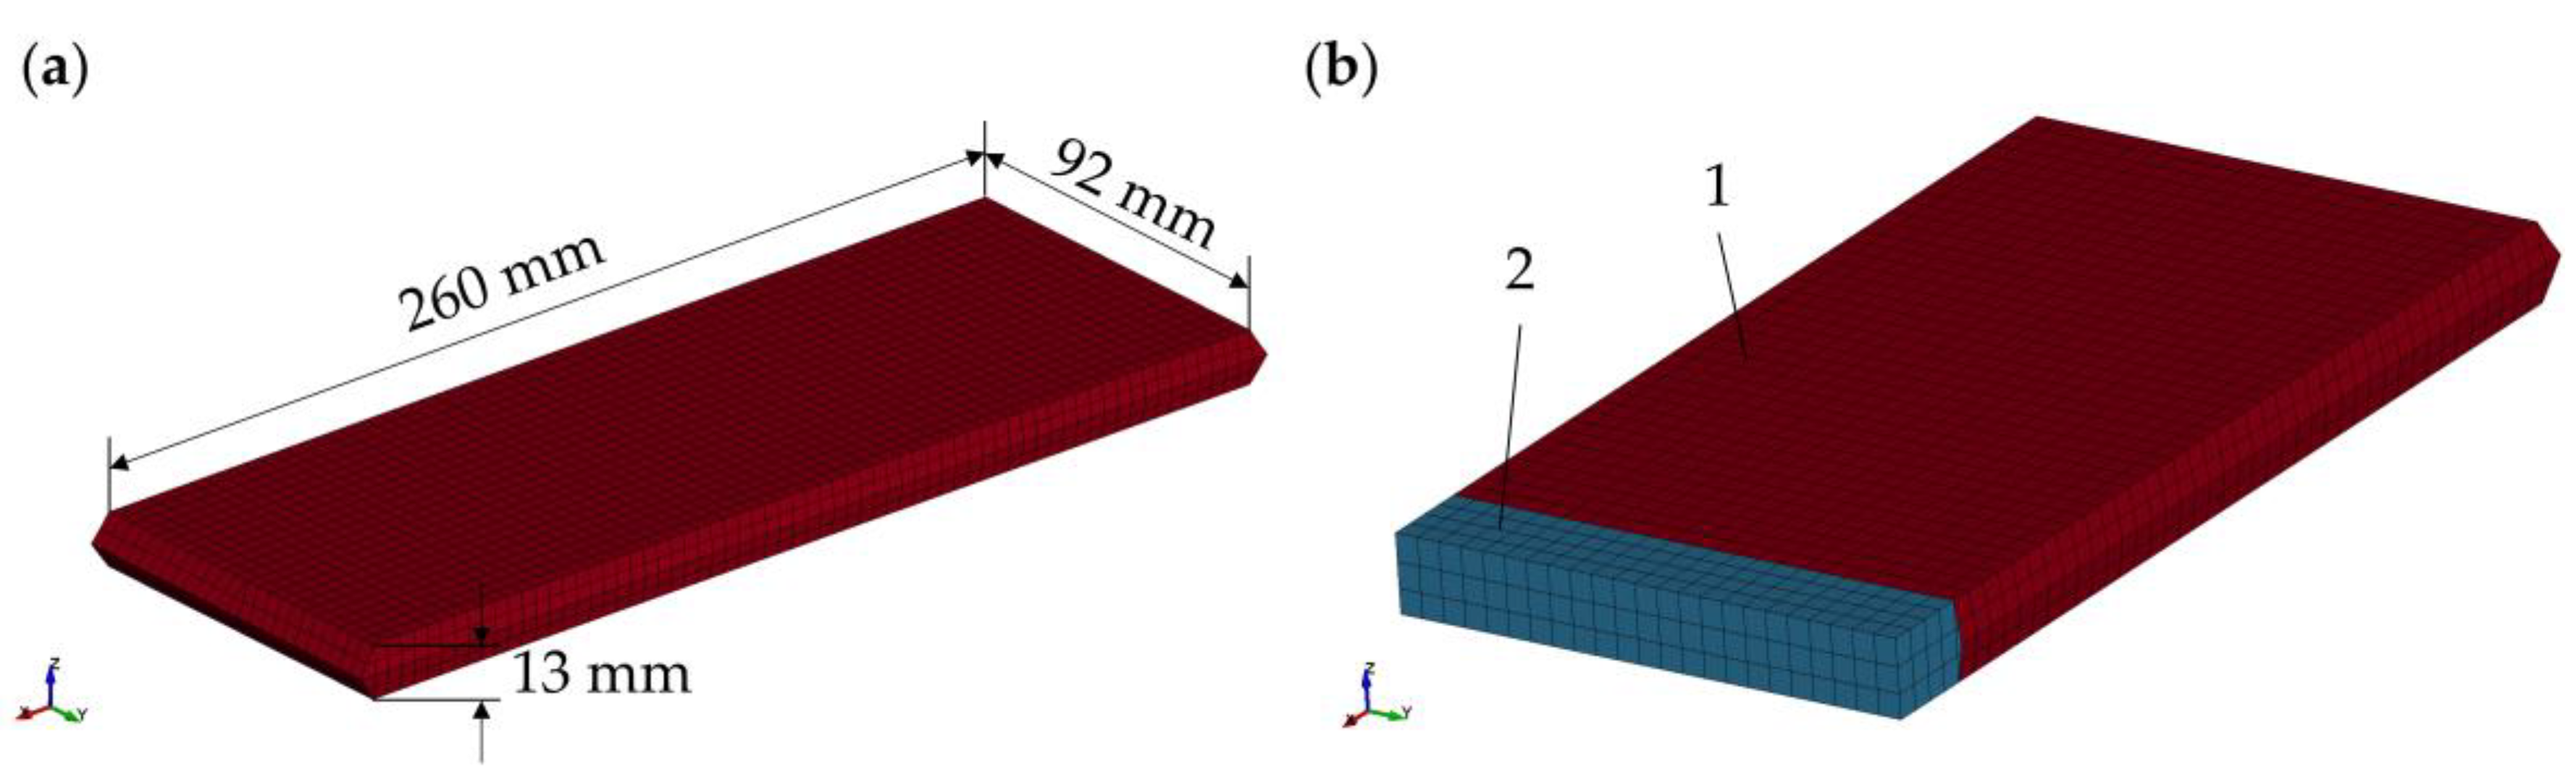
The jellyroll had a dimension of 260 × 92 mm and a homogeneous thickness of 13 mm; see Figure 1a. The jellyroll was modelled with solid, fully integrated 8-node hexahedron elements *SECTION_SOLID ELFORM = 2 with an element length of 4 mm. Three element layers were used to model the thickness direction (-direction) of the pouch cell. Fully integrated elements were used to avoid hourglassing when applying a stress-free expansion to the jellyroll.
The pouch foil consisted of fully integrated 4-node Belytschko-Tsay membrane elements *SECTION_SHELL ELFORM = 9 with an element length of 4 mm. The pouch foil was investigated with a microscopic section and the measured thickness of 0.14 mm was assigned to the membrane elements, accordingly.
The nodes of the jellyroll’s top and bottom were coincident with the nodes of the pouch foil and were merged together; see Figure 1b.
A Python script was developed to manipulate the input file of the basis geometry and change the thickness of the jellyroll. This allowed for the creation of an SOC-dependent geometry. The thickness could be increased either homogeneously (HE model) or varying over the surface (LE model) to map the surface unevenness of the pouch cell. In former studies, the local thickness as a function of the coordinates of the investigated pouch cell was measured at 0%, 30%, 60%, 90%, and 100% SOC and the thickness in the center was measured continuously [22]. The central thickness was used to estimate the local thickness for an arbitrary SOC. The central thickness was interpolated by a third-degree polynomial according to Equation (2).
The central thickness was divided into four sections according to the measured SOC. The interpolation parameters were chosen to achieve a steady curve between the four sections. A normalization of the central thickness was performed in order to calculate the interpolation weights . The interpolation weights were then used to derive the local thickness for an arbitrary SOC according to Equation (3). A weighted interpolation with the measured local thickness at the described SOC was used.
Linear interpolation was used to map the local thickness from the measurement grid onto the finite element mesh. The Python script replaced the thickness by symmetrically shifting the nodes in z-direction according to the calculated SOC-dependent thickness.
2.2. Expansion Model Calibration
Three model types were introduced and assigned an initial geometry with the relation according to Equation (2). A local expansion (LE) model, a homogeneous expansion (HE) model and a basis model (BM) without the ability to expand. The HE model and the BM were calibrated with the average thickness calculated by the arithmetic mean of the 175 measurement points of the surface measurement from [22]. No surface unevenness was mapped for the HE model and the BM using the average thickness.
In LS-DYNA, the thickness change caused by reversible swelling was achieved by thermal expansion. Thermal expansion is analogous to reversible swelling and the same approach can be found in the literature [36,39,40]. In this case, the temperature corresponds to the SOC and the thermal expansion factor to the volumetric expansion factor . The keyword *MAT_ADD_THERMAL_EXPANSION was used in order to decouple the mechanical material model from the expansion model. The keyword allows for the assignment of a temperature-dependent orthotropic expansion. The volumetric expansion factor was calculated according to Equation (4) and describes the local change rate in volume with respect to the SOC. A polynomial of third degree was chosen for the approximation of the central thickness to achieve smoothness of the volumetric expansion factor . This allows for a smooth derivation of the volumetric expansion factor with respect to SOC, making the numerical simulation more stable by avoiding oscillations due to unsteadiness.
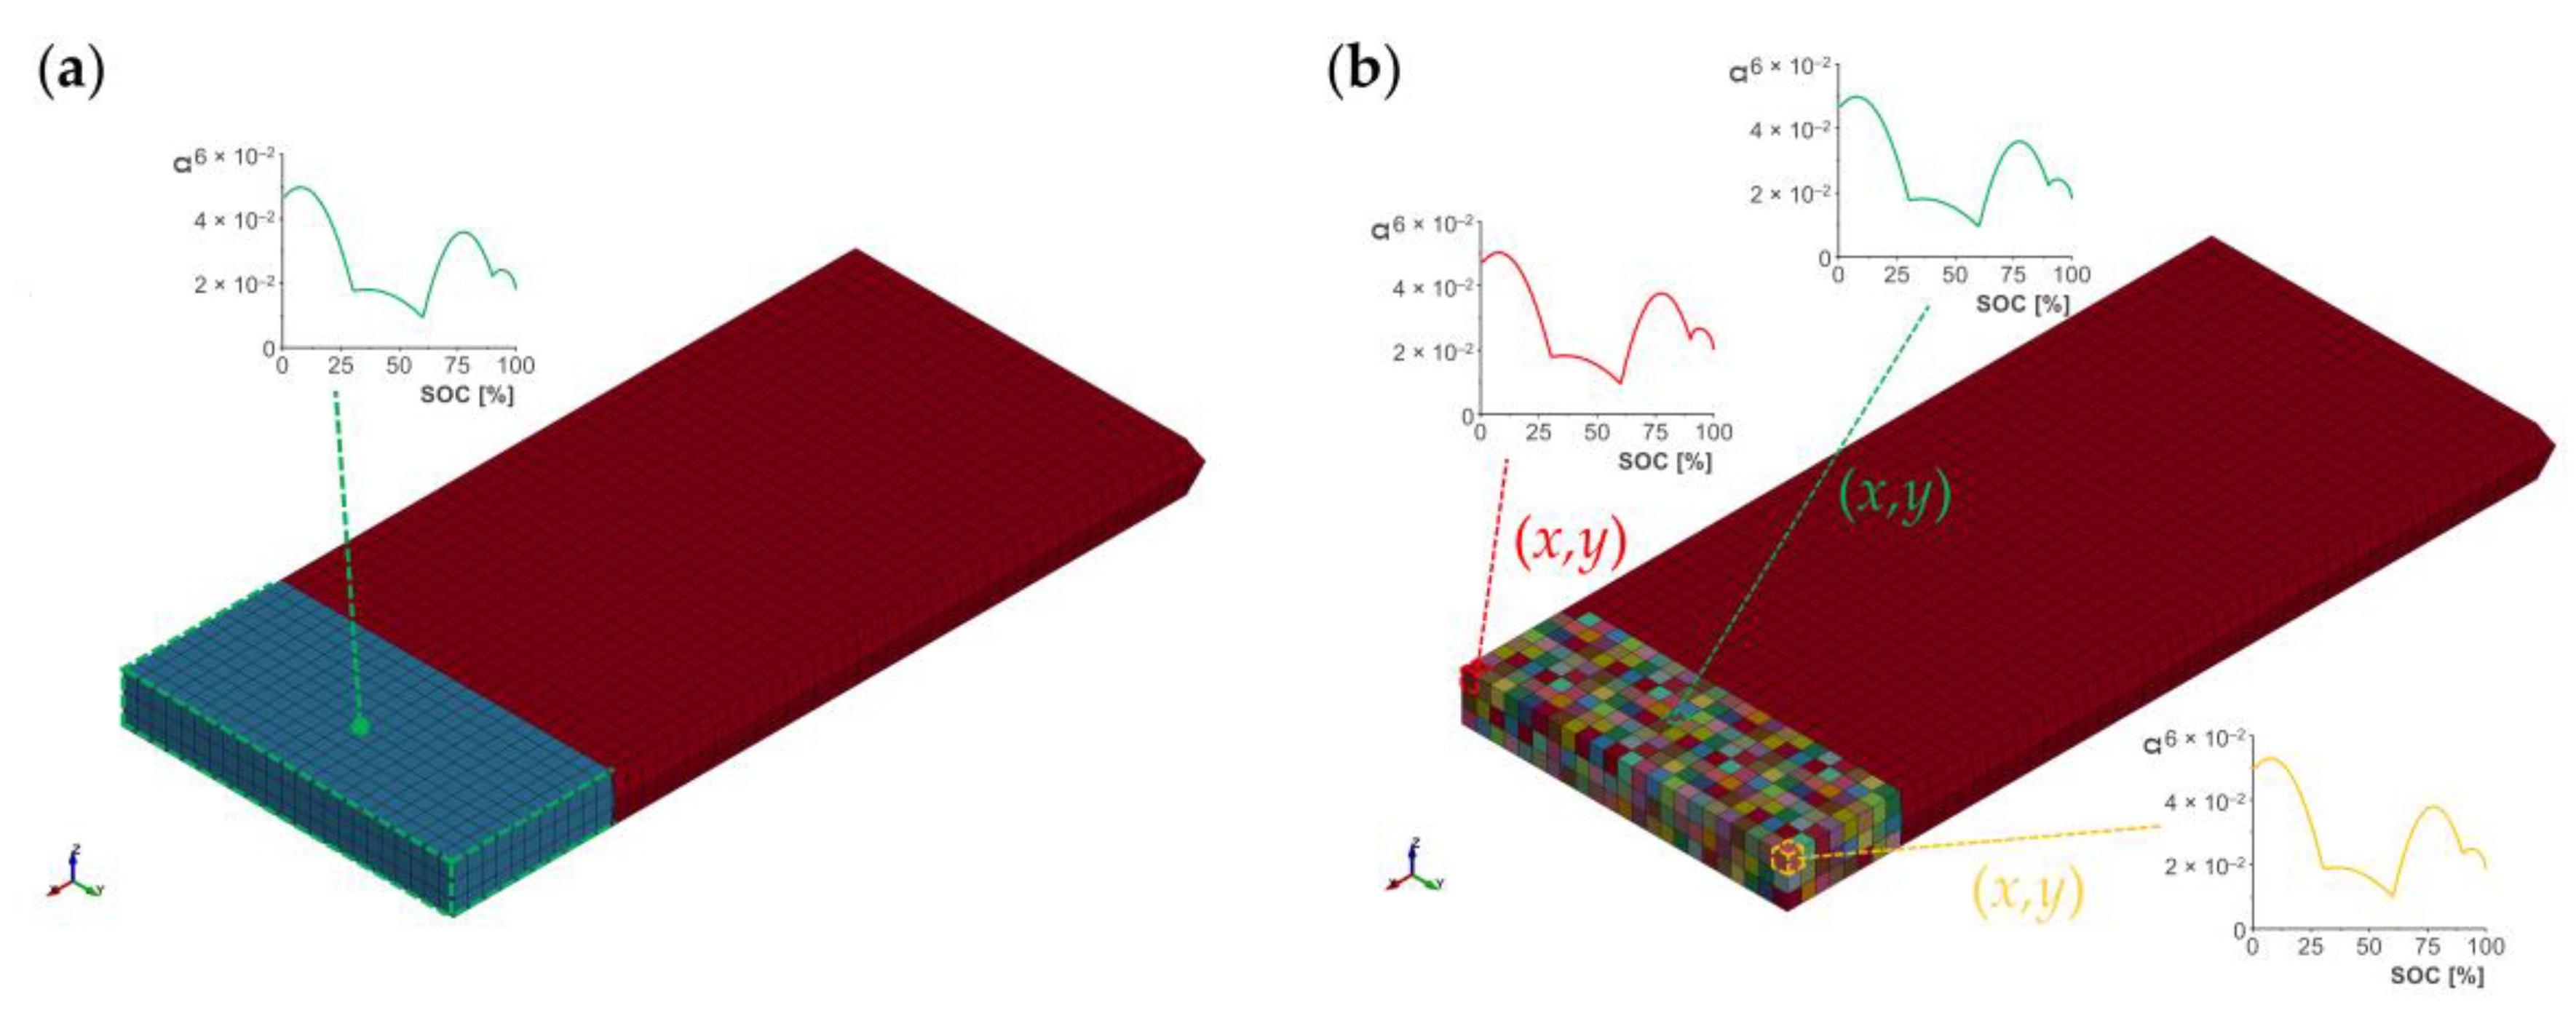
The relation of the local volumetric expansion factor and SOC was stored for each coordinate in form of an unique load curve (LCID); see Figure 2b. The LCID was connected to the thermal expansion material and refers to a part (PID). Each element was assigned a unique PID connected to the corresponding LCID of the thermal expansion allowing for the definition of a LE model. In the case of the HE model, the average thickness was used instead of the local thickness and a global volumetric expansion factor was defined; see Figure 2a.
Damping was applied in LS-DYNA to avoid oscillations of the nodes when the pouch cell expanded. A system damping constant (VALDMP) of 10 was found reasonable for the further investigations.
2.3. Material Model Calibration
The mechanical properties of the pouch foil were modelled with a linear elastic material model with linear plasticity *MAT_PIECEWISE_LINEAR_PLASTICITY. The material model was calibrated with tension tests of the pouch foil.
The jellyroll was modelled with a honeycomb material model *MAT_HONEYCOMB, which allowed for the definition of material anisotropy. The material model was calibrated with quasi-static compression tests of pouch cells performed without any constraints or preload forces [44].
The calibration simulation consisted of the indentation of a LE model with 0% SOC. The indenter was a flat-end cylinder with 50 mm in diameter and was modelled as a rigid part, *MAT_RIGID, with 4-node shell elements with full integration *SECTION_SHELL ELFORM = 16. The indenter indented the pouch cell lying on a rigid plate *MAT_RIGID by applying a prescribed motion; see Figure 3a. The contacts were modelled with a single surface contact *CONTACT_AUTOMATIC_SINGLE_SURFACE.
The same density was chosen for the pouch foil and the jellyroll as a clear distribution of the mass is not possible with the merged nodes. The density was calculated with 2.668 × 10⁻⁶ kg mm−3 in order to achieve the total mass of the pouch cell of 887.7 g.
2.4. Model Validation and Short Circuit Prediction
In order to validate the LE model, HE model, and BM, further indentation simulations were performed according to experiments performed in a previous study [44]. The pouch cell was placed between two rigid plates, *MAT_RIGID, used to apply a preload force of 300 N or 4000 N. A discrete spring element with a stiffness of 380 N mm−1 was used to apply the preload force on the pouch cell at 30% SOC according to the performed experiments [44]. The discrete spring element was attached to the center of the top plate and to an additional node moving the distance in order to apply the preload; see Figure 3b. The SOC of the pouch cell was adapted to 0%, 30%, 60%, and 100% by changing the temperature after the application of the preload force. The indenter indented the pouch cell after setting the SOC. The same contact definitions were used as for the mechanical calibration, and the indenter had no contact defined with the top plate and was able to move through the top plates geometry. Figure 3b illustrates the setup in the simulation model. The simulations were performed with the LE model, HE model, and without the SOC influence by simulations with the BM.
The simulation results and the corresponding experiments were used to derive a short circuit criterion. Different stress-based and strain-based criteria were evaluated in order to determine a possible improvement of the prediction quality by implementing an expansion model. The indentation at a voltage drop of 0.05 V (dVdrop) from the experiments was used as point of failure [44]. The elements of the indented area were used to derive the equivalent von Mises stress , the maximum principal stress , the minimum principal stress , the equivalent von Mises strain , the maximum principal strain and the volumetric strain . The values found at 0% SOC and without preload force were used as reference to determine the prediction quality to the other simulations (30%, 60%, and 100% SOC).
3. Results and Discussion
3.1. Expansion Model Calibration
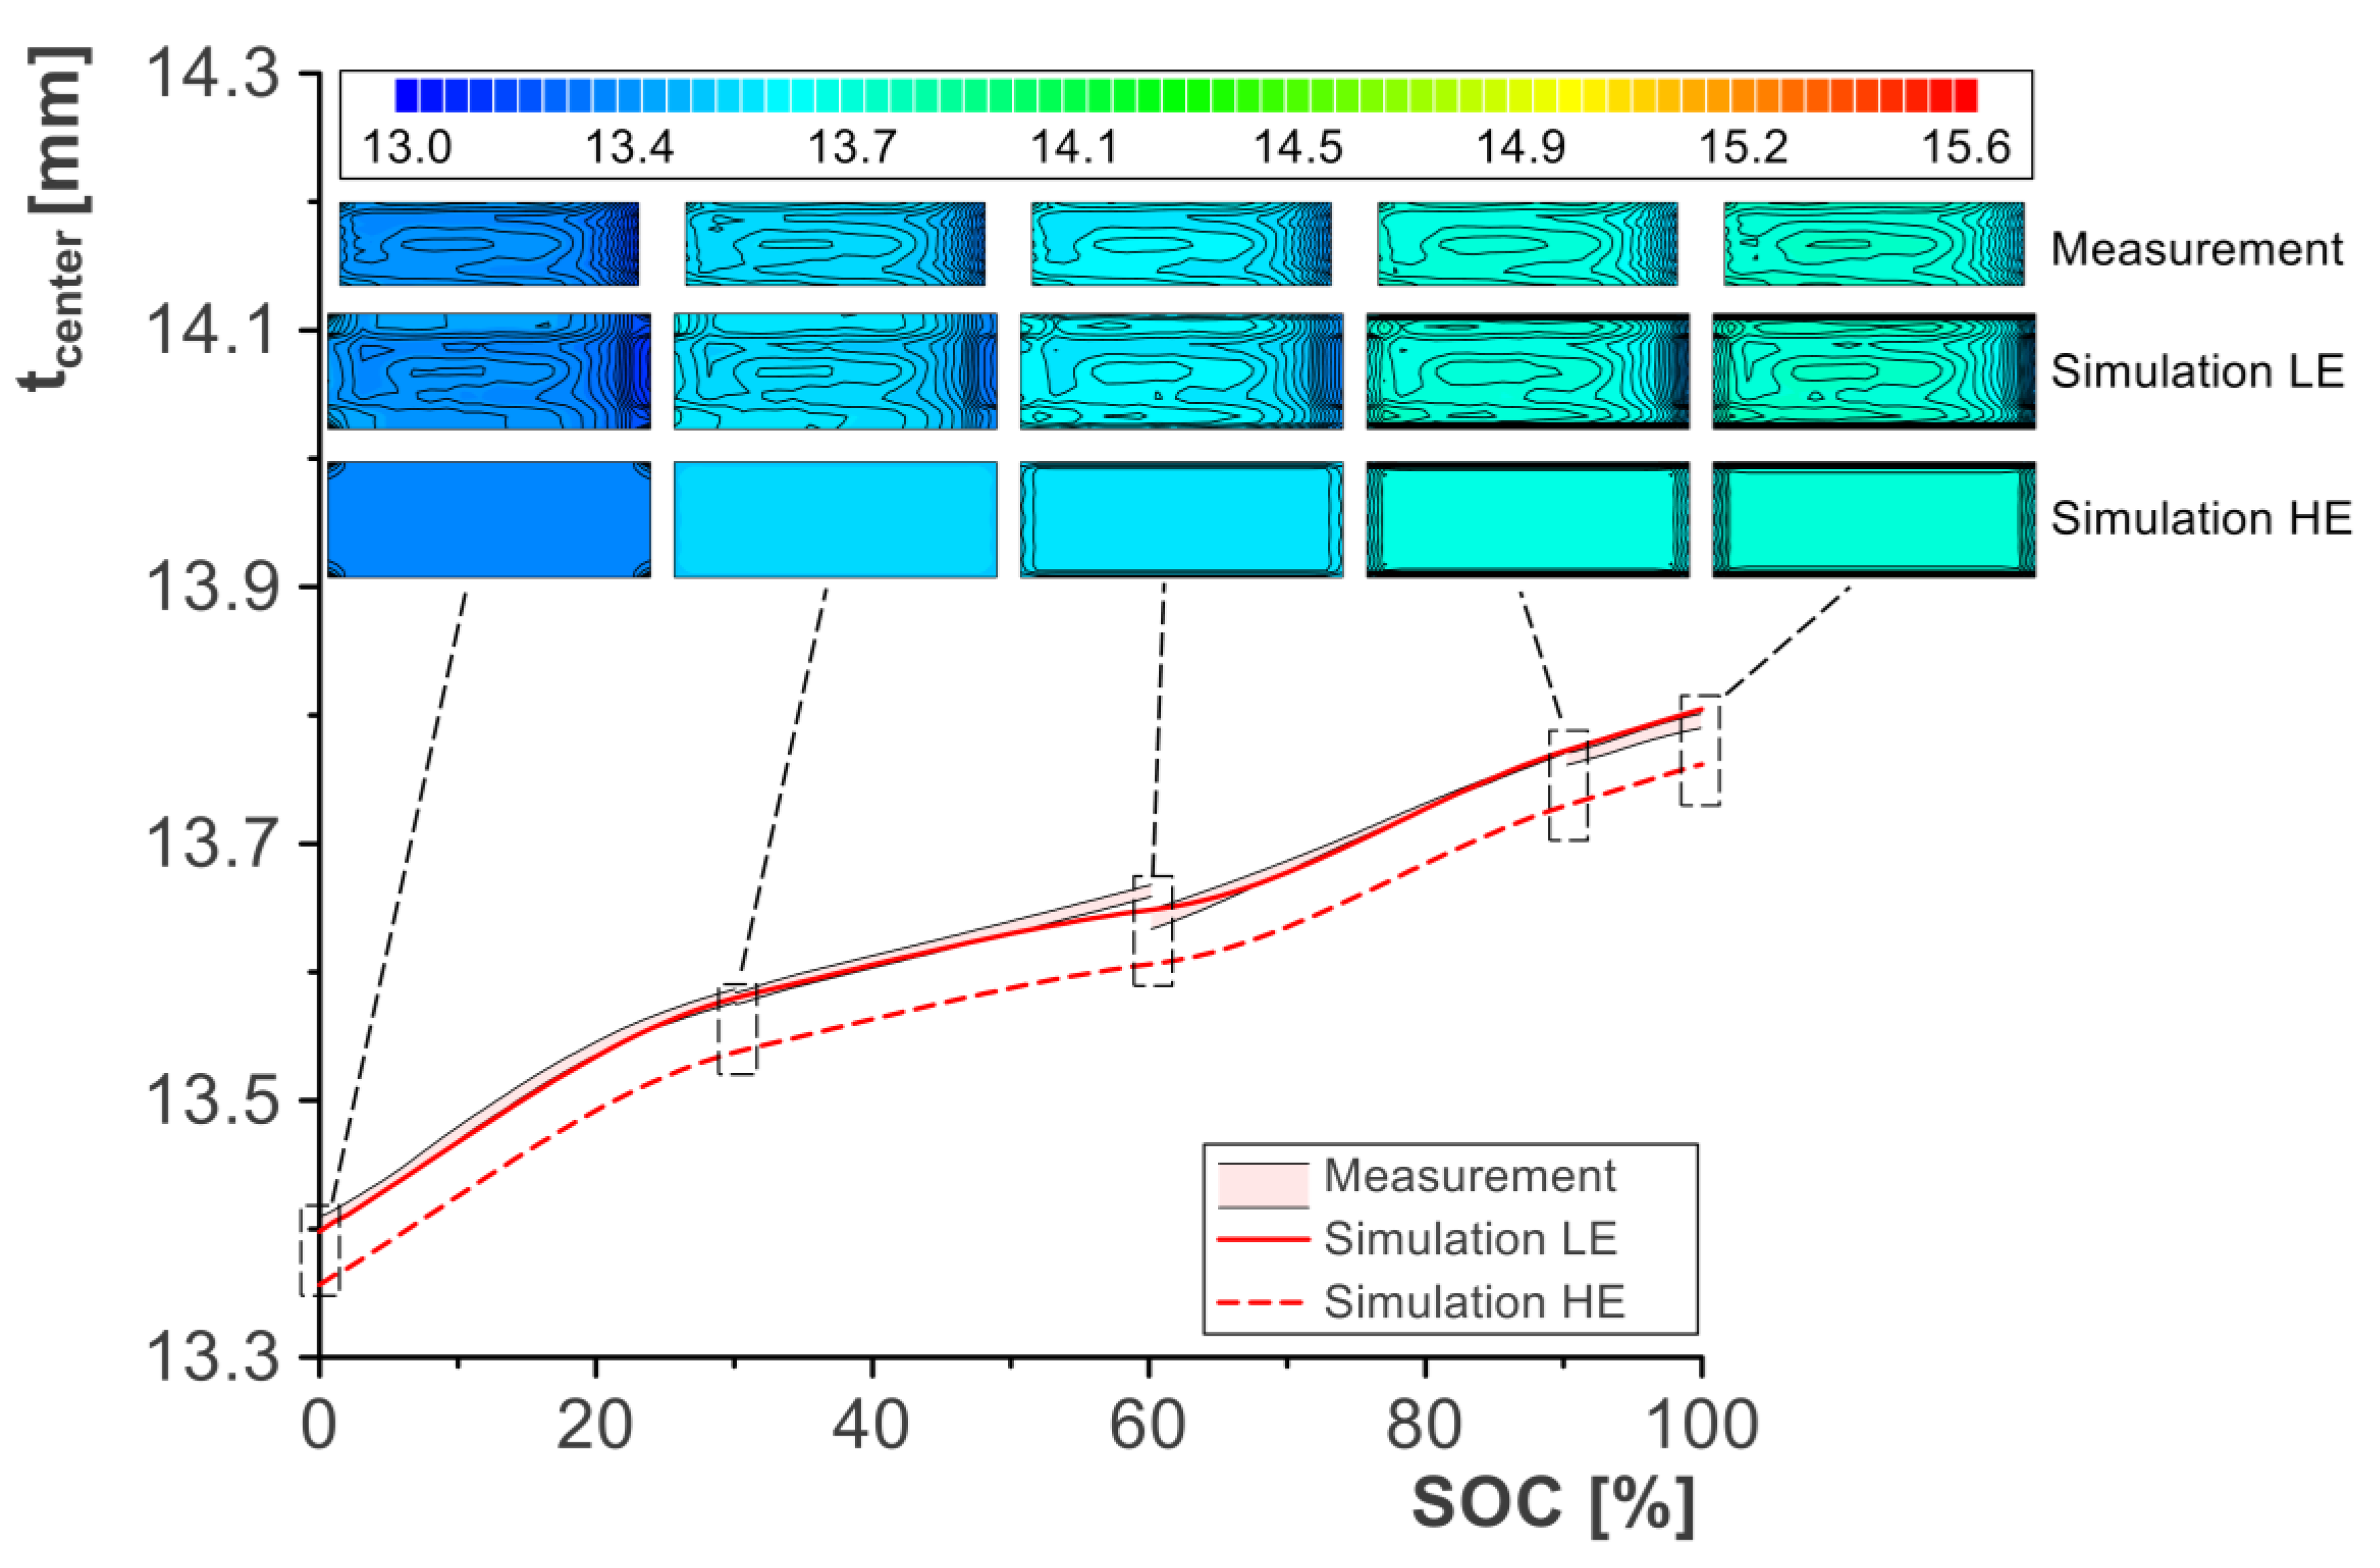
Figure 4 illustrates the corridor of the measured central thickness [22] and the simulation results of the SOC-dependent expansion for the LE model and the HE model. The measurement data indicated an unsteady course resulting from the relaxation period before the local thickness measurement at the different SOCs (0%, 30%, 60%, 90%, 100%). The expansion model was calibrated to produce a steady and smooth curve. The central thickness of the LE model was mostly within the measurement data corridor. The central thickness is off for the HE model. Averaging the local thickness introduced an offset to the measurement data. However, the HE model was able to follow the trend of the measurement data.
The local thickness of the LE model corresponded to the one measured on the pouch cells. The calibration procedure and the assignment of volumetric expansion factors for each coordinate worked as intended. The local thickness of the whole pouch cell’s surface was not measured in the experiment. The LE model used the nearest neighbor method to assign a volumetric expansion factor outside of the measured coordinates. The obtained results were plausible but are not of interest as the indentation is applied to the center of the pouch cell.
The local thickness of the HE model indicated a homogeneous expansion as intended. The pouch foil, however, restricted the expansion on the edges of the pouch cell. This restriction resulted in a lower expansion on the edges.
Overall, the introduction of an SOC-dependent expansion model can be realized with thermal expansion by calibration with surface measurements at several SOCs. The pouch foil must be modelled in more detail when the edges of the pouch cell are of interest.
3.2. Material Model Calibration
The mechanical parameters for the honeycomb material can be taken from Table 1. The calibration was performed with the LE model at 0% SOC. The Young’s modulus at full compaction and the Poisson’s ratio were defined with 1.35 GPa and 0.1. The relative volume at full compaction of elements was selected as 0.1. The Young’s moduli and the shear moduli for the uncompressed material were defined for all material directions with 0.127 GPa. Figure 5a illustrates the fitted yield-stress–load curve as a function of the volumetric strain. The same fitted material properties were assigned to the HE model and the BM.
Figure 5b illustrates the corridor of measurement data and the mechanical calibration results for the indentation of an unconstrained pouch cell. The LE model, HE model, and BM indicated a good fit to the measurement data for the fitted material properties staying mostly within the measurement data corridor.
The force–displacement curves of the HE model and the BM deviated slightly from that of the LE model. This small deviation of the HE model and BM from the LE model suggested that the local differences in geometry have only a minor impact on the mechanical behavior when no preload force is applied. It can be noted that the HE model and the BM were slightly stiffer for small indentation. Mechanically, the LE model reacted more softly, as the surface unevenness was flattened in the first phase of the indentation. The surface unevenness of the LE model resulted in a gradually building up contact of the indenter as some nodes in the indentation area were closer to the indenter than others. The HE model and BM had no surface unevenness and the indenter was directly applying a homogeneous load on the pouch cell’s surface.
3.3. Model Validation
Figure 6 illustrates the simulation results with the LE model, HE model, and BM and a comparison to the measurement data [44] for different SOC and preload force levels . The BM had the same results for all tested SOCs, as it served as a reference model without expansion model. A mechanical stiffening was observed for all three model types for an SOC of 0% and 30% when increasing the preload force ; see Figure 6a,b. The application of a preload force caused a pre-compaction of the jellyroll. The pre-compaction results in internal stress creating a shift in the yield–stress curve allowing for a mechanical stiffening in the simulation and mapping the observed behavior from the measurement data [44].
The difference between the force–displacement curves for a preload force of 300 N and 4000 N reduced at 60% and 100% SOC; see Figure 6c,d. The expansion caused by the SOC-dependent-thickness increase introduced a positive volumetric strain to the elements of the jellyroll. This increase in volumetric strain before indentation lead to an offset in the load curve defined within the material model. A softer mechanical behavior was the result of this offset, leading to a smaller difference in the force–displacement curves for simulations performed with a preload force of 300 N or 4000 N. Especially at 100% SOC, the thickness increase of around 2.9% was significant and caused a non-negligible change in volumetric strain before indentation.
The HE model indicated a slightly stiffer mechanical behavior in comparison to the LE model at 0% SOC and a preload force of 300 N. Increasing the preload force to 4000 N lead to a similar stiffness for the HE and LE model. As described in the material calibration section, the unevenness of the LE model’s surface resulted in a softer mechanical behavior for small mechanical loads. Increasing the preload force flattened the surface unevenness making it comparable to the surface of the HE model.
The simulation results indicated a strong deviation from the measurement results for an SOC of 100%. In a previous study, it was found that the observed change in mechanical behavior can partly be attributed to chemical reactions happening before the mechanical failure [44]. At 100% SOC, a soft short circuit with high short circuit resistance occurred in the experiments before a voltage drop of 0.05 V, leading to an increase in temperature and chemical reactions such as SEI dissolution and gas formation. This effect could not be implemented in the simulation models presented in this study, as the exact failure mechanisms are unknown, explaining the deviation at 100% SOC.
Including the expansion model allowed us to influence the mechanical behavior on an SOC-dependent basis. The change in thickness caused an increase (charging) or decrease (discharging) in preload force as observed during the measurements [44]. However, the expansion model affected the volumetric strain in a way that a thickness increase caused a mechanical softening. The material model could be calibrated on an SOC-dependent basis to improve the quality of the simulation results.
3.4. Short Circuit Prediction
The baseline of the investigated short circuit criteria was set for the simulations performed at a preload force of 0 N and an SOC of 0%. A small deviation from the baseline value for the other preload force levels and SOCs is preferable and indicates a suited prediction criterion. Table 2 illustrates the investigated short circuit criteria with the baseline value for the three model types and the average and maximum deviation from the baseline value for the other preload force levels and SOCs. The simulations with 100% SOC revealed a discrepancy to the measurement data as described before. It was therefore expected that the 100% SOC simulations generate a large deviation to the baseline values of the short circuit criteria.
The strain-based short circuit criteria indicated a large deviation from the baseline except from the maximum principal strain . The maximum principal strain considers the most positive strain (tensile) within an element. The other strain-based short circuit criteria performed worse, as the positive strains related to the expansion of the expansion model were not offset. A distinction between strains caused by mechanical compression and expansion would be necessary to increase the prediction quality and reduce deviations from the baseline value. The positive expansion strain is already contained in the case of the maximum principal strain by considering the most positive strain. However, in more complex loading conditions (general three-dimensional stress state) the maximum principal strain is expected to perform as badly as the other strain-based criteria.
The stress-based short circuit criteria indicated a better performance except from the maximum principal stress with an average deviation of at least 8.8%. The equivalent von Mises stress and the minimum principal stress have the smallest deviations from the baseline value. In the case of the stress-based criteria, the expansion is stress-free. This means that if the expansion is not constrained, no stress is introduced into the elements. Applying a constraint lead to a compressive stress when the pouch cells expanded. Additionally, the load case observed in this study is mainly compressive. This is the reason why the minimum principal stress performed best as a short circuit criterion. Both the expansion of the constrained pouch cell and the indentation cause a compressive stress that is considered by the minimum principal stress .
The minimum principal stress had the lowest average and maximum deviation for the LE model, HE model, and BM and was therefore selected for the prediction of a short circuit. A baseline value of −79 MPa was used for the HE model and BM and −80 MPa was used for the LE model.
Considering the expansion model, the introduction of a local expansion or a homogeneous expansion to the numerical simulation model improved the short circuit prediction when compared to the BM if the 100% SOC simulations are not considered. An average improvement of 0.8% and 0.7% was observed for the LE and HE model in comparison to the BM, respectively. Both the average and maximum deviation of the LE and HE were lower when compared to the BM. The difference between the HE model and the LE model was 0.1% and 0.3% for the average and maximum deviation from the baseline value.
In the case of the LE model, the deformation history of the single elements in the indentation area is more realistic. The surface unevenness mapped with the LE model results in a gradually building up contact with elements being directly in contact and other elements being unloaded in the beginning. The HE model and the BM did not map the surface unevenness, making the elements in the indentation area deform symmetrically with the same deformation history. The short circuit criterion is highly dependent on the deformation history as it considers only the element with the highest defined equivalent quantity (e.g., minimum principal stress ). Therefore, the LE model is favorable as it describes a more realistic deformation pattern.
Table 3 illustrates a comparison between the predicted and the measured indentation at which an internal short circuit occurred. The short circuit prediction performed well without the consideration of the 100% SOC cases. The deviation of the short circuit indentation did not directly correspond to the deviation found for the short circuit criterion but followed the same trend. The deviation did not directly correspond as the values compared with each other differ in magnitude.
The predicted short circuit indentation with the LE model had a maximum positive deviation of +2.4% and a maximum negative deviation of −6.3% without consideration of 100% SOC cases. The HE model had a maximum positive deviation of +1.7% and a maximum negative deviation of −5.3%. The BM has a maximum positive deviation of +0.3% and a maximum negative deviation of −6.6%. A positive deviation indicates a short circuit that is predicted for a larger indentation than measured. This means that the safety of the pouch cell is overestimated. A negative deviation indicates a short circuit that is predicted too early, introducing a safety margin when making statements about the failure limits.
4. Limitations
The material model was influenced by the introduction of an SOC-dependent expansion. The expansion caused a positive volumetric strain, , that is an input parameter of the honeycomb material model. A more suitable material description may be included in the simulation model as the expansion model is decoupled from the material model. Expansion-related and mechanical-load-related strains might be stored as separate variables to be more flexible regarding the short circuit criteria (offset of stress-free strain) and the modelling of mechanical properties.
At 100% SOC, a deviation of the presented simulation approach occurred when compared to the measurement results. The change in mechanical behavior found for experiments with 100% SOC was a result of consecutive failure mechanisms (e.g., soft short circuit, SEI dissolution) that are still under investigation and could therefore not be implemented in the presented simulation approach.
The short circuit criterion was selected based on a compression dominant mechanical load. Additional load cases have to be tested to verify the selection. However, in the case of compressive loads, the minimum principal stress is expected to achieve good accuracy in short circuit prediction. Preload force and SOC-dependent and lifetime-dependent changes to the preload force can be tracked with the minimum principal stress , as these mechanical loads are compressive.
5. Conclusions
In this study, an expansion model being able to map reversible swelling mechanisms was introduced to a state-of-the-art simulation model (basis model—BM) of a pouch cell. Reversible swelling causes SOC-dependent thickness variations, potentially causing internal stress to constrained battery cells. Two different approaches were selected to map the thickness variations: a local expansion (LE) model mapping the local thickness measured in previous experiments or a homogeneous expansion (HE) model mapping the averaged local thickness. Different short circuit criteria were investigated based on mechanical out-of-plane abuse tests including a preload force on the pouch cell. The prediction quality of the LE model and HE model was compared with the BM in order to evaluate the necessity and potential advantages of the implementation of an expansion model.
The calibration of the expansion model confirmed the usability of a thermal expansion model for the purpose of mapping reversible swelling mechanisms on the cell level. The expansion introduced a positive volumetric strain to the elements of the jellyroll. This stress-free expansion affected the honeycomb material model used to map the mechanical properties of the jellyroll. The interference with the material model caused a mechanical softening of the jellyroll for an SOC of 60% and 100%. A mechanical calibration at different SOCs or an offset of the stress-free volumetric strain can address this.
The HE model and the BM showed a slightly stiffer mechanical behavior at low mechanical loads when compared to the LE model. The unevenness of the LE model’s surface has to be flattened, making it initially softer than the other two approaches and representing a more realistic representation of the pouch cell investigated.
In terms of the short circuit prediction, the minimum principal stress as a stress-based short circuit criterion achieved the best performance. Including the LE model improved the accuracy on average by 0.8% when compared to the BM. However, the difference in average deviation between the LE model and HE model was only 0.1%.
The conclusions that can be drawn from the presented study are summarized as follows:
- An expansion model can be implemented independently on the material model and introduce SOC-dependent thickness variations. Thermal expansion can be used to achieve this behavior in a standard FE solver.
- The implementation of an expansion model did not improve the mechanical behavior of the pouch cell but can be used to predict the internal stress of constrained battery cells, especially an excessive thickness increase as can be observed during electrochemical cycling. This has to be mapped in order to include the stiffening by rising internal stress, making the implementation of an expansion model inevitable.
- The implementation of an expansion model improved the prediction quality of the internal short circuit criterion when compared to a state-of-the art simulation model (BM). The difference between the LE and HE model was negligible. However, the LE model mapped the surface unevenness of the pouch cell that affects the mechanical behavior (e.g., deformation history, deformation pattern), and through that the short circuit prediction. Additionally, the LE model is preferred as it provides more realistic results in the low-deformation domain that is relevant for the normal operation of a battery cell.
The results of this study revealed the benefits and drawbacks of the implementation of an expansion model. In some cases where a strong inhomogeneity of the battery cell’s surface or excessive thickness increase (e.g., electrochemical aging) is expected, the implementation of a local expansion model is beneficial. The local expansion model might also be beneficial for low mechanical loads that can be found for battery-lifetime estimations, as it maps the surface unevenness causing softer mechanical behavior. However, the homogeneous expansion model was accurate enough to describe mechanical changes under conditions of mechanical abuse caused by SOC-dependent thickness variations. In general, it is desirable to map the mechanical properties of a battery cell correctly and to avoid an overestimation of the safety of battery cell by neglecting preload force and internal stress variations of constrained pouch cells. The implementation of an expansion model can contribute to this aspiration and should be investigated in greater depth in the future.
Author Contributions
Conceptualization, P.H. and C.E.; methodology, P.H.; validation, P.H.; formal analysis, P.H. and C.E.; investigation, P.H.; writing—original draft preparation, P.H.; writing—review and editing, P.H. and C.E.; visualization, P.H.; supervision, C.E.; project administration, C.E.; funding acquisition, P.H. and C.E. All authors have read and agreed to the published version of the manuscript.
Funding
The presented work was conducted within the scope of the research project BonuS in cooperation with the Institute for Chemistry and Technology of Materials at Graz University of Technology and AVL List GmbH, Graz. BonuS has received funding from AVL List GmbH, Graz and the Austrian Research Promotion Agency (FFG) (Grant agreement No. 874834).
Institutional Review Board Statement
Not applicable.
Informed Consent Statement
Not applicable.
Data Availability Statement
The data presented in this study are available on request from the corresponding author. The data are not publicly available due to privacy restrictions.
Acknowledgments
Open Access Funding by the Graz University of Technology.
Conflicts of Interest
The authors declare no conflict of interest.
Abbreviations
The following abbreviations are used in this manuscript:
| BM | basis model |
| EV | electric vehicle |
| HE | homogeneous expansion |
| LCID | load curve ID |
| LE | local expansion |
| LIB | lithium ion battery |
| PID | part ID |
| RVE | representative volume element |
| SEI | solid electrolyte interface |
| SOC | state of charge |
References
- Wang, Q.; Mao, B.; Stoliarov, S.I.; Sun, J. A review of lithium ion battery failure mechanisms and fire prevention strategies. Prog. Energy Combust. Sci. 2019, 73, 95–131. [Google Scholar] [CrossRef]
- Feng, X.; Ouyang, M.; Liu, X.; Lu, L.; Xia, Y.; He, X. Thermal runaway mechanism of lithium ion battery for electric vehicles: A review. Energy Storage Mater. 2018, 10, 246–267. [Google Scholar] [CrossRef]
- Zhu, J.; Wierzbicki, T.; Li, W. A review of safety-focused mechanical modeling of commercial lithium-ion batteries. J. Power Sources 2018, 378, 153–168. [Google Scholar] [CrossRef]
- Zhu, J. Standardizing mechanical tests on li-ion batteries to develop a useful cell-level model under extreme mechanical loads. J. Energy Storage 2023, 65, 107320. [Google Scholar] [CrossRef]
- Kermani, G.; Sahraei, E. Review: Characterization and Modeling of the Mechanical Properties of Lithium-Ion Batteries. Energies 2017, 10, 1730. [Google Scholar] [CrossRef] [Green Version]
- Liu, B.; Jia, Y.; Yuan, C.; Wang, L.; Gao, X.; Yin, S.; Xu, J. Safety issues and mechanisms of lithium-ion battery cell upon mechanical abusive loading: A review. Energy Storage Mater. 2020, 24, 85–112. [Google Scholar] [CrossRef]
- Schmid, A.; Raffler, M.; Dünser, C.; Feist, F.; Ellersdorfer, C. Two Modelling Approaches of Lithium-Ion Pouch Cells for Simulating the Mechanical Behaviour Fast and Detailed. In Proceedings of the 13th European LS-DYNA Conference 2021, Ulm, Germany, 5–6 October 2021. [Google Scholar]
- Li, W.; Zhu, J. A Large Deformation and Fracture Model of Lithium-Ion Battery Cells Treated as a Homogenized Medium. J. Electrochem. Soc. 2020, 167, 120504. [Google Scholar] [CrossRef]
- Kermani, G.; Keshavarzi, M.M.; Sahraei, E. Deformation of lithium-ion batteries under axial loading: Analytical model and Representative Volume Element. Energy Rep. 2021, 7, 2849–2861. [Google Scholar] [CrossRef]
- Kisters, T.; Kuder, J.; Töpel, A.; Langkemper, R.; Nau, S.; Schopferer, S. Strain-rate dependence of the failure behavior of Lithium-Ion pouch cells under impact loading. J. Energy Storage 2021, 41, 102901. [Google Scholar] [CrossRef]
- Kotter, P.; Kisters, T.; Schleicher, A. Dynamic impact tests to characterize the crashworthiness of large-format lithium-ion cells. J. Energy Storage 2019, 26, 100948. [Google Scholar] [CrossRef]
- Zhu, J.; Luo, H.; Li, W.; Gao, T.; Xia, Y.; Wierzbicki, T. Mechanism of strengthening of battery resistance under dynamic loading. Int. J. Impact Eng. 2019, 131, 78–84. [Google Scholar] [CrossRef]
- Raffler, M.; Sinz, W.; Erker, S.; Brunnsteiner, B.; Ellersdorfer, C. Influence of loading rate and out of plane direction dependence on deformation and electro-mechanical failure behavior of a lithium-ion pouch cell. J. Energy Storage 2022, 56, 105906. [Google Scholar] [CrossRef]
- Xing, B.; Xiao, F.; Korogi, Y.; Ishimaru, T.; Xia, Y. Direction-dependent mechanical-electrical-thermal responses of large-format prismatic Li-ion battery under mechanical abuse. J. Energy Storage 2021, 43, 103270. [Google Scholar] [CrossRef]
- Jantscher, K.; Breitfuß, C.; Miklau, M.; Ismail, K.; Dobusch, P. Virtual Detection of Mechanically Induced Short Circuits in a Cylindrical Lithium-Ion Battery Cell Based on Finite Element Simulation. Batteries 2021, 7, 79. [Google Scholar] [CrossRef]
- Lian, J.; Wierzbicki, T.; Zhu, J.; Li, W. Prediction of shear crack formation of lithium-ion batteries under rod indentation: Comparison of seven failure criteria. Eng. Fract. Mech. 2019, 217, 106520. [Google Scholar] [CrossRef]
- Li, R.; Li, W.; Singh, A.; Ren, D.; Hou, Z.; Ouyang, M. Effect of external pressure and internal stress on battery performance and lifespan. Energy Storage Mater. 2022, 52, 395–429. [Google Scholar] [CrossRef]
- Mukhopadhyay, A.; Sheldon, B.W. Deformation and stress in electrode materials for Li-ion batteries. Prog. Mater. Sci. 2014, 63, 58–116. [Google Scholar] [CrossRef]
- Sprenger, M.; Dölle, N.; Schauwecker, F.; Raffler, M.; Ellersdorfer, C.; Sinz, W. Multiscale Analysis and Safety Assessment of Fresh and Electrical Aged Lithium-Ion Pouch Cells Focusing on Mechanical Behavior. Energies 2022, 15, 847. [Google Scholar] [CrossRef]
- Deich, T.; Hahn, S.L.; Both, S.; Birke, K.P.; Bund, A. Validation of an actively-controlled pneumatic press to simulate automotive module stiffness for mechanically representative lithium-ion cell aging. J. Energy Storage 2020, 28, 101192. [Google Scholar] [CrossRef]
- Wünsch, M.; Kaufman, J.; Sauer, D.U. Investigation of the influence of different bracing of automotive pouch cells on cyclic liefetime and impedance spectra. J. Energy Storage 2019, 21, 149–155. [Google Scholar] [CrossRef]
- Michelini, E.; Höschele, P.; Heindl, S.F.; Erker, S.; Ellersdorfer, C. Experimental Investigation on Reversible Swelling Mechanisms of Lithium-Ion Batteries under a Varying Preload Force. Batteries 2023, 9, 218. [Google Scholar] [CrossRef]
- Li, R.; Ren, D.; Guo, D.; Xu, C.; Fan, X.; Hou, Z.; Lu, L.; Feng, X.; Han, X.; Ouyang, M. Volume Deformation of Large-Format Lithium Ion Batteries under Different Degradation Paths. J. Electrochem. Soc. 2019, 166, A4106–A4114. [Google Scholar] [CrossRef]
- Müller, V.; Scurtu, R.-G.; Richter, K.; Waldmann, T.; Memm, M.; Danzer, M.A.; Wohlfahrt-Mehrens, M. Effects of Mechanical Compression on the Aging and the Expansion Behavior of Si/C-Composite|NMC811 in Different Lithium-Ion Battery Cell Formats. J. Electrochem. Soc. 2019, 166, A3796–A3805. [Google Scholar] [CrossRef]
- Daubinger, P.; Ebert, F.; Hartmann, S.; Giffin, G.A. Impact of electrochemical and mechanical interactions on lithium-ion battery performance investigated by operando dilatometry. J. Power Sources 2021, 488, 229457. [Google Scholar] [CrossRef]
- Ali, Y.; Iqbal, N.; Lee, S. Inhomogeneous stress development at the multiparticle electrode of lithium-ion batteries. Int. J. Energy Res. 2021, 45, 14788–14803. [Google Scholar] [CrossRef]
- Zhang, S. Chemomechanical modeling of lithiation-induced failure in high-volume-change electrode materials for lithium ion batteries. npj Comput. Mater. 2017, 3, A137. [Google Scholar] [CrossRef] [Green Version]
- Xu, R.; Yang, Y.; Yin, F.; Liu, P.; Cloetens, P.; Liu, Y.; Lin, F.; Zhao, K. Heterogeneous damage in Li-ion batteries: Experimental analysis and theoretical modeling. J. Mech. Phys. Solids 2019, 129, 160–183. [Google Scholar] [CrossRef]
- Werner, M.; Pandolfi, A.; Weinberg, K. A multi-field model for charging and discharging of lithium-ion battery electrodes. Contin. Mech. Thermodyn. 2021, 33, 661–685. [Google Scholar] [CrossRef]
- Rieger, B.; Schlueter, S.; Erhard, S.V.; Jossen, A. Strain Propagation in Lithium-Ion Batteries from the Crystal Structure to the Electrode Level. J. Electrochem. Soc. 2016, 163, A1595–A1606. [Google Scholar] [CrossRef]
- Zhao, Y.; Stein, P.; Bai, Y.; Al-Siraj, M.; Yang, Y.; Xu, B.-X. A review on modeling of electro-chemo-mechanics in lithium-ion batteries. J. Power Sources 2019, 413, 259–283. [Google Scholar] [CrossRef]
- Brosa Planella, F.; Ai, W.; Boyce, A.M.; Ghosh, A.; Korotkin, I.; Sahu, S.; Sulzer, V.; Timms, R.; Tranter, T.G.; Zyskin, M.; et al. A continuum of physics-based lithium-ion battery models reviewed. Prog. Energy 2022, 4, 42003. [Google Scholar] [CrossRef]
- Clerici, D.; Mocera, F.; Somà, A. Electrochemical–mechanical multi-scale model and validation with thickness change measurements in prismatic lithium-ion batteries. J. Power Sources 2022, 542, 231735. [Google Scholar] [CrossRef]
- Gupta, P.; Gudmundson, P. A multi-scale model for simulation of electrochemically induced stresses on scales of active particles, electrode layers, and battery level in lithium-ion batteries. J. Power Sources 2021, 511, 230465. [Google Scholar] [CrossRef]
- Wu, B.; Lu, W. A battery model that fully couples mechanics and electrochemistry at both particle and electrode levels by incorporation of particle interaction. J. Power Sources 2017, 360, 360–372. [Google Scholar] [CrossRef]
- Oh, K.-Y.; Epureanu, B.I.; Siegel, J.B.; Stefanopoulou, A.G. Phenomenological force and swelling models for rechargeable lithium-ion battery cells. J. Power Sources 2016, 310, 118–129. [Google Scholar] [CrossRef] [Green Version]
- Jiang, Y.; Xu, J.; Hou, W.; Mei, X. A stack pressure based equivalent mechanical model of lithium-ion pouch batteries. Energy 2021, 221, 119804. [Google Scholar] [CrossRef]
- Oh, K.-Y.; Epureanu, B.I. A phenomenological force model of Li-ion battery packs for enhanced performance and health management. J. Power Sources 2017, 365, 220–229. [Google Scholar] [CrossRef]
- Chen, H.; Fan, J.; Zhang, M.; Feng, X.; Zhong, X.; He, J.; Ai, S. Mechanism of inhomogeneous deformation and equal-stiffness design of large-format prismatic lithium-ion batteries. Appl. Energy 2023, 332, 120494. [Google Scholar] [CrossRef]
- Zhong, X.; Yang, L.; Li, N.; Chu, Z.; Chen, J.; Zhu, S.; Song, W.-L.; Ai, S.; Chen, H.-S. In-situ characterizations and mechanism analysis of mechanical inhomogeneity in a prismatic battery module. J. Power Sources 2022, 548, 232053. [Google Scholar] [CrossRef]
- Louli, A.J.; Li, J.; Trussler, S.; Fell, C.R.; Dahn, J.R. Volume, Pressure and Thickness Evolution of Li-Ion Pouch Cells with Silicon-Composite Negative Electrodes. J. Electrochem. Soc. 2017, 164, A2689–A2696. [Google Scholar] [CrossRef]
- Niu, S.; Heng, S.; Zhu, G.; Xu, J.; Qu, Q.; Wu, K.; Zheng, H. Analysis on the effect of external press force on the performance of LiNi0.8Co0.1Mn0.1O2/Graphite large pouch cells. J. Energy Storage 2021, 44, 103425. [Google Scholar] [CrossRef]
- Li, W.; Xia, Y.; Zhu, J.; Luo, H. State-of-Charge Dependence of Mechanical Response of Lithium-Ion Batteries: A Result of Internal Stress. J. Electrochem. Soc. 2018, 165, A1537–A1546. [Google Scholar] [CrossRef]
- Höschele, P.; Heindl, S.F.; Erker, S.; Ellersdorfer, C. Influence of reversible swelling and preload force on the failure behavior of a lithium-ion pouch cell tested under realistic boundary conditions. J. Energy Storage 2023, 65, 107228. [Google Scholar] [CrossRef]
Figure 1.
(a) Dimension of the basis geometry, (b) Detailed cross-section of the basis geometry consisting of pouch foil (1) and homogenized jellyroll (2) with coinciding nodes.
Figure 1.
(a) Dimension of the basis geometry, (b) Detailed cross-section of the basis geometry consisting of pouch foil (1) and homogenized jellyroll (2) with coinciding nodes.

Figure 2.
(a) HE model with homogeneous expansion model for the jellyroll, (b) LE model with separate PID for each element with local volumetric expansion factor .
Figure 2.
(a) HE model with homogeneous expansion model for the jellyroll, (b) LE model with separate PID for each element with local volumetric expansion factor .

Figure 3.
Numerical model with pouch cell (1), indenter (2), rigid plates (3), node for preload application Fpre (4) and discrete spring element (5). (a) Indentation of unconstrained pouch cell for material calibration, (b) indentation with constrained pouch cell for model validation.
Figure 3.
Numerical model with pouch cell (1), indenter (2), rigid plates (3), node for preload application Fpre (4) and discrete spring element (5). (a) Indentation of unconstrained pouch cell for material calibration, (b) indentation with constrained pouch cell for model validation.

Figure 4.
Comparison between measurements and the LE model and HE model for the central thickness and local thickness . Heat map of the local thickness in mm.
Figure 4.
Comparison between measurements and the LE model and HE model for the central thickness and local thickness . Heat map of the local thickness in mm.

Figure 5.
(a) Load curve for material model describing the yield stress as function of the volumetric strain, (b) Force–displacement curve with the corridor of measurement results and simulation results with the LE model, HE model and BM.
Figure 5.
(a) Load curve for material model describing the yield stress as function of the volumetric strain, (b) Force–displacement curve with the corridor of measurement results and simulation results with the LE model, HE model and BM.

Figure 6.
Force–displacement curves of the LE model, HE model, and BM and corridor of measurement data for different preload forces and an SOC of (a) 0%, (b) 30%, (c) 60%, and (d) 100%.
Figure 6.
Force–displacement curves of the LE model, HE model, and BM and corridor of measurement data for different preload forces and an SOC of (a) 0%, (b) 30%, (c) 60%, and (d) 100%.


Table 1.
Fitted material parameters for a honeycomb material.
| Parameter | [kg mm−3] | [GPa] | [-] | [-] | [GPa] | [GPa] |
|---|---|---|---|---|---|---|
| 2.668 × 10⁻⁶ | 1.35 | 0.1 | 0.1 | 0.127 | 0.127 |
Table 2.
Short circuit criteria with baseline values and average (avg.) and maximum (max) deviation from the baseline value without consideration of simulations with 100% SOC and with consideration of 100% SOC in brackets.
Table 2.
Short circuit criteria with baseline values and average (avg.) and maximum (max) deviation from the baseline value without consideration of simulations with 100% SOC and with consideration of 100% SOC in brackets.
| Criterion | Model | Baseline | Deviation [%] | |||
|---|---|---|---|---|---|---|
| Avg. | Max | |||||
| [MPa] | LE | 78 | 2.0 | (3.3) | 5.0 | (8.6) |
| HE | 79 | 1.8 | (3.4) | 4.4 | (11.5) | |
| BM | 78 | 2.9 | (3.6) | 5.5 | (6.1) | |
| [Mpa] | LE | 13 | 8.8 | (11.0) | 16.5 | (21.1) |
| HE | 14 | 9.2 | (12.2) | 15.8 | (26.6) | |
| BM | 13 | 10.6 | (12.0) | 21.6 | (21.6) | |
| [Mpa] | LE | −79 | 1.5 | (2.7) | 3.8 | (8.1) |
| HE | −80 | 1.6 | (3.0) | 3.5 | (10.5) | |
| BM | −79 | 2.3 | (3.0) | 4.4 | (5.5) | |
| [-] | LE | 0.28 | 5.5 | (10.8) | 8.9 | (30.6) |
| HE | 0.29 | 6.4 | (11.8) | 9.0 | (35.1) | |
| BM | 0.27 | 8.6 | (10.3) | 17.1 | (17.1) | |
| [-] | LE | −0.45 | 4.4 | (9.4) | 7.7 | (27.5) |
| HE | −0.47 | 5.1 | (10.3) | 8.7 | (32.1) | |
| BM | −0.44 | 6.4 | (8.5) | 12.5 | (15.4) | |
| [-] | LE | 0.04 | 2.6 | (3.6) | 4.7 | (9.8) |
| HE | 0.04 | 2.6 | (3.9) | 4.6 | (12.6) | |
| BM | 0.04 | 2.0 | (3.6) | 4.6 | (9.1) | |
Table 3.
Indentation at short circuit for measurement [44] and for the simulation with the LE model, HE model, and BM. Deviation with respect to the measurement in brackets.
Table 3.
Indentation at short circuit for measurement [44] and for the simulation with the LE model, HE model, and BM. Deviation with respect to the measurement in brackets.
| SOC | Measurement [mm] | Simulation [mm] | |||
|---|---|---|---|---|---|
| LE | HE | BM | |||
| 0% | 0 N | 3.47 | - | - | - |
| 300 N | 3.38 | 3.27 (−3.4%) | 3.27 (−3.4%) | 3.33 (−1.5%) | |
| 4000 N | 3.06 | 3.13 (+2.4%) | 3.10 (+1.3%) | 3.07 (+0.3%) | |
| 30% | 0 N | 3.49 | 3.43 (−1.9%) | 3.50 (+0.3%) | 3.45 (−1.1%) |
| 300 N | 3.55 | 3.40 (−4.2%) | 3.47 (−2.4%) | 3.33 (−6.6%) | |
| 4000 N | 3.18 | 3.17 (−0.4%) | 3.23 (+1.7%) | 3.07 (−3.6%) | |
| 60% | 0 N | 3.64 | 3.55 (−2.5%) | 3.50 (−3.8%) | 3.45 (−5.5%) |
| 300 N | 3.52 | 3.30 (−6.3%) | 3.33 (−5.3%) | 3.33 (−5.7%) | |
| 4000 N | 3.21 | 3.20 (−0.3%) | 3.23 (+0.7%) | 3.07 (−4.6%) | |
| 100% | 0 N | 3.25 | 3.48 (+6.9%) | 3.48 (+6.9%) | 3.45 (+5.8%) |
| 300 N | 3.05 | 3.33 (+9.3%) | 3.33 (+9.3%) | 3.33 (+8.4%) | |
| 4000 N | 2.83 | 3.20 (+13.1%) | 3.33 (+17.8%) | 3.07 (+7.8%) | |
Disclaimer/Publisher’s Note: The statements, opinions and data contained in all publications are solely those of the individual author(s) and contributor(s) and not of MDPI and/or the editor(s). MDPI and/or the editor(s) disclaim responsibility for any injury to people or property resulting from any ideas, methods, instructions or products referred to in the content. |
© 2023 by the authors. Licensee MDPI, Basel, Switzerland. This article is an open access article distributed under the terms and conditions of the Creative Commons Attribution (CC BY) license (https://creativecommons.org/licenses/by/4.0/).
Share and Cite
MDPI and ACS Style
Höschele, P.; Ellersdorfer, C. Implementing Reversible Swelling into the Numerical Model of a Lithium-Ion Pouch Cell for Short Circuit Prediction. Batteries 2023, 9, 417. https://doi.org/10.3390/batteries9080417
AMA Style
Höschele P, Ellersdorfer C. Implementing Reversible Swelling into the Numerical Model of a Lithium-Ion Pouch Cell for Short Circuit Prediction. Batteries. 2023; 9(8):417. https://doi.org/10.3390/batteries9080417
Chicago/Turabian StyleHöschele, Patrick, and Christian Ellersdorfer. 2023. "Implementing Reversible Swelling into the Numerical Model of a Lithium-Ion Pouch Cell for Short Circuit Prediction" Batteries 9, no. 8: 417. https://doi.org/10.3390/batteries9080417
Note that from the first issue of 2016, this journal uses article numbers instead of page numbers. See further details here.