3.1. Study of Morphological Features and Phase Transformations in Nanostructures Depending on the Applied Potential Difference
Figure 2 reveals the results of the morphological features of the synthesized nanostructures for different applied potential differences. To visualize the resulting nanostructures, the polymer template was removed by chemical etching in a sodium hydroxide solution (5 M NaOH) at a temperature of 50 °C for 30 min. The conditions for polymer etching were chosen according to a priori experimental data, which showed that using this solution in the temperature range of 50–55 °C allows the removal of the polymer template without damaging the nanostructures, thereby freeing them from the polymer. To visualize the differences in the effect of applied potential differences on the formation of nanostructures and their packing density, two boundary points were chosen with the most characteristic differences in the morphology of nanostructures: 1.25 V and 2.5 V.
When it comes to nanostructures produced at applied potential differences of 1.25 V, the presented SEM images clearly show that the formation of nanostructures occurs from small grains with a rather loose packing and weak adhesion to each other, which leads to the formation of voids and pores. This effect can be attributed to the fact that, at low potential differences, the formation of grains at the stage of nanostructure growth proceeds at a low rate, which leads to the formation of voids that can be filled with microscopic solution drops during growth. The low growth rate of nanostructures is due to low current densities due to the low mobility of ions in solution, which results in a slow formation of grains from which nanowires are formed.
A rise in applied potential differences results in the formation of sufficiently dense structures highly resistant to mechanical stress, indicating sufficient strength. For example,
Figure 2b shows nanowires produced at a potential difference of 2.5 V, which have a fairly dense structure, without visible pores or voids in the composition, and also have sufficient strength, as evidenced by the resistance of nanostructures to bends and kinks, which are possible during chemical etching of polymer template matrices, as well as subsequent sample preparation for microstructural studies. It should also be noted that using polymer templates with a pore density of 4 × 10
7 pores/cm
2 makes obtaining arrays of ordered nanostructures at a sufficient distance possible.
The phase composition of the synthesized nanostructures and the processes of phase transformations as a result of the variation of applied potential differences was determined using the method of X-ray phase analysis.
Figure 3 demonstrates the results of the X-ray phase analysis of the studied nanostructures obtained by varying the applied potential differences.
The overall appearance of the presented X-ray diffraction patterns of the synthesized nanostructures depending on applied potential differences indicates several types of structural change processes that occur with an increase in applied potential differences. The first type is associated with the processes of phase transformations, the presence of which is evidenced by an alteration in the position of diffraction reflections, as well as the formation of new diffraction reflections, the appearance of which is observed on X-ray diffraction patterns obtained at potential differences above 1.75 V. The second type of change is associated with a change in the shape of diffraction reflections for the observed phases, which indicates the structural ordering degree alteration in the synthesized nanostructures.
When it comes to nanostructures produced at the applied potential difference of 1.25 V, the overall form of the X-ray diffraction pattern is characteristic of an X-ray amorphous substance with a low structural ordering degree. Moreover, the X-ray diffraction data for these samples are well-aligned with the results of scanning electron microscopy, according to which the nanostructures obtained at applied potential differences are porous amorphous-like structures consisting of small grains that do not have close packing.
When it comes to an applied potential difference of 1.25 V, according to the data of morphological studies, alongside X-ray phase analysis, it was found that the resulting nanostructures are highly disordered nanowires close to an amorphous structure. Moreover, the presence of porous inclusions in the composition of nanostructures indicates an unfinished crystal structure, which is an accumulation of weakly bound oxide nanoparticles of zinc and cobalt (according to the data of energy dispersive analysis). Such a structure of nanowires obtained with a difference in applied potentials is associated with the reduction potentials of zinc and cobalt from electrolyte solutions. At low values of the applied deposition potentials, the reduction rate is rather low, because of which the growth of nanostructures is accompanied by the incorporation of a large amount of oxygen into the crystal structure of the nanostructures being formed. In this case, a large amount of introduced oxygen leads to amorphization and disordering of the crystal structure of the formed nanowires.
In the case of growth in applied potential differences from 1.25 V to 1.5 V, the phase composition of the synthesized nanostructures is a combination of two phases: hexagonal CoO2 and hexagonal Zn. When it comes to samples produced at a potential difference of 1.5 V, weak, strongly broadened peaks are observed in the diffraction patterns, upon decomposition of which, using Gaussian functions, it was found that the broadening is associated with the presence of local maxima characteristic of the CoO2 and Zn phases. Estimation of phase contributions revealed that the dominant phase in the composition of nanostructures is the Zn phase (more than 90%), while the content of the CoO2 phase is no more than 9%. This dominance of the hexagonal Zn phase in the composition of the synthesized nanostructures is due to the predominance of the zinc reduction potential over the cobalt reduction potential, the formation of which at these potential differences is accompanied by the formation of an oxide phase.
A rise in the applied potential difference from 1.5 V to 1.75 V does not lead to the formation of new phases in the composition of nanowires, which indicates the absence of phase transformation processes in this range of applied potential differences. According to the data of X-ray phase analysis, it was found that the variation of the applied potential difference from 1.5 to 1.75 V does not lead to the appearance of new phases in the composition of nanostructures. At the same time, an increase in the applied potential difference leads to an almost twofold increase in the content of the CoO2 phase, the increase of which is associated with an increase in the influence of the cobalt reduction potential over the zinc reduction potential. Moreover, the formation of the CoO2 oxide phase is because at low rates of metal reduction and, as a result, the growth of nanostructures, oxygen ions can fill voids or vacancies during the formation of the crystal structure, thereby forming stable CoO2 oxide inclusions. However, the weight contributions of various phases demonstrated an increase in the content of the CoO2 phase in the composition of nanostructures, the content of which was more than 17%, corresponding to an almost twofold increase in its content and partial displacement of the Zn phase.
With an increase in applied potential differences to 2.0 V, the appearance of new diffraction reflections is observed in the X-ray diffraction patterns of the nanowires under study, which indicates the processes of phase transformations. The new diffraction reflections are characteristic of the cubic Co phase. At the same time, the main reflection at 2θ = 43–43.5° shifts to the region of large values of the scattering angle, which is characteristic of the formation of the cubic substitution phase Co
2Zn
11, the formation of which is due to the effects of replacing zinc ions with cobalt ions in the structure of the crystal lattice, followed by the imposition of the cubic structure of the crystal lattice. Also, the appearance of this replacement phase and the cubic phase of Co indicates the dominance of cobalt in the composition of nanostructures due to the predominance of its reduction potential. The presence of the effect of substitution of zinc ions by cobalt in the composition of nanostructures with the subsequent formation of a substitution phase is also evidenced by the dynamics of alterations in the crystal lattice parameters for various phases, featured in
Table 1. According to the established alterations in the crystal lattice parameters of the hexagonal zinc phase, with growth in applied potential differences from 1.5 V to 1.75 V, an increase in the parameters of this phase and its volume is observed. Such a variation in the parameters and volume of the crystal lattice with an increase in the degree of structural ordering (see the data in
Figure 4) can be explained by the effect of partial substitution.
Analysis of X-ray diffraction patterns of the samples obtained at applied potential differences of 2.0 V showed the absence of diffraction reflections characteristic of the hexagonal Zn phase, while reflections characteristic of the CoO2 phase are observed on the diffraction patterns, but their contribution is estimated to be no more than 6 wt. %. The absence of the Zn phase was explained by the shift of the main reflection at 2θ = 43–43.5° to the region of large angles, indicating a phase transformation of the Zn → Co2Zn11 type, which is characteristic of the processes of partial replacement of zinc ions by cobalt ions during electrochemical deposition of nanostructures, leading to phase transformations, as well as an increase in structural symmetry from hexagonal to cubic. Also, the presence of weak reflections at 2θ = 33° and 38° indicates the formation of the Co2Zn11 phase in the structure, the weight contribution of which is more than 90%. An analysis of the broadening of the diffraction reflection at 2θ = 43–43.5° using the Gaussian decomposition method made it possible to establish the presence of a Co phase with a cubic crystal lattice and an Fm-3m (225) spatial syngony.
With a growth in applied potential differences to 2.25 V, the X-ray diffraction patterns demonstrated low-intensity diffraction reflections characteristic of inclusions in the form of a ZnO cubic phase, the content of which is no more than 3 wt. %. Moreover, the shape of the main diffraction reflection 2θ = 43–43.5°, characterized by a strong broadening, indicates an increase in the contribution of the Co phase in the composition of nanostructures.
The presence of the Co phase was not detected in the nanostructures obtained at a potential difference of 2.5 V; in the case of a potential difference of 2.0 and 2.25 V, the content of the Co phase is 4 and 25%, respectively. In this case, an increase in the potential difference to 2.5 V during deposition leads to an insignificant increase in the contribution of the ZnO phase from 3% to 5%. A rise in the crystal lattice parameters for the Co2Zn11 phase from 8.8567 Å (for applied potential differences of 2.25 V) to 8.7724 Å (for applied potential differences of 2.5 V), meanwhile, may be due to the enrichment of the structure with zinc, an increase in the concentration of which leads to a change in the crystal lattice parameters, as well as the formation of minor inclusions in the form of a cubic ZnO phase, the formation of which may be due to the processes of oxygen incorporation into the crystal structure during its rapid release during the deposition process at high applied potential differences.
The obtained dependences of the change in the structural ordering degree depending on the applied potential differences reflect the relationship between changes in the phase composition and the ordering of the crystal structure of nanowires. In the case of applied potential differences of 1.25 V, for which, according to the data of X-ray phase analysis, the structure of nanowires is characterized by X-ray amorphous nature, the degree of structural ordering has a minimum value and indicates the minimum ordering of the structure. An increase in applied potential differences above 1.25 V leads to a sharp increase in the degree of structural ordering, which is due to the processes of ordered formation of crystallites when the ion reduction potentials from the electrolyte solution are reached, as evidenced by an increase in the deposition current density (the value increases by 1.5–2 times in comparison with the similar value of the current density at a potential difference of 1.25 V). The formation of an ordered structure of nanowires is accompanied by a change in the phase ratio, and the maximum degree of crystallinity (more than 70%) is observed when the Zn/CoO
2 phase ratio is 4:1 with the dominance of the Zn phase. At the same time, the displacement of the Zn phase due to its transformation into the Co
2Zn
11 phase, which is characteristic of the substitutional solid solution phase, as well as the partial transformation of the CoO
2 → Co phase, leads to an insignificant decrease in the crystallinity degree (no more than 1.5–2%) for the structures obtained at an applied potential difference of 2.00 V. A similar picture is observed with an increase in the potential difference to 2.25 V, at which the formation of the ZnO phase is observed, the emergence of which also results in a decline in the degree of crystallinity. The appearance of the Co and Co
2Zn
11 phases at applied potential differences of 2.0 V, as well as the ZnO phase at the applied potential difference of 2.25 V, leading to a decrease in the degree of structural ordering, is due to the effects of phase transformations leading to the appearance of interfacial boundaries and structural distortions that affect the ordering of the crystal structure. In such a case, the displacement of the Co phase and the formation of the two-phase structure Co
2Zn
11/ZnO with the dominance of the Co
2Zn
11 phase results in a rise in the degree of structural ordering up to 74%. Moreover, the analysis of the ratio of the contributions of the Co
2Zn
11/ZnO phases, as well as the mapping results, showed that the synthesized nanostructures at the applied potential difference of 2.5 V are characterized by the dominant Co
2Zn
11 phase with inclusions of the ZnO phase (see the data in
Figure 5).
The data presented in
Figure 5 demonstrate that the formation of the phase composition of nanostructures occurs with a predominance of interstitial solid solutions, where the dominant phase is the hexagonal phase of zinc (for applied potential differences of 1.5–1.75 V). Subsequently, the cubic phase Co
2Zn
11, dominates at potential differences above 2.0 V. At the same time, the arrangement of minor phases in the structure of nanowires is isotropic throughout the entire volume, which also confirms the type of interstitial solid solution and also indicates that the formation of nanostructures in the process of filling the pores of the template matrix occurs with the equiprobable formation of phases throughout the entire volume of nanostructures.
Based on the phase analysis of the analyzed samples as a function of the applied potential differences, as well as the determination of the weight contributions of each phase to the composition of nanostructures, a phase diagram of the change in the phase ratio depending on the deposition conditions was constructed. This diagram is shown in
Figure 6. Contribution estimation data were calculated by determining the weight fractions of diffraction reflections of each established phase, followed by determining its contribution to the overall diffraction pattern.
The overall appearance of the diagram provided reflects the contributions of various phases in the composition of the synthesized nanostructures. Also, it characterizes phase transformations, which can be written as X-ray amorphous structures → Zn/CoO2 → Co2Zn11/Co/CoO2 → Co2Zn11/ZnO.
The formation of the Co
2Zn
11 phase at applied potential differences above 1.75 V is associated with an elevation in the cobalt content in the structure of the deposited nanowires, which is attributable to the strong effect of the reduction potential of cobalt ions at high potential differences. This statement is also confirmed by the data of elemental analysis of the synthesized nanostructures, presented in
Table 2. The results of the elemental analysis were obtained by systematic analysis of the obtained nanostructures using measurements of the elemental distribution at various points along the entire length of the nanostructures, and the isotropy of the distribution of elements was studied by the mapping method.
As can be seen from the presented data on changes in the ratio of elements in the composition of the studied nanostructures, an increase in applied potential differences to 2.0 V and higher leads to a sharp increase in the cobalt concentration from 8.9 at. % to 29.3–31.1 at. %, while a more than twofold decrease in the oxygen concentration in the composition of the nanowires is observed. In turn, it should also be noted that the X-ray amorphism of the synthesized nanostructures at applied potential differences of 1.25 V can be explained by the fact that the nanowires contain increased oxygen content (more than twofold predominance over other elements in the composition). Such oxygen content in the composition of nanowires does not make it possible to form an ordered structure, which is also evidenced by the results of morphological studies of the synthesized nanostructures (see the data presented in
Figure 3 and
Figure 5).
3.2. Study of Optical and Conductive Properties of Synthesized Nanostructures
Determination of the influence of the phase composition alterations on the optical features of the synthesized nanostructures, in particular, on the change in the band gap, was studied by constructing Tauc’ plots, the general form of which allows one to obtain, by approximating them, the value of the fundamental absorption edge and, as a consequence, the band gap.
Figure 7 reveals the results of estimating the change in the band gap of the synthesized nanostructures as a function of the applied potential differences during synthesis. As is evident from the presented data, the alteration of applied potential differences during the deposition of nanostructures results in an alteration in the band gap and the fundamental absorption edge. Such changes are attributable to the effect of the phase composition alteration, as well as structural changes associated with them.
The variation in the band gap of the synthesized nanostructures produced at different potential differences is due to several factors. Firstly, the shift of the fundamental absorption edge to lower energies, which results in a decline in the band gap (see the data in the inset to
Figure 7), is not only due to a change in the phase composition of nanostructures but also their structural ordering. According to the data obtained, a change in the applied potential difference from 1.25 to 1.5–1.75 V results in a decline in the band gap from 3.93 eV to 3.91 eV and 3.87 eV, which indicates the influence of changes in the phase composition (CoO
2 phase composition growth), as well as the structural ordering degree, on the variation in the band gap. It should also be noted that the displacement of the CoO
2, Zn phases from the composition of nanostructures at applied potential differences above 2.0 V results in a decrease in the band gap by more than 8–10%. It should also be noted that in this case, a decrease in the oxygen concentration in the composition of nanostructures, and, therefore, the concentration of oxygen vacancies, leads to the ordering of nanostructures, expressed in an increase in the degree of crystallinity (see the data in
Figure 4), which in turn affects the change in the band gap and electron density. Comparing the data on the change in the values of the band gap and the degree of structural order (the data are shown in
Figure 4), we can conclude that, overall, the structural order is well-aligned with the data on the shift of the fundamental absorption edge; however, the phase composition of the nanostructures exerts the greatest influence on the variations in this value.
Figure 8a demonstrates the alterations in the current-voltage characteristics measured using the two-contact method in the voltage range from −4 to 4 V.
Figure 8b shows Nyquist plots Z″(Z′) revealing changes in the resistance of synthesized nanostructures obtained under different synthesis conditions.
The overall view of the obtained current-voltage characteristics indicates a different nature of the change in conductivity in CoZn nanostructures depending on the applied potential differences and the influence of the phase composition and the degree of structural ordering on the conductive properties. In the case of X-ray amorphous nanostructures, the resulting current-voltage characteristic is described by a nonlinear curve [
30,
31], which is characteristic of highly disordered structures, in which ballistic charge transfer is blocked by a fair number of amorphous inclusions, as well as by structure defects (the presence of point defects, areas of disorder, vacancy defects, dislocations). As is evident from the Nyquist plots Z″(Z′) presented in
Figure 8b, an alteration in the phase composition results in a decline in the nanostructures’ resistance, which implies a growth in their conductive characteristics.
With a growth in applied potential differences during the synthesis of nanostructures, leading to the formation of ordered structures, an increase in the slope of the current-voltage characteristic is observed, indicating an increase in the conductivity of nanostructures associated with an increase in ballistic charge transfer. Moreover, the presence of impurity inclusions in the form of oxide phases in the structure leads to a slight deviation of the current-voltage curves from the linear nature of the change in conductivity, characteristic of the ohmic type of current-voltage characteristics. A variation in the phase composition of nanostructures, when oxygen is displaced from the composition of nanowires, as well as the formation of the Co2Zn11 phase, results in a more than 2–3-fold increase in conductivity in comparison with X-ray amorphous nanostructures, and the character of the current-voltage curve is characteristic of the ohmic type, which can be explained by an increase in the contribution of cobalt in the composition of nanostructures, leading to the dominance of metallic conductivity, as well as by a change in the electron density, the change of which is evidenced by these changes in the band gap.
3.3. Lifetime Tests of the Studied Nanostructures when Used as Anode Materials for Lithium-Ion Batteries
One of the promising areas of application of nanostructures is their use as anode materials for lithium-ion batteries because of the possibility of creating miniature batteries with their high resistance to degradation and maintaining capacitance characteristics during long charge-discharge cycles.
Figure 9a demonstrates typical charge/discharge curves of the studied nanostructures in the first three cycles, reflecting the electrochemical processes of lithiation. As is evident from the presented data, after the first cycle, there is a slight decrease, the value of which is less than 2–3%, which is typical for the initial stage of lithiation associated with the processes of lithium incorporation and structure stabilization. Moreover, in contrast to lithium-sulfur batteries, for which the decrease in capacitive characteristics after the first cycles is more than 10–15%, in the case of using these nanostructures, such a decrease is not observed [
32,
33,
34]. At the same time, the stability of capacitive characteristics in the range of 95% of the initial value is maintained for a rather long time.
Figure 9b shows the results of cyclic testing of CoZn nanostructures as anode materials for lithium-ion batteries, reflecting the change in the value of the specific discharge capacity depending on the number of cycles in the charging capacity mode of 1000 mA × h × g
−1. Life tests were carried out for 500 charge-discharge cycles. This limitation was chosen based on a priori data since, for most of the tested nanostructures as anode materials, the degradation of capacitive characteristics occurred before reaching 500 cycles [
35,
36].
The overall appearance of the data provided in
Figure 9 implies different resistance to long-term resource tests of the synthesized CoZn nanostructures. The smallest number of charge-discharge cycles, at which the specific capacitance remains within at least 80% of the nominal value, was observed for samples of CoZn nanostructures produced at applied potential differences of 1.25 V, characterized by an amorphous structure. It should be noted that the rate of capacity degradation associated with the deterioration of the value is quite fast since the decrease in the value of the specific capacity below the limit of 80% occurs in 5–6 cycles. Such deterioration in the properties of capacitive characteristics is primarily due to the amorphous nature of the synthesized structures and a strong disordering of the structure, expressed in morphological features (see data in
Figure 2).
For nanostructures in which the hexagonal Zn phase dominates with inclusions in the form of the CoO2 phase, a significant increase in the performance of the anode material is observed, as well as the preservation of capacitive characteristics for a larger number of cycles of life tests. At the same time, the decline in capacitance characteristics as a result of degradation occurs much more smoothly and over a greater number of cycles than in the case of degradation of CoZn nanostructures obtained at applied potential differences of 1.25 V.
In the case when the CoZn nanostructures synthesized are dominated by the Co2Zn11 phase (for samples obtained at applied potential differences of 2.0 V and higher), a decrease in capacitive characteristics to 80% of the nominal capacitance is observed only for samples obtained at 2.0 V. For samples synthesized at applied potential differences of 2.25 and 2.5 V, no decrease in the specific capacitance after 500 cycles of life tests was observed. It is interesting to note that in the case of an increase in the structural ordering degree, as well as a change in the phase composition of nanostructures with variation in applied potential differences, the decrease in the capacitance value associated with the degradation of the anode material has a significantly extended trend characterized by 30–40 cycles when the specific capacitance value is 80% from the nominal value.
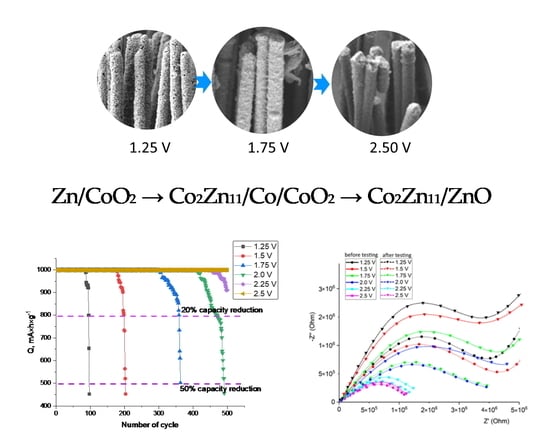
Figure 9b shows the results of the number of cycles at which the value of the specific capacitance remains within 80% of the initial value. As can be seen from the presented data, the samples obtained at applied potential differences of 2.25–2.5 V overcame the threshold of 500 cycles while maintaining the value of the specific capacity above 80%. Moreover, in the case of samples obtained at applied potential differences of 2.5 V, the number of cycles of life tests while maintaining the stability of specific capacitance indicators within 80% of the nominal value was more than 850 cycles. This indicates a high resistance of materials to degradation processes associated with lithiation during battery charging and discharging. In the case of nanostructures obtained at applied potential differences of 1.25 V, the number of resource cycles does not exceed 100, indicating a low resistance to degradation and the inapplicability of these structures as anode materials. It should also be noted that a change in the phase composition with the transformation of the Zn phase into the Co
2Zn
11 phase with an elevation in the concentration of cobalt in the composition of nanostructures results in a significant increase in the efficiency of using anode materials, even considering a slight decrease in the degree of structural ordering caused by phase transformations.
Figure 9d shows the results of evaluating the effectiveness of increasing the performance of CoZn nanostructures as anode materials for lithium-ion batteries obtained under various synthesis conditions. An efficiency comparison was performed concerning the sample produced at a potential difference of 1.25 V, with the lowest number of resource cycles.
As can be seen from the presented data, the maximum value of efficiency exceeding the value of the stability of maintaining operability with a decrease in capacitance characteristics below 80% is typical for structures obtained at applied potential differences of 2.5 V. This efficiency value is more than eight times the same value for structures obtained with a potential difference of 1.25 V, having an X-ray amorphous nature.
Thus, analyzing the data acquired, we can conclude that the phase transformations in CoZn nanostructures are of the type: X-ray amorphous → Zn/CoO2 → Co2Zn11/Co/CoO2 → Co2Zn11/ZnO structures result in a growth in the efficiency of using nanostructures as anode materials that are highly resistant to degradation during operation during a large number of life test cycles.
3.4. Evaluation of the Destruction of Nanostructures after Life Tests
The decrease in the capacitive characteristics of anode materials is usually due to the effects of structure oxidation, followed by degradation of the material. Oxidation processes occur during lithiation, as well as ion exchange during charging—discharging, which leads to the introduction of oxygen into the anode structure, and during long-term tests, the formation of oxide inclusions, a rise in the concentration of which is accompanied by a destructive change in the anode material. In most cases, these changes are associated with the formation of various forms of growths on the surface of the anode material, which prevents the lithiation processes and leads to a decrease in the retention of capacitive characteristics. In this case, when evaluating the mechanisms responsible for the degradation of the anode material, it is essential to consider the structural features of the material in the initial state alongside the phase composition.
Figure 10 presents the results of evaluating the conducting characteristics of synthesized nanostructures afterlife tests as anode materials, the alteration of which characterizes the destructive change in the properties of anode materials associated with degradation. The dependences obtained reflect changes in the conductive properties of CoZn nanostructures afterlife tests. As is evident from the presented data, the greatest deterioration in the conductive properties (decrease in the curve of the current-voltage characteristic and increase in the circle Z″(Z′)) is observed for nanostructures obtained at potential differences of 1.25 and 1.5 V, for which the decline in capacitance characteristics occurred much faster. In the case of CoZn nanostructures produced at potential differences of 2.25 and 2.5 V, the change in the IVC curves, alongside Z″(Z′) dependences, is almost minimal, which indicates the resistance of nanostructures to destruction and deterioration of the conductive properties’ afterlife tests.
Figure 11 demonstrates the morphological features of the synthesized CoZn nanostructures afterlife tests as anode materials for lithium-ion batteries.
The presented SEM images clearly show that the degradation processes during life tests have a different character depending on the phase composition of the synthesized CoZn nanostructures, alongside the structural ordering degree in the initial state.
CoZn nanostructures produced at applied potential differences of 1.25 V have the least resistance to degradation during life tests, which, according to X-ray phase analysis, are characterized by a low degree of crystallinity and an X-ray amorphous nature. In this case, after 90 cycles of life tests, these CoZn nanostructures are covered with feather-like outgrowths attributable to oxidation processes. Similar outgrowths are also formed for CoZn nanostructures produced at applied potential differences of 1.5 V, however, in a smaller amount, which indicates that the degradation processes proceed more slowly. Such formation of feather-like outgrowths may be due to the oxidation of zinc and the transformation of the Zn → ZnO phase, the appearance of which leads to a destructive change in the properties of nanostructures.
In the case of samples obtained at a potential difference of 1.75 V, degradation of the surface of CoZn nanostructures has significant differences. For these nanostructures, a small formation of feather-like growths is observed, which can be explained by the fact that these samples are more resistant to oxidation; however, the formation of longitudinal microcracks with a length of several microns is observed in the structure of nanowires. The formation of microcracks can be explained by the effects of the accumulation of structural stresses during the introduction of oxygen into the interstitial space of the crystal lattice, followed by the formation of metastable inclusions, leading to the destruction of crystalline and chemical bonds.
Smaller microcracks are observed for samples obtained at applied potential differences of 1.75 V, the increase in stability for which can be explained by phase transformations of the Zn → Co2Zn11 type. In the case of samples obtained at potential differences of 2.25 and 2.5 V, degradation processes are associated with the formation of small feather-like or spherical inclusions on the surface of nanostructures and the complete absence of any microcracks and cleavages, which indicates a high resistance of these structures to degradation and oxidation processes during life tests. The absence of microcracks in samples obtained at potential differences of 2.25–2.5 V afterlife tests can be explained by a lower rate of degradation of nanostructures since lithiation processes are usually accompanied by oxidation of the anode material due to the introduction of oxygen into it from the electrolyte during charge transfer. When it comes to nanostructures obtained at potential differences of 2.25–2.5 V, a high crystallinity degree reduces the effect of softening and destruction of the crystal lattice because of long-term lithiation processes accompanied by deformation associated with the introduction of oxygen. Moreover, the formed feather-like outgrowths on the surface of nanostructures indicate the formation of oxide inclusions during lithiation, which can serve as a passivating film that prevents oxygen from penetrating deep into the nanostructures.

 ,
, 


