
A Coupled Nonlinear Viscoelastic–Viscoplastic Thermomechanical Model for Polymeric Lithium-Ion Battery Separators

1
Department of Mechanical Engineering, Michigan State University, Lansing, MI 48910, USA
2
Department of Electrification Subsystems and Power Supply, Ford Motor Company, Dearborn, MI 48124, USA
*
Author to whom correspondence should be addressed.
Batteries 2023, 9(9), 475; https://doi.org/10.3390/batteries9090475
Submission received: 11 August 2023
/
Revised: 10 September 2023
/
Accepted: 19 September 2023
/
Published: 20 September 2023
(This article belongs to the Special Issue Recent Progress of Battery Design, Modeling and Testing in Electric Vehicles)
Abstract
:One of the major concerns in ensuring lithium-ion battery (LIB) safety in abuse scenarios is the structural integrity of the battery separator. This paper presents a coupled viscoelastic–viscoplastic model for predicting the thermomechanical response of polymeric battery separators in abuse scenarios under combined mechanical and thermal loadings. The viscoplastic model is developed based on a rheological framework that considers the mechanisms involved in the initial yielding, change in viscosity, strain softening and strain hardening of polymeric separators. The viscoplastic model is then coupled with a previously developed orthotropic nonlinear thermoviscoelastic model to predict the thermomechanical response of polymeric separators before the onset of failure. The model parameters are determined for Celgard®2400, a polypropylene (PP) separator, and the model is implemented in the LS-DYNA® finite element (FE) package as a user-defined subroutine. Punch test simulations are employed to verify the model predictions under biaxial stress states. Simulations of uniaxial tensile stress–strain responses at different strain rates and temperatures are compared with experimental data to validate the model predictions. The model predictions of the material anisotropy, rate and temperature dependence agree well with experimental observations.
1. Introduction
The advancement and commercialization of lithium-ion batteries (LIBs) have enabled a new generation of electrical vehicles and high-density energy storage systems. However, ensuring the safe operation of these high-energy-density batteries has been a key challenge that hinders the large-scale application and deployment of LIBs for future e-mobility and battery energy storage systems (BESSs). Therefore, understanding battery failure mechanisms and reducing safety risks is critical. One of the major mechanisms that lead to thermal runaway in LIBs is an internal short circuit (ISC) [1,2,3,4]. In LIBs, the failure of the battery separator creates a pathway for the electrodes to come in contact with each other, and this triggers an ISC. The separator failure can be caused by abusive loadings such as crash or impact, natural expansion during intercalation, or piercing by deposited lithium dendrites [1,2,3,4]. To improve the safety of LIBs and prevent thermal runaway scenarios due to ISC, it is necessary to develop accurate models to predict the response of battery separators in their entire range of deformation and under combined mechanical and thermal loadings.
Although the mechanical and thermal responses of commonly used microporous polymeric membranous battery separators have been explored in recent years [5,6,7,8,9,10,11,12,13,14,15], there are still some challenges associated with developing accurate models for predicting the response of such separators. These are due to the complexities involved in the thermomechanical behaviors of these separators. For example, commonly used polymer separators are dry-processed. This process results in strong anisotropy in materials. These separators have two in-plane principal directions known as the machine direction (MD) and the transverse direction (TD) [5,6,7,8,9,10,11]. As polymers, they are rate-dependent [5,6,7] and temperature-dependent [6,8]. However, unlike typical polymers, dry-processed separators have a unique thermal expansion/shrinkage behavior [12,13]. Additionally, in the working condition of LIBs, separators are immersed in electrolyte solutions that are known to act as plasticizers and weaken their mechanical response [7,14,15,16].
In previous works, we have developed orthotropic viscoelastic models for predicting the response of separators within the linear range [17], with the effects of temperature and electrolyte [18], and in the nonlinear viscoelastic range [19]. In the literature, a few works have attempted to develop models for simulating the separator responses under large deformations. Zhao et al. presented a constitutive model based on the Rich–Hill elastoplastic theory for large deformations of a polypropylene (PP) separator [20]. The load–displacement response of a polyethylene (PE) separator was modeled by Zhang et al. using the anisotropic crushable foam model in LS-DYNA [21]. Furthermore, a representative volumetric element modeling method was proposed by Xie et al. [22] to predict the tensile properties of PP separators. Recently, an elastic–hyperelastic–viscoplastic model was developed by Makki et al. [23] for predicting the mechanical response of battery separators under large deformations. The model considered the rate dependence in the plastic range through a damage rate sensitivity parameter. However, no rate-dependent results were presented. In summary, although the above models can represent the large deformation behavior of the separators and some with rate dependency, they did not address the temperature dependence and the thermal expansion/shrinkage of the materials, which are critical for simulations of the separator response under combined mechanical and thermal loadings.
The stress–strain response of polymeric materials beyond the deformation recoverable limit (yield point) can be described by the viscoplasticity (or rate-dependent plasticity) model. In the literature, various viscoplastic models have been developed for polymeric materials. An elasto-viscoelastic–viscoplastic model was developed by Findlay et al. [24] to model the stress–strain response of polymeric materials. A nonlinear elasto-viscoelastic–viscoplastic model was developed from the thermodynamic principles by Schapery [25,26] to model the response of fiber-reinforced and unreinforced plastics, as well as semicrystalline polymers. Lai and Bakker [27] proposed an elasto-viscoelastic–viscoplastic integral model for polymeric materials. The developed model was validated using creep and recovery tests for high-density PP. Coupled elasto-viscoelastic–viscoplastic models based on rheological frameworks have been developed and implemented for predicting the stress–strain response of various polymers in their entire deformation range [28,29,30,31,32,33]. Also, a group of consistency viscoplasticity models that incorporate the time-dependent response in the large strain deformation region in a rate-dependent yield surface was introduced by Wang et al. [34] and has been studied extensively by others [35,36,37,38]. Another group of viscoplastic models is the overstress model based on the ideas presented by Perzyna [39]. The main postulate of these models is that the current stress state can be outside the yield surface. The Perzyna model [39] and the Duvaut–Lions model [40] are the most commonly used formulations. Both models have been widely implemented in small strain [41,42,43,44,45,46,47,48,49] as well as finite strain problems [50,51,52,53].
Finally, phenomenological constitutive models have been developed to predict the flow stress of polymeric materials. G’sell and Jonas [54] developed a constitutive relationship to predict the flow stress behavior of polymeric materials at different constant strain rates. This model has been implemented in its original and modified forms in different works to predict the stress–strain response of polymeric materials at different strain rates and temperatures [55,56,57,58]. The Johnson–Cook model [59] and its variations have also been applied in the literature to describe the tensile and compressive response of polymeric materials [60,61]. Furthermore, a flow stress model was proposed by Nasraoui et al. [62] for the strain rate and the temperature-dependent response of polymeric materials. The model was validated against uniaxial compression tests for PMMA (polymethylmethacrylate) under quasi-static and dynamic loadings. Another flow stress model known as the DSGZ model was developed by Duan et al. [63] to predict the response of glassy and semicrystalline polymers. Recently, a phenomenological model for predicting the flow stress of thermoplastics was developed by Zhu et al. [64]. The model was validated against uniaxial tensile and compression tests for PEEK and PC.
The above constitutive models form a foundation for modeling the thermomechanical behavior of polymeric separators under large deformation.
This work presents a phenomenological flow stress-based viscoplastic model. The viscoplastic model is coupled with the orthotropic nonlinear thermoviscoelastic model developed in our previous work [19] to accurately predict the stress–strain response of polymeric battery separators from small strain to the onset of failure. The model parameters were calibrated for Celgard®2400 PP separators. The model’s predictions of the material anisotropy, rate and temperature dependences are compared with experimental data.
2. Theoretical Background
2.1. Viscoelasticity
The stress–strain response of viscoelastic materials under small deformations is formulated through the hereditary representation of the Boltzmann superposition principle, whose stiffness-based form is mathematically expressed as [65,66,67,68,69]:
where is the stress, is the strain and is the stress relaxation stiffness function.
Furthermore, when the applied loading exceeds the linear viscoelastic limit, material nonlinearities arise in the mechanical response of viscoelastic materials. Beyond the linear viscoelastic limit, the creep or stress relaxation responses become functions of both time and the applied constant stress or strain. The stress–strain response of viscoelastic materials beyond the limit of linear viscoelasticity is commonly represented by the Schapery hereditary integral formulation [70]. For uniaxial loading, the Schapery model in its stiffness form is represented as:
where and are the equilibrium and linear viscoelastic transient relaxation modulus. are strain-dependent nonlinearity parameters, and is the reduced time defined as:
In Equations (3) and (4), is the strain-dependent time–strain shifting factor. It is vital to note that when the applied deformation is within the linear viscoelastic range, the values of the nonlinearity parameters become equal to 1, and Equation (2) reduces to the hereditary integral representation for linear viscoelastic materials (Equation (1)).
In previous works [17,18,19], we have developed orthotropic linear and nonlinear thermoviscoelastic models to predict the thermomechanical response of polymeric battery separators accounting for their constitutive behaviors using Equations (1) and (2) as the basis of the constitutive models. In these works, the stress–strain response of the separator was expressed in a rheological framework using the generalized Maxwell model (Figure 1).
The stress relaxation response of the generalized Maxwell model is generally expressed as a Prony series represented as:
where is the equilibrium or fully relaxed modulus, is the stress relaxation constant and is the relaxation time. However, for the nonlinear model, it was assumed that the components of the rheological network are nonlinear springs and dashpots whose nonlinearities are introduced through the strain-dependent nonlinearity parameters of the Schapery model.
To introduce material orthotropy in the models, the stress relaxation function was expressed as a viscoelastic analog of the elastic stiffness matrix [71]. This was achievable by applying the elastic–viscoelastic correspondence principle [68,69]. A symmetric stiffness matrix (Equation (6)) was assumed in the linear model [17,18]. The non-symmetric stiffness matrix (Equation (7)) was introduced in the nonlinear viscoelastic model [19]. From a previous study [5], it was observed that at strain values well beyond the linear viscoelastic limit, the condition of symmetry in the viscoelastic response breaks down.
In Equations (6) and (7), , and are the relaxation moduli in the MD, TD and in-plane shear, respectively. and are the major and minor Poison’s ratios.
The time–temperature superposition principle (TTSP) [65,72] was employed to account for the temperature effect within the range of 20–110 °C in the linear model and the range of 20–60 °C in the nonlinear model. Furthermore, a time–temperature–solvent superposition method was developed as an extension of the TTSP to account for the plasticization effect of electrolyte solutions in the linear thermoviscoelastic model [18]. Consequently, to implement Equations (1) and (2) in finite element modeling for loadings with arbitrary stress, strain and temperature histories, the hereditary integrals were evaluated using a developed discretization algorithm that uses the Prony series representation of the generalized Maxwell model as a kernel function [17,19].
The model parameters for the orthotropic linear and nonlinear viscoelastic models were calibrated for the Celgard®2400 PP separator, and the models were implemented as user-defined subroutines in the LS-DYNA® FE package, verified and validated against experimental data.
2.2. Viscoplasticity
The formulation of the viscoplastic flow stress model is based on the rheological framework as shown in Figure 2. Beyond the initial yield threshold, the governing relationship is simplified using a rheological system, which consists of a sliding frictional element, a dashpot and two nonlinear springs. The sliding frictional element represents the initial yield threshold, the dashpot accounts for the changes in the viscosity of the material due to the accumulation of plastic strains and changes in the strain rate, and the two springs account for the strain-softening and strain-hardening mechanisms.
The elements in the rheological model are arranged in such a way that the total stress can be determined by a summation of the stresses in the individual elements. Hence, after the initial yield threshold is exceeded, the stress as a function of the accumulated plastic strain and the constant strain rate at a constant temperature is expressed as:
where is the initial yield stress. With an increase in the strain rate and a decrease in temperature, increases in value and vice versa. and are the first and second viscosity parameters, respectively. accounts for the effect of the rate of change in the viscosity of the material under permanent deformations on the flow stress due to changes in the strain rate and temperature, while regulates the rate at which softening and or hardening occurs after the initial yield stress has been exceeded. is the strain-rate- and temperature-dependent softening coefficient that accounts for the decrease in flow stress with an increase in strain. and are the hardening coefficients that combine to depict the increase in flow stress under a further increase in strain.
The viscoplastic model parameters were obtained through experimental calibration, which is presented next.
3. Experimental Procedure
Uniaxial tensile tests were carried out with Celgard®2400 samples at strain rates of 0.1/s, 0.01/s, 0.001/s and 0.0001/s. The tests were also carried out at constant temperatures ranging from 20 °C to 50 °C. The in-plan dimensions of each specimen were 45 × 5 mm [17]. The tests were carried out using an RSA G2 rheometer as shown in Figure 3. For tests carried out below ambient conditions (20 °C), a liquified nitrogen (LN2) tank (Figure 3b) was connected to the rheometer to cool each tested sample to the desired temperature. The experimentally determined stress–strain curves for the samples cut along the MD and TD are presented in Figure 4 and Figure 5, respectively. Furthermore, the typical post-test geometry of the MD and TD samples are presented in Figure 6 to show the deformation mechanisms the samples undergo under uniaxial tension.
From the results, the effects of the strain rate and temperature are manifested in the stress–strain response of the separator in the MD and TD. With the increasing strain rate, there is an observed increase in the stiffness of the material and vice versa. Also, with increasing temperature, the material softens, and there is an observed reduction in its stiffness. The results also show that the stress–strain curves for the samples cut along the TD are that of a typical semicrystalline polymer with five major phases in its deformation process. The first phase consists of fully recoverable linear viscoelastic deformation. In the second phase, the material transitions into a nonlinear viscoelastic deformation region. Phase three involves the evolution of the yield mechanism, after which deformations become irrecoverable. Phases four and five constitute the strain-softening and strain-hardening mechanisms, respectively. For semicrystalline polymers, strain softening is attributed to broken crystallization, and strain hardening is related to recrystallization [64]. Also, a neck formation is observed during the TD sample deformation process. The necking region is characterized by a rapid decrease in the cross-sectional area at a particular point along the gage length of the specimen. This necking phenomenon is expressed in the post-test sample geometry (Figure 6b). However, the material response in the MD is different from that of a typical semicrystalline material in the sense that there is no clearly identifiable yield point following phases one and two of its deformation history. Furthermore, in the MD, there is an observed continuous hardening in the material response under very large strains. These distinct differences in the uniaxial stress–strain response of the material in the MD and TD introduce complexities that have to be accounted for in the constitutive modeling of polymeric separators under large strains. The uniaxial tensile test results give us an understanding of the total stress–strain behavior of the separator material in its different orientations and present a good case for model calibration and validation.
4. Model Parameter Identification
4.1. Strain-Rate-Dependent Model Parameters at the Reference Temperature
The strain-rate-dependent viscoplastic model parameters are calibrated using the uniaxial tensile test results carried out at different strain rates at the reference temperature (20 °C). This temperature value is selected intentionally as it is the reference temperature for the viscoelastic model that will be coupled with the viscoplastic model. The parameters to be determined are the initial yield stress (), first and second viscosity parameters ( and ), strain-hardening and strain-softening coefficients (, and ). The initial yield stress was determined based on the need to identify it within the boundaries of the range of prediction of the nonlinear viscoelastic model (0–5% strain) [19]. Also, identifying the initial yield point of polymeric materials is not as straightforward as it is with metallic materials. Hence, the offset method was employed to identify the initial yield stresses in the MD and TD of the polymeric separator at different strain rates. From the test results for samples cut along the MD, the yield stresses were identified by taking a 1% offset, while the yield stresses for samples cut along the TD were determined by taking a 0.3% offset. The rationale behind taking a larger offset in the MD than in the TD is supported by the superiority in the mechanical response of the material in the MD compared to that in the TD. Hence, it is expected that the material will yield lower stress and strain values in the TD than in the MD.
To determine the other model parameters (, , , and ), a scripted optimization fitting method that minimizes the error between the fitted results and experimental data to generate the model parameters for each constant strain rate value was used. The obtained model parameters for the MD and TD are summarized in Table 1 and Table 2, respectively. Comparisons between the experimental and the fitted curves are presented in Figure 7.
Figure 7 shows that the fitted curves overlap with the experimental curves nicely. This verifies the accuracy in the determination of the model parameters given in Table 1 and Table 2. However, from Table 1 and Table 2, we have unique sets of values for each viscoplastic model parameter at different strain rate values. To implement the viscoplastic model in predictive modeling, given arbitrary strain rate values within the considered range, simple equations relating the viscoplastic parameters as functions of strain rate have to be defined. From the current data generated, we have to define five sets of equations for the TD model parameters and four sets of equations for the MD model parameters. To reduce the number of equations needed and the number of input parameters for the model implementation overall, a parameter reduction method is applied. A strain-rate-scaling factor ( is introduced to modify Equation (8) such that the stress evolution after the yield threshold is exceeded at the reference temperature is expressed as:
where , and are the first viscosity parameter and strain-softening and strain-hardening coefficients at the reference strain rate value set as 0.0001/s, respectively. The reduced viscoplastic model parameters for the MD and TD responses are summarized in Table 3 and Table 4, respectively.
Figure 8 compares the fitted curves using the reduced model parameters with the experimental data. The model provided good representations for most of the experimental curves with the exception of MD at 0.1/s and 0.01/s conditions. As shown in Figure 8a, the model deviated from the experimental curves over the plastic strain range of 0.05 to 0.15 for these two conditions. This local deviation is due to a reduced number of parameters. Overall, the model is adequate for representing the experimental curves.
Comparing Table 3 and Table 4, it is important to note that the second viscosity parameter () has a constant value in the MD but a variable one in the TD. This is due to the difference in the stress–strain responses in the MD and TD. The TD stress–strain curves (Figure 5) show that the rate of initiation of the softening and hardening mechanisms after the initial yield stress has been exceeded is not constant for the material response at different strain rates. Hence, keeping this value constant will lead to the divergence of the fitted curves from the experimental data.
The strain-rate-dependent parameters are plotted vs. the logarithm of the strain rate and fitted using the least-squares regression method to generate simple linear and polynomial relationships that can be introduced into the constitutive model to span out the values of the parameters within the considered range of strain rates. These fittings as well as their mathematical expressions are presented in Figure 9 and Figure 10 for the MD and TD parameters, respectively.
4.2. Temperature Dependence and Parameter Identification
To account for temperature dependence in the developed viscoplastic model, a decaying term , modified from the G’sell–Jonas model [54], is introduced into Equation (9) such that:
where is a material parameter that accounts for the effect of temperature on the flow stress of the material, and and are the current and reference temperatures, respectively. The modified term in Equation (10) is different from the original term used in the G’sell–Jonas model [54] in the sense that it introduces the reference temperature to give a clearer meaning to . At the reference temperature, becomes equal to 1 and Equation (10) reduces to Equation (9), which only accounts for the post-yield response at the reference temperature.
To implement the fully developed model, the values of the parameter have to be determined for the material response in the MD and TD. At the same strain value , the value of the flow stress is related to the strain rate and current temperature . To determine parameter at a constant large strain value and strain rate, some points on the stress–strain curves are selected as at different temperatures and , respectively, where is the maximum number of constant temperature values considered. At the reference temperature, the reference flow stress value is obtained by using Equation (9). Therefore, the stress at the current temperature can be expressed as:
In this case, the reference temperature was selected as 20 °C (293 K), and the reference stress is already known. Hence, parameter can be determined by fitting the relationship between the flow stress and temperature with Equation (12). A similar methodology for determining the parameter was applied by Zhu et al. [64] in the constitutive modeling of thermoplastics. The analysis for the determination of parameter was carried out at different large strain values. For MD samples, the analysis was carried out at 20% constant strain, and the determined parameter values were different at different strain rates. However, for the TD samples, the analysis was carried out at 20%, 30% and 40% constant strain values, and the values of parameter determined were similar for the different strain values and the different strain rates. Hence, the average value of 1100.64 was selected as parameter to calibrate the material response in the TD. Figure 11 presents an example of the fitting procedure for the determination of parameter for the MD response. The determined values of parameter for the MD response showed a linear relationship with the strain rate as shown in Figure 12. The determined values of parameter for the material response in the MD and TD are summarized in Table 5.
With parameters presented in Table 3, Table 4 and Table 5, the viscoplatic model for Celgard®2400 has been established. It should be noted that the parameter values determined here are for Celgard®2400 only. They are not valid for other types of separators. Nevertheless, these values can be treated as reference values to determine the likely range of these parameters.
At this stage, the viscoplastic model parameters are only determined for the MD and TD directions. The parameters for the shear direction can be determined with the off-axis tensile test following the method presented above.
5. Results and Discussions
5.1. Model Implementation
The fully developed model was implemented as a user-defined material model for shell element simulations in LS-DYNA®. To couple the orthotropic nonlinear viscoelastic model with the viscoplastic model, a uniaxial von Mises yield criterion was introduced to indicate the onset of the yielding mechanism. The uniaxial yield function is expressed as:
where is the viscoelastic trial stress. The onset of yielding is marked when the value of the yield function is equal to zero. Once the yield threshold is exceeded, the flow stress evolution becomes governed by the viscoplastic mechanism.
5.2. Biaxial Punch Simulations
Among various forms of biaxial loadings, the punch test has been identified as the most appropriate form of representing the out-of-plane deformation of a battery in crash scenarios [73]. In our previous work [17], punch simulations have been used to validate the orthotropic linear viscoelastic model against experimental results up to a 0.5% strain level. Unfortunately, the experimental results are unavailable at larger strains. In the current work, we compare the punch simulation results using the nonlinear viscoelastic model with the results generated using the linear model.
The FE model for the punch test is presented in Figure 13. In experiments, the separator was contained with a pair of annulus flanges with an inner opening of a 33.8 mm diameter (R = 16.9 mm). The separator was modeled with an outer radius of 40mm, the nodes at a radial distance in the interval 16.9 mm < R < 40 mm were constrained in the z-direction only, and the nodes at R = 40 mm were fully constrained. The punch was modeled as a rigid semi-sphere with a radius of 25.4 mm and given a prescribed velocity of 0.2 mm/s in the z-direction. The simulations were scaled so that 1ms corresponds to 1s in real time. The static coefficient of friction was chosen as 0.4, and the dynamic coefficient of friction was set as 0.2. The simulations were carried out at a constant temperature of 20 °C.
Figure 14 compares the force–displacement curves predicted by the two models. The two curves coincide at small displacements (d < 3 mm) and start to separate at d > 3 mm. Due to the instability issue, the simulation with the nonlinear model stopped at d = 4.67 mm. Therefore, the comparison for the punch simulation between the two models is limited to d = 4.67 mm.
To observe the differences in the material response from small to large deformations, the punch test results are compared at punch displacement d = 1.5 mm and d = 4.67 mm. These displacement values correspond to 7.5 s and 23.3 s of simulation time, respectively. The predicted stress and average strain contours at the above-mentioned punch displacements are presented in Figure 15, Figure 16, Figure 17 and Figure 18.
Figure 15 and Figure 16 compare the stress and strain contours from the punch test simulations by the orthotropic linear and nonlinear viscoelastic models at d = 1.5 mm. The different viscoelastic responses in the MD and TD directions observed in the experiment are captured by the two models presented here. At this stage, the stress and strain patterns predicted by the two models are indistinguishable. As expected, the nonlinear model reduces to the linear model at small deformations.
Figure 15a,b compare the x-stress (MD) patterns. The x-stress contours display a circular shape in the area in contact with the punch and then become elliptical shapes elongated more and more along the x-axis with increasing distance from the center. Figure 15c,d compare the y-stress (TD) at d = 1.5 mm. The stress contours are ecliptics elongated along the y-axis. The value of the maximum stress in the TD is about 62% of that of the MD. Figure 16a,b compare the x-strain of the two model predictions at d = 1.5 mm. The x-strain contours display a kidney shape. The maximum x-strain from the nonlinear model is slightly higher than the value of the linear model. The y-strain contours are compared in Figure 16c,d. These contours also display a kidney shape but orthogonal to that of x-strain. The maximum y-strain is 1.62 times the x-strain. The maximum stress and strain values and the ratios of TD/MD are summarized in Table 6.
Figure 17 and Figure 18 compare the stress and strain contours predicted by the two models at d = 4.67 mm. With increasing punch displacement, the stress and strain patterns of the two models remain similar, but the difference in the maximum stress and strain values increases. Table 6 shows that at d = 4.67 mm, the TD/MD ratio for the stress remains the same, whereas the ratio for strains decreases. Table 6 also presents the ratio of nonlinear and linear model predictions. At d = 1.5 mm, the ratios of the maximum stress and strain values predicted by the two models are close to 1.0. At d = 4.67 mm, the maximum stresses predicted by the nonlinear model are about 75% of those of the linear model, whereas the maximum MD and TD strains are 114% and 108% of the linear model, respectively.
In summary, the nonlinear model reduces to the linear model at small strains and predicts a more compliant response at larger strains. This trend is as expected. The stress patterns predicted by the two models are similar, indicating that the ratio between the MD and TD stresses remains the same under biaxial loading in the tested range.
5.3. Uniaxial Tensile Tests
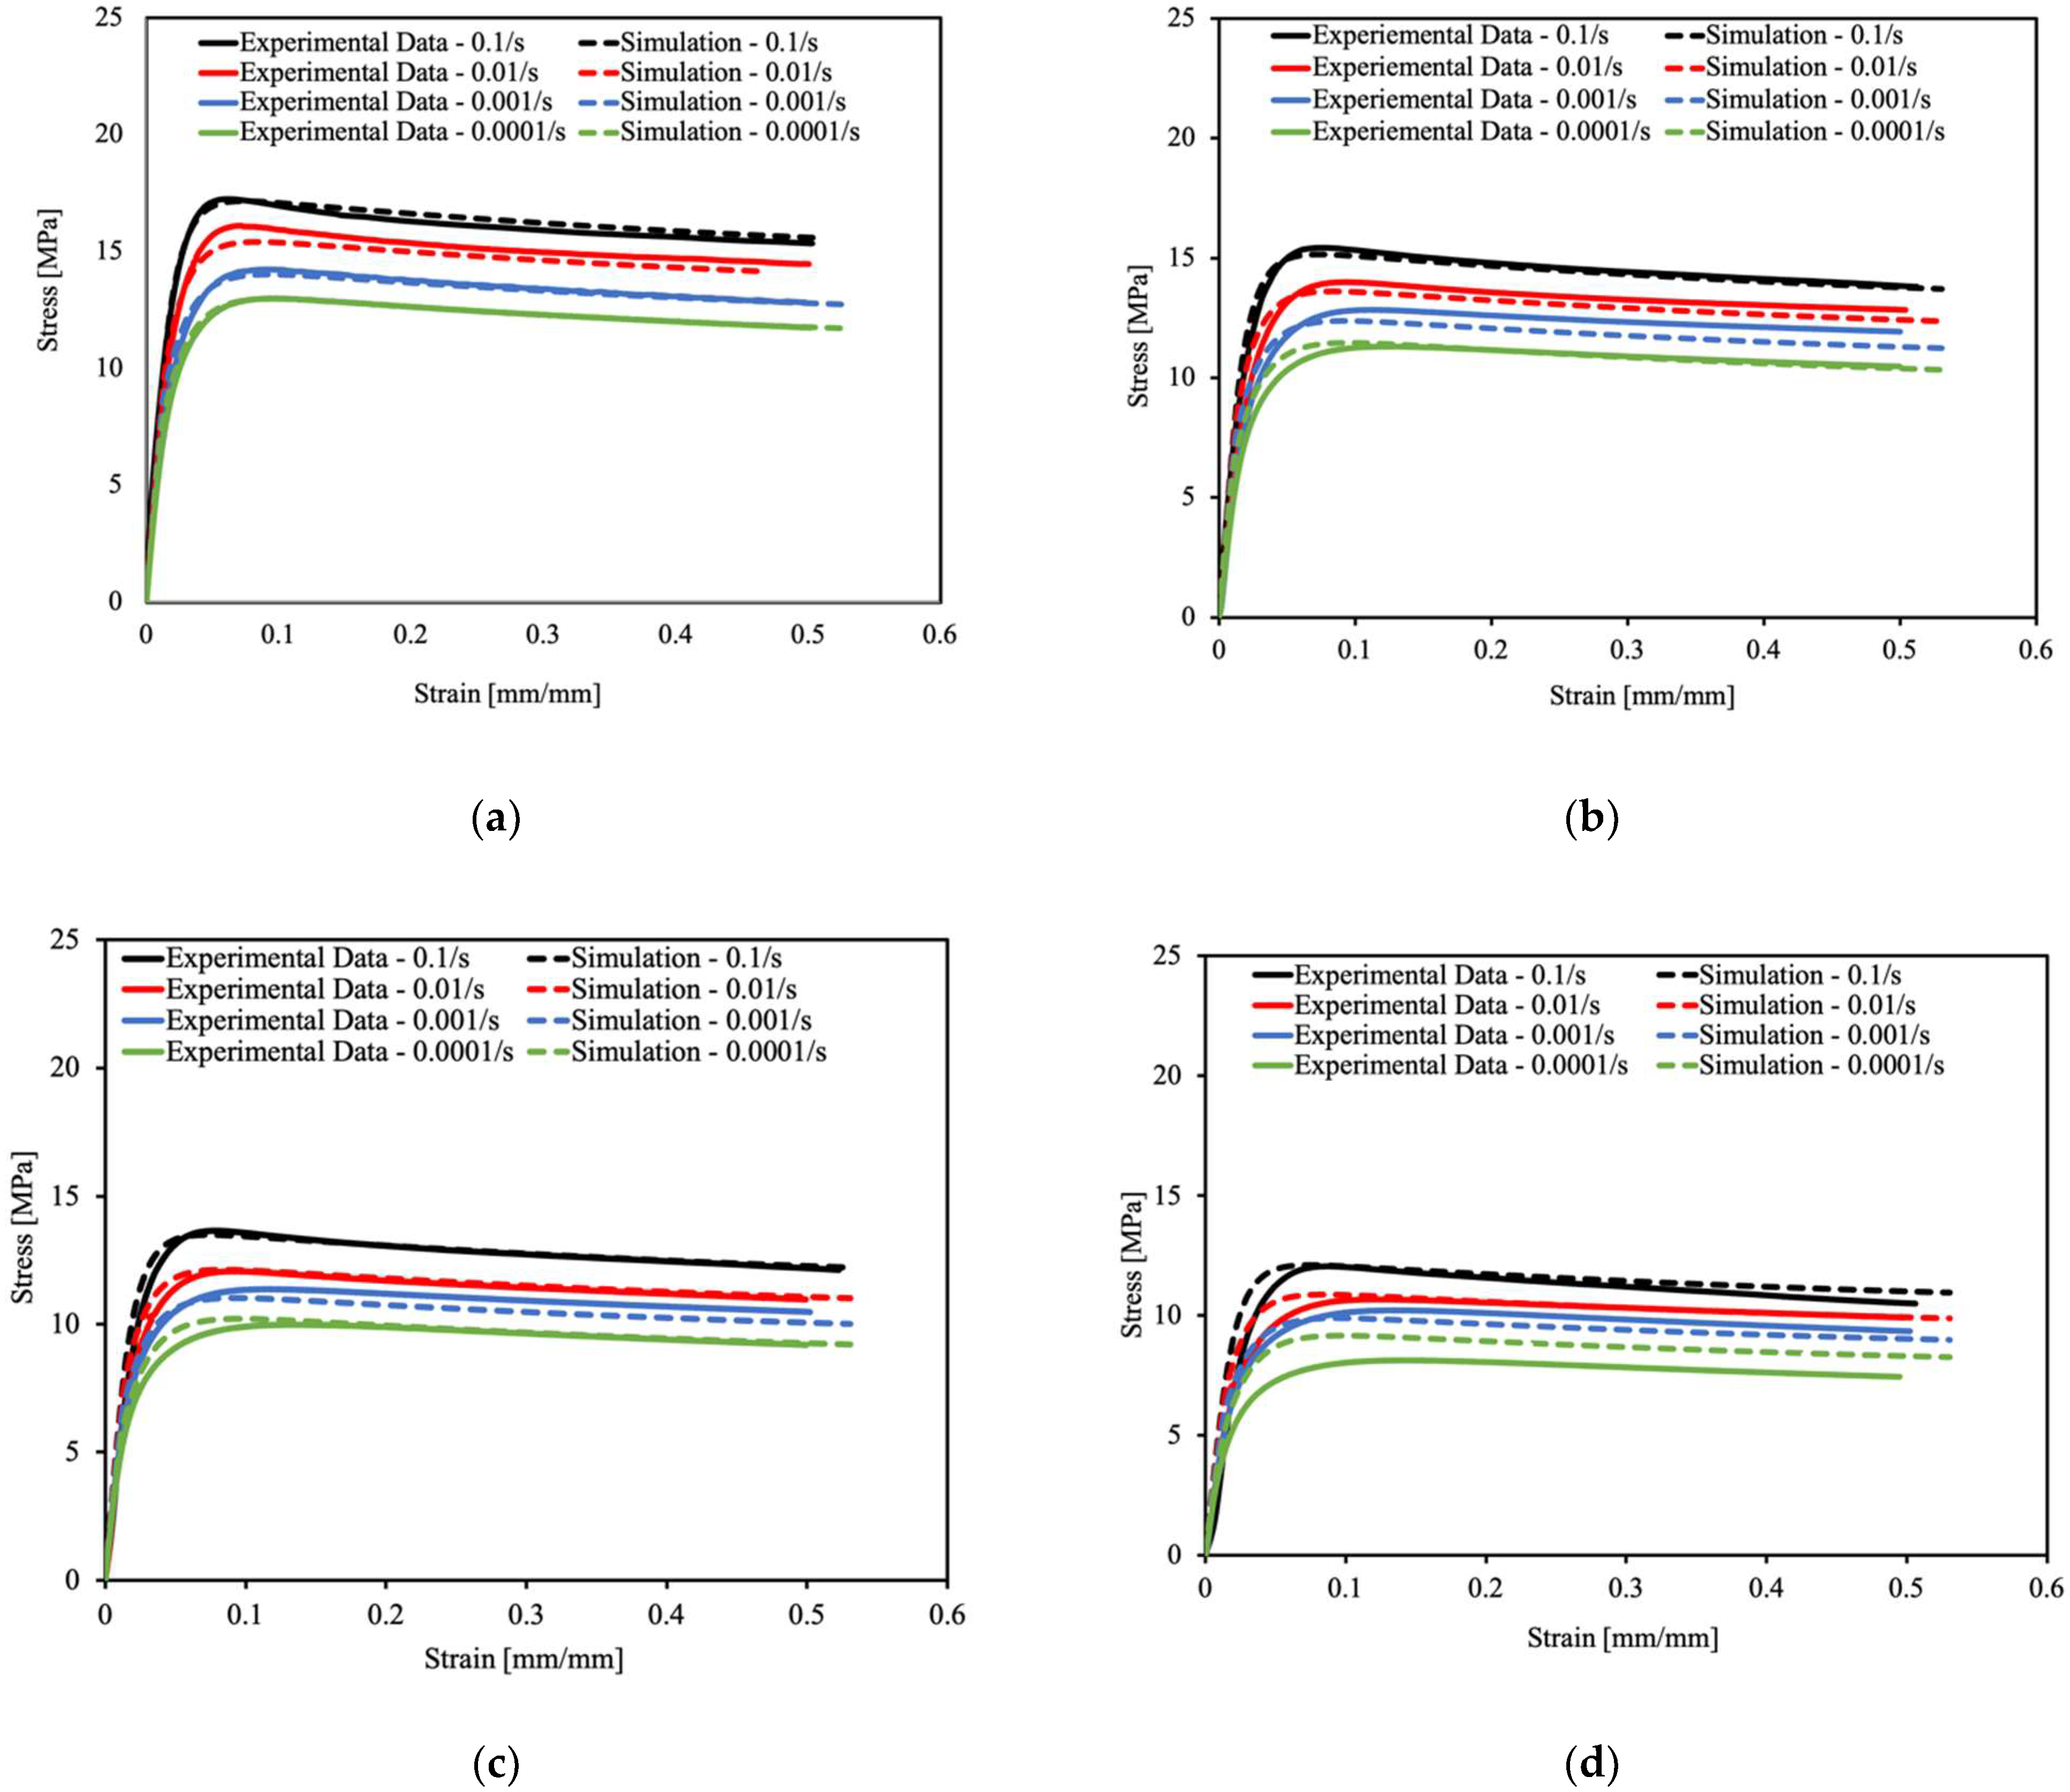
In this section, the model predictions are validated by comparing simulation results with uniaxial tensile test results carried out at different strain rates and temperatures for samples cut along the MD and TD. All simulations were carried out using a one-element model, with boundary conditions as shown in Figure 19, and the temperature history was applied at the nodal points of the element.
Figure 20 and Figure 21 present the comparison between the experimental and the simulation results for the uniaxial stress–strain response in the MD and TD, respectively. The results show that the stress–strain curves predicted by the coupled nonlinear viscoelastic–viscoplastic model are in good agreement with the experimental results and capture the trend in the anisotropy, rate and temperature dependence of the stress–strain response of the polymeric separator.
6. Conclusions
The development of a coupled viscoelastic–viscoplastic model for predicting the thermomechanical response of polymeric battery separators has been presented in this work. The viscoplastic model is based on a rheological system consisting of a sliding frictional element, representing the initial yielding mechanism, a viscoplastic dashpot to account for the changes in the viscosity of the material with the accumulation of large deformations and two springs representing the strain-softening and -hardening mechanisms. The formulation for the stress–strain response of the polymeric material after the yielding takes the form of a modified G’sell–Jonas model. The viscoplastic model was coupled with a developed orthotropic nonlinear viscoelastic model to predict the stress–strain response of the material in its deformation range before the onset of failure.
This model was implemented in LS-DYNA® as a user material model. The model parameters were determined for a PP separator. The developed model was validated against uniaxial tensile tests carried out at constant strain rates and temperatures. The results show that the model predictions of the material anisotropy, rate dependence and temperature dependence of the separator in its range of deformation before the onset failure agree well with the experimental data. Punch test simulations were also carried out to verify the nonlinear viscoelastic model predictions under biaxial loadings.
Author Contributions
Data curation, Formal analysis, Investigation, Writing—original draf, R.C.I.; Project administration, J.D. and C.B.; Funding acquisition, C.B. and X.X.; Writing—review & editing, J.D. and X.X. All authors have read and agreed to the published version of the manuscript.
Funding
This research was funded by Ford-MSU Innovation Alliance, grant number ENG26MSU.
Data Availability Statement
Data are available upon approval by Ford Motor Campany.
Conflicts of Interest
The authors declare no conflict interest.
References
- Liu, B.; Jia, Y.; Yuan, C.; Wang, L.; Gao, X.; Yin, S.; Xu, J. Safety issues and mechanisms of lithium-ion battery cell upon mechanical abusive loading: A review. Energy Storage Mater. 2020, 24, 85–112. [Google Scholar] [CrossRef]
- Deng, J.; Bae, C.; Denlinger, A.; Miller, T. Progress in battery safety modeling. Prog. Energy 2022, 4, 043001. [Google Scholar] [CrossRef]
- Liu, B.; Duan, X.; Yuan, C.; Wang, L.; Li, J.; Finegan, D.P.; Feng, B.; Xu, J. Quantifying and modeling of stress-driven short-circuits in lithium-ion batteries in electrified vehicles. J. Mater. Chem. A 2021, 9, 7102–7113. [Google Scholar] [CrossRef]
- Feng, X.; Ouyang, M.; Liu, X.; Lu, L.; Xia, Y.; He, X. Thermal runaway mechanism of lithium-ion battery for electric vehicles: A review. Energy Storage Mater. 2018, 10, 246–267. [Google Scholar] [CrossRef]
- Yan, S.; Deng, J.; Bae, C.; He, Y.; Asta, A.; Xiao, X. In-plane orthotropic property characterization of a polymeric battery separator. Polym. Test. 2018, 72, 46–54. [Google Scholar] [CrossRef]
- Avdeev, I.; Martinsen, M.; Francis, A. Rate-and temperature-dependent material behavior of a multilayer polymer battery separator. J. Mater. Eng. Perform. 2014, 23, 315–325. [Google Scholar] [CrossRef]
- Xu, J.; Wang, L.; Guan, J.; Yin, S. Coupled effect of strain rate and solvent on dynamic mechanical behaviors of separators in lithium-ion batteries. Mater. Des. 2016, 95, 319–328. [Google Scholar] [CrossRef]
- Zhu, J.; Wierzbicki, T.; Li, W. A review of safety-focused mechanical modeling of commercial lithium-ion batteries. J. Power Sources 2018, 378, 153–168. [Google Scholar] [CrossRef]
- Zhang, X.; Sahraei, E.; Wang, K. Li-ion battery separators, mechanical integrity and failure mechanisms leading to soft and hard internal shorts. Sci. Rep. 2016, 6, 32578. [Google Scholar] [CrossRef]
- Cannarella, J.; Liu, X.; Leng, C.Z.; Sinko, P.D.; Gor, G.Y.; Arnold, C.B. Mechanical properties of a battery separator under compression and tension. J. Electrochem. Soc. 2014, 161, F3117. [Google Scholar] [CrossRef]
- Sheidaei, A.; Xiao, X.; Huang, X.; Hitt, J. Mechanical behavior of a battery separator in electrolyte solutions. J. Power Sources 2011, 196, 8728–8734. [Google Scholar] [CrossRef]
- Yan, S.; Deng, J.; Bae, C.; Xiao, X. Thermal expansion/shrinkage measurement of battery separators using a dynamic mechanical analyzer. Polym. Test. 2018, 71, 65–71. [Google Scholar] [CrossRef]
- Love, C.T. Thermomechanical analysis and durability of commercial micro-porous polymer Li-ion battery separators. J. Power Sources 2011, 196, 2905–2912. [Google Scholar] [CrossRef]
- Chen, J.; Hu, H.; Li, S.; He, Y. Evolution of mechanical properties of polypropylene separator in liquid electrolytes for lithium-ion batteries. J. Appl. Polym. Sci. 2018, 135, 46441. [Google Scholar] [CrossRef]
- Gor, Y.; Cannarella, J.; Leng, C.Z.; Vishnyakov, A.; Arnold, C.B. Swelling and softening of lithium-ion battery separators in electrolyte solvents. J. Power Sources 2015, 294, 167–172. [Google Scholar] [CrossRef]
- Yan, S.; Xiao, X.; Huang, X.; Li, X.; Qi, Y. Unveiling the environment-dependent mechanical properties of porous polypropylene separators. Polymer 2014, 55, 6282–6292. [Google Scholar] [CrossRef]
- Yan, S.; Deng, J.; Bae, C.; Kalnaus, S.; Xiao, X. Orthotropic viscoelastic modeling of polymeric battery separator. J. Electrochem. Soc. 2020, 167, 090530. [Google Scholar] [CrossRef]
- Ihuaenyi, R.C.; Yan, S.; Deng, J.; Bae, C.; Sakib, I.; Xiao, X. Orthotropic thermo-viscoelastic model for polymeric battery separators with electrolyte effect. J. Electrochem. Soc. 2021, 168, 090536. [Google Scholar] [CrossRef]
- Ihuaenyi, R.C.; Deng, J.; Bae, C.; Xiao, X. An orthotropic nonlinear thermoviscoelastic model for polymeric battery separators. J. Electrochem. Soc. 2023, 170, 010520. [Google Scholar] [CrossRef]
- Zhao, G.; Xi, H.; Yang, J. Transversely Isotropic Constitutive Model of the Polypropylene Separator Based on Rich–Hill Elastoplastic Constitutive Theory. J. Electrochem. Energy Convers. Storage 2021, 18, 020911. [Google Scholar] [CrossRef]
- Zhang, X.; Sahraei, E.; Wang, K. Deformation and failure characteristics of four types of lithium-ion battery separators. J. Power Sources 2016, 327, 693–701. [Google Scholar] [CrossRef]
- Xie, W.; Wu, L.; Liu, W.; Dang, Y.; Tang, A.; Luo, Y. Modelling electrolyte-immersed tensile property of polypropylene separator for lithium-ion battery. Mech. Mater. 2021, 152, 103667. [Google Scholar] [CrossRef]
- Makki, M.; Ayoub, G.; Lee, C.W. Modeling the anisotropic behavior of highly orthotropic lithium-ion batteries polymer separators. Int. J. Solids Struct. 2023, 264, 112102. [Google Scholar] [CrossRef]
- Findley, W.N.; Lai, J.S.; Onaran, K. Creep and Relaxation of Nonlinear Viscoelastic Materials; Dover Publications, Inc.: New York, NY, USA, 1976. [Google Scholar]
- Schapery, R.A. Nonlinear viscoelastic and viscoplastic constitutive equations based on thermodynamics. Mech. Time-Depend. Mater. 1997, 1, 209–240. [Google Scholar] [CrossRef]
- Schapery, R.A. Nonlinear viscoelastic and viscoplastic constitutive equations with growing damage. Int. J. Fract. 1999, 97, 33–66. [Google Scholar] [CrossRef]
- Lai, J.; Bakker, A. An integral constitutive equation for nonlinear plasto-viscoelastic behavior of high-density polyethylene. Polym. Eng. Sci. 1995, 35, 1339–1347. [Google Scholar] [CrossRef]
- Brusselle-Dupend, N.; Lai, D.; Feaugas, X.; Guigon, M.; Clavel, M. Mechanical behavior of a semicrystalline polymer before necking. Part I: Characterization of uniaxial behavior. Polym. Eng. Sci. 2001, 41, 66–76. [Google Scholar] [CrossRef]
- Brusselle-Dupend, N.; Lai, D.; Feaugas, X.; Guigon, M.; Clavel, M. Mechanical behavior of a semicrystalline polymer before necking. Part II: Modeling of uniaxial behavior. Polym. Eng. Sci. 2003, 43, 501–518. [Google Scholar] [CrossRef]
- Kletschkowski, T.; Schomburg, U.; Bertram, A. An endochronic viscoplastic approach for materials with different behavior in tension and compression. Mech. Time-Depend. Mater. 2004, 8, 119–135. [Google Scholar] [CrossRef]
- Zhang, C.; Moore, I.D. Nonlinear mechanical response of high-density polyethylene. Part I: Experimental investigation and model evaluation. Polym. Eng. Sci. 1997, 37, 404–413. [Google Scholar] [CrossRef]
- Zhang, C.; Moore, I.D. Nonlinear mechanical response of high-density polyethylene. Part II: Uniaxial constitutive modeling. Polym. Eng. Sci. 1997, 37, 414–420. [Google Scholar] [CrossRef]
- Peric, D.; Dettmer, W. A computational model for generalized inelastic materials at finite strains combining elastic, viscoelastic and plastic material behavior. Eng. Comput. 2003, 20, 768–787. [Google Scholar] [CrossRef]
- Wang, W.M.; Sluys, L.J.; Borst, R.R. Viscoplasticity for instabilities due to strain softening and strain-rate softening. Int. J. Numer. Methods Eng. 1997, 40, 3839–3864. [Google Scholar] [CrossRef]
- Ristinmaa, M.; Ottosen, N.S. Consequences of dynamic yield surface in viscoplasticity. Int. J. Solids Struct. 2000, 37, 4601–4622. [Google Scholar] [CrossRef]
- Carosio, A.; Willam, K.; Etse, G. On the consistency of viscoplastic formulations. Int. J. Solids Struct. 2000, 37, 7349–7369. [Google Scholar] [CrossRef]
- Heeres, O.M.; Suiker, A.S.J.; De Borst, R. A comparison between the Perzyna viscoplastic model and the consistency viscoplastic model. Eur. J. Mech. A/Solids 2002, 21, 1–12. [Google Scholar] [CrossRef]
- Zaera, R.; Fernandez-Saez, J. An implicit consistent algorithm for the integration of thermoviscoplastic constitutive equations in adiabatic conditions and finite deformations. Int. J. Solids Struct. 2006, 43, 1594–1612. [Google Scholar] [CrossRef]
- Perzyna, P. Fundamental Problems in Viscoplasticity. Adv. Appl. Mech. 1966, 9, 243–377. [Google Scholar]
- Duvaut, G.; Lions, J.L. Les Inequations en Mecanique et en Physique; Dunod: Paris, France, 1972. [Google Scholar]
- Zienkiewicz, O.C.; Cormeau, I.C. Visco-Plasticity-Plasticity and Creep in Elastic Solids—A unified numerical solution approach. Int. J. Numer. Methods Eng. 1974, 8, 821–845. [Google Scholar] [CrossRef]
- Hughes, T.J.; Taylor, R.L. Unconditionally stable algorithms for quasi-static elasto/visco-plastic finite element analysis. Comput. Struct. 1978, 8, 169–173. [Google Scholar] [CrossRef]
- Cormeau, I. Numerical stability in quasistatic elasto/viscoplasticity. Int. J. Numer. Methods Eng. 1975, 9, 109–127. [Google Scholar] [CrossRef]
- Simo, J.C.; Kennedy, J.G.; Govindjee, S. Non-smooth multisurface plasticity and viscoplasticity. Loading/unloading conditions and numerical algorithms. Int. J. Numer. Methods Eng. 1988, 26, 2161–2185. [Google Scholar] [CrossRef]
- Chaboche, J.L. Constitutive equations for cyclic plasticity and cyclic viscoplasticity. Int. J. Plast. 1989, 5, 247–302. [Google Scholar] [CrossRef]
- Peric, D. On a class of constitutive equations in viscoplasticity: Formulation and computational issues. Int. J. Numer. Methods Eng. 1993, 36, 1365–1393. [Google Scholar] [CrossRef]
- Ristinmaa, M.; Ottosen, N.S. Viscoplasticity based on an additive split of the conjugated forces. Eur. J. Mech. A/Solids 1998, 17, 207–235. [Google Scholar] [CrossRef]
- Runesson, K.; Ristinmaa, M.; Mahler, L. Comparison of viscoplasticity formats and algorithms. Mech. Cohesive-Frict. Mater. 1999, 4, 75–98. [Google Scholar] [CrossRef]
- Caggiano, A.; Martinelli, E.; Schicchi, D.S.; Etse, G. A modified Duvaut-Lions zero-thickness interface model for simulating the rate-dependent bond behavior of FRP-concrete joints. Compos. Part B Eng. 2018, 149, 260–267. [Google Scholar] [CrossRef]
- Ibrahimbegovic, A.; Chorfi, L. Viscoplasticity model at finite deformations with combined isotropic and kinematic hardening. Comput. Struct. 2000, 77, 509–525. [Google Scholar] [CrossRef]
- Nedjar, B. Frameworks for finite strain viscoelastic-plasticity based on multiplicative decompositions. Part I: Continuum formulations. Comput. Methods Appl. Mech. Eng. 2002, 191, 1541–1562. [Google Scholar] [CrossRef]
- Shutov, V.; Kreißig, R. Finite strain viscoplasticity with nonlinear kinematic hardening: Phenomenological modeling and time integration. Comput. Methods Appl. Mech. Eng. 2008, 197, 2015–2029. [Google Scholar] [CrossRef]
- Kowalczyk-Gajewska, K.; Pieczyska, E.A.; Golasinski, K.; Maj, M.; Kuramoto, S.; Furutab, T. A finite strain elastic-viscoplastic model of Gum Metal. Int. J. Plast. 2019, 119, 85–101. [Google Scholar] [CrossRef]
- G’sell, C.; Jonas, J.J. Determination of the plastic behaviour of solid polymers at constant true strain rate. J. Mater. Sci. 1979, 14, 583–591. [Google Scholar] [CrossRef]
- Morin, D.; Haugou, G.; Lauro, F.; Bennani, B.; Bourel, B. Elasto-viscoplasticity behaviour of a structural adhesive under compression loadings at low, moderate and high strain rates. J. Dyn. Behav. Mater. 2015, 1, 124–135. [Google Scholar] [CrossRef]
- Múgica, J.I.; Aretxabaleta, L.; Ulacia, I.; Aurrekoetxea, J. Rate-dependent phenomenological model for self-reinforced polymers. Compos. Part A Appl. Sci. Manuf. 2016, 84, 96–102. [Google Scholar] [CrossRef]
- Schoßig, M.; Bierögel, C.; Grellmann, W.; Mecklenburg, T. Mechanical behavior of glass-fiber reinforced thermoplastic materials under high strain rates. Polym. Test. 2008, 27, 893–900. [Google Scholar] [CrossRef]
- Torres, J.P.; Frontini, P.M.; Aretxabaleta, L. Experimental characterization and computational simulations of the low-velocity impact behaviour of polypropylene. Polym. Int. 2013, 62, 1553–1559. [Google Scholar] [CrossRef]
- Johnson, R.; Cook, W.H. A constitutive model and data for materials subjected to large strains, high strain rates, high temperatures. In Proceedings of the 7th International Symposium on Ballistics, Hague, The Netherlands, 19–21 April 1983; pp. 541–547. [Google Scholar]
- Chen, F.; Ou, H.; Lu, B.; Long, H. A constitutive model of polyether-ether-ketone (PEEK). J. Mech. Behav. Biomed. Mater. 2016, 53, 427–433. [Google Scholar] [CrossRef]
- Garcia-Gonzalez, D.; Rusinek, A.; Jankowiak, T.; Arias, A. Mechanical impact behavior of polyether–ether–ketone (PEEK). Compos. Struct. 2015, 124, 88–99. [Google Scholar] [CrossRef]
- Nasraoui, M.; Forquin, P.; Siad, L.; Rusinek, A. Influence of strain rate, temperature and adiabatic heating on the mechanical behaviour of poly-methyl-methacrylate: Experimental and modelling analyses. Mater. Des. 2012, 37, 500–509. [Google Scholar] [CrossRef]
- Duan, Y.; Saigal, A.; Greif, R.; Zimmerman, M.A. A uniform phenomenological constitutive model for glassy and semicrystalline polymers. Polym. Eng. Sci. 2001, 41, 1322–1328. [Google Scholar] [CrossRef]
- Zhu, H.; Ou, H.; Popov, A. A new phenomenological constitutive model for thermoplastics. Mech. Mater. 2021, 157, 103817. [Google Scholar] [CrossRef]
- Ferry, J.D. Viscoelastic Properties of Polymers; John Wiley & Sons: Hoboken, NJ, USA, 1980. [Google Scholar]
- Ward, I.M.; Sweeney, J. An Introduction to the Mechanical Properties of Solid Polymers; John Wiley & Sons: Hoboken, NJ, USA, 2004. [Google Scholar]
- Brinson, H.F.; Brinson, L.C. Polymer Engineering Science and Viscoelasticity. An Introduction; Springer: New York, NY, USA, 2008; pp. 99–157. [Google Scholar]
- Wineman, A.S.; Rajagopal, K.R. Mechanical Response of Polymers: An Introduction; Cambridge University Press: Cambridge, UK, 2000. [Google Scholar]
- Christensen, R.M. Theory of Viscoelasticity: An Introduction, 2nd ed.; Academic Press: New York, NY, USA, 1982. [Google Scholar]
- Schapery, R.A. On the characterization of nonlinear viscoelastic materials. Polym. Eng. Sci. 1969, 9, 295–310. [Google Scholar] [CrossRef]
- Daniel, I.M.; Ishai, O. Engineering Mechanics of Composite Materials; Oxford University Press: Oxford, UK, 2006. [Google Scholar]
- Williams, M.L.; Landel, R.F.; Ferry, J.D. The temperature dependence of relaxation mechanisms in amorphous polymers and other glass-forming liquids. J. Am. Chem. Soc. 1955, 77, 3701–3707. [Google Scholar] [CrossRef]
- Kalnaus, S.; Kumar, A.; Wang, Y.; Li, J.; Simunovic, S.; Turner, J.A.; Gorney, P. Strain distribution and failure mode of polymer separators for Li-ion batteries under biaxial loading. J. Power Sources 2018, 378, 139–145. [Google Scholar] [CrossRef]
Figure 1.
Generalized Maxwell Model.

Figure 2.
Rheological framework for viscoplastic model.
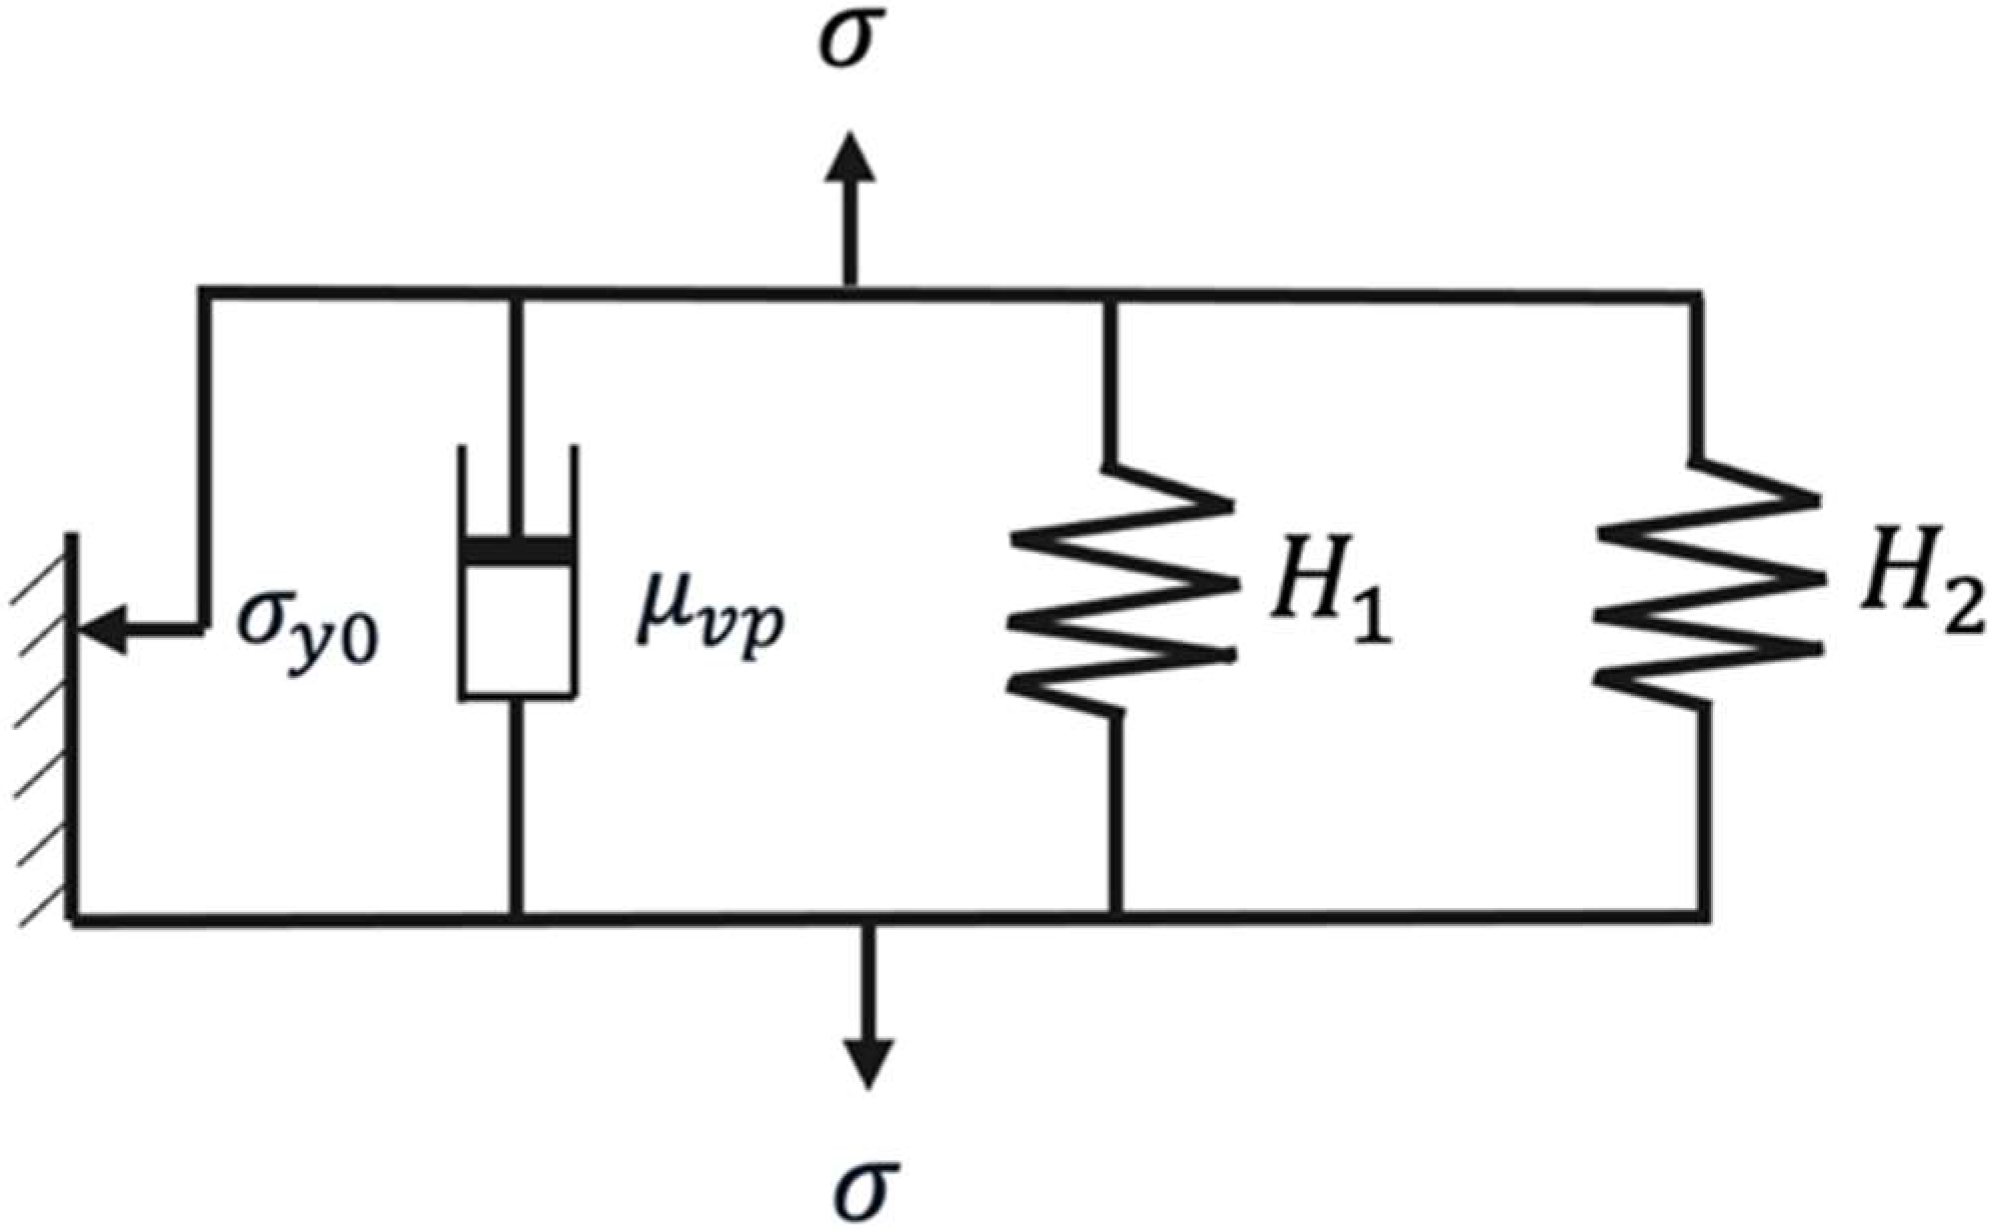
Figure 3.
Experimental setup for uniaxial tensile tests: (a) sample fixture; (b) liquified nitrogen tank connected to the rheometer.
Figure 3.
Experimental setup for uniaxial tensile tests: (a) sample fixture; (b) liquified nitrogen tank connected to the rheometer.
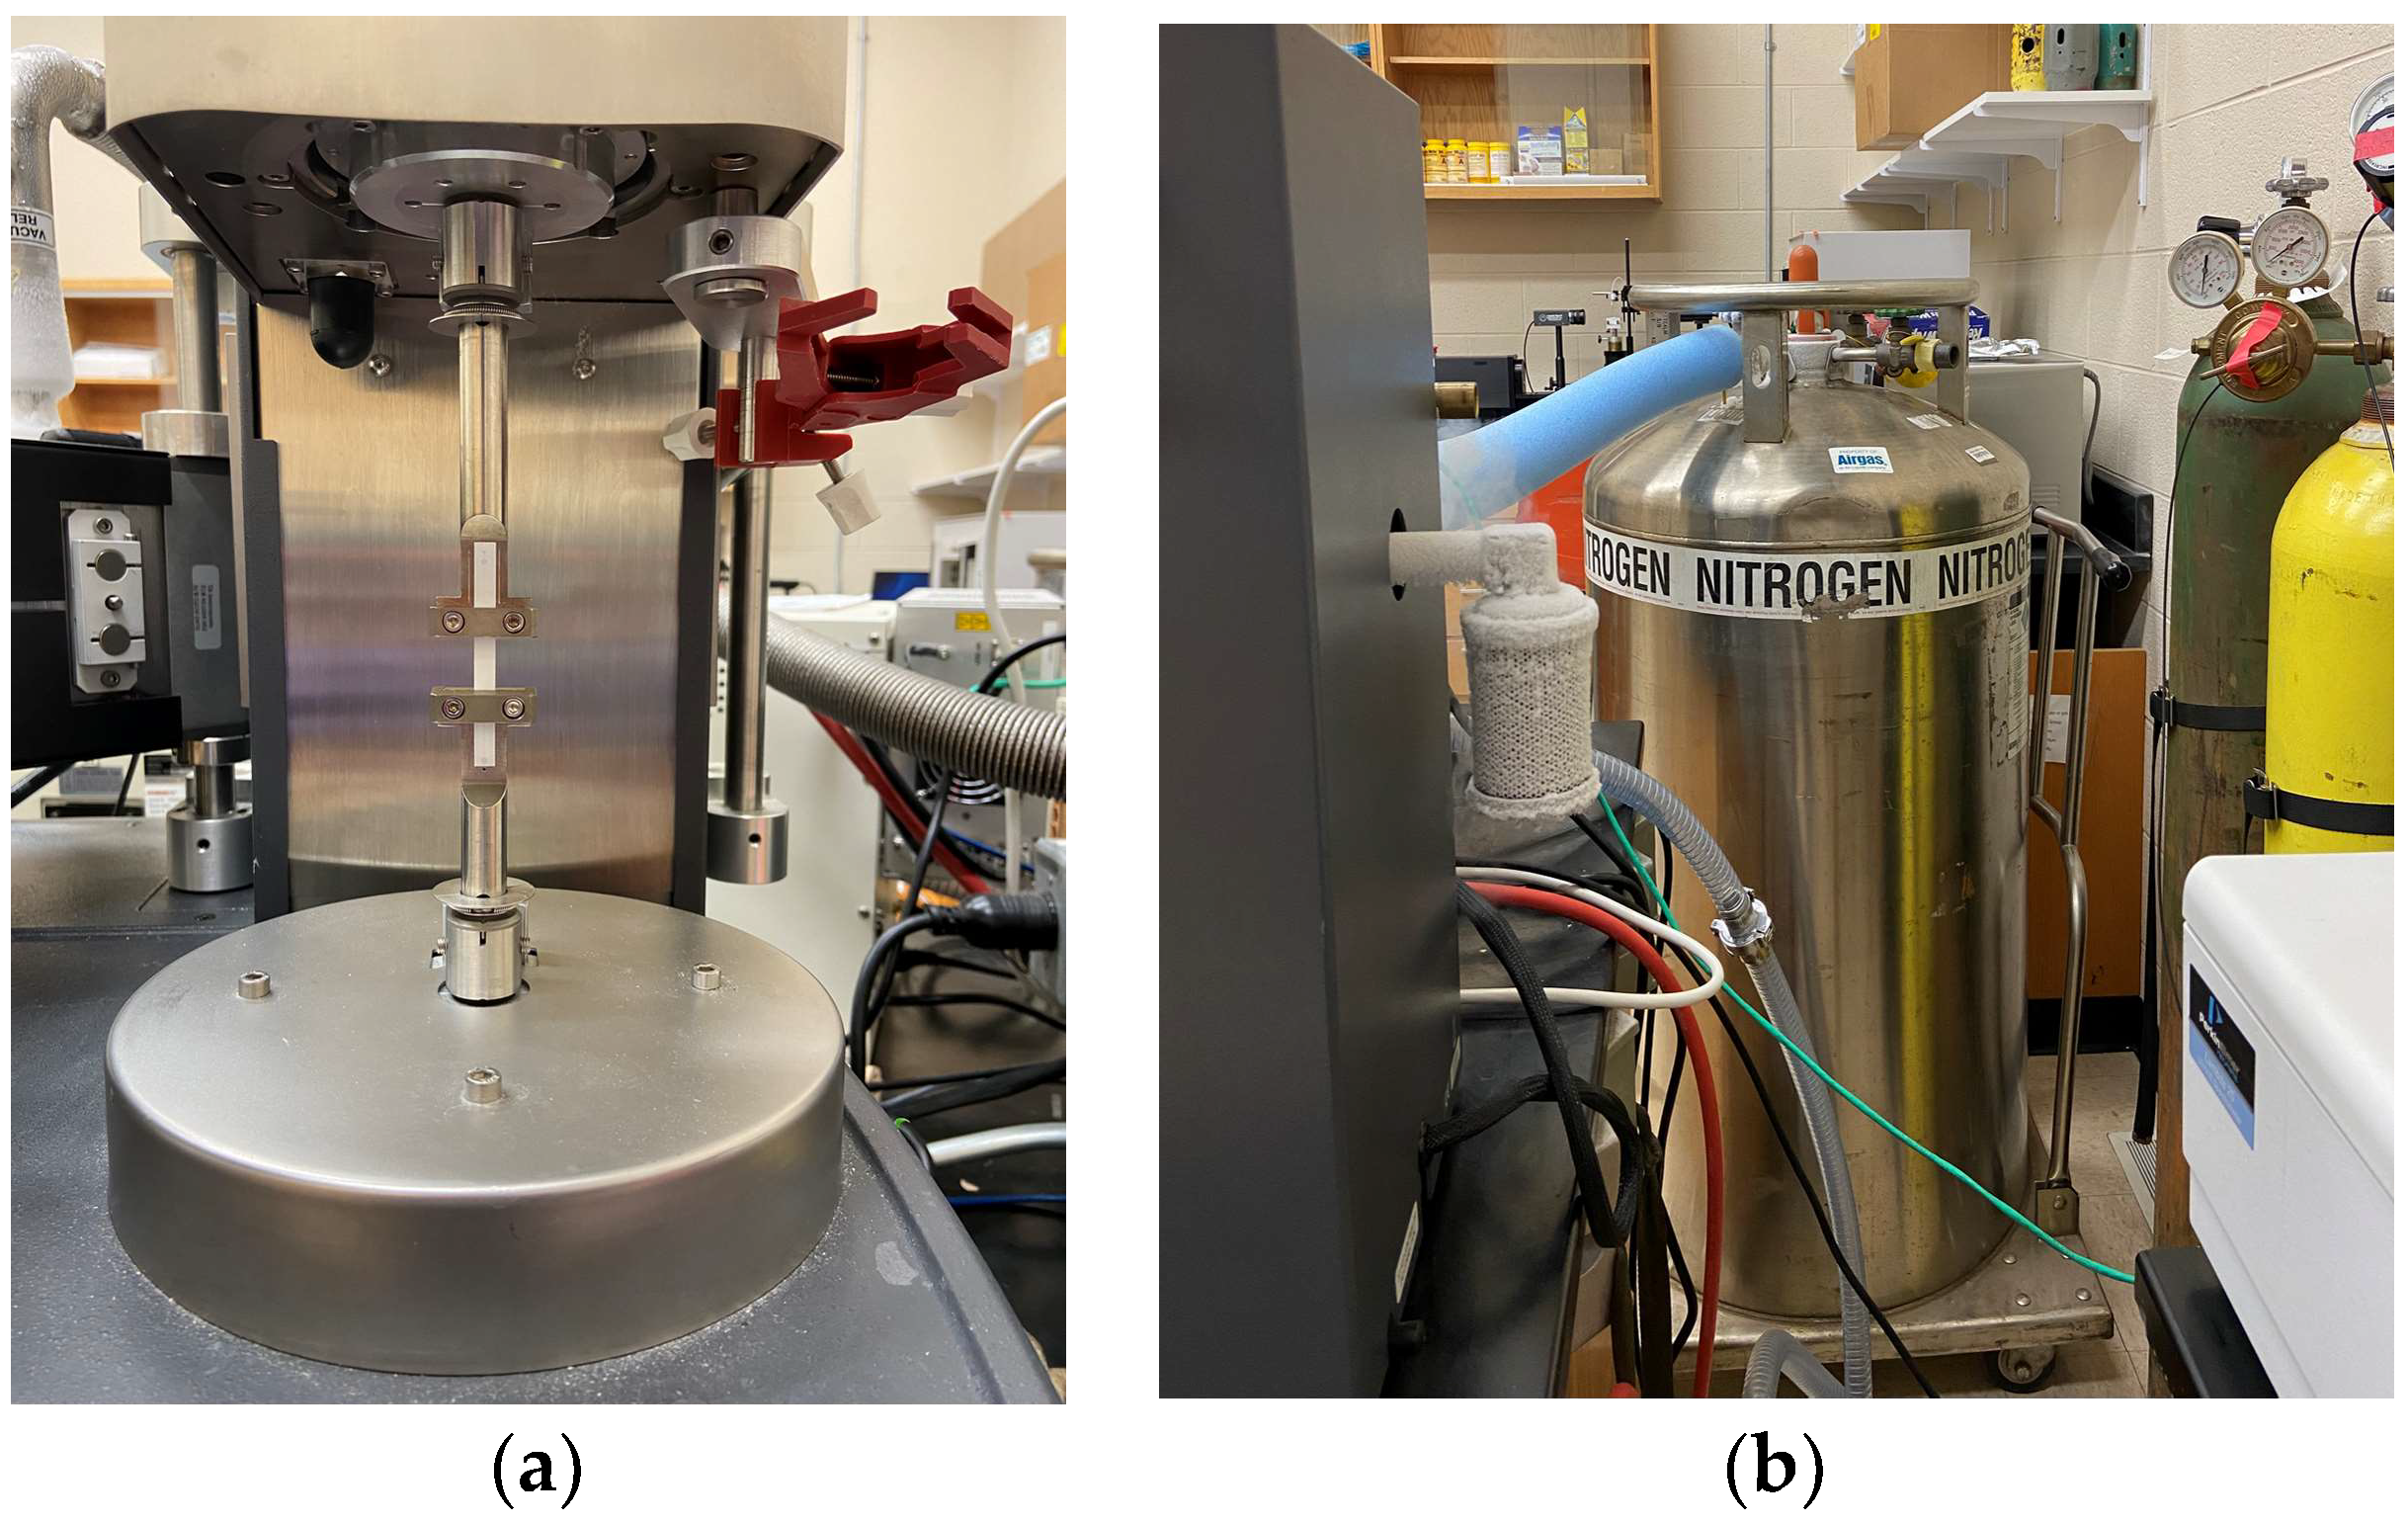
Figure 4.
Uniaxial tensile stress–strain curves for samples cut along the MD carried out at different strain rates and temperatures of (a) 20 °C, (b) 30 °C, (c) 40 °C and (d) 50 °C.
Figure 4.
Uniaxial tensile stress–strain curves for samples cut along the MD carried out at different strain rates and temperatures of (a) 20 °C, (b) 30 °C, (c) 40 °C and (d) 50 °C.
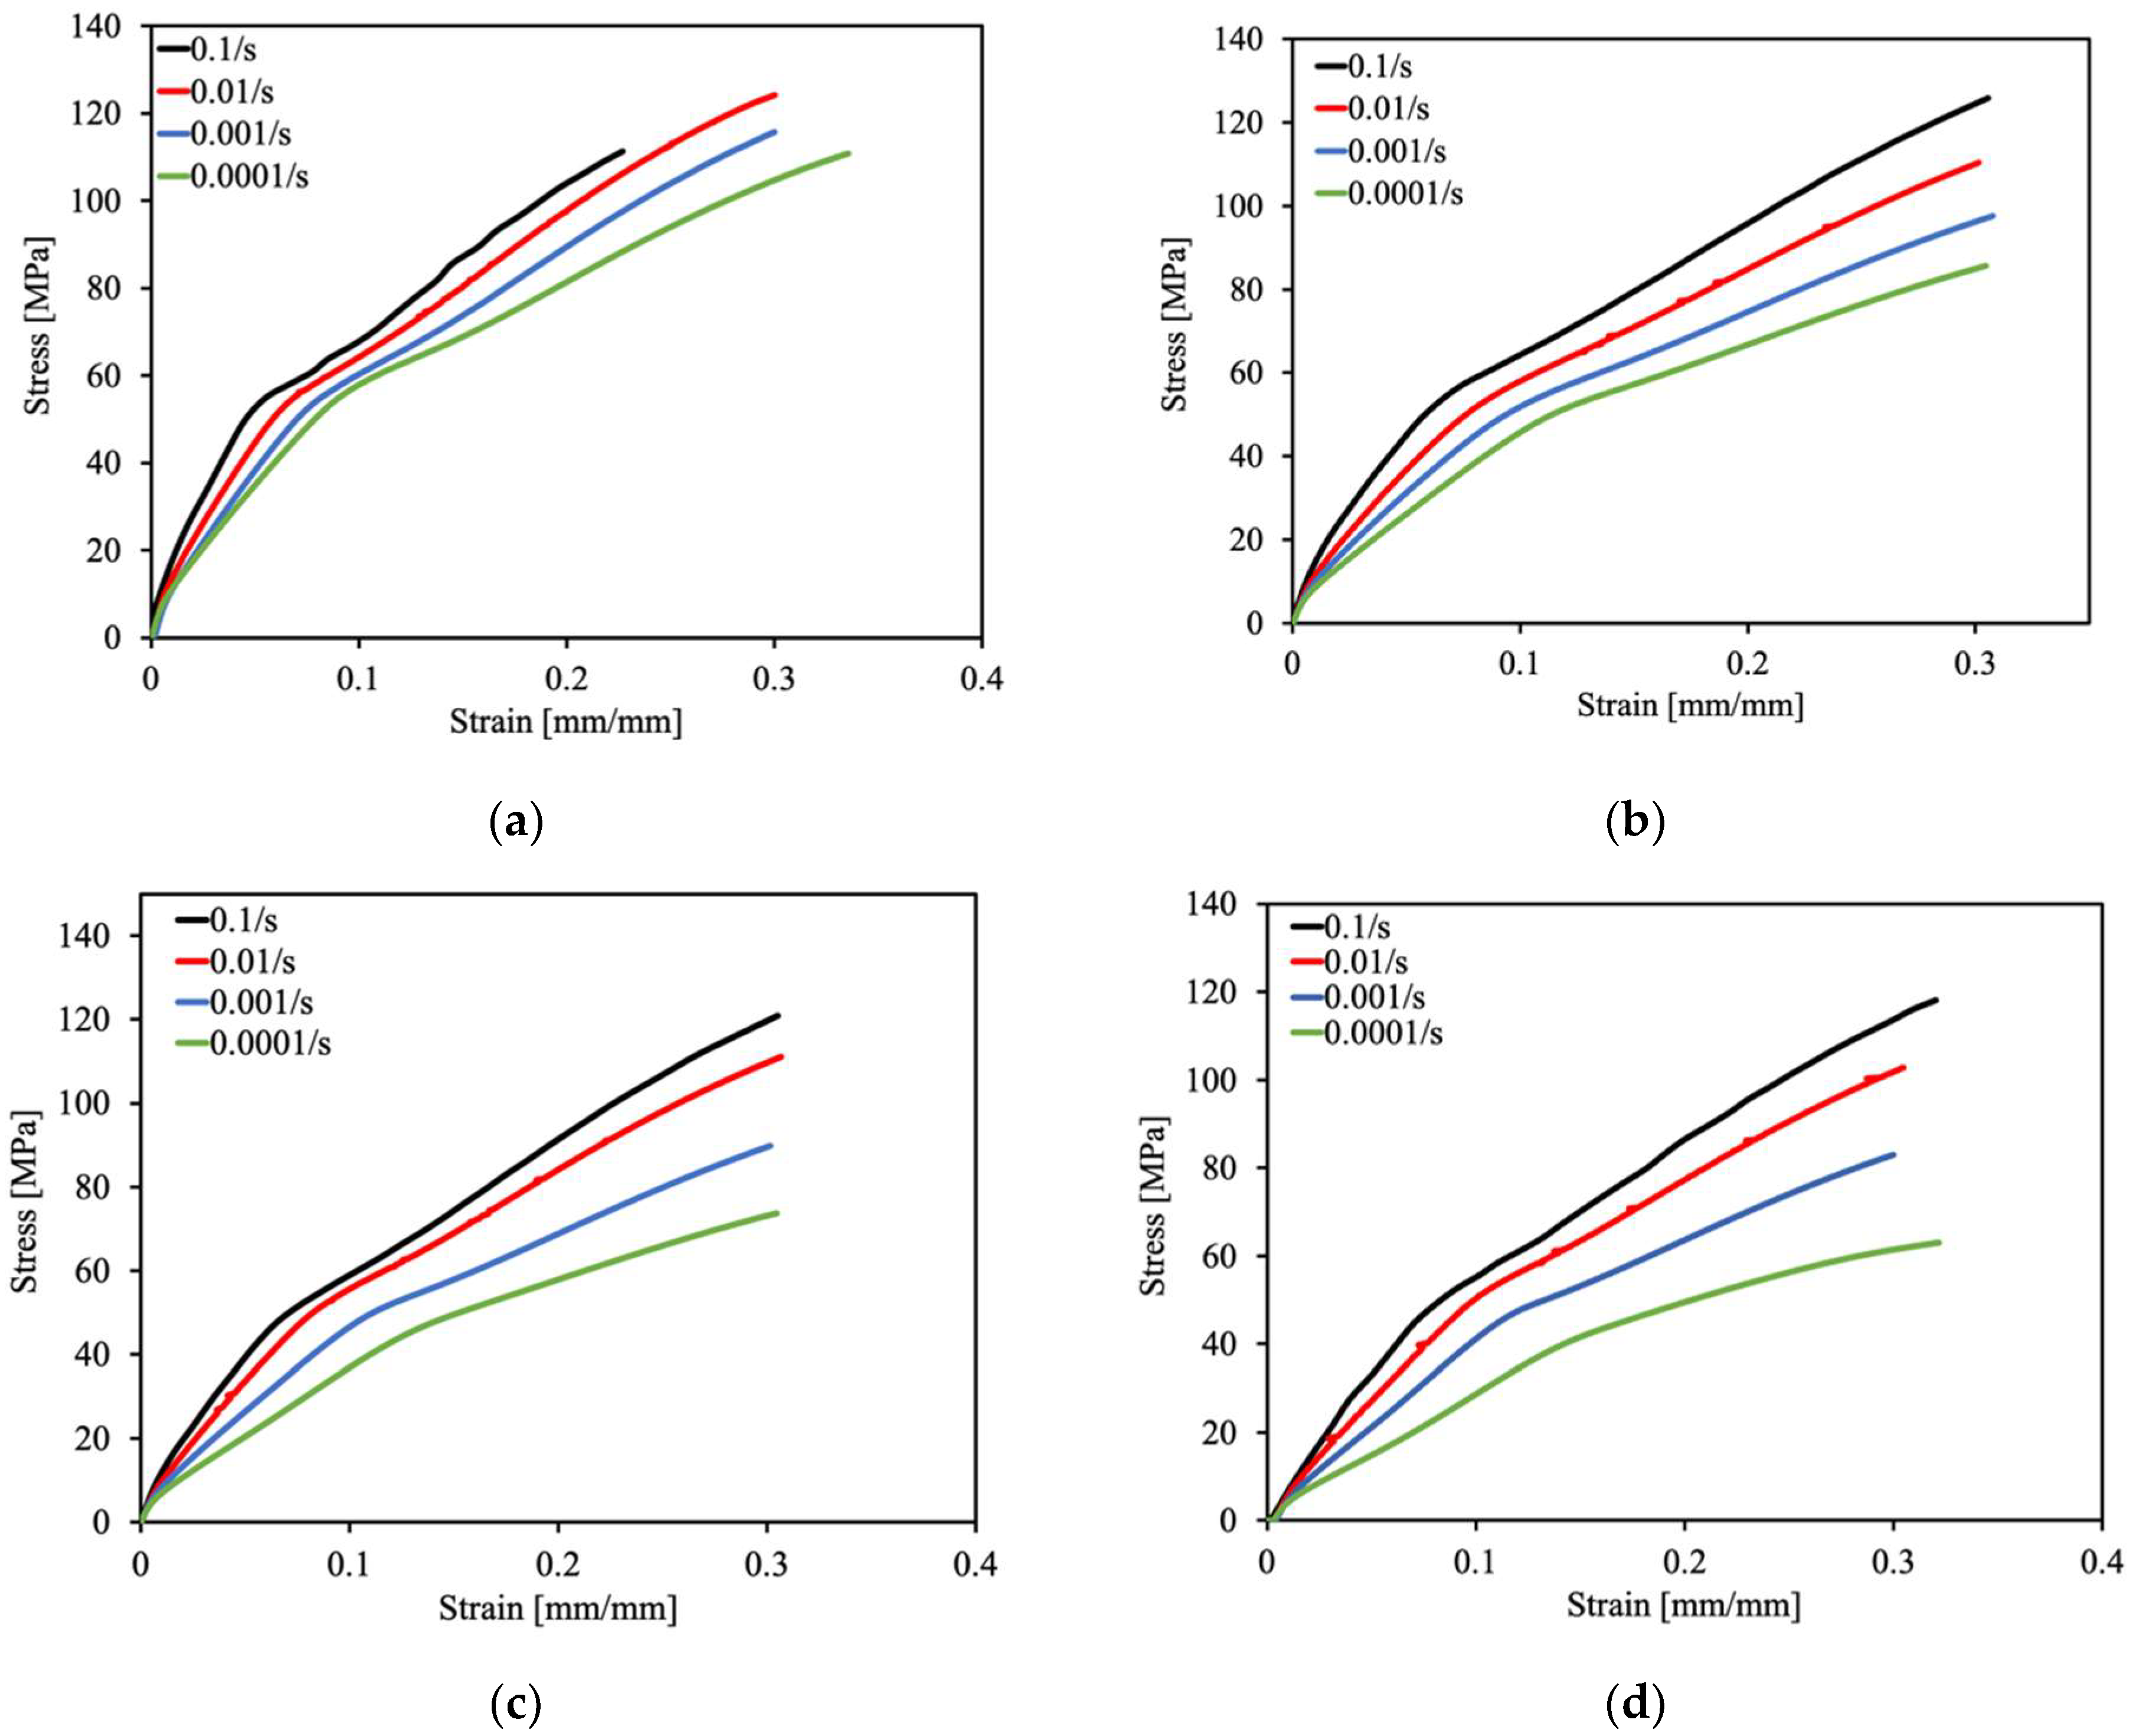
Figure 5.
Uniaxial tensile stress–strain curves for samples cut along the TD carried out at different strain rates and temperatures of (a) 20 °C, (b) 30 °C, (c) 40 °C and (d) 50 °C.
Figure 5.
Uniaxial tensile stress–strain curves for samples cut along the TD carried out at different strain rates and temperatures of (a) 20 °C, (b) 30 °C, (c) 40 °C and (d) 50 °C.
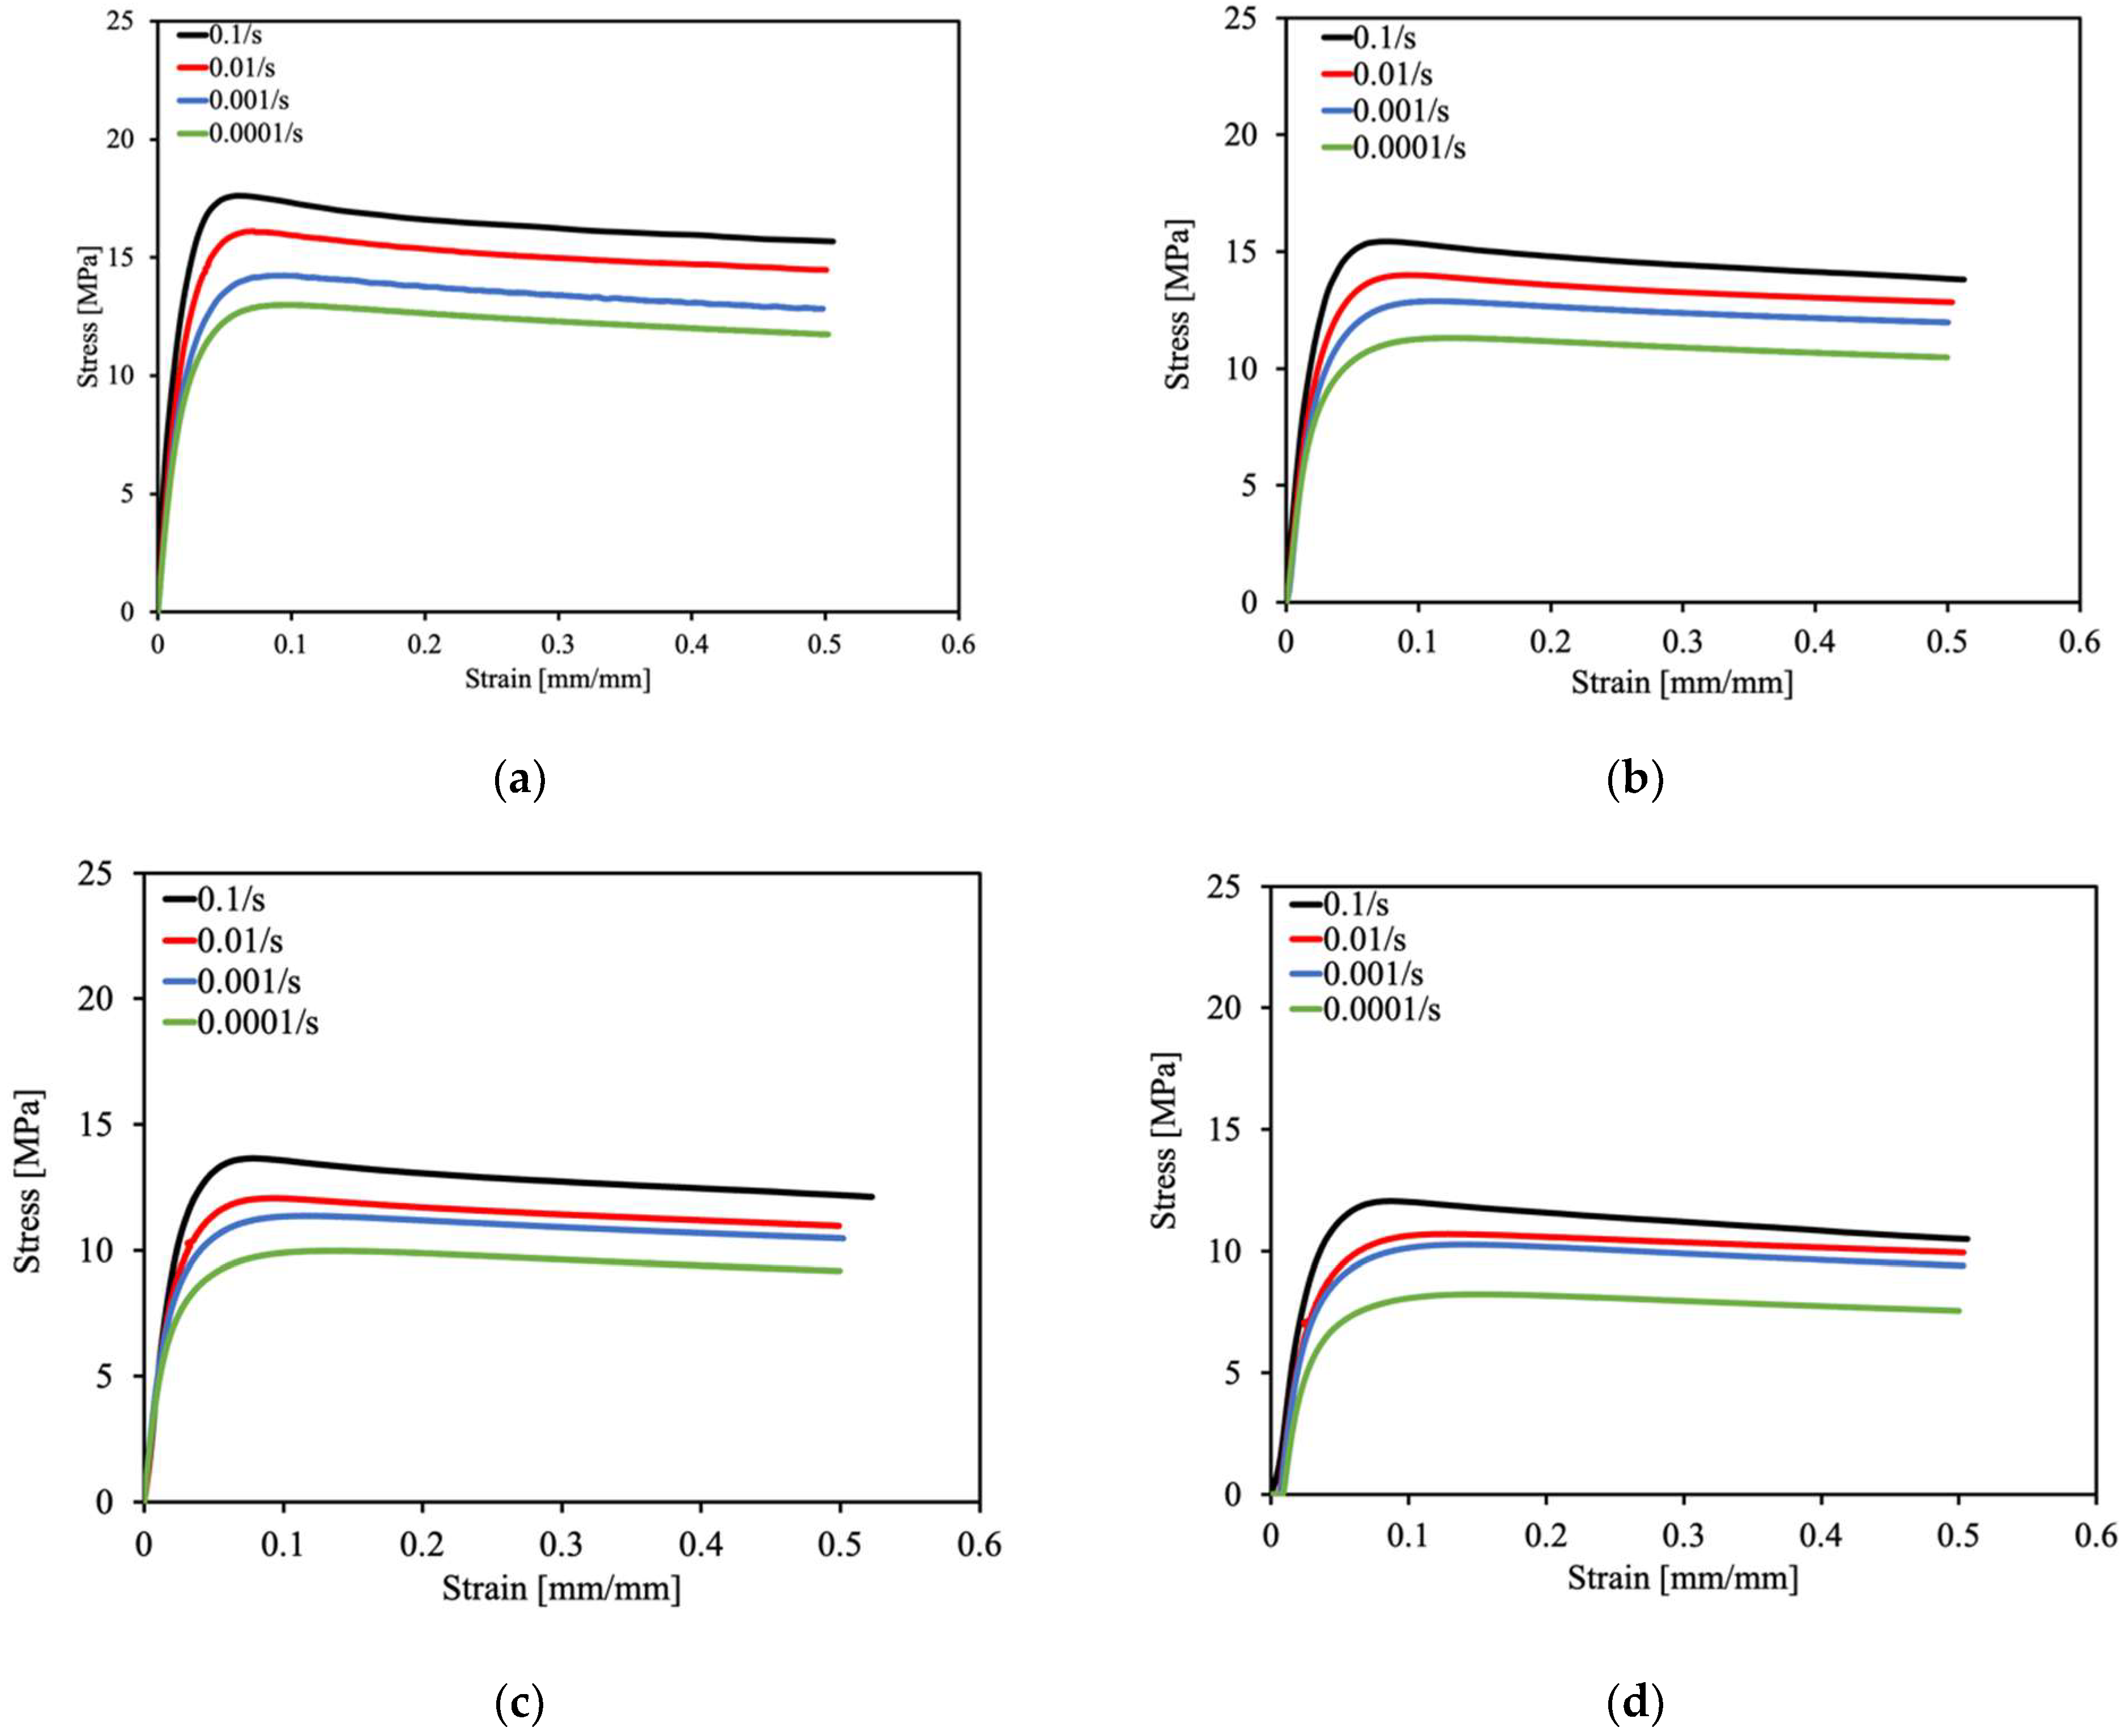
Figure 6.
Typical post-test geometry of samples under tension in the (a) MD and (b) TD.
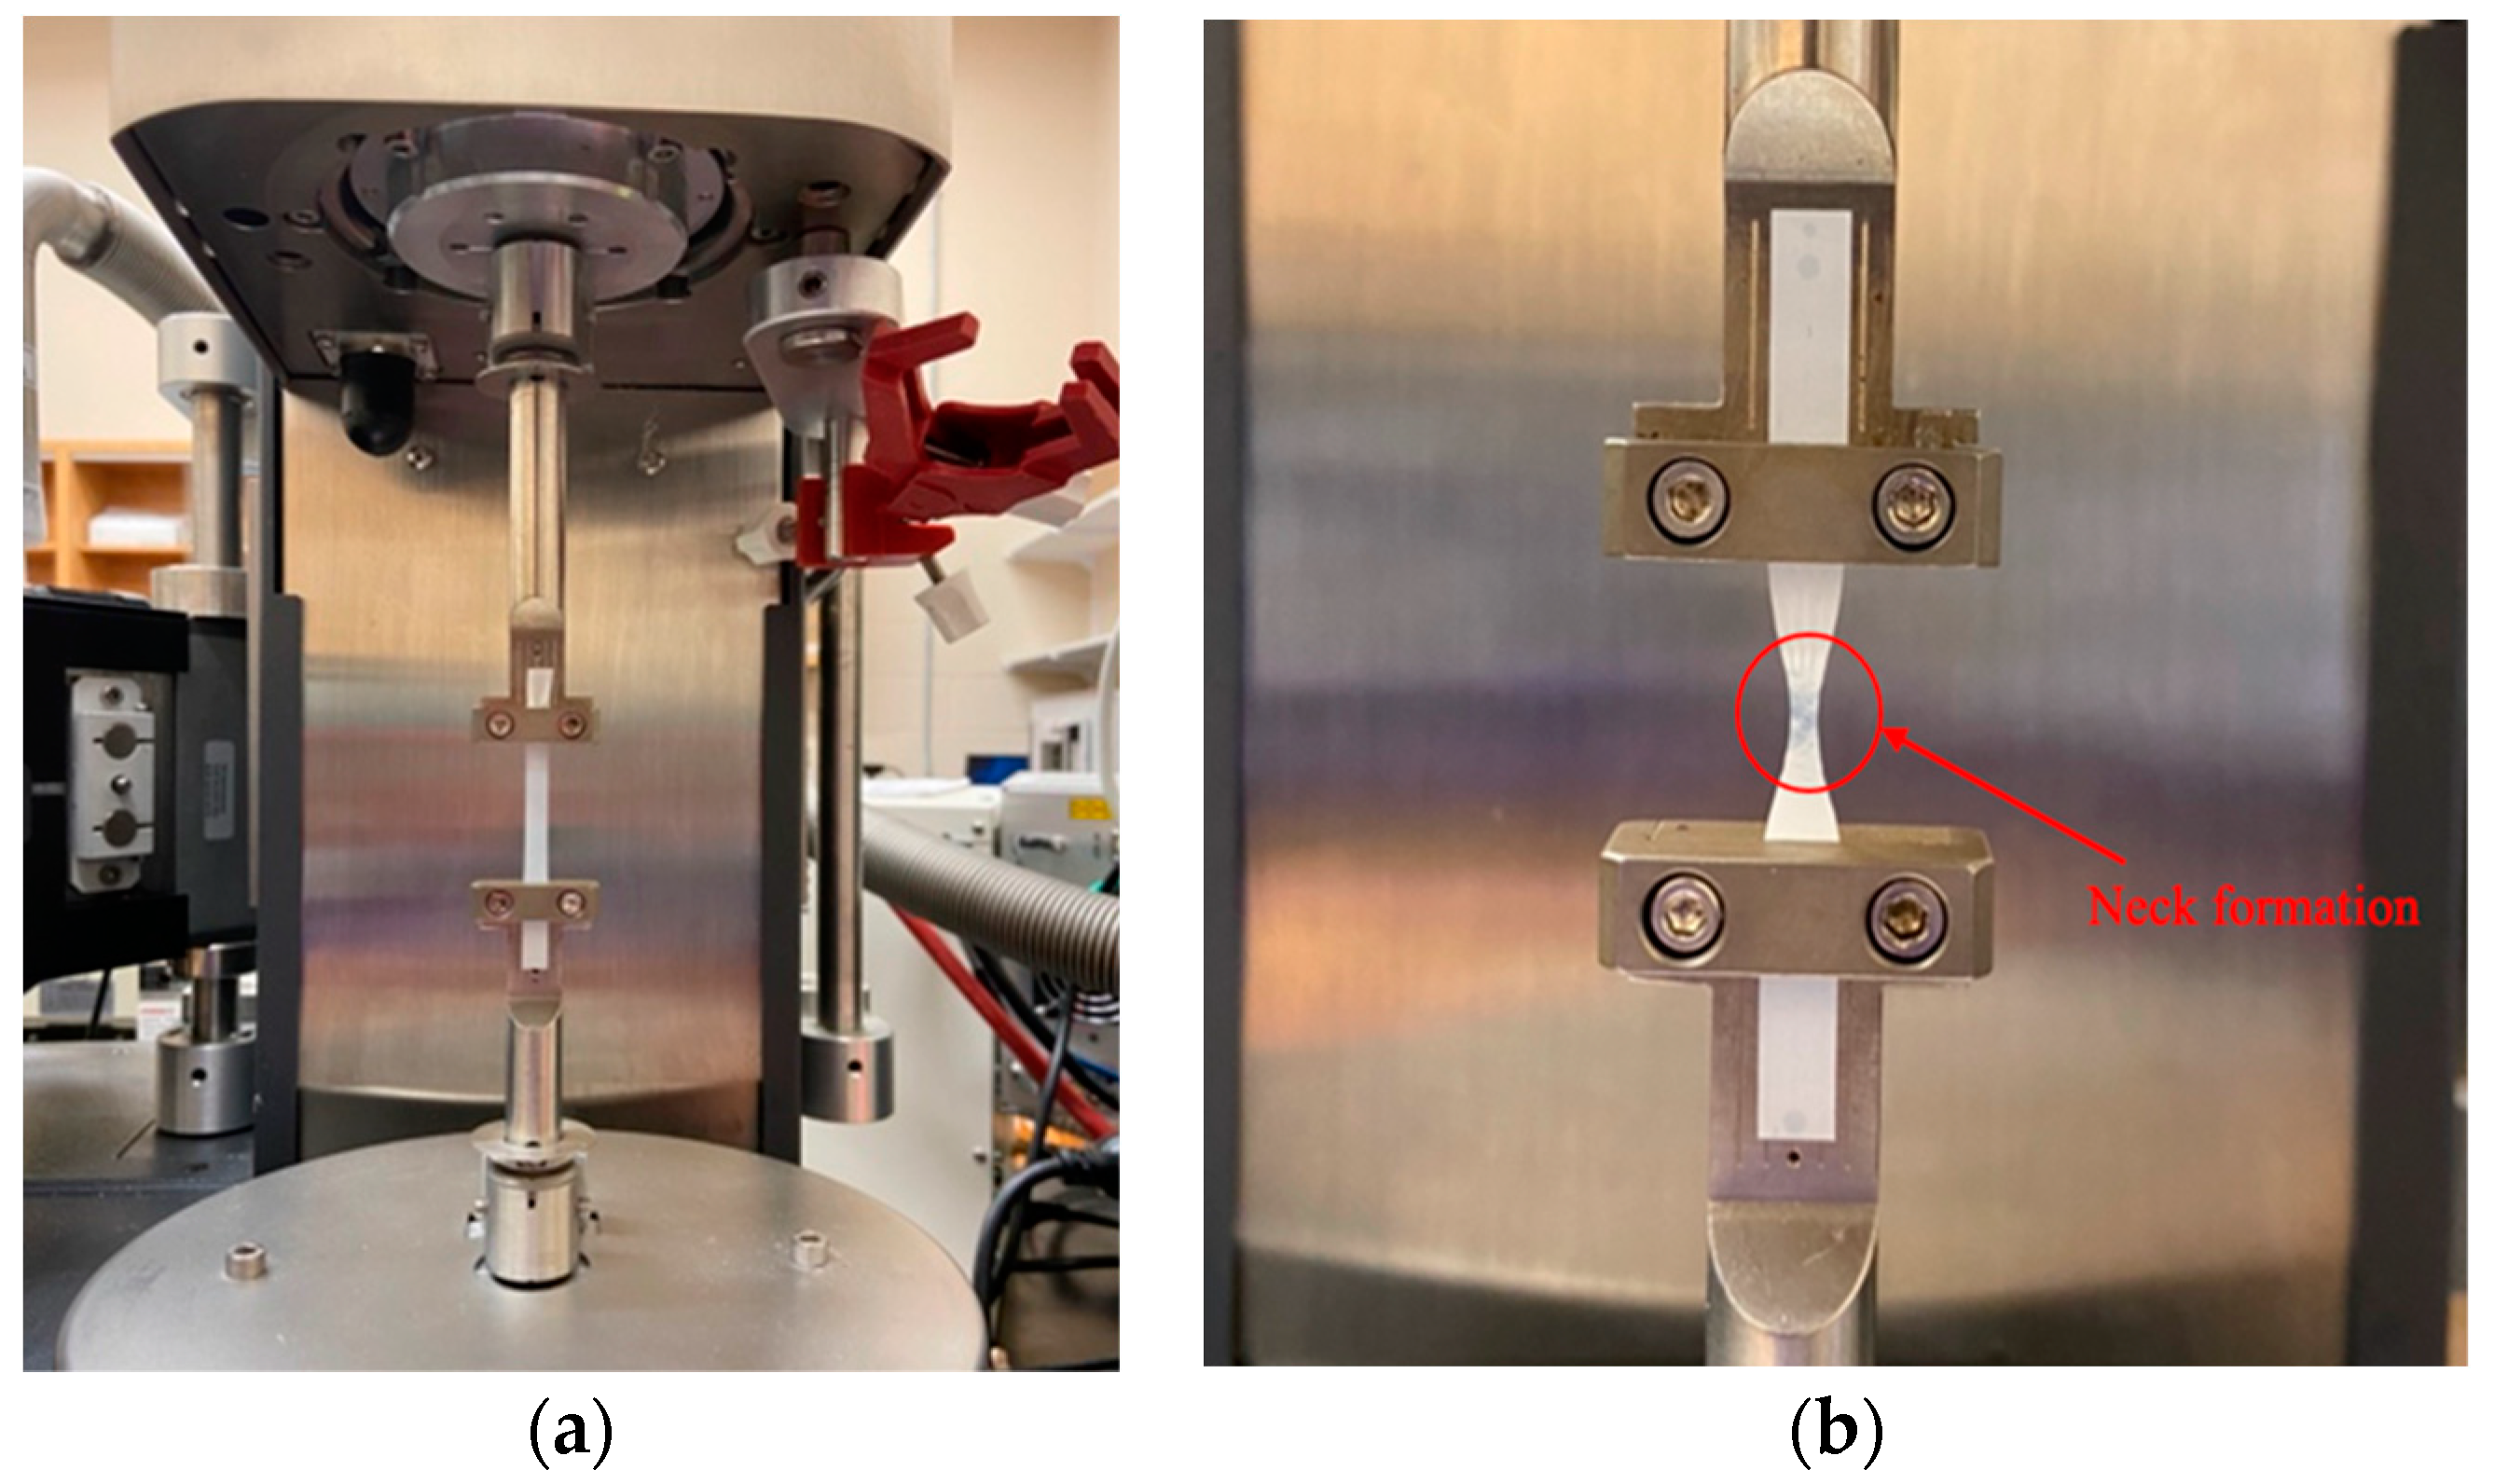
Figure 7.
Curve fitting for identifying viscoplastic model parameters at 20 °C in the (a) MD and (b) TD.
Figure 7.
Curve fitting for identifying viscoplastic model parameters at 20 °C in the (a) MD and (b) TD.
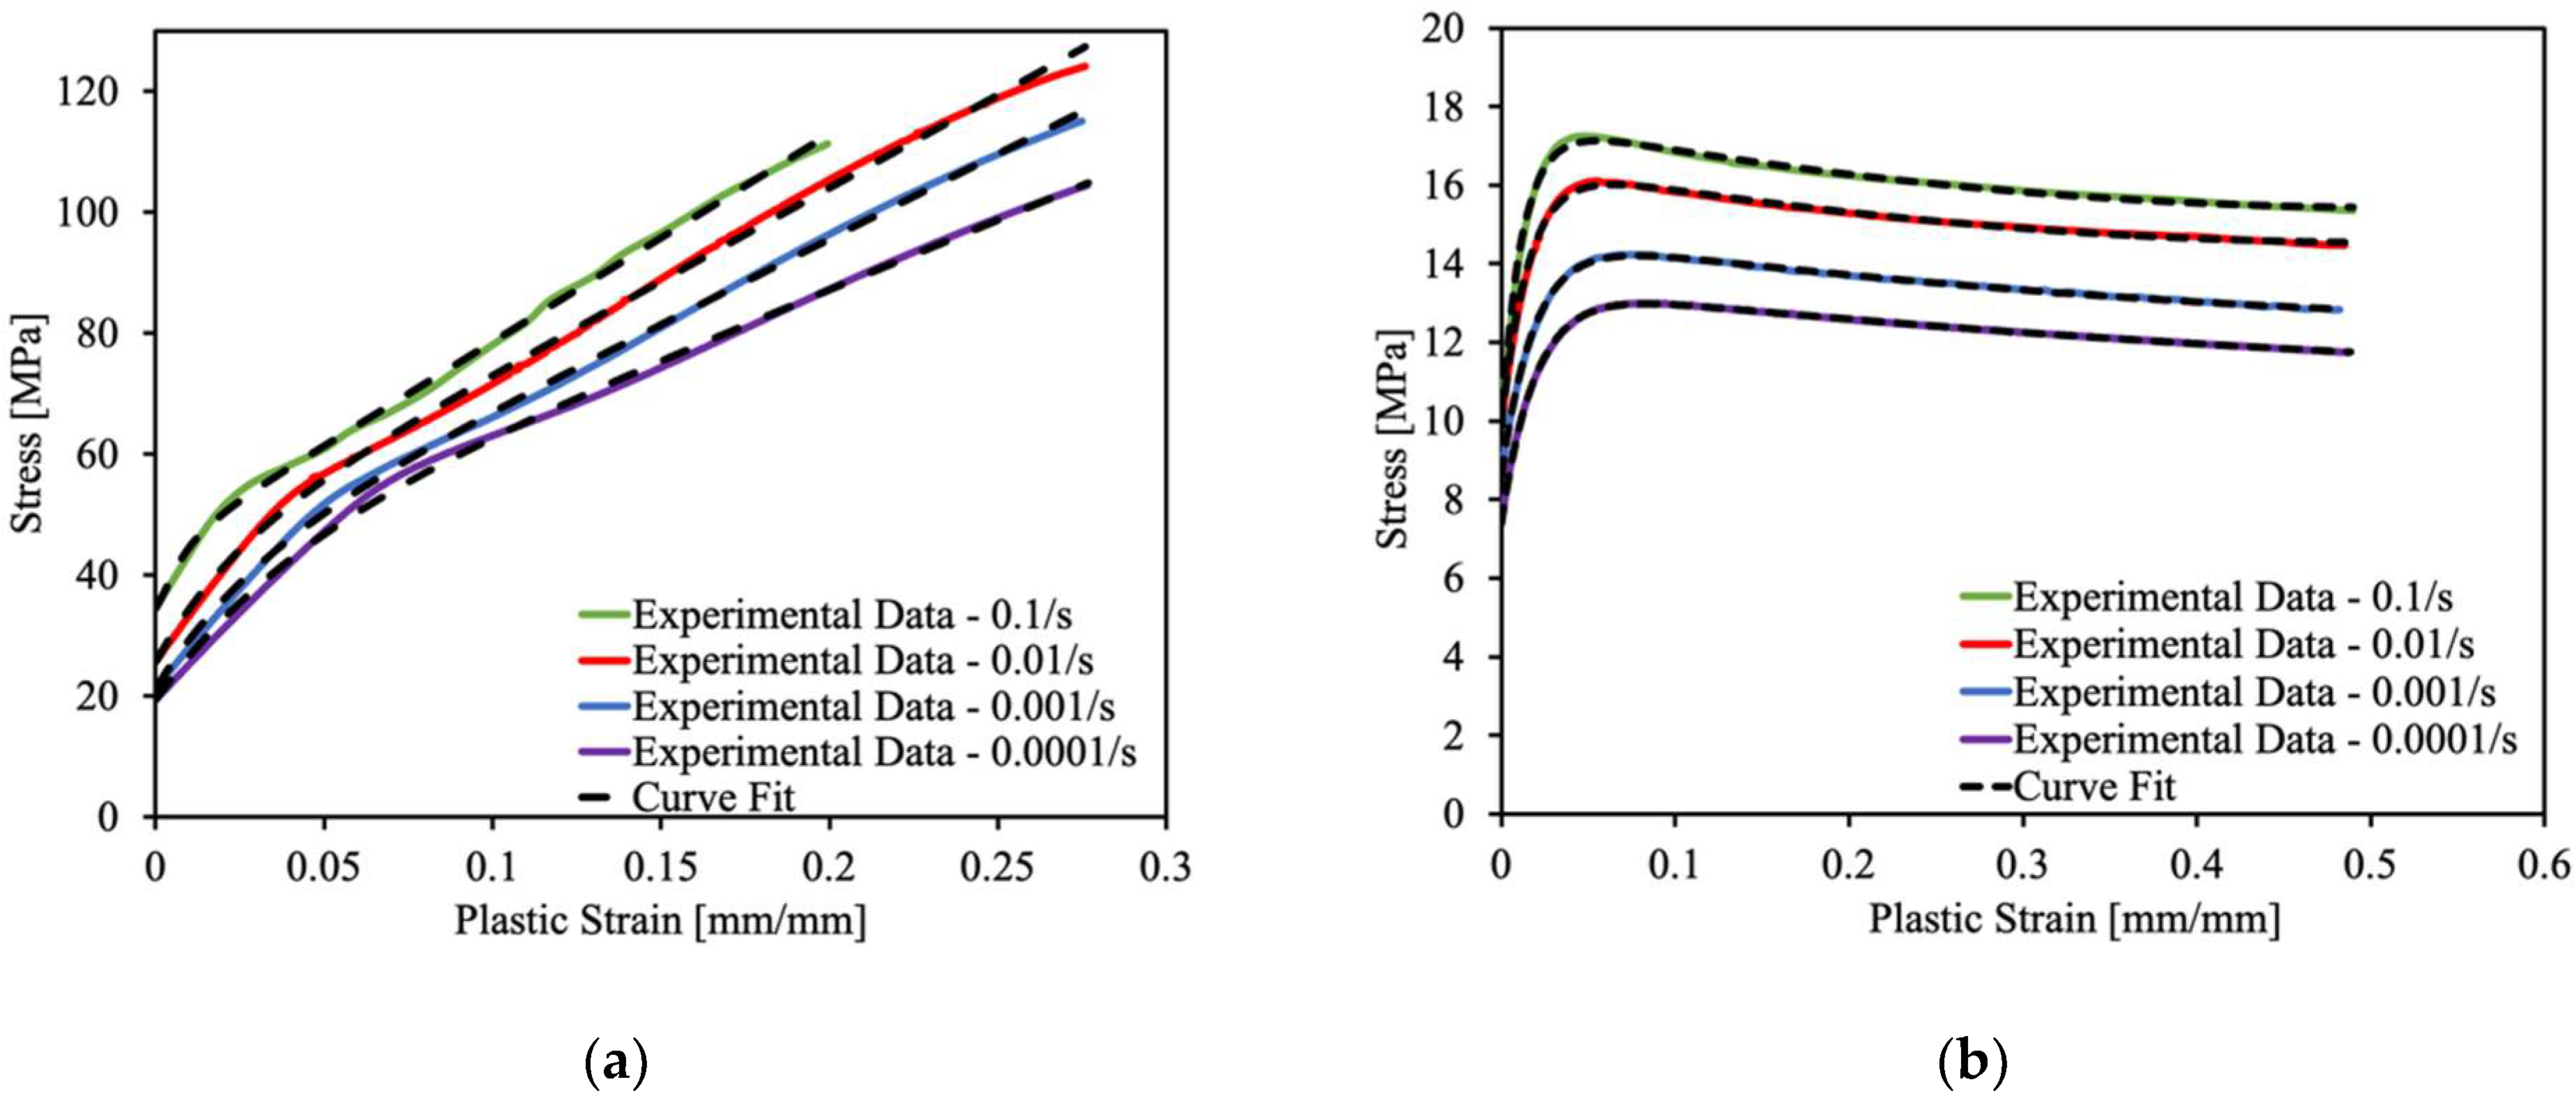
Figure 8.
Curve fitting for reduced viscoplastic model parameters at 20 °C in the (a) MD and (b) TD.
Figure 8.
Curve fitting for reduced viscoplastic model parameters at 20 °C in the (a) MD and (b) TD.
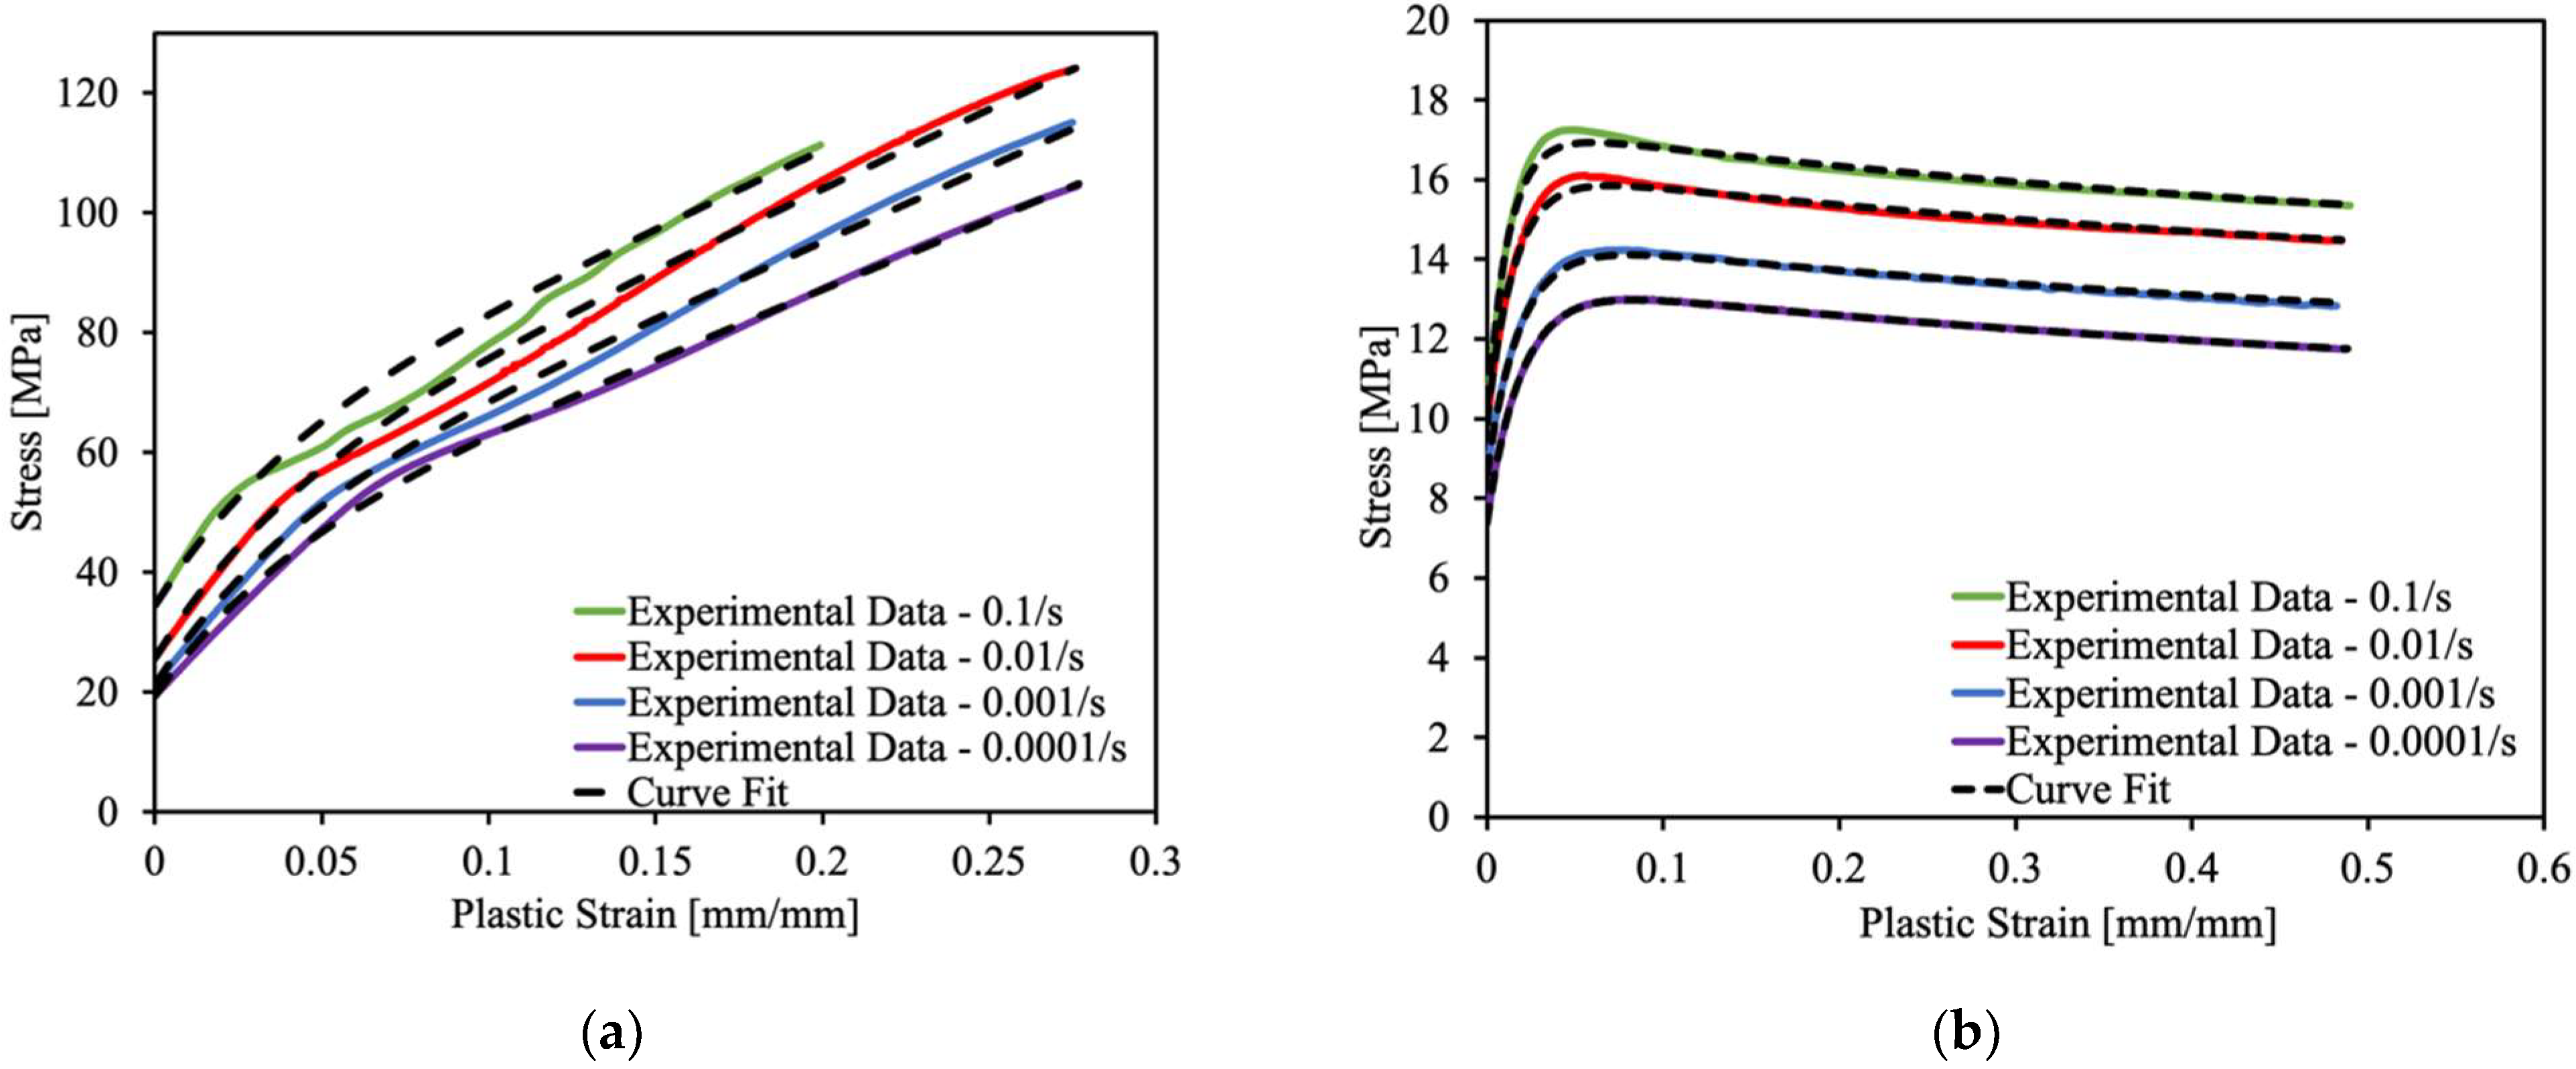
Figure 9.
Least-squares regression fittings for viscoplastic parameters: (a) initial yield stress and (b) strain-rate-scaling factor for MD response.
Figure 9.
Least-squares regression fittings for viscoplastic parameters: (a) initial yield stress and (b) strain-rate-scaling factor for MD response.
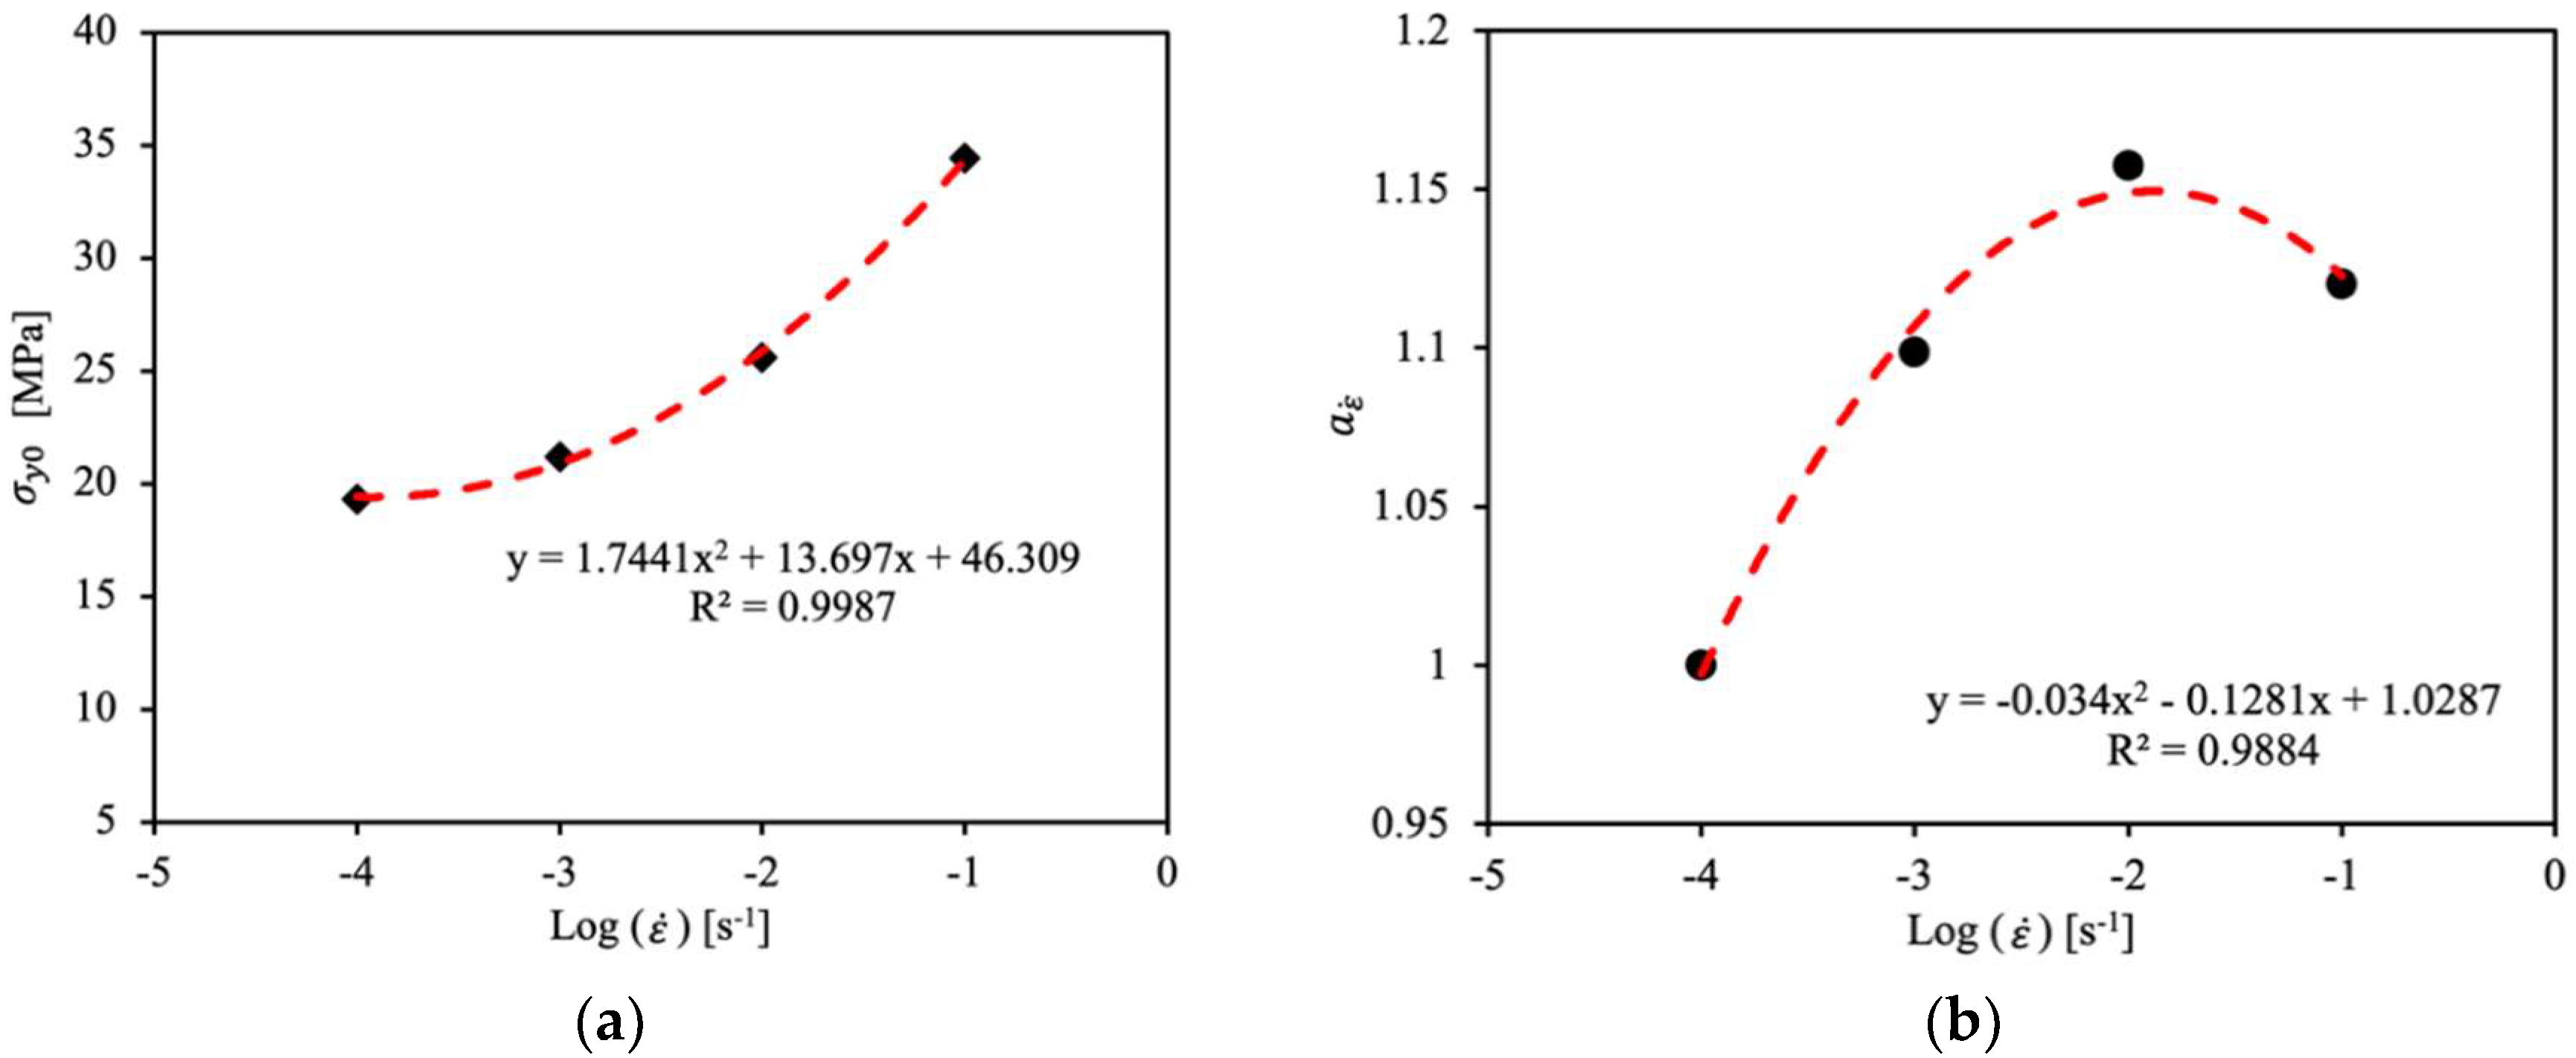
Figure 10.
Least-squares regression fittings for viscoplastic parameters: (a) initial yield stress, (b) strain-rate-scaling factor and (c) viscosity coefficient for TD response.
Figure 10.
Least-squares regression fittings for viscoplastic parameters: (a) initial yield stress, (b) strain-rate-scaling factor and (c) viscosity coefficient for TD response.
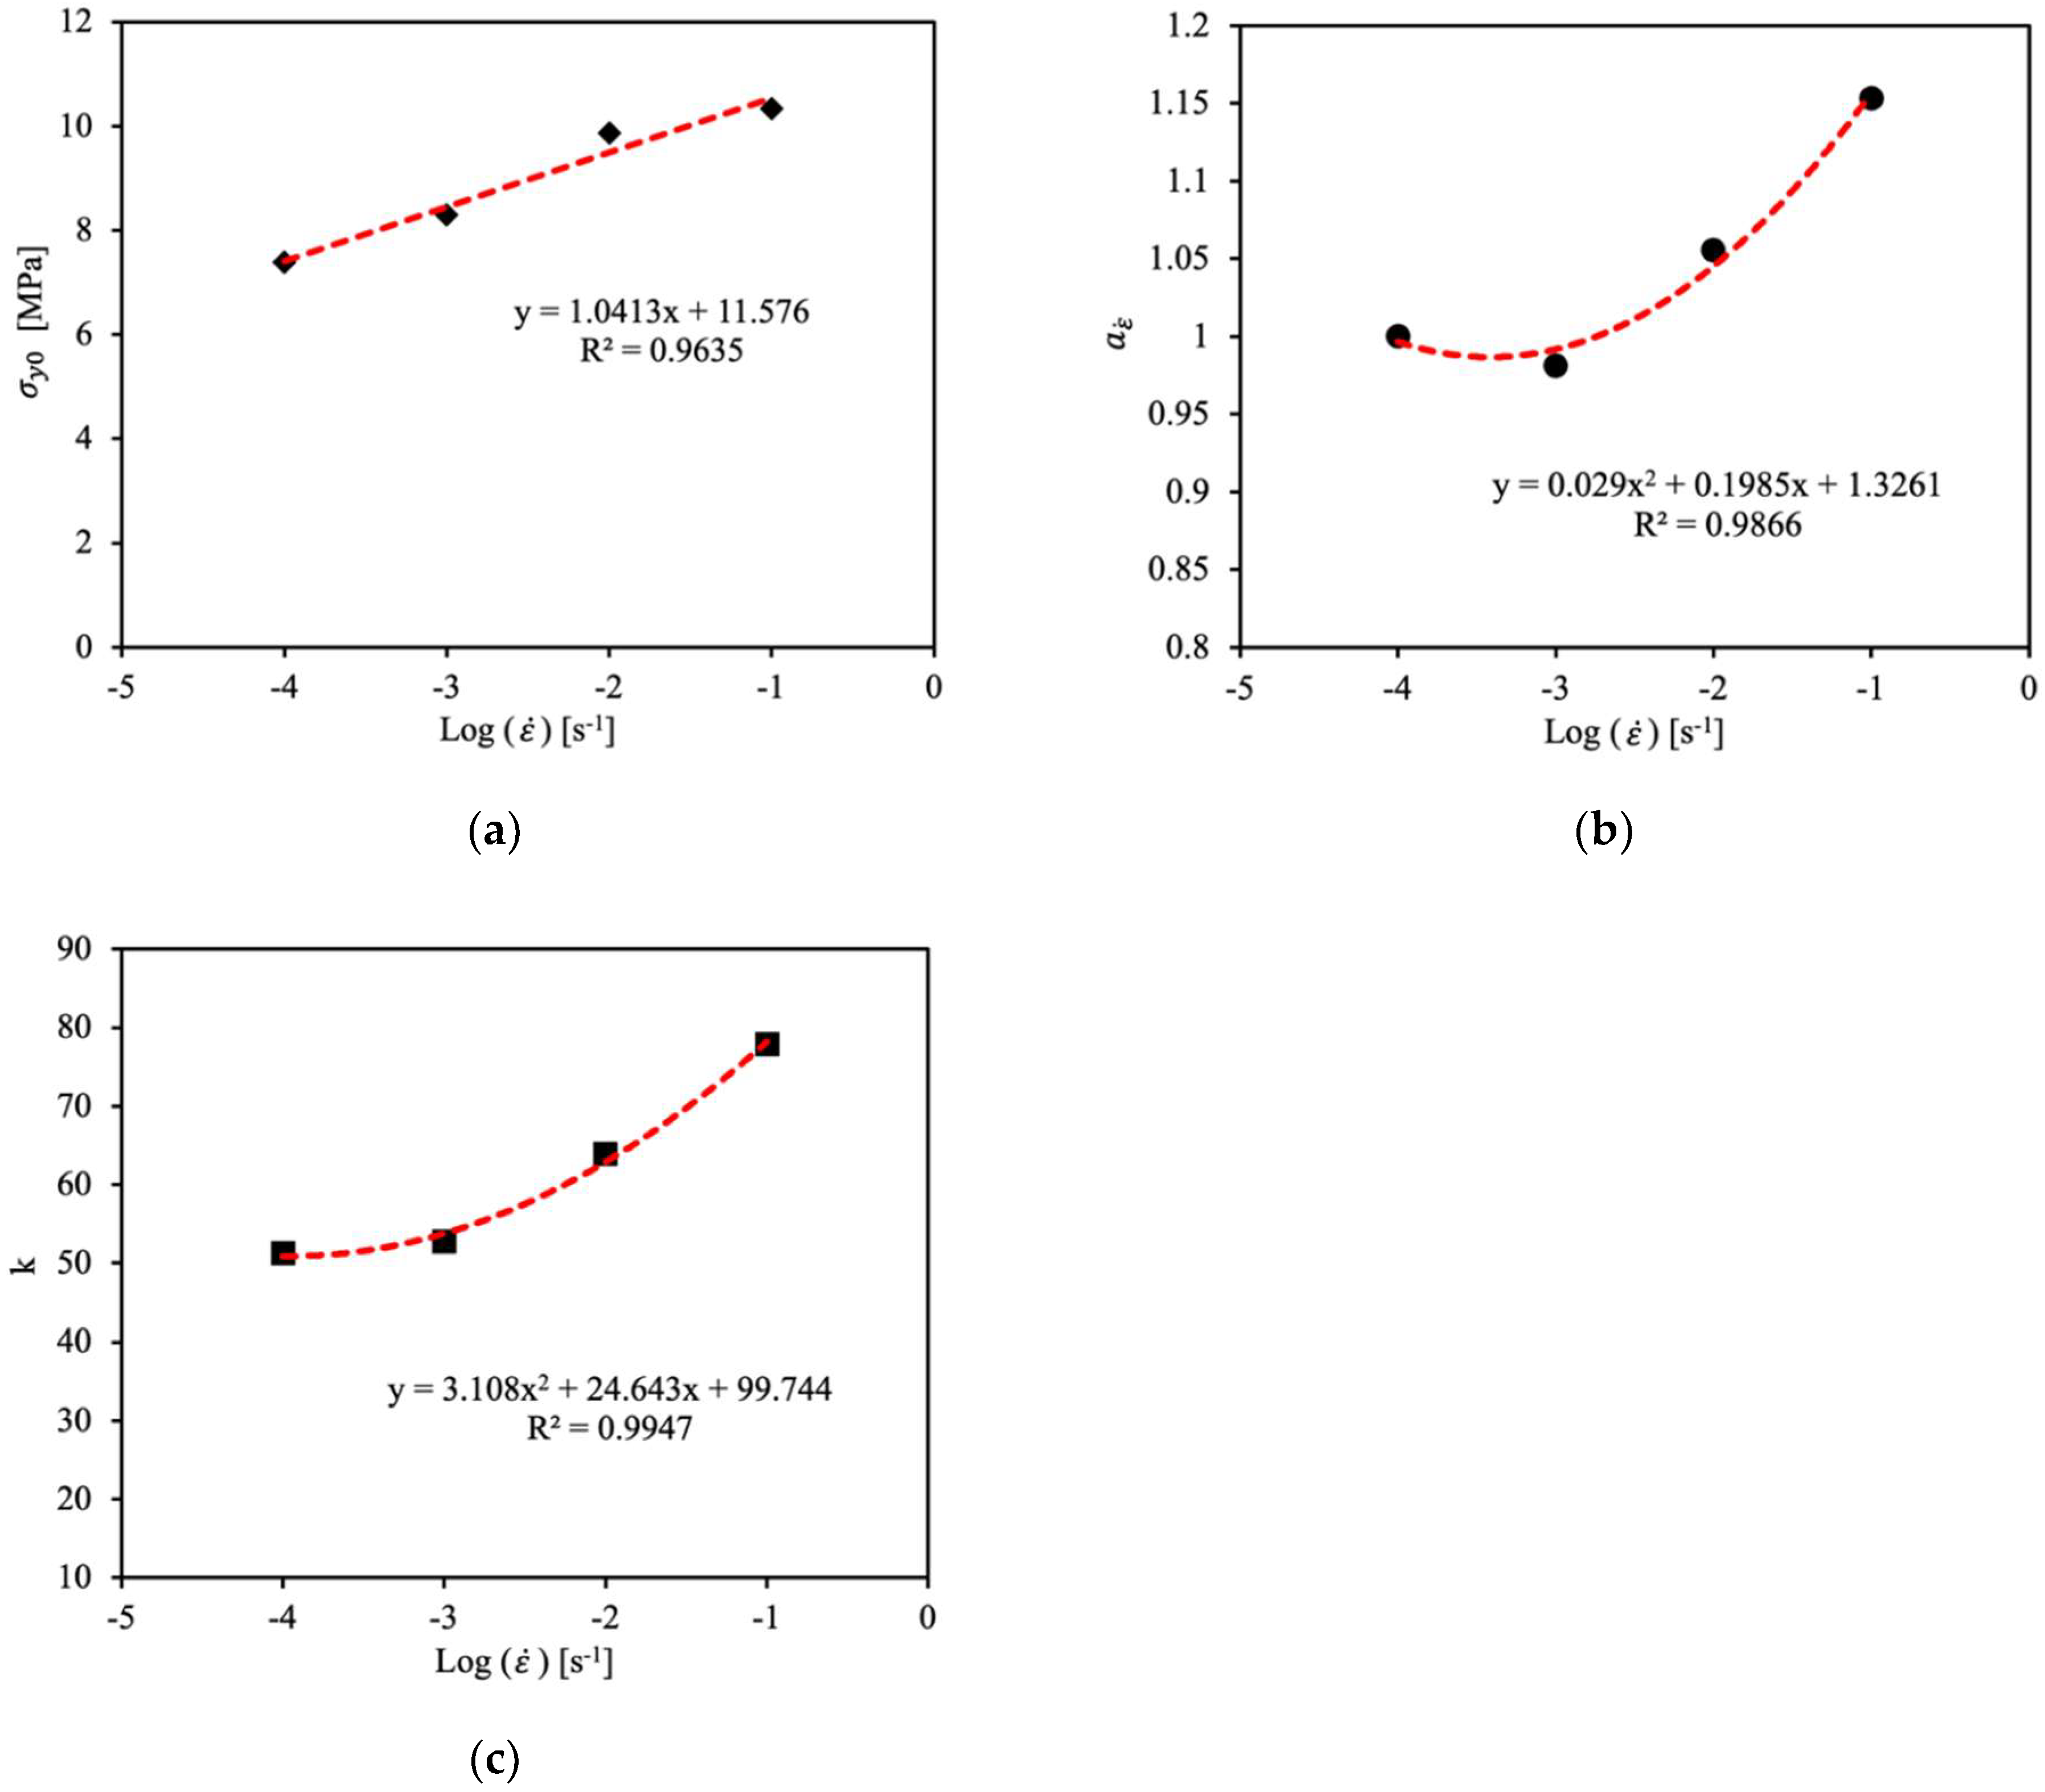
Figure 11.
Least-squares regression analysis at 20% strain for the determination of parameter for MD response at (a) 0.0001/s, (b) 0.001/s, (c) 0.01/s and (d) 0.1/s strain rates.
Figure 11.
Least-squares regression analysis at 20% strain for the determination of parameter for MD response at (a) 0.0001/s, (b) 0.001/s, (c) 0.01/s and (d) 0.1/s strain rates.

Figure 12.
Linear least-squares regression fitting of parameter for MD response.
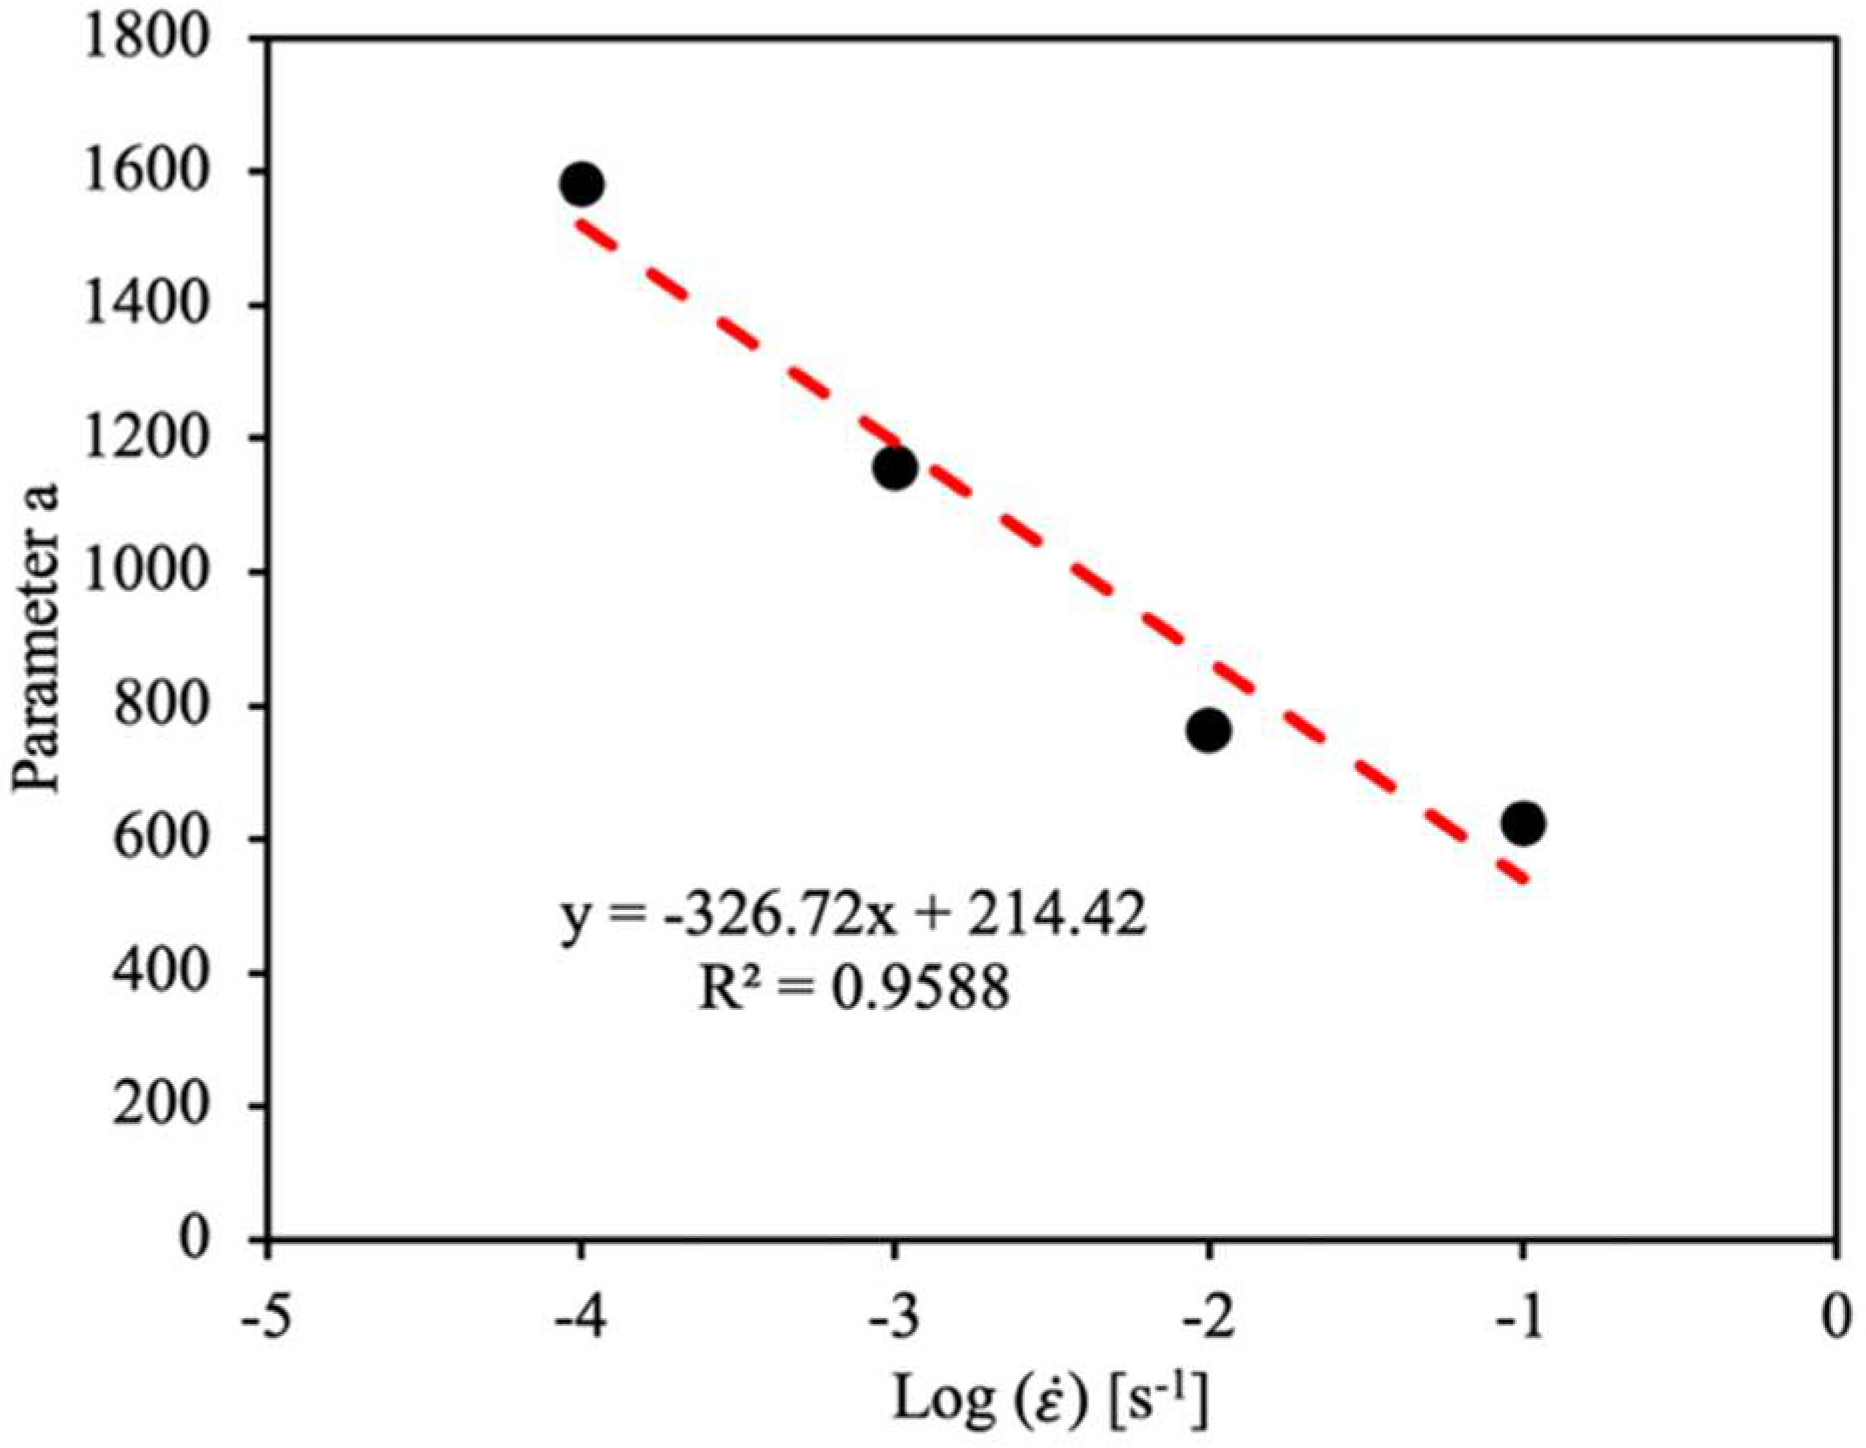
Figure 13.
Punch test FE model.

Figure 14.
Force–displacement curves from punch test simulations.
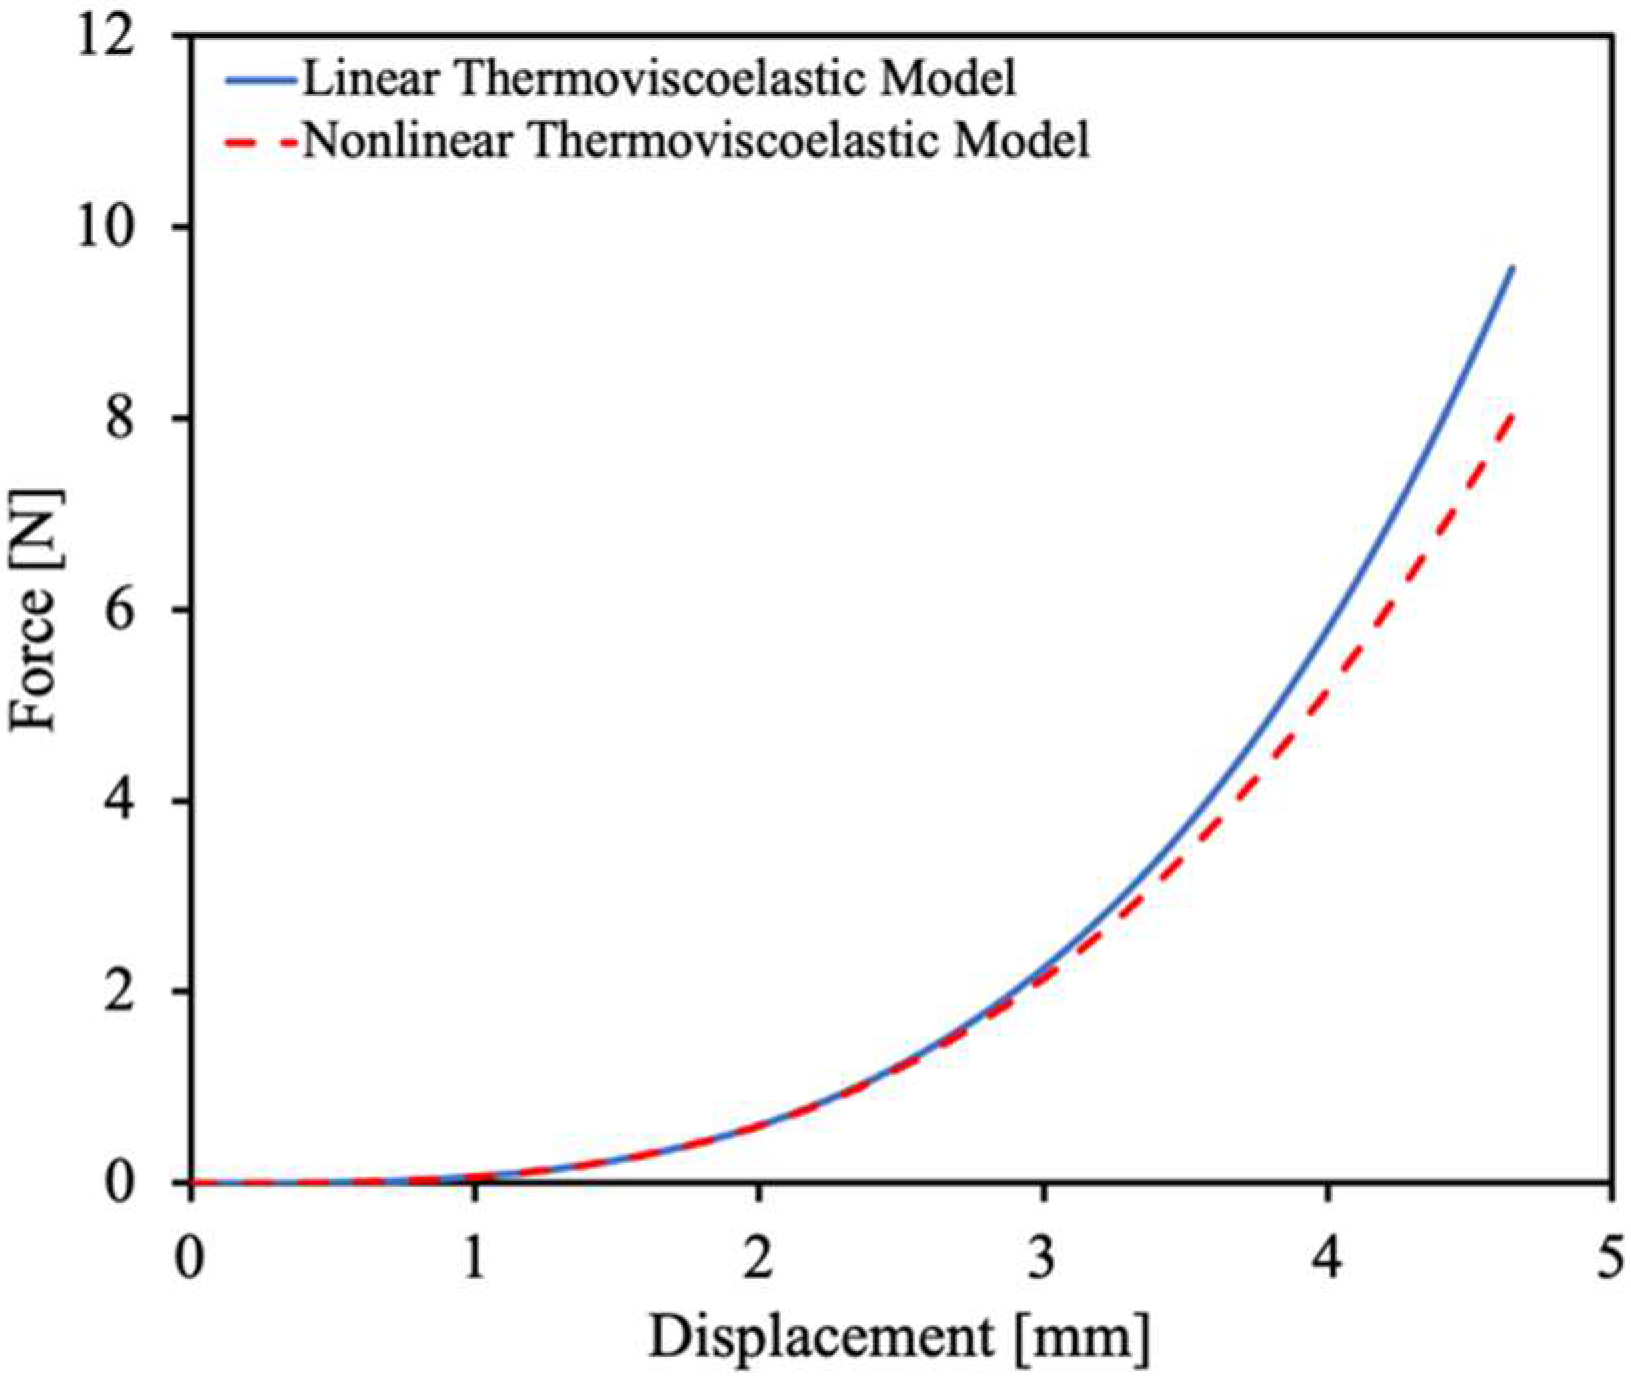
Figure 15.
The MD and TD stress contours in the separator during the punch test at d = 1.5 mm, predicted with the orthotropic linear and nonlinear viscoelastic models. (a) MD—linear model, (b) MD—nonlinear model, (c) TD—linear model and (d) TD—nonlinear model.
Figure 15.
The MD and TD stress contours in the separator during the punch test at d = 1.5 mm, predicted with the orthotropic linear and nonlinear viscoelastic models. (a) MD—linear model, (b) MD—nonlinear model, (c) TD—linear model and (d) TD—nonlinear model.
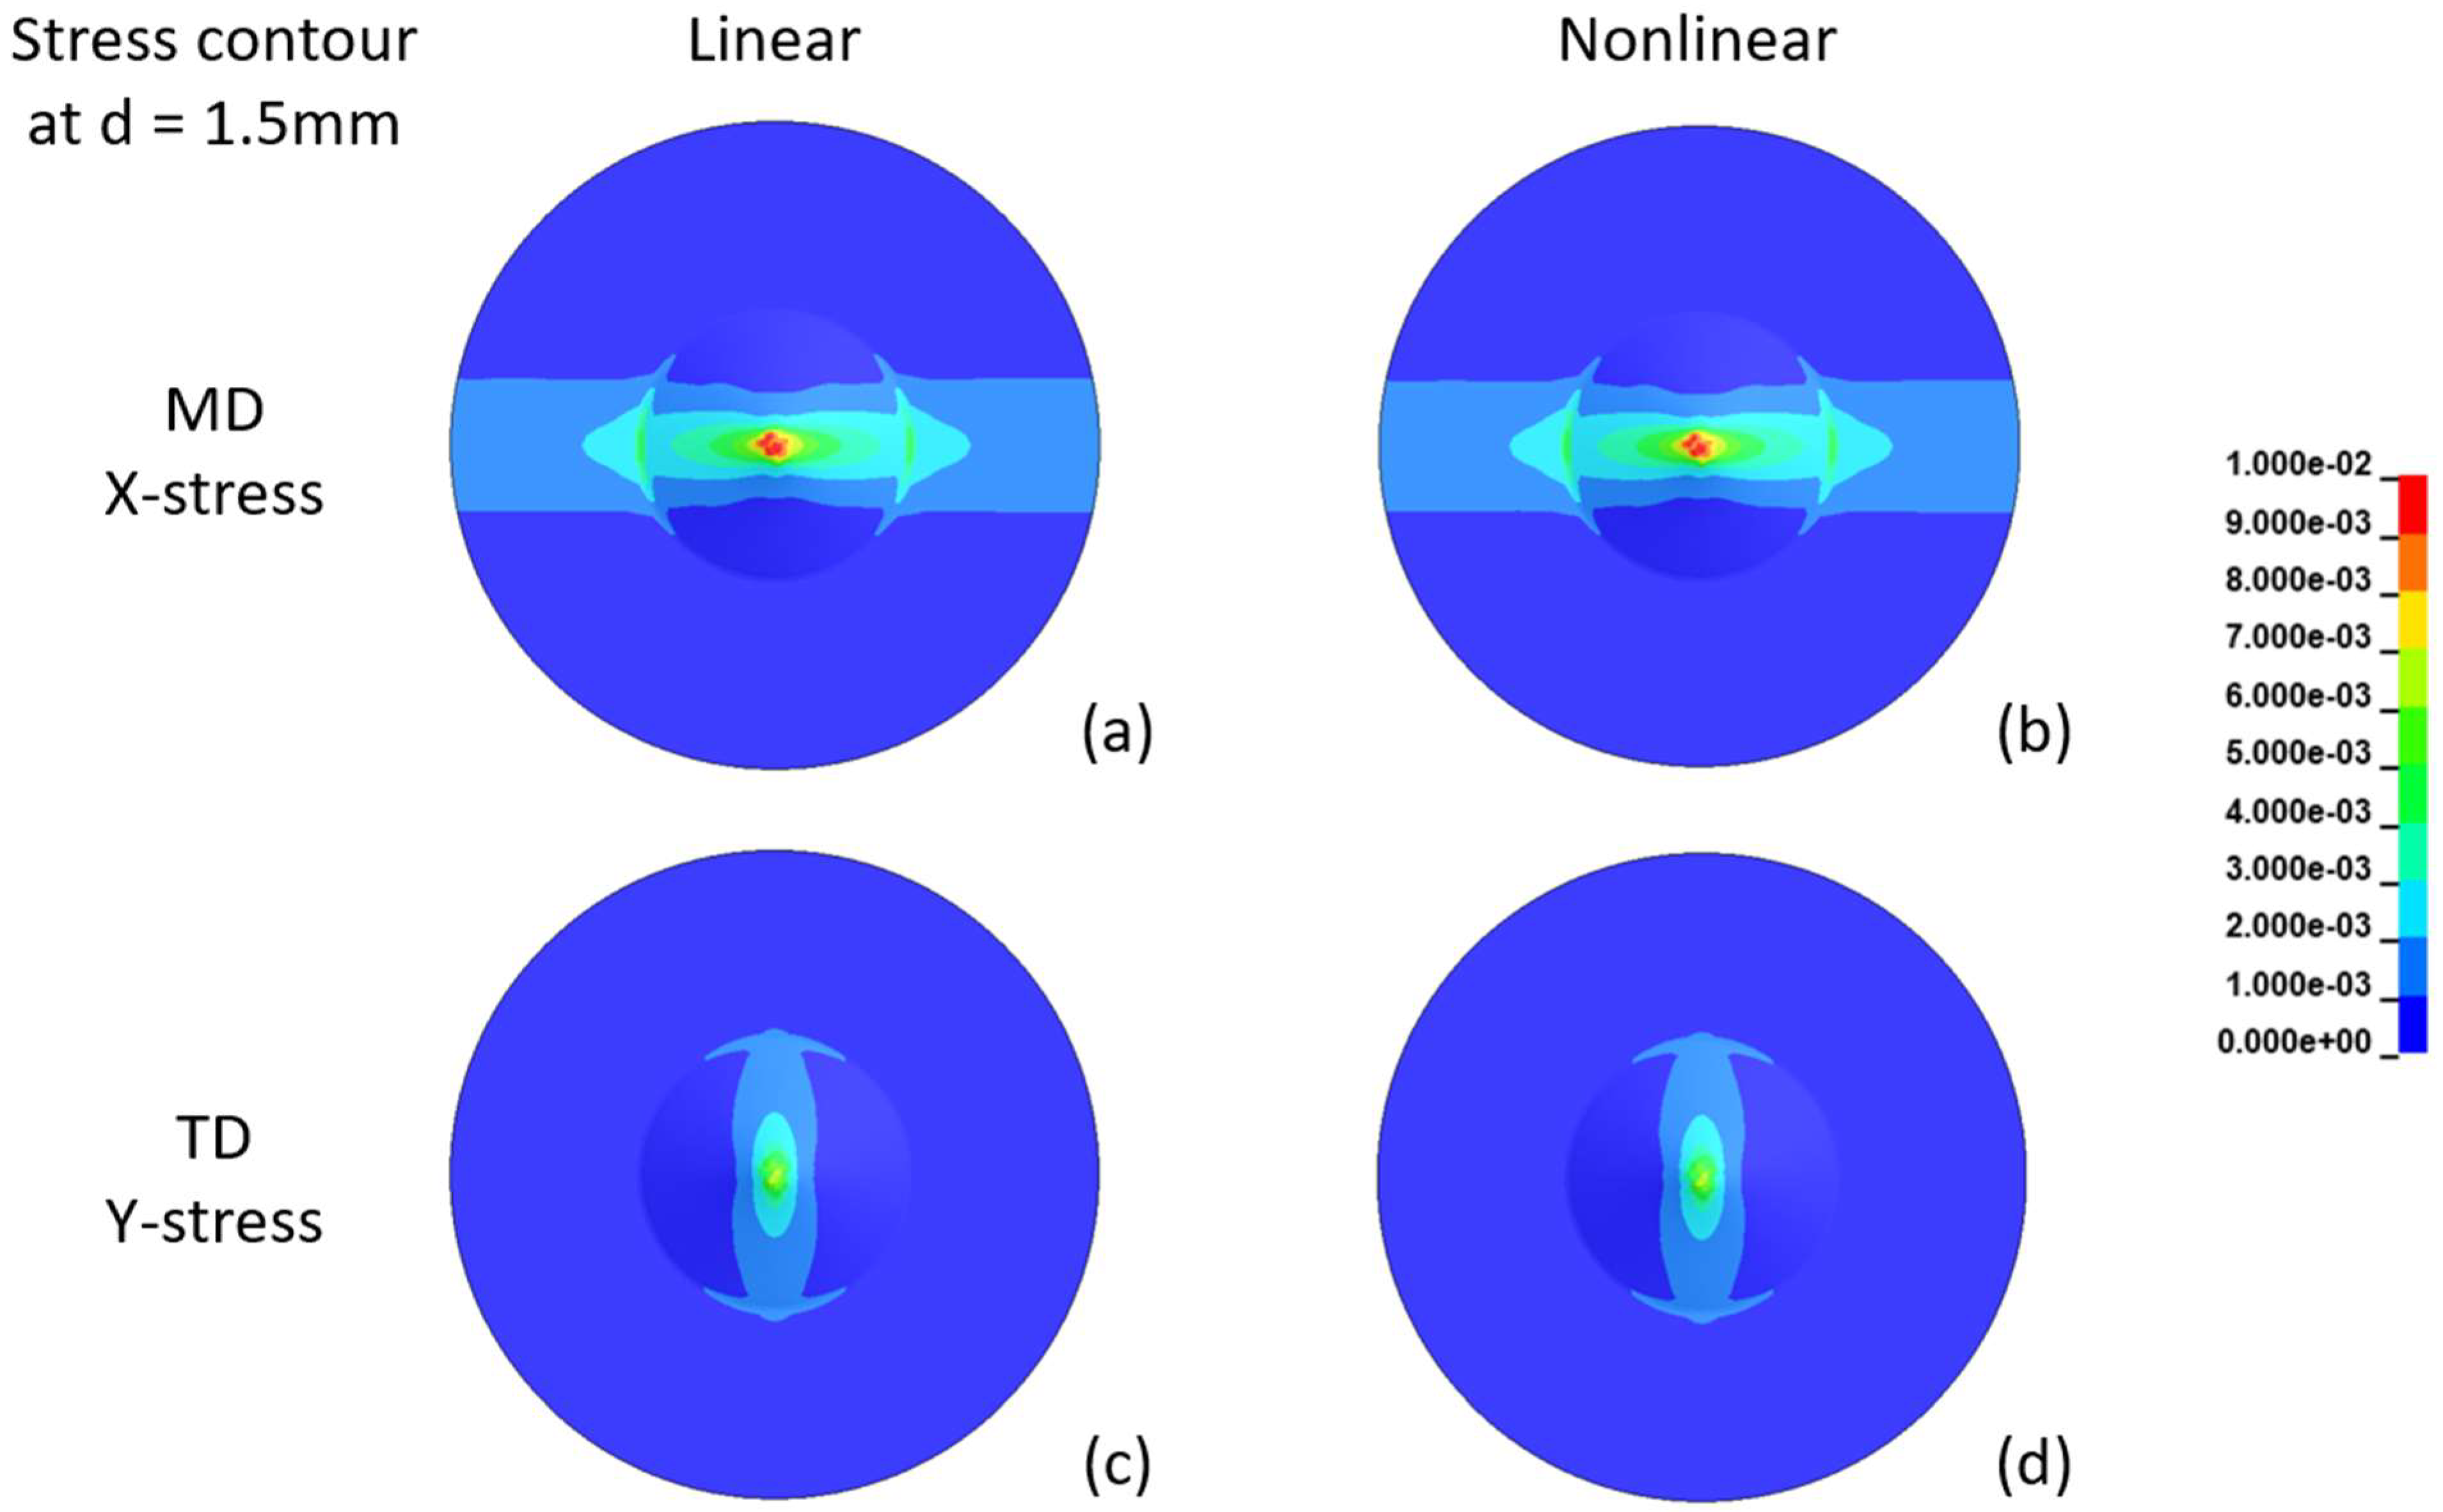
Figure 16.
The MD and TD strain contours in the separator during the punch test at d = 1.5 mm, predicted with the orthotropic linear and nonlinear viscoelastic models. (a) MD—linear model, (b) MD—nonlinear model, (c) TD—linear model and (d) TD—nonlinear model.
Figure 16.
The MD and TD strain contours in the separator during the punch test at d = 1.5 mm, predicted with the orthotropic linear and nonlinear viscoelastic models. (a) MD—linear model, (b) MD—nonlinear model, (c) TD—linear model and (d) TD—nonlinear model.
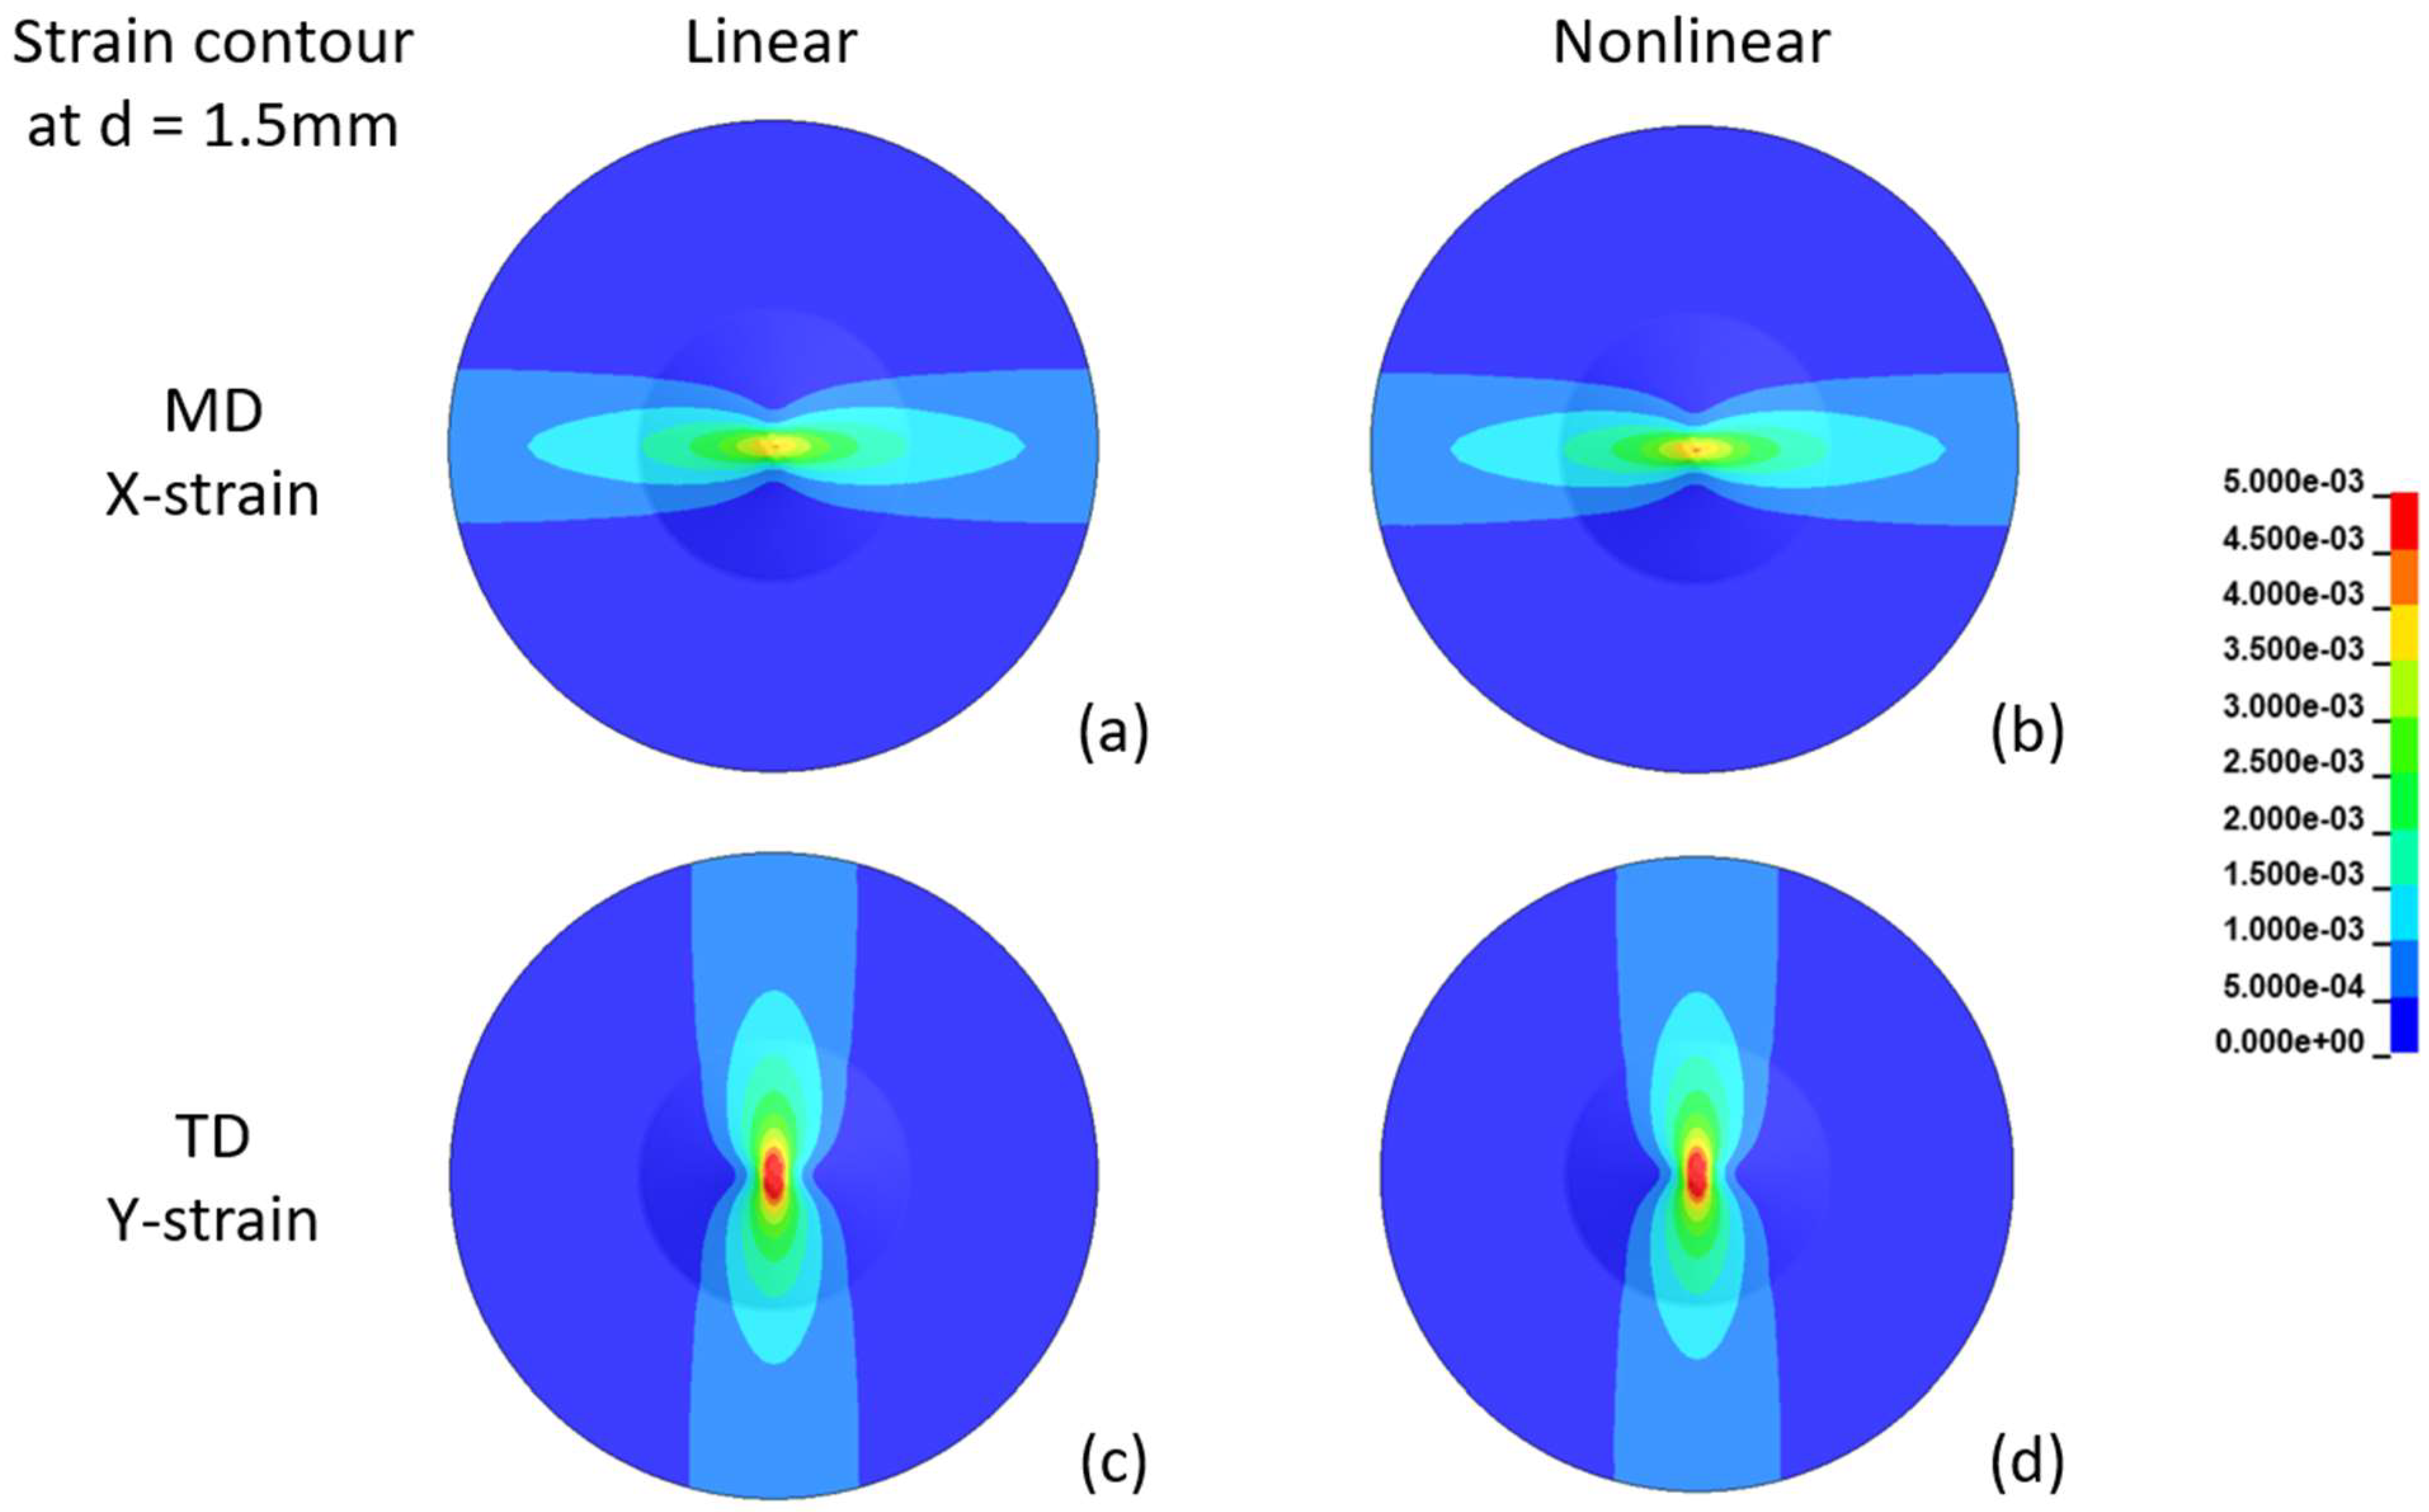
Figure 17.
The MD and TD stress contours in the separator during the punch test at d = 4.67 mm, predicted with the orthotropic linear and nonlinear viscoelastic models. (a) MD—linear model, (b) MD—nonlinear model, (c) TD—linear model and (d) TD—nonlinear model.
Figure 17.
The MD and TD stress contours in the separator during the punch test at d = 4.67 mm, predicted with the orthotropic linear and nonlinear viscoelastic models. (a) MD—linear model, (b) MD—nonlinear model, (c) TD—linear model and (d) TD—nonlinear model.
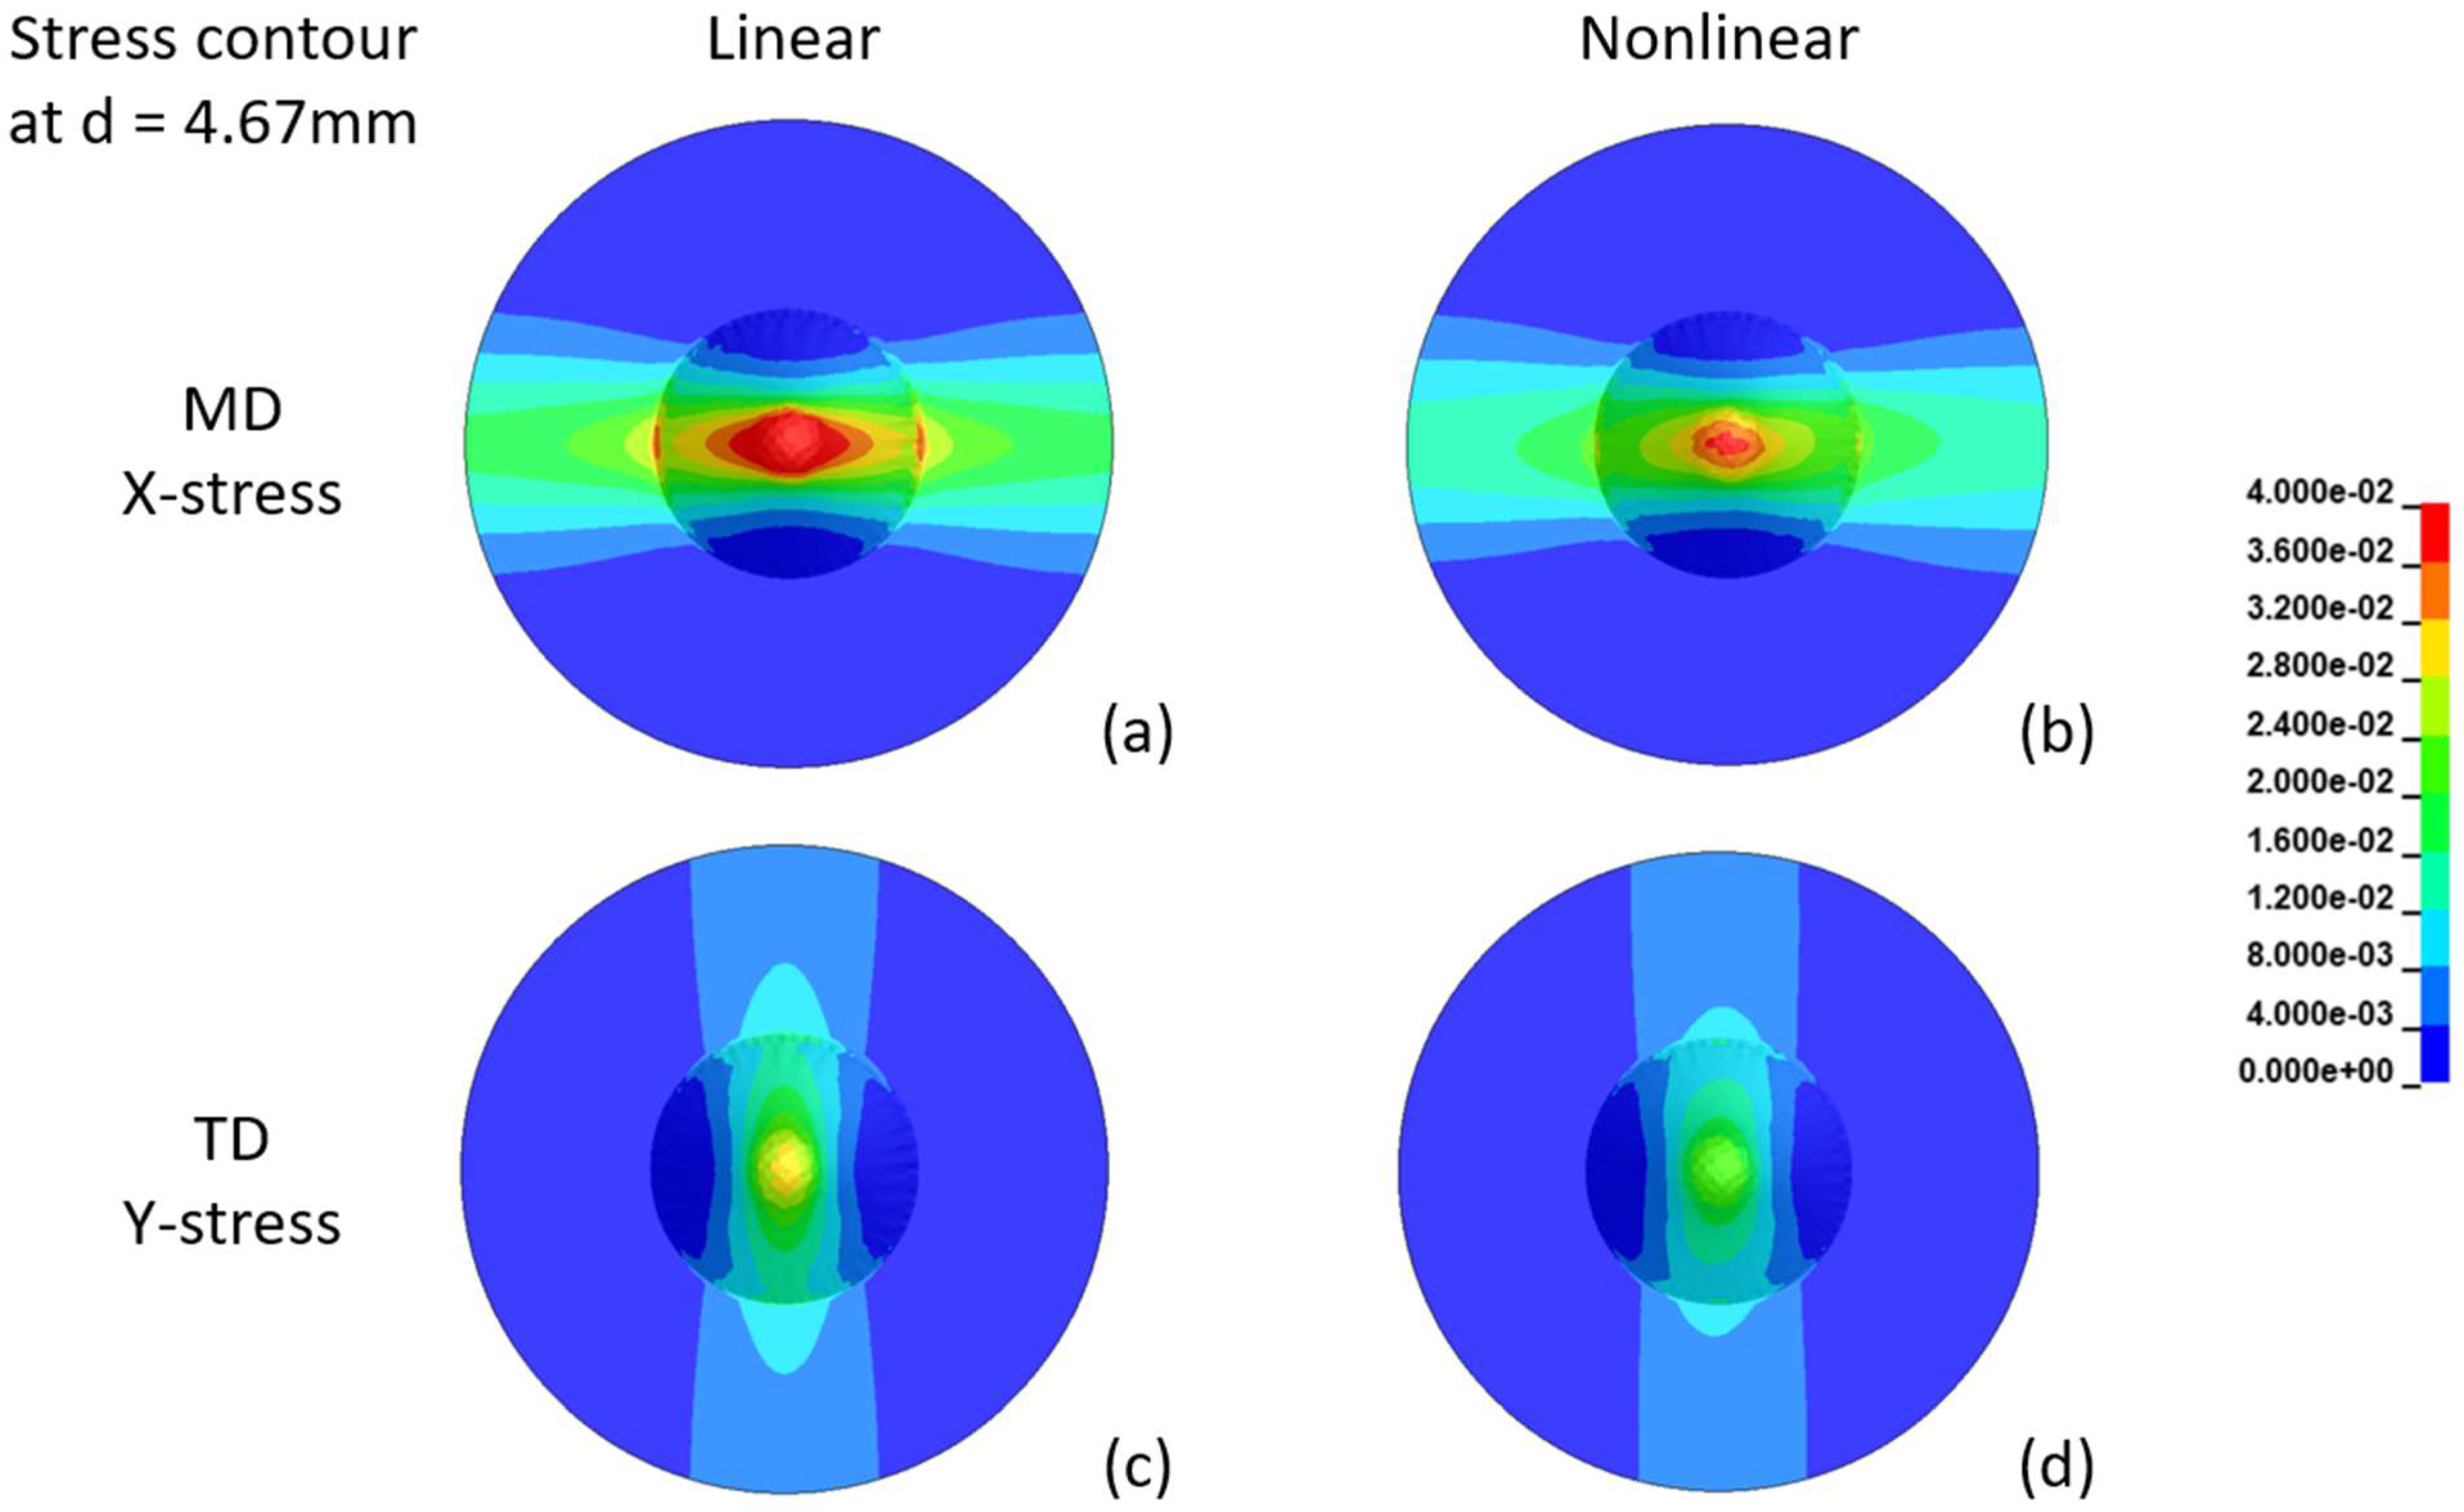
Figure 18.
The MD and TD strain contours in the separator during the punch test at d = 4.67 mm, predicted with the orthotropic linear and nonlinear viscoelastic models. (a) MD—linear model, (b) MD—nonlinear model, (c) TD—linear model and (d) TD—nonlinear model.
Figure 18.
The MD and TD strain contours in the separator during the punch test at d = 4.67 mm, predicted with the orthotropic linear and nonlinear viscoelastic models. (a) MD—linear model, (b) MD—nonlinear model, (c) TD—linear model and (d) TD—nonlinear model.
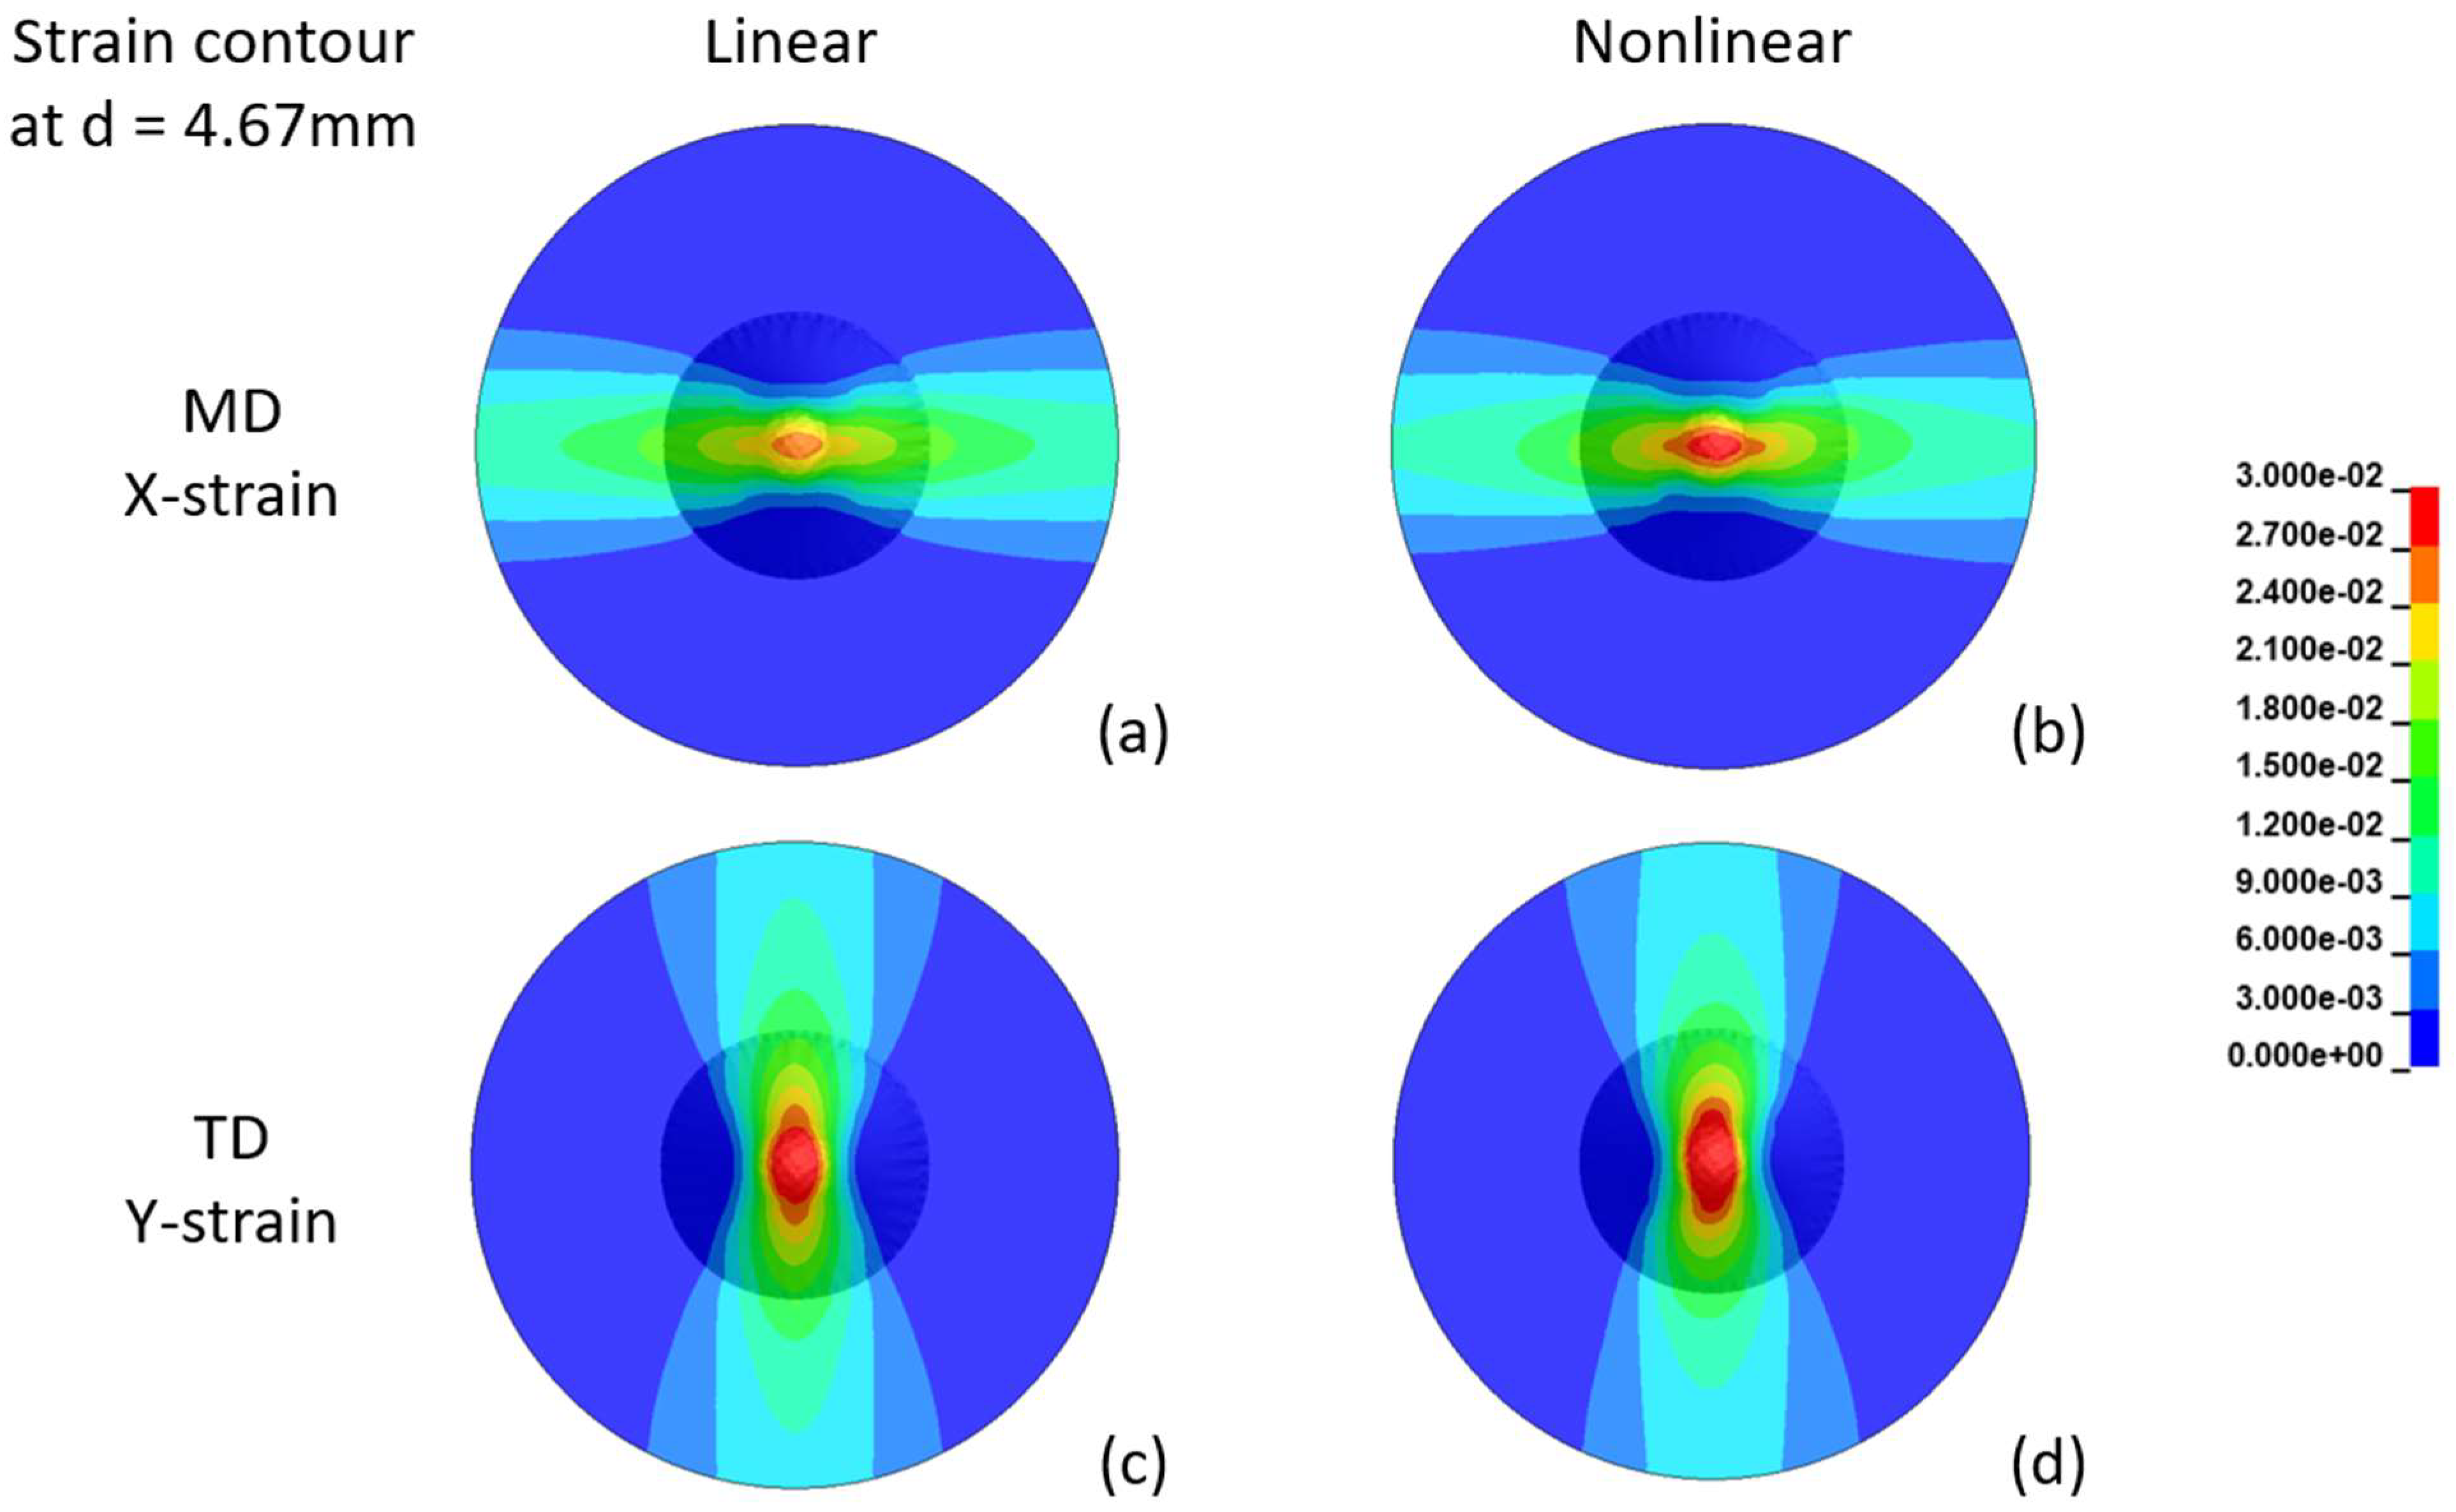
Figure 19.
Shell element with boundary conditions.
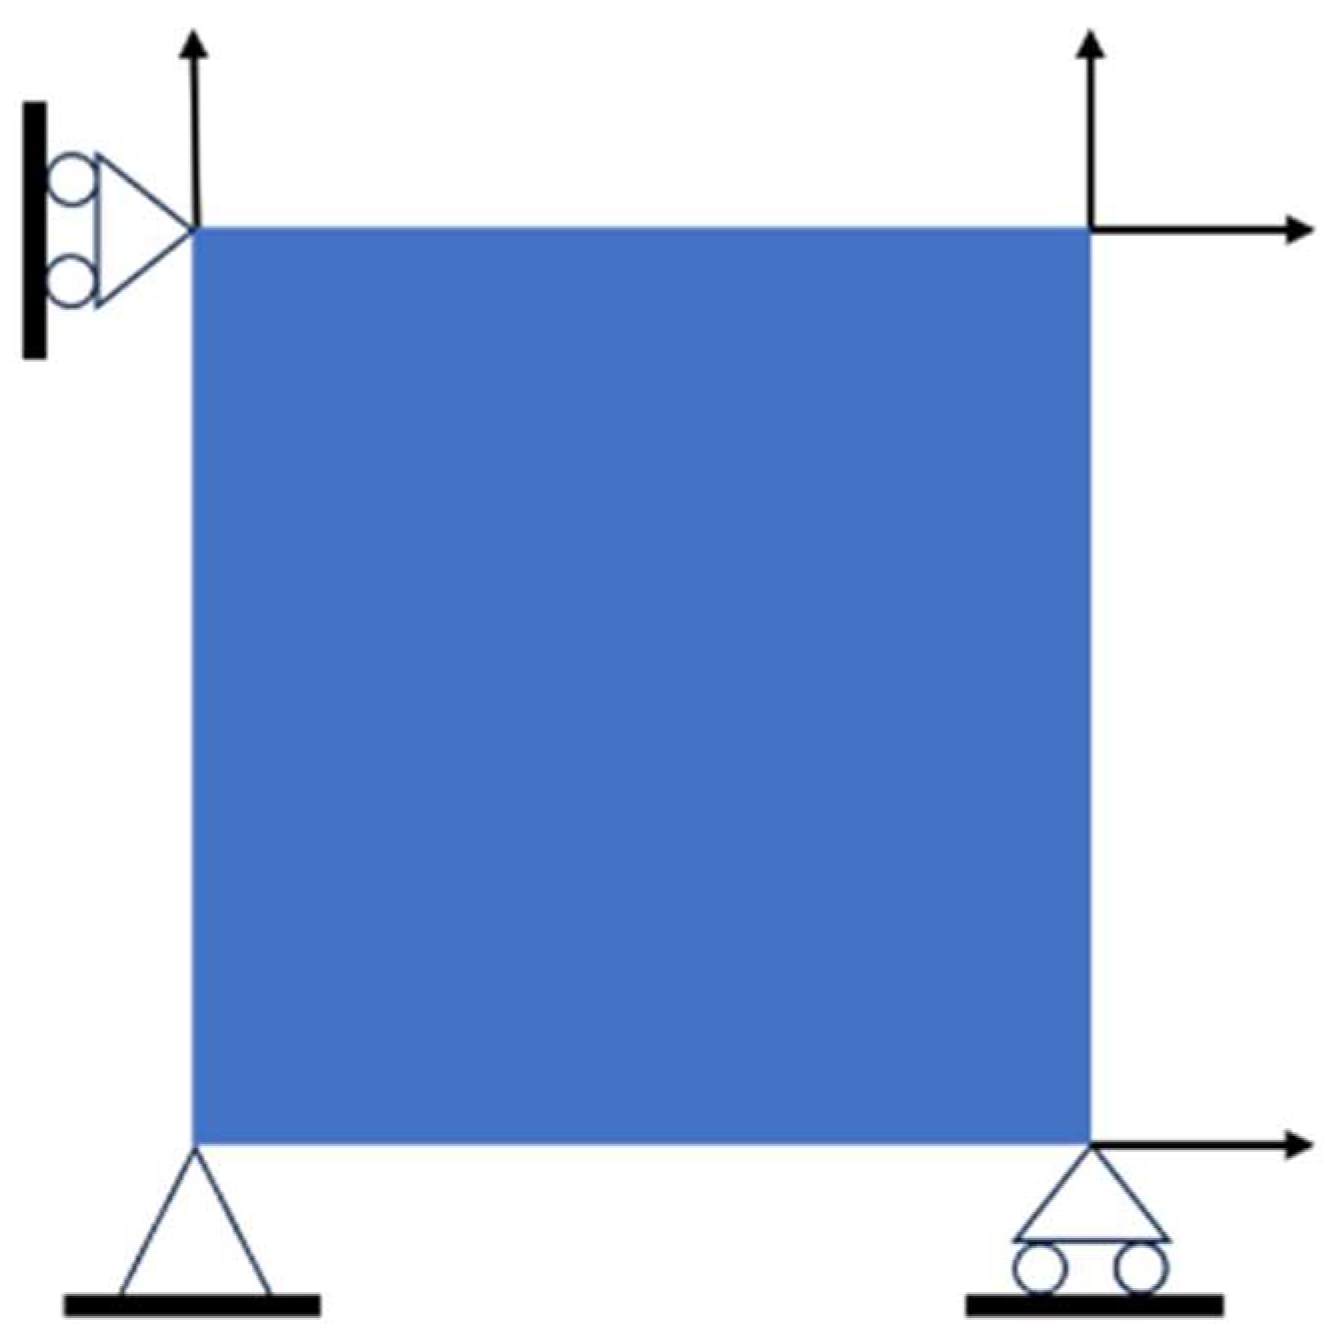
Figure 20.
Comparison of the MD stress–strain response predicted by simulations using the coupled nonlinear viscoelastic–viscoplastic material model with experimental data from uniaxial tensile tests carried out at different strain rates and temperatures of (a) 20 °C, (b) 30 °C, (c) 40 °C and (d) 50 °C.
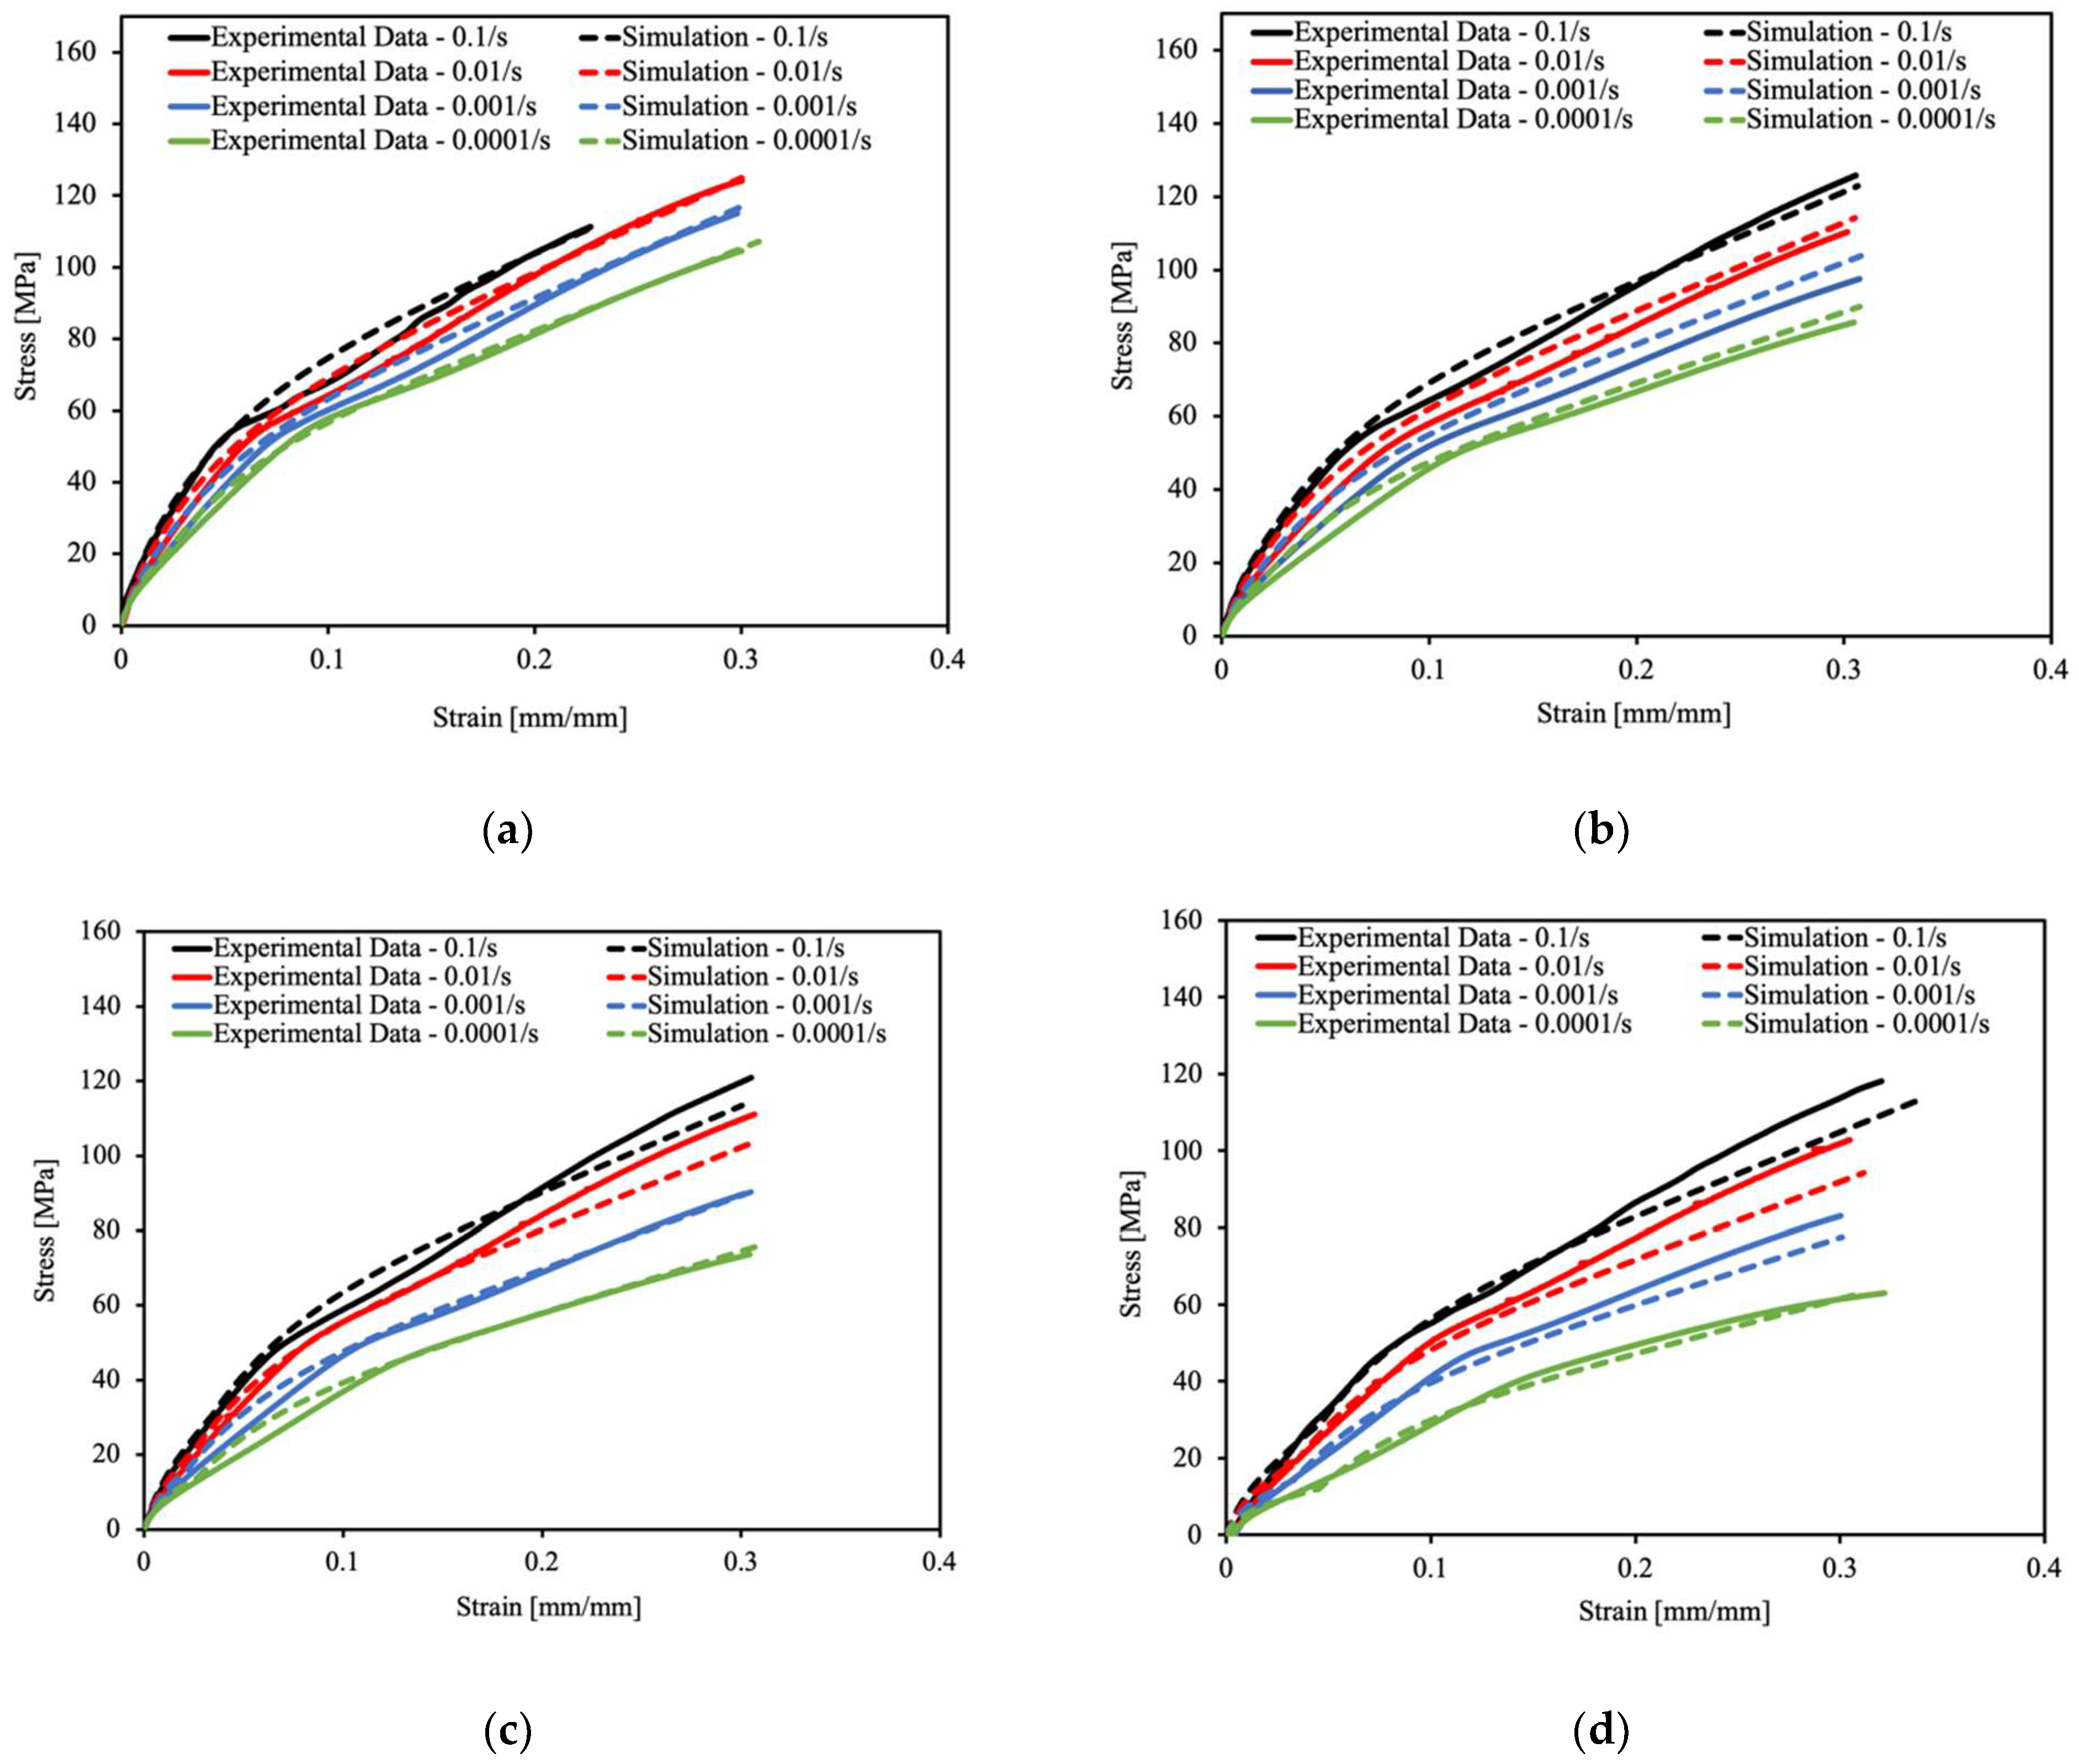
Figure 21.
Comparison of the TD stress–strain response predicted by simulations using the coupled nonlinear viscoelastic–viscoplastic material model with experimental data from uniaxial tensile tests carried out at different strain rates and temperatures of (a) 20 °C, (b) 30 °C, (c) 40 °C and (d) 50 °C.

Table 1.
Viscoplastic model parameters for MD response.
| 0.0001 | 19.33 | 22.19 | 25.21 | 0 | 228.77 | 1 |
| 0.001 | 21.20 | 18.11 | 34.44 | 0 | 281.24 | 1 |
| 0.01 | 25.61 | 16.84 | 41.29 | 0 | 307.71 | 1 |
| 0.1 | 34.45 | 9.70 | 115.36 | 0 | 343.93 | 1 |
Table 2.
Viscoplastic model parameters for TD response.
| 0.0001 | 7.39 | 6.06 | 51.25 | −4.79 | 2.76 | 2 |
| 0.001 | 8.61 | 6.13 | 52.74 | −5.98 | 4.24 | 2 |
| 0.01 | 9.83 | 6.74 | 63.94 | −8.06 | 7.85 | 2 |
| 0.1 | 10.33 | 7.35 | 77.86 | −8.74 | 8.49 | 2 |
Table 3.
Reduced viscoplastic model parameters for MD response.
| 0.0001 | 19.33 | 22.19 | 25.21 | 0 | 228.77 | 1 | 1 |
| 0.001 | 21.20 | 22.19 | 25.21 | 0 | 228.77 | 1 | 1.09 |
| 0.01 | 25.61 | 22.19 | 25.21 | 0 | 228.77 | 1 | 1.16 |
| 0.1 | 34.45 | 22.19 | 25.21 | 0 | 228.77 | 1 | 1.12 |
Table 4.
Reduced viscoplastic model parameters for TD response.
| 0.0001 | 7.39 | 6.06 | 51.25 | −4.79 | 2.76 | 2 | 1 |
| 0.001 | 8.61 | 6.06 | 52.74 | −4.79 | 2.76 | 2 | 0.98 |
| 0.01 | 9.83 | 6.06 | 63.94 | −4.79 | 2.76 | 2 | 1.06 |
| 0.1 | 10.33 | 6.06 | 77.86 | −4.79 | 2.76 | 2 | 1.16 |
Table 5.
Determined parameter values.
| TD Average | |||||
|---|---|---|---|---|---|
| 0.0001 | 1581.70 | 1298.60 | 1293.60 | 1305.6 | 1299.27 |
| 0.001 | 1156.40 | 918.87 | 910.48 | 908.12 | 912.49 |
| 0.01 | 763.02 | 1144.5 | 1144.50 | 1154.30 | 1149.47 |
| 0.1 | 632.76 | 965.24 | 1063.4 | 1095.4 | 1041.35 |
Table 6.
The maximum stress and strain values in punch test simulations predicted by orthotropic linear and nonlinear viscoelastic models.
Table 6.
The maximum stress and strain values in punch test simulations predicted by orthotropic linear and nonlinear viscoelastic models.
| d = 1.5 mm | d = 4.67 mm | |||||
|---|---|---|---|---|---|---|
| Maximum Stress (MPa) | Linear Model | Nonlinear Model | Nonlinear/ Linear Ratio | Linear Model | Nonlinear Model | Nonlinear/ Linear Ratio |
| MD | 13.32 | 12.74 | 0.96 | 51.95 | 38.99 | 0.75 |
| TD | 8.35 | 7.96 | 0.95 | 31.79 | 24.14 | 0.76 |
| TD/MD Ratio | 0.63 | 0.62 | 0.61 | 0.62 | ||
| Maximum Strain (%) | ||||||
| MD | 0.43 | 0.44 | 1.02 | 2.63 | 2.98 | 1.14 |
| TD | 0.70 | 0.71 | 1.02 | 3.44 | 3.73 | 1.08 |
| TD/MD Ratio | 1.62 | 1.62 | 1.31 | 1.25 | ||
Disclaimer/Publisher’s Note: The statements, opinions and data contained in all publications are solely those of the individual author(s) and contributor(s) and not of MDPI and/or the editor(s). MDPI and/or the editor(s) disclaim responsibility for any injury to people or property resulting from any ideas, methods, instructions or products referred to in the content. |
© 2023 by the authors. Licensee MDPI, Basel, Switzerland. This article is an open access article distributed under the terms and conditions of the Creative Commons Attribution (CC BY) license (https://creativecommons.org/licenses/by/4.0/).
Share and Cite
MDPI and ACS Style
Ihuaenyi, R.C.; Deng, J.; Bae, C.; Xiao, X. A Coupled Nonlinear Viscoelastic–Viscoplastic Thermomechanical Model for Polymeric Lithium-Ion Battery Separators. Batteries 2023, 9, 475. https://doi.org/10.3390/batteries9090475
AMA Style
Ihuaenyi RC, Deng J, Bae C, Xiao X. A Coupled Nonlinear Viscoelastic–Viscoplastic Thermomechanical Model for Polymeric Lithium-Ion Battery Separators. Batteries. 2023; 9(9):475. https://doi.org/10.3390/batteries9090475
Chicago/Turabian StyleIhuaenyi, Royal Chibuzor, Jie Deng, Chulheung Bae, and Xinran Xiao. 2023. "A Coupled Nonlinear Viscoelastic–Viscoplastic Thermomechanical Model for Polymeric Lithium-Ion Battery Separators" Batteries 9, no. 9: 475. https://doi.org/10.3390/batteries9090475
Note that from the first issue of 2016, this journal uses article numbers instead of page numbers. See further details here.