
Electro-Thermal Analysis of a Pouch–Type Lithium–Ion Battery with a High Discharge Rate for Urban Air Mobility


Department of Automotive Engineering, Tongmyong University, Busan 48520, Republic of Korea
Batteries 2023, 9(9), 476; https://doi.org/10.3390/batteries9090476
Submission received: 18 August 2023
/
Revised: 15 September 2023
/
Accepted: 18 September 2023
/
Published: 21 September 2023
Abstract
:The dynamic behavior and thermal performance of a high-power, high-energy-density lithium-ion battery for urban air mobility (UAM) applications were analyzed by using an electro-thermal model. To simulate the behavior of pouch-type nickel-cobalt-manganese (NCM) lithium–ion batteries, a battery equivalent circuit with a second order of resistance–capacitance (RC) elements was employed. The values of the RC models were determined by using curve fitting based on experimental data for the lithium-ion battery. A three–dimensional model of the lithium-ion battery was created, and a thermal analysis was performed while considering the external temperature and flight time under a 20 min load condition. At an external temperature of 20 °C, the heat generation increased proportionally to the square of the current as the C–rate increased. For 3C, the reaction heat source was 45.5 W, and the average internal temperature of the cell was 36 °C. Even at the same 3C, as the external temperature decreased to 0 °C, the increase in internal resistance led to a greater reaction heat source of 58.27 W, which was 36.9% higher than that at 20 °C. At 5C, the maximum operating time was 685.6 s. At this point, the average internal temperature of the cell was 59.8 °C, which allowed for normal operation. When the C–rate of the battery cell reached 8, which was the momentary maximum high-discharge condition, the temperature sharply rose before the state of charge () reached 0. With an average internal cell temperature of 80 °C, the maximum operating time became 111.9 s. This met the design requirements for urban air mobility (UAM) in this study.
1. Introduction
Urban air mobility (UAM) is a next-generation transportation system that connects the ground and the sky to enable the transportation of people and cargo in urban airspace. By integrating with the ride-sharing business model, UAM offers a safe and quiet means of transport that significantly reduces travel time within a city while avoiding ground traffic congestion. With advancements in high-energy-density batteries, high-power electric motor technology, and autonomous driving capabilities, UAM is anticipated to become a promising new challenge of transportation in the future [1,2]. The implementation of UAM technology is gaining attention, particularly with regard to new battery technologies. UAM batteries require high power and energy density with a high discharging rate. Key aspects include a cooling technology that is capable of handling high discharge rates, which could include battery management systems (BMSs) and reliable packaging technology. Unlike mobility batteries for ground transportation, UAM batteries are typically located in the wing area, which limits the cooling options to air–cooling methods. These batteries must also deliver excellent performance in low–temperature environments to operate at a high altitude. In particular, batteries with discharge rates of 8C or higher necessitate careful design to address the heat generated during high–discharge operations. The optimal temperature range for lithium–ion batteries, which are commonly used for UAM applications, is between 25 and 55 °C. Beyond this range, cell lifespan rapidly decreases, and temperatures exceeding 80 °C can lead to thermal runaway, making it essential to conduct thorough research on the thermal behavior of battery cells [2]. Because of its high energy density and price competitiveness, the lithium–ion battery is the most widely used UAM. Both the cylindrical and pouch–type lithium–ion batteries have a high energy density, but in the case of a cylindrical battery, relatively high costs are required compared to the pouch-type battery for configuration as a module or a pack. In particular, UAM batteries require a high energy density in cells as well as in packs compared to battery electric vehicles (BEVs), and thus a lightweight packaging technology is very important [3]. Therefore, in order to have a high energy density in a battery pack unit, it is more advantageous to apply a pouch-type lithium–ion battery having a large capacity in a unit cell for UAM. Different electrolytes, coatings, and electrode materials such as graphite, alloy, and composite could affect the characteristic parameters of pouch–type lithium–ion batteries [4,5,6].
In the past, extensive research has been conducted to develop numerical models that are capable of simulating the behavior of battery cells to design battery modules or systems. Mathematical models for battery cells are essential for designing a cell or system structure, cooling, and operation. Over the last 20 years, research has been conducted to create battery models that can simulate the operational characteristics of batteries and validate the results. Among these models, the electro–chemical (EC) model [7,8,9], data-driven models [10], equivalent–circuit model [11,12,13,14,15], and electro-thermal (ET) model are representative. While the EC model shows the ability to accurately predict the dynamics and terminal voltage, it can be expressed with coupled partial differential equations, which require high computational power. On the contrary, equivalent–circuit models considering resistance–capacitance (RC) elements, including models with one RC pair [11,12], two RC pairs [13,14], and three RC pairs, were used to describe battery dynamics [15]. Table 1 compares the EC model and the ET model.
The ET model coupled with the equivalent–circuit model has been proposed for the analysis or prediction of the electrical and thermal behavior of lithium–ion batteries. The ET model had a relatively simple model configuration and required fewer calculations than the EC model. It has been widely used by researchers due to its simplicity, low computational demand, and high accuracy in analyzing the dynamic behavior of lithium–ion batteries regarding the state of charge (), current, and temperature. One of the key advantages of the ET model is that it requires minimal data to construct a model of a lithium–ion battery cell. While the ET model may not fully replicate the dynamic voltage behavior of battery cells during charging and discharging, it is more effective in battery design at the module or pack level. This makes it a suitable choice for battery system design, thus offering a good balance between simplicity and accuracy. Li et al. [16] proposed a two–dimensional computational fluid dynamics (CFD) model for analyzing the thermal management system of an air–cooled battery pack, and to validate the proposed CFD model, experiments were performed. Cicconi et al. [17] performed an analysis of the thermal behavior of a lithium–ion battery for a three–dimensional model, and the proposed model was experimentally validated under a standard ECE–15 driving cycle (urban driving cycle). The cell model was subsequently employed as the boundary condition in the CFD model of a battery pack to evaluate the cooling effects. Kim et al. [18] proposed a model–based approach for predicting the temperature distribution inside a cylindrical lithium–ion battery. They used a reduced–order thermal model with a polynomial approximation for the temperature profile inside the lithium–ion battery. The results showed that the proposed dual–Kalman–filter–based prediction method could provide an accurate estimation of the internal temperature by measuring the current and voltage of the lithium–ion battery with the surface and ambient temperatures for various cooling conditions. Saw et al. [19] built an equivalent–circuit model coupled with the thermal model to analyze and investigate the electrical and thermal behavior of a pouch–type lithium–ion battery under various operating conditions. Three pair of RC model was used for the equivalent–circuit model. It was found that an active thermal management system was required to increase battery life and ensure the safety of battery packs. Wang et al. [20] proposed a thermal model based on the finite–element method for a cylindrical lithium–ion battery. The model was simplified to increase computational efficiency. The results showed an error of about 10% between the simulation and experimental results at various ambient temperatures and discharging conditions. Huang et al. [21] suggested an electro–thermal model considering power input, which could accurately describe the dynamic electrical response characteristics of a lithium–ion battery under specific power load conditions. That was capable of estimating the changes in the surface and internal temperature of a battery in an electric vehicle simulation. Barcellona et al. [22] proposed an integrated electro–thermal model, which was capable of predicting the thermal behavior of the battery cell from only information on the total current and ambient temperature in a nickel–cobalt–manganese (NCM) battery pack.
In the current research landscape, most studies focus on using the ET model to investigate low–discharge conditions, and there has been limited research on the thermal characteristics of UAM battery cells that demand high discharge rates within 1 min. Therefore, this study utilized the ET model to perform a thermal analysis of high–energy, high–power lithium–ion batteries for UAM applications. Based on the results of the performance evaluations of individual cells, an equivalent–circuit model was constructed for the battery. A three–dimensional model of the cell was also developed to analyze the output and heat generation characteristics under various operating conditions. In particular, this study analyzed the operational and cooling characteristics of the battery cell under conditions of 8C or higher, which is essential during take–off or landing in UAM. By investigating these characteristics, the aim was to utilize the data to predict heat generation in a battery module or pack and subsequently design an overall cooling system for the battery by using the ET model. In summary, this research focused on using the ET model to analyze the thermal behavior of high–energy, high–power lithium–ion battery cells for UAM applications. The results obtained will be used to predict heat generation and to design an effective cooling system for battery modules or packs.
2. Methodology
2.1. Model of a Pouch–Type Lithium–Ion Battery
In this study, a pouch–type lithium–ion battery, as shown in Figure 1, was selected for UAM applications. The lithium–ion battery had an NCM chemistry and a maximum capacity of 40 Ah. The maximum charge voltage was 4.25 V, and the cut–off voltage was 2.75 V. The battery was able to handle a maximum continuous discharge of 5C; the C–rate was 5. The aim was to predict the operational and thermal performance under the instantaneous maximum discharge condition, which was 8C. The specifications and information about the lithium–ion battery are provided in Figure 1 and Table 2.
2.2. Governing Equation and Simulation Setup
In this study, AVL’s FireM commercial software was used for the thermal analysis of lithium–ion battery cells by using the ET model. FireM is a multiphysics CFD software for investigating and analyzing the behavior of the electrical and thermal behavior of the lithium–ion battery [23]. To create the ET model, the actual multi–layered lithium–ion battery cell was simplified and modeled as a positive collector, negative collector, reaction layer, and cell case, as shown in Figure 2. A three–dimensional grid system was constructed for the thermal analysis. The entire computational grid in the ET model consisted of approximately 480,000 elements. The material properties for each component of the lithium–ion battery were specified to apply the ET model. The thermal properties of each material, including the specific heat capacity , were defined as polynomial functions of the temperature. Additionally, the thermal conductivity of the reaction layer was applied differently in the thickness direction due to its anisotropic characteristics, as presented in Table 3 [23].
A battery is an electro–chemical energy conservation device that converts chemical energy into electrical energy. During charging, the voltage across the battery gradually increases as energy is stored. The charging current decreases as the battery’s state of charge () rises. During discharge, the voltage gradually drops as energy is released. The rate of the voltage drop depends on the discharge current and the battery’s internal resistance.
The equivalent–circuit model of the battery was described with the RC model in which the cell voltage was calculated as follows:
where is the open–circuit voltage (V), is the current (A), is the ohmic resistance ), and is the number of RC elements (-). In this study, a two–RC–pair model, which is commonly used to predict the thermal behavior of battery cells, was employed. Figure 3 represents the equivalent–circuit model of the lithium–ion battery cell used in this research.
The capacitor charge was obtained as follows:
where is the ohmic resistance, is the resistance, and is the capacitance. They are functions of the temperature and . The materials and ratios constituting the cathode, anode, and electrolyte of a pouch–type lithium–ion battery affect overall electro–chemical performance parameters such as battery capacity, energy density, oxidation stability, and Coulombic efficiency [24]. Unlike the EC model, the ET model could be modeled using response characteristics when charging and discharging the battery cell instead of the detailed chemistry of the lithium–ion battery, as illustrated in Table 1. The resistance and the capacitance were calculated from the voltage response of the charge/discharge current pulse in the experiment, as shown in Figure 4.
State of charge () is defined as the level of charge of an electric battery relative to its capacity. In the ET model, considering charging/discharging was calculated by using Coulomb counting as follows [24]:
where is the initial value of the state of charge (-) and is the maximum capacitor charge (As). The Coulombic efficiency depends on and during the charging/discharging.
In the battery cell, there were multiple negative electrodes, multiple positive electrodes, and separators that separated them. However, in the electro–thermal (ET) model used in this study, the battery cell was simplified by representing it with a single reaction layer, as depicted in Figure 5. This simplification allowed for efficient modeling and analysis of the thermal behavior of the battery cell. While it may not have captured the detailed internal structure of the battery, it still provided valuable insights into the overall thermal performance of the cell under different operating conditions.
In the positive and negative collector layers shown in Figure 5, the electric charge conservation was accounted for by solving the charge conservation equation as follows:
where is electric current density , is the electronic conductivity , and is the electric potential . The temperature was calculated by using the energy balance:
where is the specific heat , is the density , and is the volumetric heat source .
In the reaction layer shown in Figure 5, electric charge conservation was accounted for by solving the charge conservation equation as follows:
where is the reaction heat source , is the reaction current density , and is the local open–circuit voltage . is the thickness of the active layer . In general, it is known that the heat generation of a lithium–ion battery is determined by Joule heating and a change in entropy contribution representing a change in the internal energy of a battery material. It has hysteresis characteristics against heat generation during constant current charging or discharging, and the amount of heat generated during charging is smaller than that during discharging, which is due to the entropy term of heat generation [24]. Detailed models are referred to in the references [23].
The material properties of the lithium–ion battery are summarized in Table 3. The boundary condition of the positive terminal was specified on the total battery current during operation, as shown in Figure 2, and the electric potential was zero at the negative terminal. For the end of the battery terminal, adiabatic boundary conditions were specified; at the other boundaries, the convection boundary condition was applied as a heat transfer coefficient of . The reaction layer temperature was cooled according to the external temperature and the heat transfer coefficient.
3. Results and Discussion
Based on the provided information, Figure 6 presents the results of the analysis of the ET model for the lithium–ion battery cell under discharge conditions with different C–rates. The external temperature was 20 °C, and the initial voltage of the fully charged lithium–ion battery was set to 4.2 V. The operating mode was designed to simulate cruising flight conditions in UAM with a constant current continuous discharge for 1200 s, followed by a no–load condition until 2000 s. As shown in Figure 5, there was a sharp voltage drop from the initial fully charged state, and then the operating voltage gradually decreased. After the 1200 s continuous discharge, when the load was removed, the battery voltage began to recover. This voltage recovery was attributed to the behavior of the capacitors in the equivalent–circuit model of the battery. The ET model of the battery cell was constructed by using a second–order RC model that was evaluated under unit step conditions, which were similar to those displayed in Figure 6. Figure 6b shows the cell’s output. When the C–rate was 1, the voltage drop was relatively small, allowing a stable output under constant current discharge conditions. As the C–rate increased to 3, the voltage variation became more significant, leading to a larger variation in the output. Figure 6c illustrates the variations with respect to the C–rate. was calculated based on Equation (11). As the C–rate increased, significantly decreased, but even under the 20 min continuous discharge condition, a relatively constant output was maintained. Figure 6d depicts the variation in the reaction heat generation within the reaction layer with respect to changes in the C–rate. The reaction heat source was calculated from Equation (11) and uniformly distributed within the reaction layer. Subsequently, it was transferred as heat throughout the entire cell, and then heat was released into the outside air through convective heat transfer. Initially, heat was generated due to ohmic losses, but over time, a steady heat was emitted to the outside. Based on the data at 1200 s, the reaction heat source for 1C was 6.05 W, that of 2C was 19.97 W, and that of 3C was 42.5 W.
Figure 7 shows the lithium–ion battery cell’s maximum temperature and average temperature under different C–rate conditions. The maximum temperature occurred near the “tap” area, where the current flowed most intensively, while the average temperature represented the average value within the reaction layer. As the cell discharged, the temperature gradually increased. Eventually, a balance between heat dissipation and heat transfer to the outside air was achieved, leading to the convergence of the temperature.
Figure 8 illustrates the dynamic characteristics of the cell with 3C while considering the variations in the external temperature. In Figure 8a, at external temperatures of 20 °C and 50 °C, it can be observed that a sudden voltage–drop occurred when the temperature dropped to 0 °C, unlike during discharge. However, the recovery voltage was similar in all cases. As shown in Figure 8b, the cell’s output decreased somewhat due to the sudden voltage drop at low temperatures. The internal resistance of the lithium–ion battery cell generally increased as the temperature decreased, and especially at low external temperatures, it exhibited a sharp increase. When using the ET model for lithium–ion batteries, it was observed that the reaction heat source significantly increased at low temperatures. However, since the cell’s temperature rose due to the initial reaction heat source, the subsequent heat generation was primarily proportional to the square of the current rather than the internal resistance. As shown in Figure 8c, even at the same C–rate, the reacting heat source varied depending on the ambient temperature. The internal resistance of lithium–ion battery cells was modeled as a function of temperature, and it increased rapidly as the temperature decreased. Therefore, when the lithium–ion battery cranked at low temperatures such as , the reacting heat source increased rapidly due to the high internal resistance. After that, the inner temperature of the reaction layer increased, thereby reducing the internal resistance and improving the battery performance. It could be seen that as the outside air temperature decreases, the also decreases slightly, as shown in Figure 8d.
Figure 9 shows the average temperature of the reaction layer and the cell’s surface temperature in response to changes in the external temperature. Even with the same C–rate, the average temperature of the reaction layer increased to a maximum of 65.3 °C at an external temperature of 50 °C. The cell’s surface temperature reached 57.6 °C at an external temperature of 50 °C.
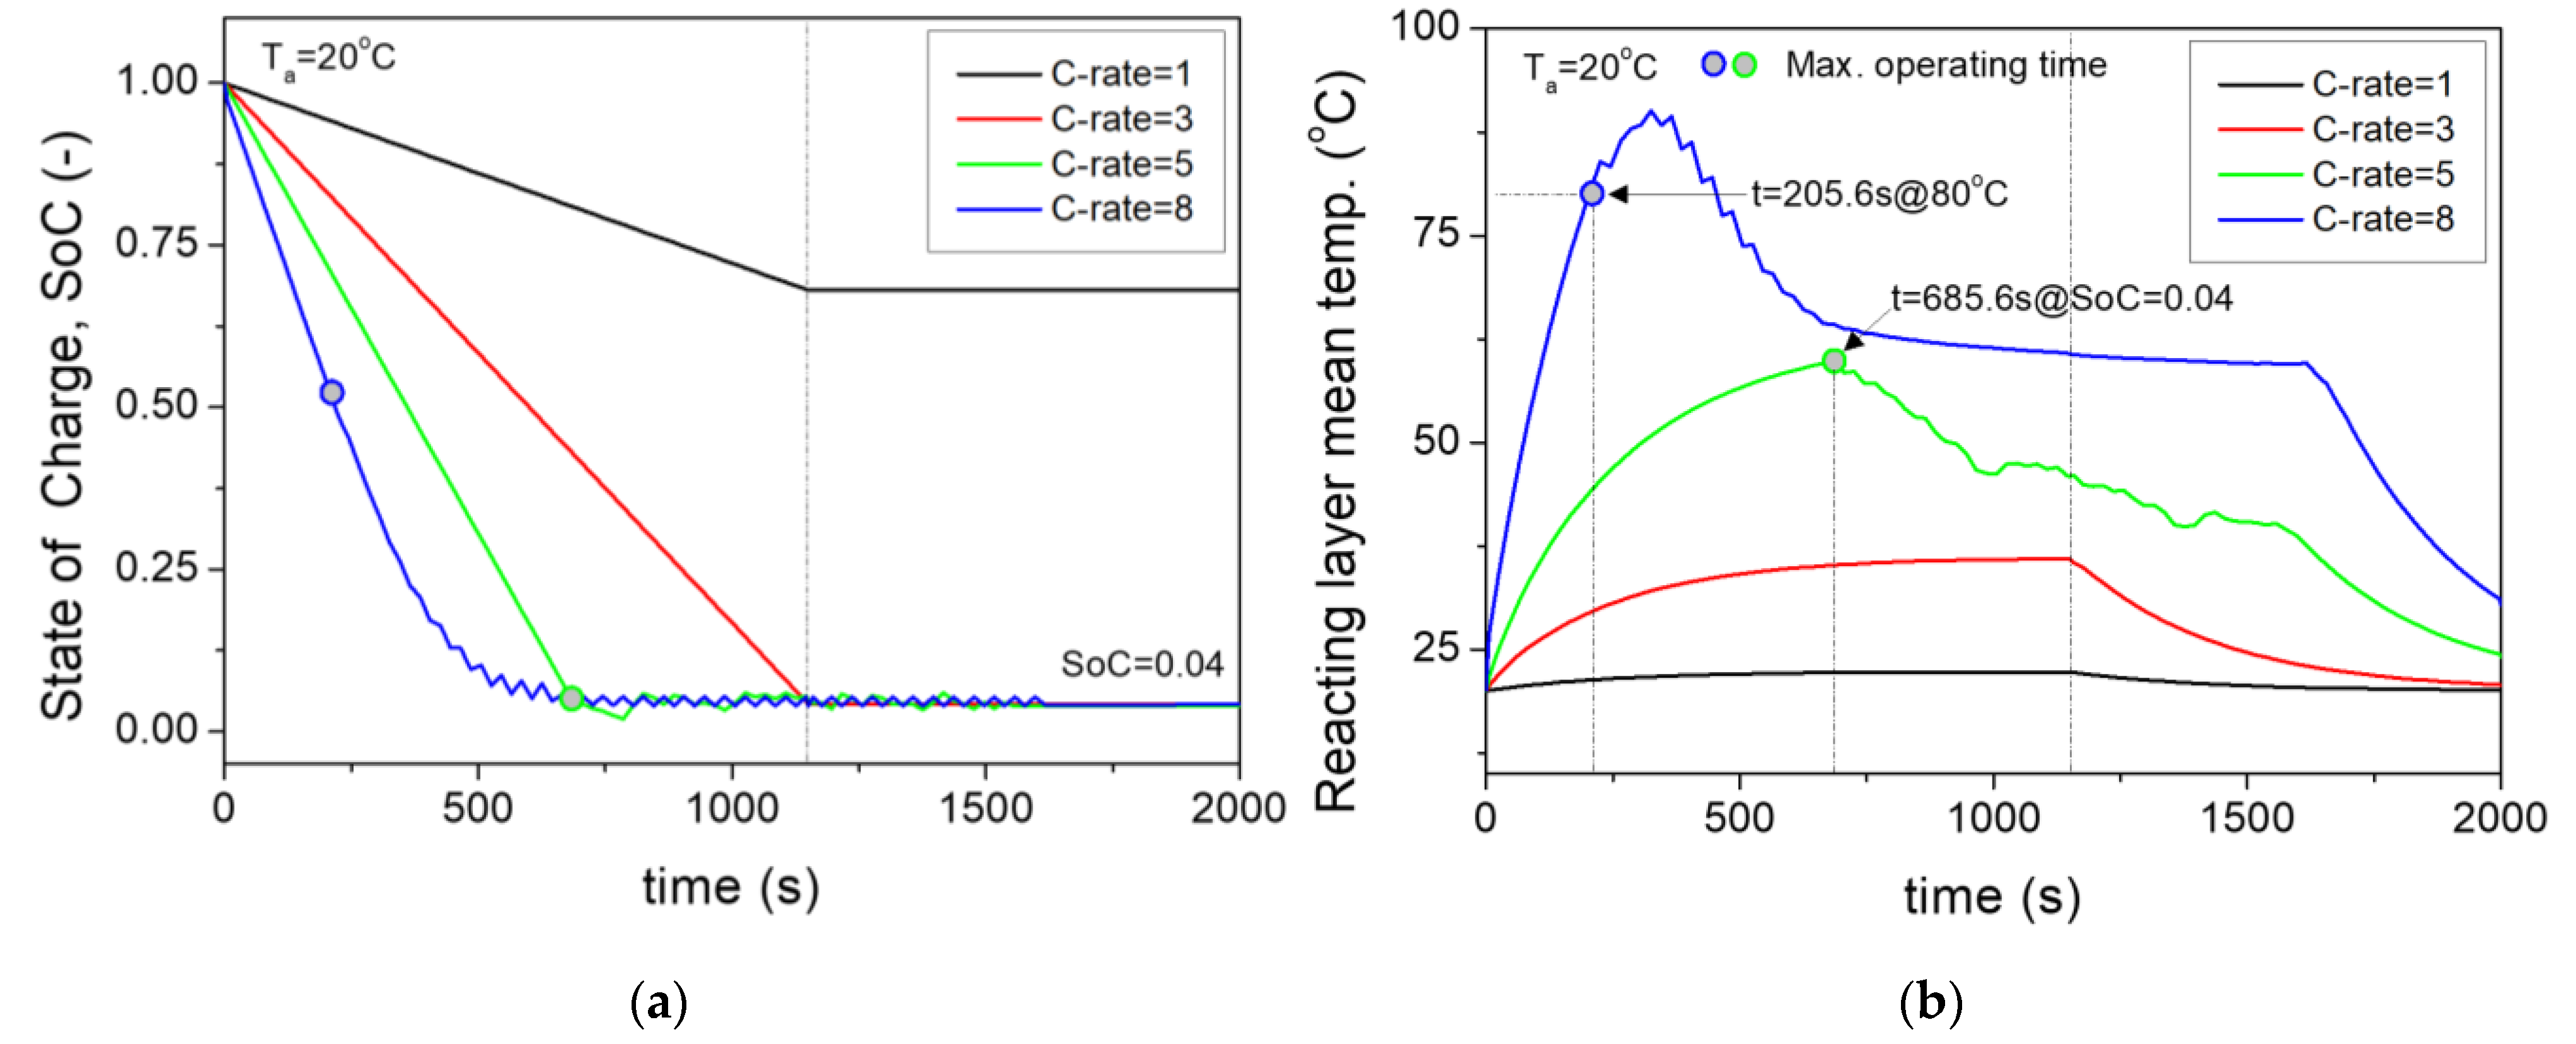
Figure 10 shows the average temperature of the reaction layer and the as the C–rate increased to the maximum C–rate. The desired operating range for the pouch–type lithium–ion battery cell used in this study was designed for the to be 0; numerically, as approached 0.04, there was no more current from the lithium–ion battery. The average temperature of the reaction layer should be kept below 80 °C at the same time. If the average internal temperature of the cell exceeds 80 °C, it could lead to a rapid temperature rise and thermal runaway, so the design aimed to control the output beyond this temperature. However, in this study, the analysis of the thermal runaway mechanism was not considered. This interpretation was focused on the ET model. Meanwhile, the maximum discharge requirement for the UAM battery cell in this study was continuous discharge at 8C for 1 min. As shown in Figure 10a, it was possible to operate under cruising conditions of 20 min under 1C and 3C. When the battery cell’s C–rate was 5, the maximum operating time was 685.6 s owing to . At this time, the average internal temperature of the cell was 59.8 °C, allowing for normal operation, as shown in Figure 10b.
When the C–rate of the battery cell increased to 8C, which was the momentary maximum high–discharging condition, the temperature rose sharply before the reached 0. When the operating time approached 205.6 s, the reacting layer mean temperature of the battery cell reached 80 °C, as shown in Figure 10b. As a result, the maximum operating time became 205.6 s. This satisfied the design requirements for UAM in this study. Typically, when configuring a 14S (serial) module of battery cells, temperature increase due to packaging should be considered. Therefore, heat sinks or air–cooled cooling systems need to be used to manage the overall thermal performance of the battery module or pack.
4. Conclusions
In this study, the dynamic behavior and thermal performance of a high–power, high–energy–density lithium–ion battery for UAM applications were analyzed by using an electro–thermal model. To simulate the behavior of pouch–type NCM lithium–ion batteries, an equivalent circuit of a battery composed of a second–order RC circuit was constructed. The values of the RC models were determined by curve fitting based on experimental data for the cell. A 3D model of the lithium–ion battery was created, and a thermal analysis was performed while considering the external temperature and flight time under a 20 min load condition. In particular, the operational and thermal characteristics of the battery cell under the high–discharge conditions required for UAM takeoff were examined. The analysis yielded the following results:
- At an external temperature of 20 °C, the heat generation increased proportionally to the square of the current as the C–rate increased. For 3C, the reaction heat source was 45.5 W, and the average internal temperature of the cell was 36 °C.
- Even at the same 3C, as the external temperature decreased to 0 °C, the increase in internal resistance led to a higher reaction heat source of 58.27 W, which was 36.9% higher than that at 20 °C.
- The cell in this study was designed with a maximum operating condition of an internal cell temperature of 80 °C. At 5C, the maximum operating time was 685.6 s. At this point, the average internal temperature of the cell was 59.8 °C, allowing for normal operation. When the C–rate of the battery cell reached 8C, which was the momentary maximum high–discharge condition, the temperature rose sharply before the reached 0. With an internal average cell temperature of 80 °C, the maximum operating time became 205.6 s. This met the design requirements for UAM in this study.
Funding
This research was supported by Tongmyong University Research Grant 2020A001.
Data Availability Statement
Not applicable.
Conflicts of Interest
The author declares no conflict of interest.
References
- Garrow, L.A.; German, B.J.; Leonard, C.E. Urban air mobility: A Comprehensive Review and Comparative Analysis with Autonomous and Electric Ground Transportation for Informing Future Research. Transp. Res. Part C Emerg. Technol. 2021, 132, 103377. [Google Scholar] [CrossRef]
- Qiao, X.; Chen, G.; Lin, W.; Zhou, J. The Impact of Battery Performance on Urban Air Mobility Operations. Aerospace 2023, 10, 631. [Google Scholar] [CrossRef]
- Liu, T.; Yang, X.G.; Ge, S.; Leng, Y.; Wang, C.Y. Ultrafast Charging of Energy-Dense Lithium-ion Batteries for Urban Air Mobility. eTransportation 2021, 7, 100103. [Google Scholar] [CrossRef]
- Yi, X.; Rao, A.M.; Zhou, J. Trimming the Degrees of Freedom via a K+ Flux Rectifier for Safe and Long-Life Potassium-Ion Batteries. Nano-Micro Lett. 2023, 15, 200. [Google Scholar] [CrossRef]
- Sanad, M.M.; Meselhy, N.K.; El-Boraey, H.A. Surface Protection of NMC811 Cathode Material via ZnSnO3 Perovskite Film for Enhanced Electrochemical Performance in Rechargeable Li-ion batteries. Colloids Surf. A Physicochem. Eng. Asp. 2023, 672, 131748. [Google Scholar] [CrossRef]
- Sanad, M.M.; Meselhy, N.K.; El-Boraey, H.A.; Toghan, A. Controllable engineering of new ZnAl2O4-decorated LiNi0·8Mn0·1Co0·1O2 Cathode Materials for High Performance Lithium-ion Batteries. J. Mater. Res. Technol. 2023, 23, 1528–1542. [Google Scholar] [CrossRef]
- Srinivasan, V.; Wang, C.Y. Analysis of Electrochemical and Thermal Behavior of Li-Ion Cells. J. Electrochem. Soc. 2002, 150, 98–106. [Google Scholar] [CrossRef]
- Zhang, X. Thermal Analysis of a Cylindrical Lithium-ion Battery. Electrochim. Acta 2011, 56, 1246–1255. [Google Scholar] [CrossRef]
- Jeon, D.H. Numerical Modeling of Lithium Ion Battery for Predicting Thermal Behavior in a Cylindrical Cell. Curr. Appl. Phys. 2014, 14, 196–205. [Google Scholar] [CrossRef]
- Lechermann, L.; Kleiner, J.; Komsiyska, L.; Hinterberger, M.; Endisch, C. A Comparative Study of Data-driven Electro-thermal Models for Reconfigurable Lithium-ion Batteries in Real-time Applications. J. Energy Storage 2023, 65, 107188. [Google Scholar] [CrossRef]
- Dubarry, M.; Vuillaume, N.; Liaw, B.Y. From Single Cell Model to Battery Pack Simulation for Li-ion Batteries. J. Power Sources 2007, 186, 500–507. [Google Scholar] [CrossRef]
- Chiang, Y.H.; Sean, W.Y.; Ke, J.C. Online Estimation of Internal Resistance and Open-Circuit Voltage of Lithium-Ion Batteries in Electric Vehicles. J. Power Sources 2011, 196, 3921–3932. [Google Scholar] [CrossRef]
- Dubarry, M.; Liaw, B.Y. Development of A Universal Modeling Tool for Rechargeable Lithium Batteries. J. Power Sources 2007, 174, 856–860. [Google Scholar] [CrossRef]
- Hu, Y.; Yurkovich, S.; Guezennec, Y.; Yurkovich, B.J. A Technique for Dynamic Battery Model identification in Automotive Applications Using Linear Parameter Varying Structures. Control Eng. Pract. 2009, 17, 1190–1201. [Google Scholar] [CrossRef]
- Andre, D.; Meiler, M.; Steiner, K.; Wimmer, C.; Soczka-Guth, T.; Sauer, D.U. Characterization of High-Power Lithium-Ion Batteries by Electrochemical Impedance Spectroscopy. I. Experimental Investigation. J. Power Sources 2011, 196, 5334–5341. [Google Scholar] [CrossRef]
- Li, X.; He, F.; Ma, L. Thermal Management of Cylindrical Batteries Investigated using Wind Tunnel Testing and Computational Fluid Dynamics Simulation. J. Power Sources 2013, 238, 395–402. [Google Scholar] [CrossRef]
- Cicconi, P.; Landi, D.; Germani, M. Thermal Analysis and Simulation of a Li-ion Battery Pack for a Lightweight Commercial EV. Appl. Energy 2017, 192, 159–177. [Google Scholar] [CrossRef]
- Kim, Y.; Mohan, S.; Siegel, J.B.; Stefanopoulou, A.G.; Ding, Y. The Estimation of Temperature Distribution in Cylindrical Battery Cells Under Unknown Cooling Conditions. IEEE Trans. Control Syst. Technol. 2014, 22, 2277–2286. [Google Scholar]
- Saw, L.H.; Ye, Y.; Tay, A.A.O. Electro-thermal Characterization of Lithium Iron Phosphate Cell with Equivalent Circuit Modeling. Energy Convers. Manag. 2014, 87, 367–377. [Google Scholar] [CrossRef]
- Wang, Z.; Ma, J.; Zhang, L. Finite Element Thermal Model and Simulation for a Cylindrical Li-Ion Battery. IEEE Access 2017, 5, 15372–15379. [Google Scholar] [CrossRef]
- Huang, B.; Hu, M.; Chen, L.; Jin, G.; Liao, S.; Fu, C.; Wang, D.; Cao, K. A Novel Electro-Thermal Model of Lithium-Ion Batteries Using Power as the Input. Electronics 2021, 10, 2753. [Google Scholar] [CrossRef]
- Barcellona, S.; Colnago, S.; Montrasio, P.; Piegari, L. Integrated Electro-Thermal Model for Li-Ion Battery Packs. Electronics 2022, 11, 1537. [Google Scholar] [CrossRef]
- AVL. FIRE M User Manual 2020R 2. Available online: https://www.avl.com/cruise-m (accessed on 11 August 2022).
- Doh, C.H.; Ha, Y.C.; Eom, S.W. Entropy Measurement of a Large Format Lithium Ion Battery and Its Application to Calculate Heat Generation. Electrochim. Acta 2019, 309, 382–391. [Google Scholar] [CrossRef]
Figure 1.
Geometry and photo of a pouch–type lithium–ion battery (unit: mm).

Figure 2.
Computational grid system of the lithium–ion battery.

Figure 3.
Equivalent–circuit model of a lithium–ion battery with a second–order RC model.

Figure 4.
Response characteristics of the lithium–ion battery when charging or discharging at and 0.5C at various ambient temperatures. (a) Charging; (b) discharging.
Figure 4.
Response characteristics of the lithium–ion battery when charging or discharging at and 0.5C at various ambient temperatures. (a) Charging; (b) discharging.
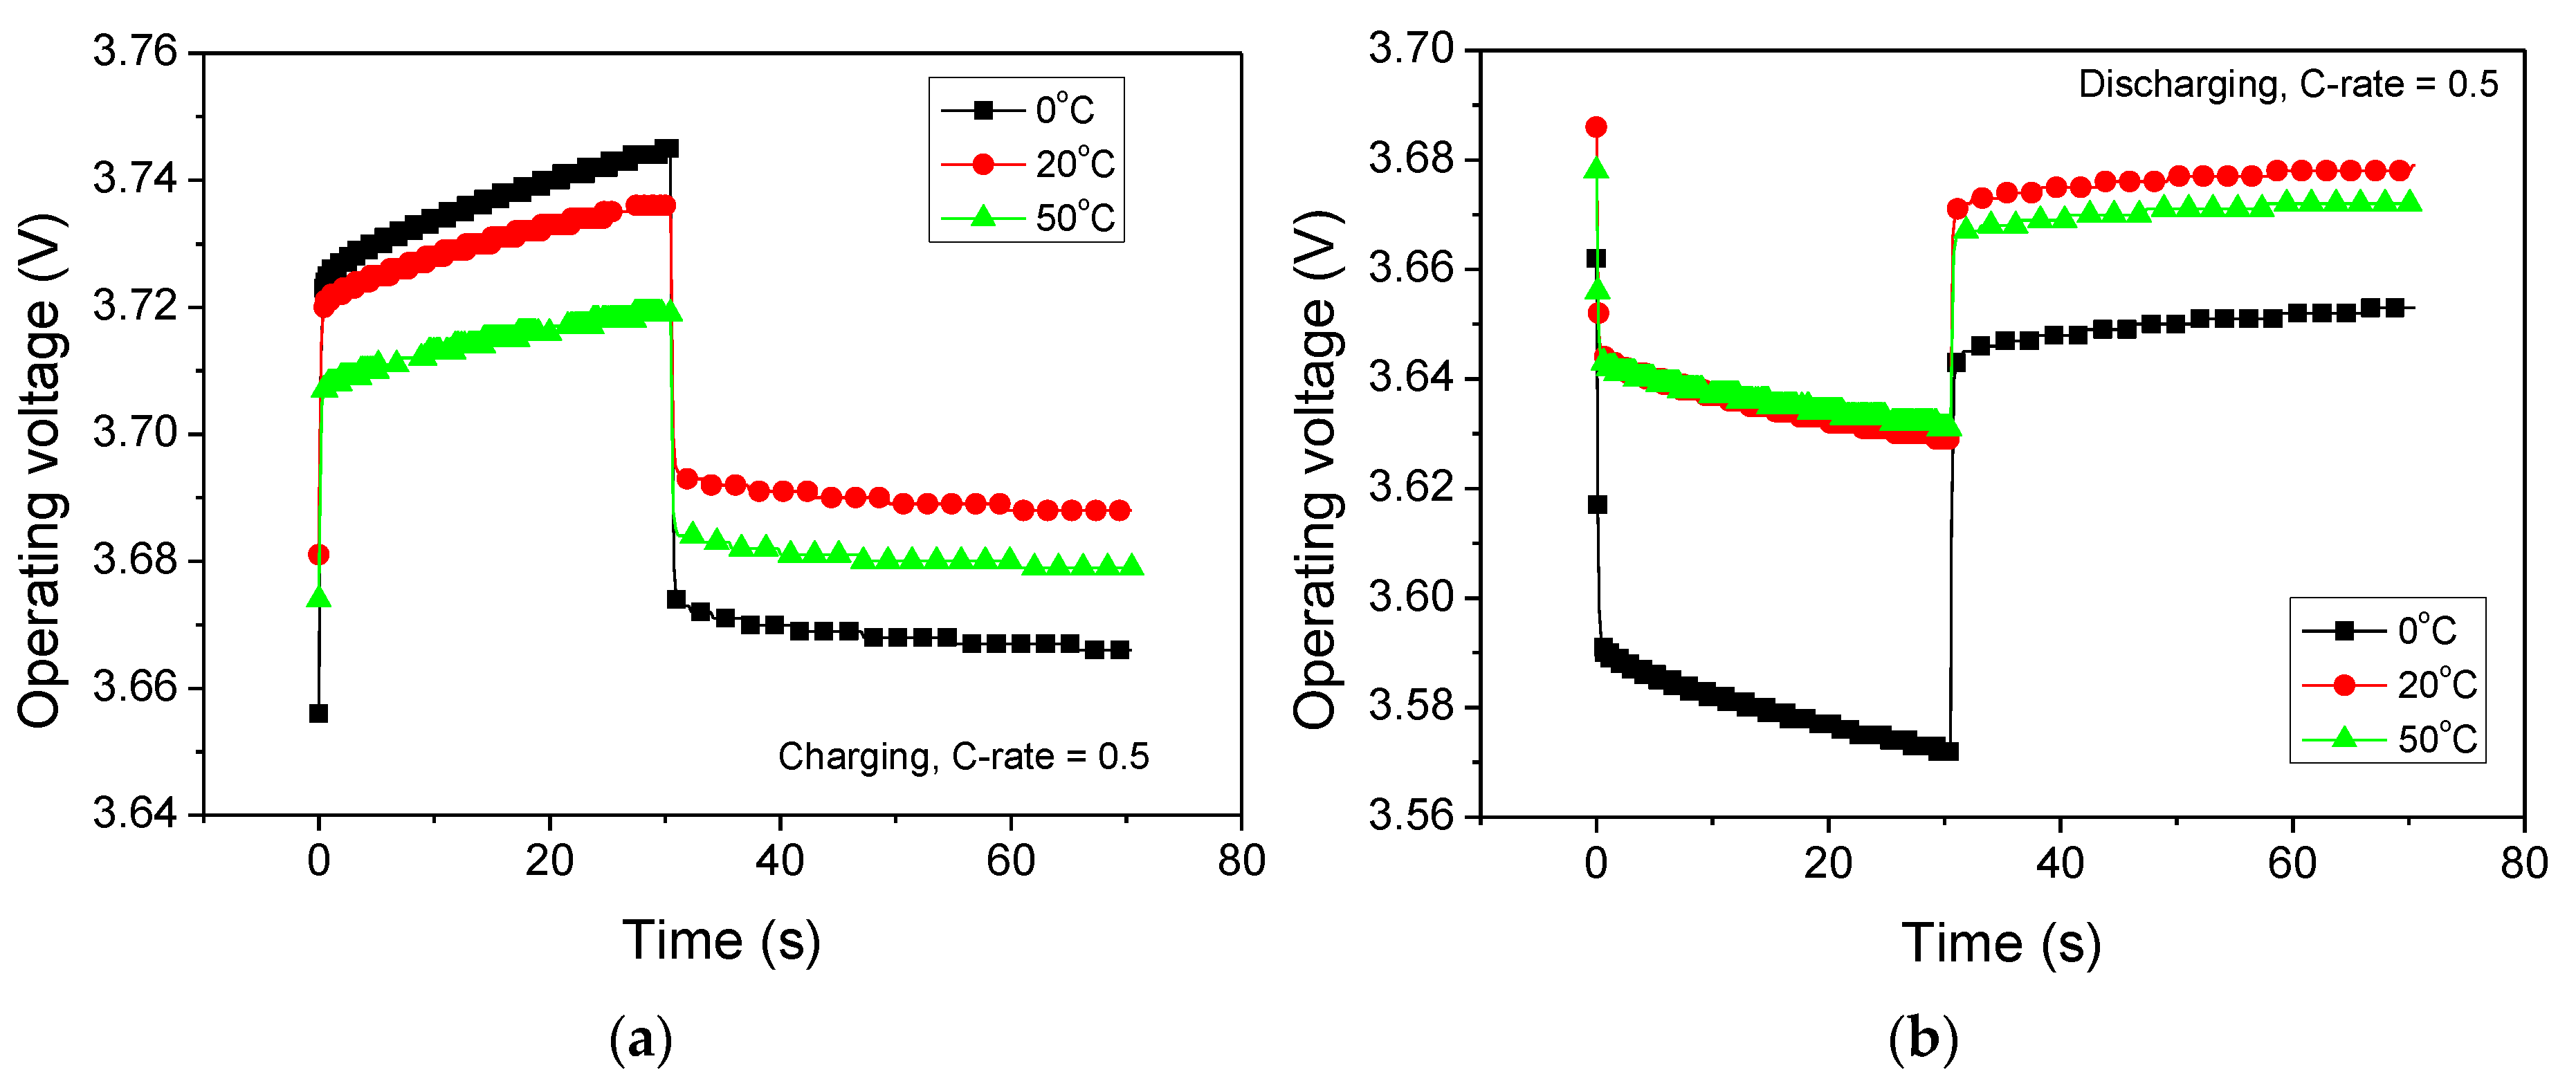
Figure 5.
Simplification of the electro–thermal model of the lithium–ion battery.

Figure 6.
Operating characteristics of the pouch–type lithium–ion battery with respect to the discharge rate. (a) Operating voltage (V); (b) operating power (W); (c) reaction heat source (W); (d) (-).
Figure 6.
Operating characteristics of the pouch–type lithium–ion battery with respect to the discharge rate. (a) Operating voltage (V); (b) operating power (W); (c) reaction heat source (W); (d) (-).

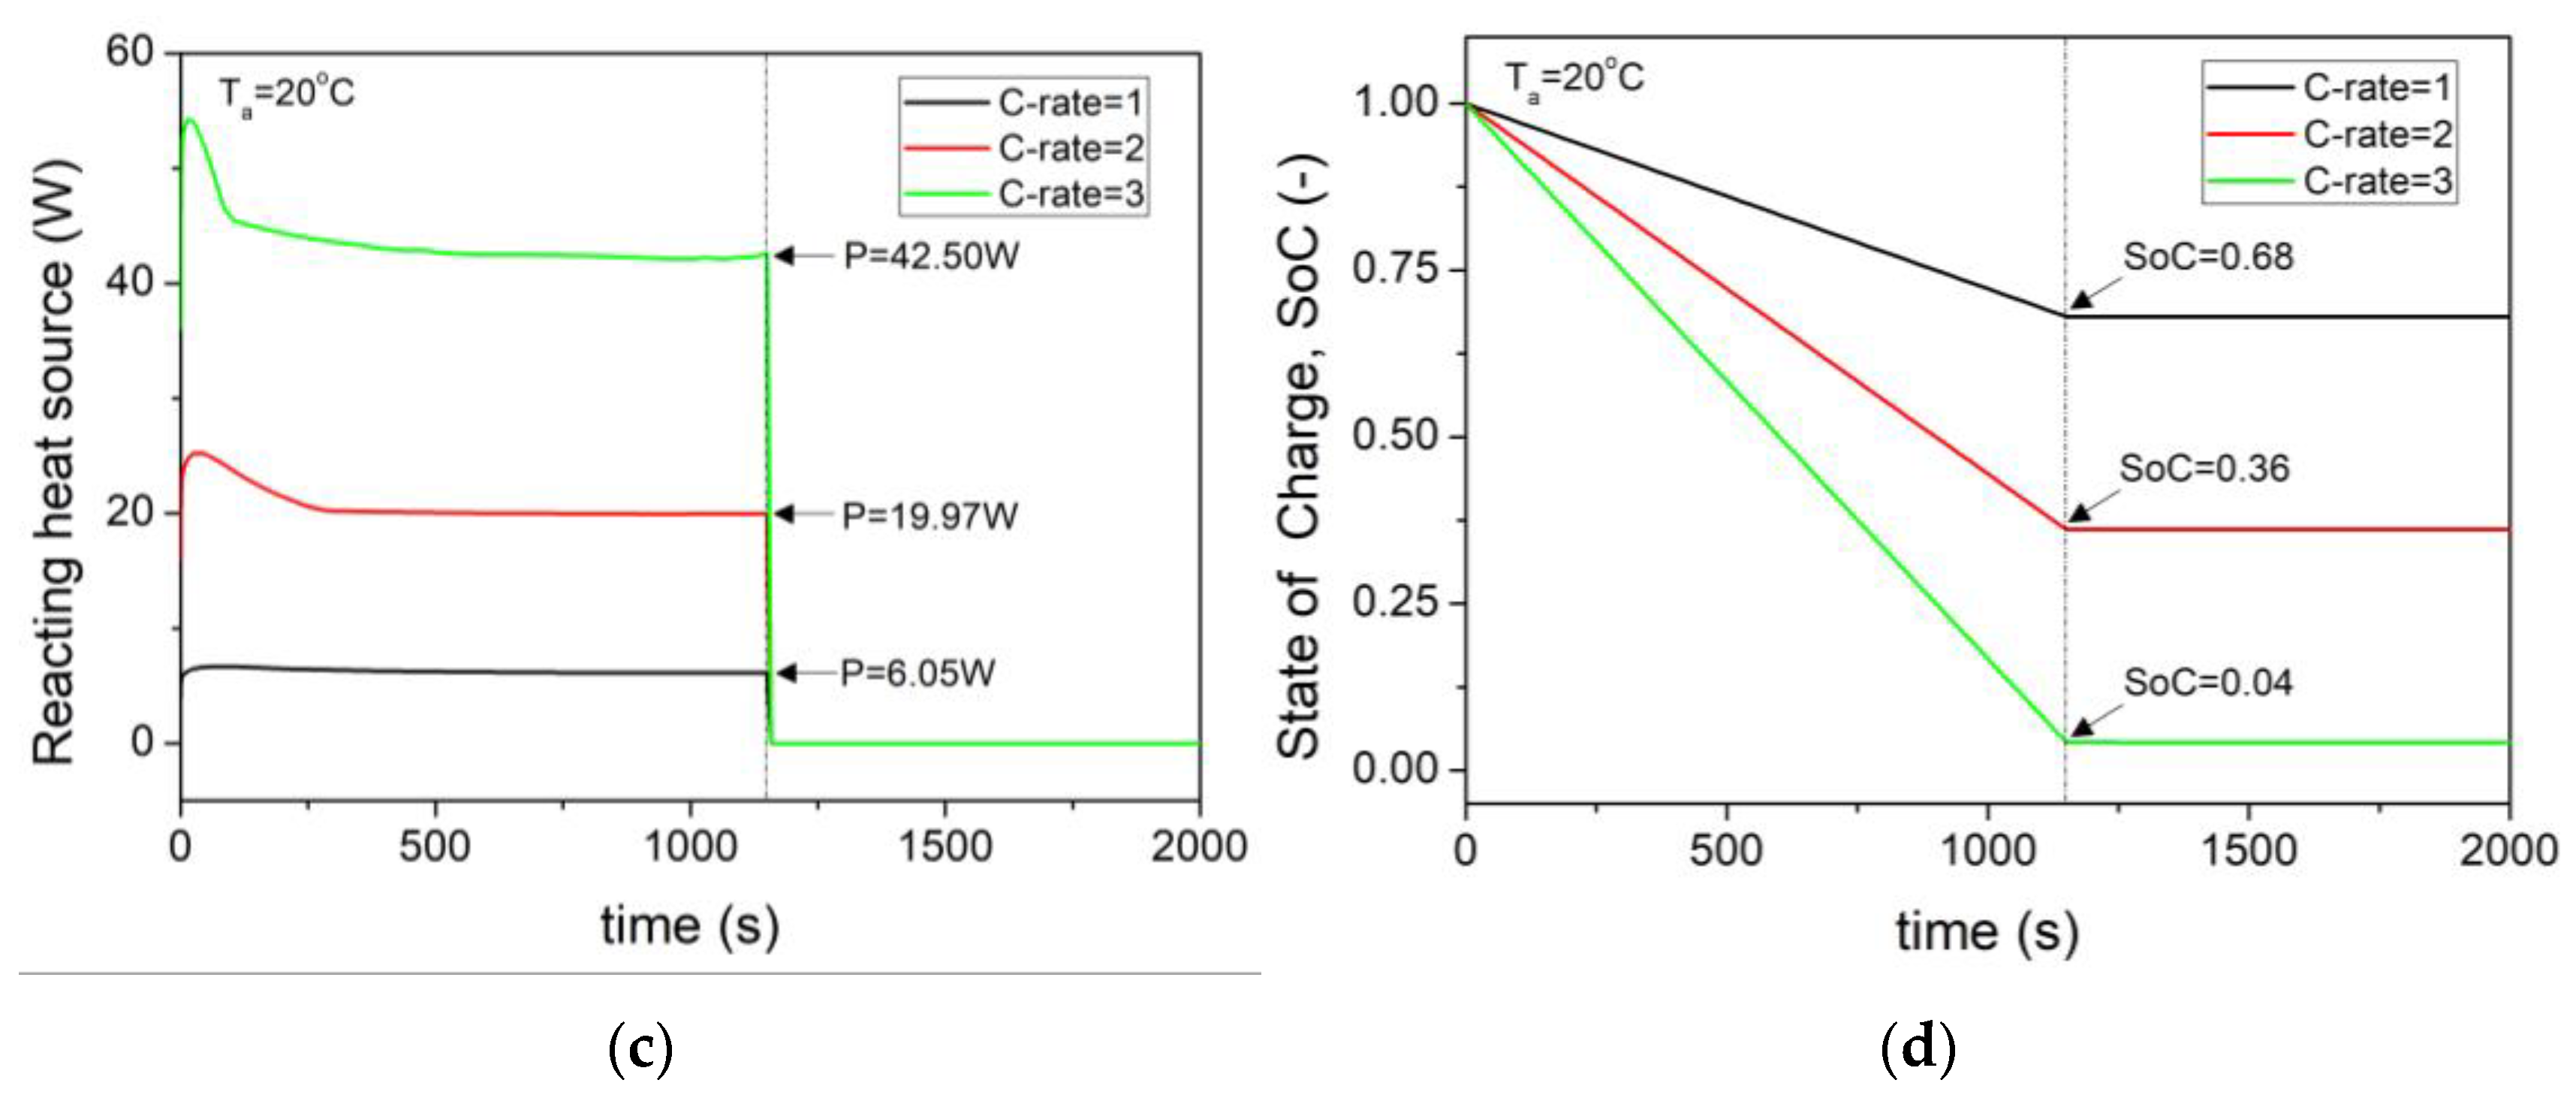
Figure 7.
Temperature variations in the pouch–type lithium–ion battery with respect to the discharge rate. (a) Reaction layer mean temperature (°C); (b) cell case mean temperature (°C).
Figure 7.
Temperature variations in the pouch–type lithium–ion battery with respect to the discharge rate. (a) Reaction layer mean temperature (°C); (b) cell case mean temperature (°C).
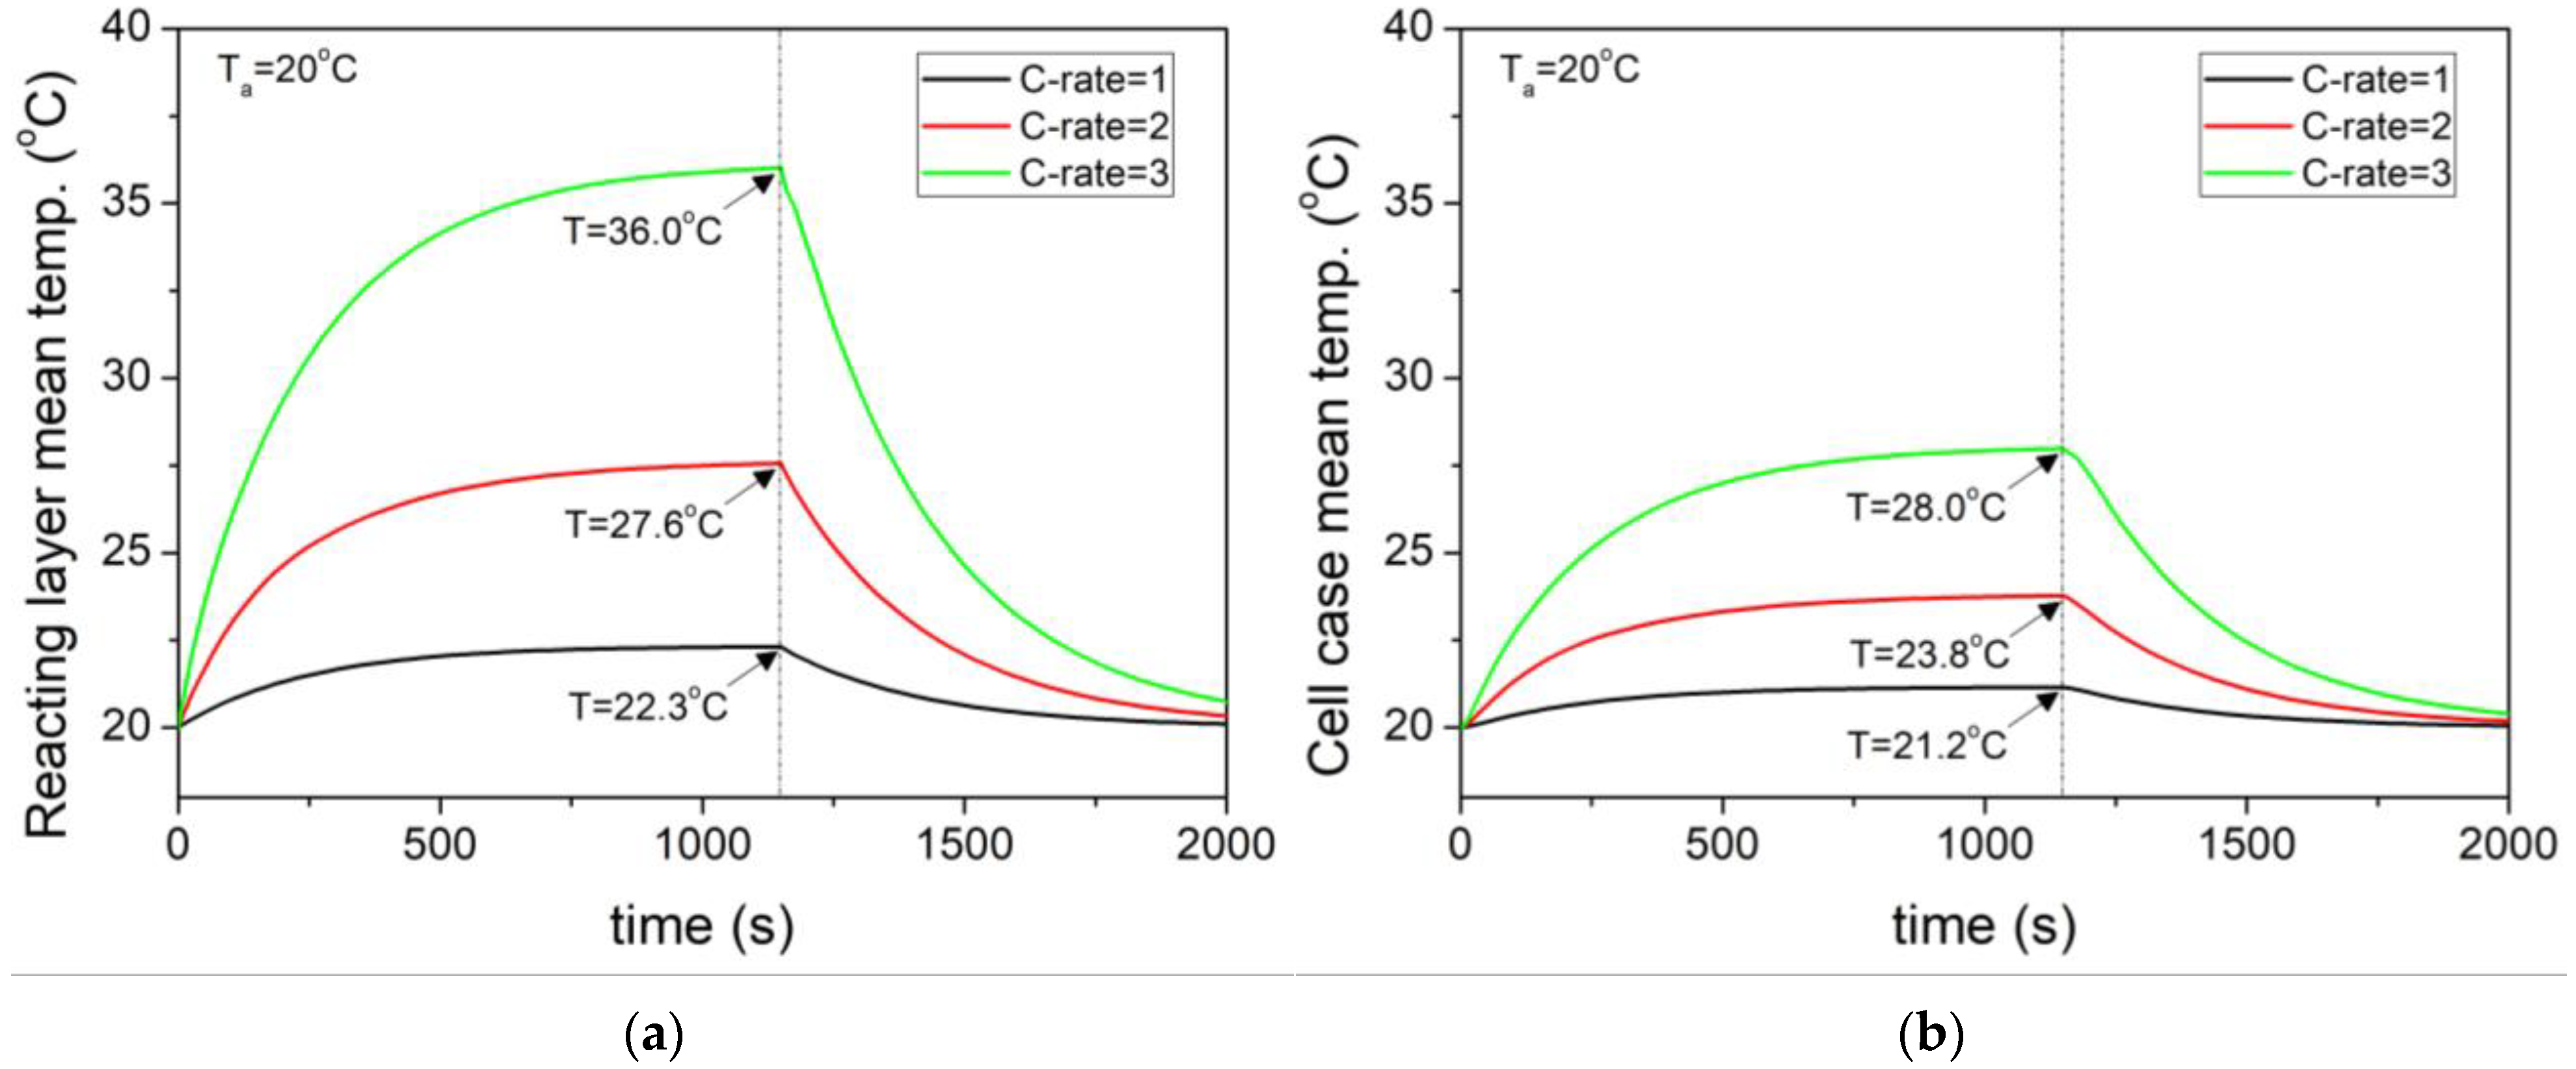
Figure 8.
Operating characteristics of the pouch–type lithium–ion battery at the ambient temperature. (a) Operating voltage (V); (b) operating power (W); (c) reaction heat source (W); (d) (-).
Figure 8.
Operating characteristics of the pouch–type lithium–ion battery at the ambient temperature. (a) Operating voltage (V); (b) operating power (W); (c) reaction heat source (W); (d) (-).

Figure 9.
Temperature variations in the pouch–type lithium–ion battery at the ambient temperature. (a) Reaction layer mean temperature (°C); (b) cell case mean temperature (°C).
Figure 9.
Temperature variations in the pouch–type lithium–ion battery at the ambient temperature. (a) Reaction layer mean temperature (°C); (b) cell case mean temperature (°C).
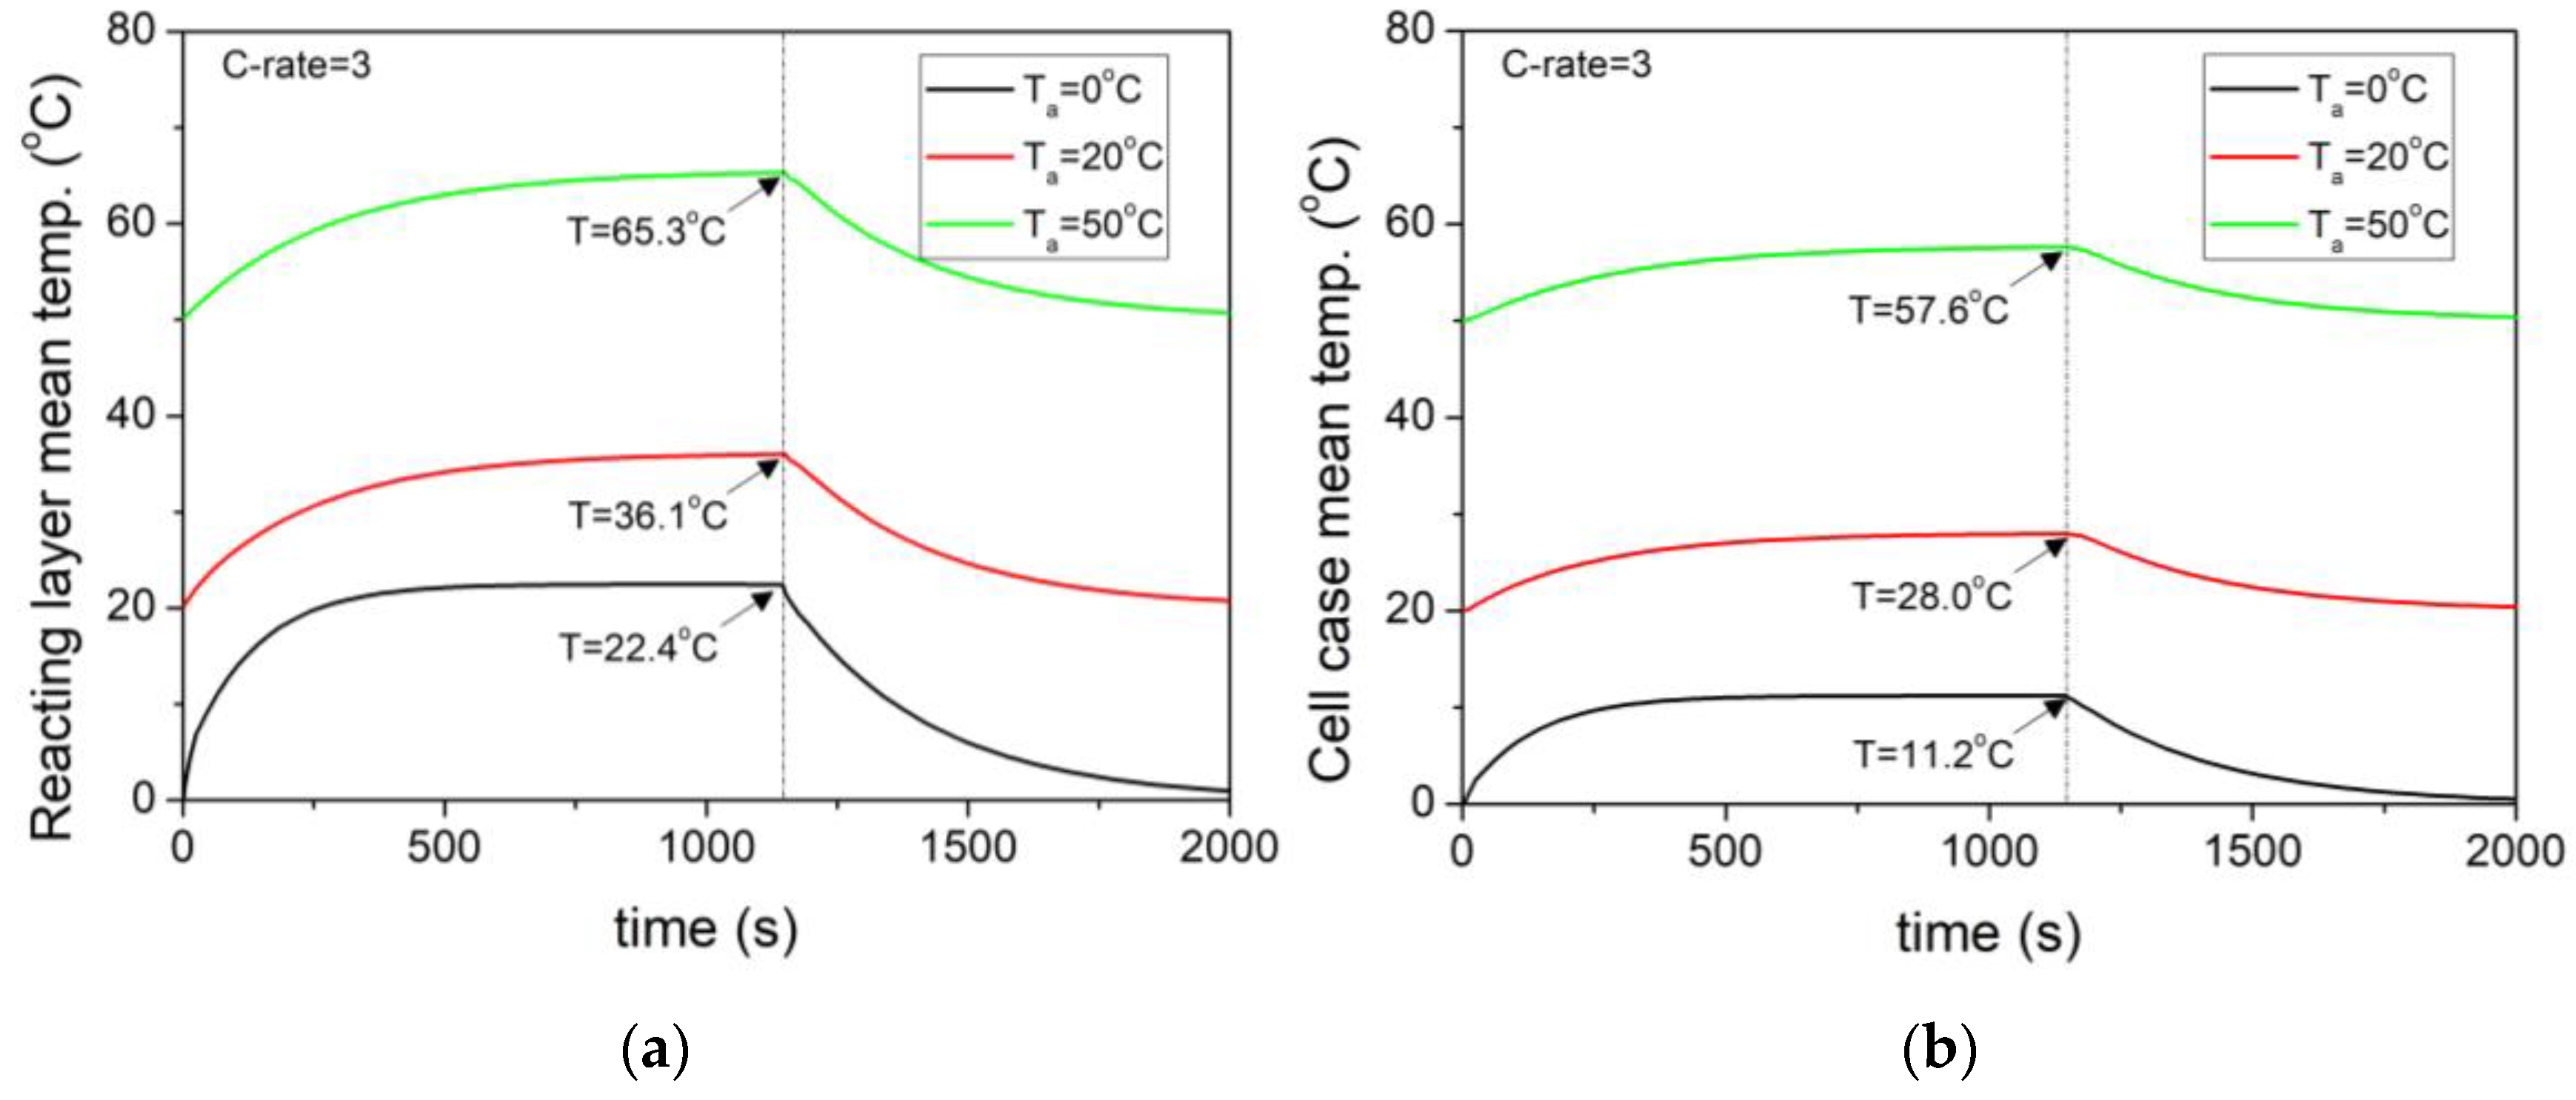
Figure 10.
and variations in the temperature of the reaction layer at a high discharge rate. (a) (-); (b) reaction layer mean temperature (°C).
Figure 10.
and variations in the temperature of the reaction layer at a high discharge rate. (a) (-); (b) reaction layer mean temperature (°C).

Table 1.
Comparison of the electro–chemical model and the electro–thermal model.
| Electro–Chemical Model | Electro–Thermal Model |
|---|---|
|
|
Table 2.
Specifications of the pouch–type lithium–ion battery.
| Items | Specification |
|---|---|
| Nominal capacity | 40 Ah |
| Nominal voltage | 3.7 V |
| Energy density | 230 Wh/kg |
| Maximum charge voltage | 4.25 V |
| Cut–off voltage | 2.75 V |
| Material system | Cathode: NMC–811 Anode: Graphite Electrolyte: Carbonate–based |
| Standard discharging method | Const. current/const. voltage |
| Maximum continuous discharge current | 5C |
Table 3.
Material properties of the pouch–type lithium–ion battery.
| Positive Collector | Negative Collector | Reaction Layer | Cell Case | |
|---|---|---|---|---|
| Material | Aluminum | Coper | Cell | Aluminum |
| Density (kg/m3) | 2700 | 8960 | 2400 | 2700 |
| Specific heat capacity (J/(kg·K)) | 1500 | |||
| Thermal conductivity (W/(m·K)) | 236 | 401 | 0.5/30/30 | 236 |
| Electrical conductivity (A/(V·m)) | 5.96 × 10⁷ | 5.96 × 10⁷ | 1 × 10⁹ | 5.96 × 10⁷ |
Disclaimer/Publisher’s Note: The statements, opinions and data contained in all publications are solely those of the individual author(s) and contributor(s) and not of MDPI and/or the editor(s). MDPI and/or the editor(s) disclaim responsibility for any injury to people or property resulting from any ideas, methods, instructions or products referred to in the content. |
© 2023 by the author. Licensee MDPI, Basel, Switzerland. This article is an open access article distributed under the terms and conditions of the Creative Commons Attribution (CC BY) license (https://creativecommons.org/licenses/by/4.0/).
Share and Cite
MDPI and ACS Style
Lee, G. Electro-Thermal Analysis of a Pouch–Type Lithium–Ion Battery with a High Discharge Rate for Urban Air Mobility. Batteries 2023, 9, 476. https://doi.org/10.3390/batteries9090476
AMA Style
Lee G. Electro-Thermal Analysis of a Pouch–Type Lithium–Ion Battery with a High Discharge Rate for Urban Air Mobility. Batteries. 2023; 9(9):476. https://doi.org/10.3390/batteries9090476
Chicago/Turabian StyleLee, Geesoo. 2023. "Electro-Thermal Analysis of a Pouch–Type Lithium–Ion Battery with a High Discharge Rate for Urban Air Mobility" Batteries 9, no. 9: 476. https://doi.org/10.3390/batteries9090476
Note that from the first issue of 2016, this journal uses article numbers instead of page numbers. See further details here.