Article

A Green Extraction Process to Recover Polyphenols from Byproducts of Hemp Oil Processing

by
Ioannis Mourtzinos
1,
Nikolaos Menexis
1,
Dimitrios Iakovidis
1,
Dimitris P. Makris
2 and
Athanasia Goula
1,*
1
Faculty of Agriculture, Forestry & Natural Environment, Aristotle University of Thessaloniki, P.O. Box 235, 54124 Thessaloniki, Greece
2
Green Processes & Biorefinery Group, School of Agricultural Technology, Food Technology & Nutrition, University of Applied Sciences of Thessaly, Karditsa - 43100, Greece
*
Author to whom correspondence should be addressed.
Recycling 2018, 3(2), 15; https://doi.org/10.3390/recycling3020015
Submission received: 28 March 2018 / Revised: 18 April 2018 / Accepted: 19 April 2018 / Published: 22 April 2018
(This article belongs to the Special Issue Food Waste – Strategies to Reuse and Prevention)

Abstract

:
The valorization of solid waste hemp (Cannabis sativa L.) by a non-conventional method is presented in this article. Hemp polyphenols were extracted using aqueous solutions of 2-hydroxypropyl-β-cyclodextrin as an eco-friendly extraction solvent. Cyclodextrins (CD’s) are known to enhance the extraction of polyphenols in water by forming water soluble inclusion complexes. The process was optimized by implementing a response surface methodology (RSM) that took into consideration the following independent variables: CD concentration (CCD), solid-to-liquid ratio (S/L), and temperature (T). The assessment of the extraction model was based on two responses: the total polyphenol yield (YTP) and the antiradical activity (AAR). The optimum operating conditions were found to be: CD concentration, 32.1% (w/v); solid/solvent ratio, 1/15.2 g/mL; and extraction temperature, 28 °C. Different kinetic models were employed to fit with experimental data and the Peleg’s model was successfully developed for describing the mechanism of extraction under different processing parameters.

1. Introduction

The demand for renewable chemicals is nowadays directing industrial practices towards manufacturing procedures with higher sustainability to minimize waste generation, improve cost-effectiveness, reduce energy consumption, and meet customer demand [1]. Agri-food waste valorization is a concept that has attracted important attention over the past few years, under the recognition that the development of innovative strategies could contribute to the exploitation of residual materials. The rational exploitation of waste plant material is largely based on white biotechnology and environmentally benign physico-chemical processes, aimed at fully utilizing the bio-organic constituents. In this regard green extraction is a notion, based on the principles of green engineering and green chemistry, which promotes sustainable extraction processes as a result of using non petroleum-based solvents and renewable plant material [2]. A holistic, 5-stage recovery process for the extraction of valuable compounds from natural products was described by Galanakis [3].
Cyclodextrins, a group of cyclic oligosaccharides, which have the structure of a truncated cone, can act as host molecules that form inclusion complexes with polyphenols [4]. Aqueous solutions of cyclodextrins could be considered an alternative to green solvents, since upon formation the complexes between the hydrophobic cavities and the polyphenols enhance the yield of extraction. 2-hydroxypropyl-β-cyclodextrin was used as a co-solvent during the extraction of polyphenols from olive leaves [5]. Cylodextrins have been also used in a holistic approach for the exploitation of pomegranate edible and non-edible parts. The presence of cylodextrin during the extraction enhances the total phenol content and the radical scavenging activity of pomegranate extracts [6].
Oilseed processing, whether performed by solvent extraction or mechanical pressing, generates a significant amount of waste consisting of peels, seeds, defatted oil seed meals, and oil sludge. Due to high amounts of proteins, dietary fibers, and other bioactive compounds that provide positive health benefits when consumed, oil seed meals have been identified as an interesting byproduct suitable for valorization [3,7]. One of the promising, but not widely investigated, oil seed meals is the remainder of hemp seed (Cannabis sativa L.) processing. In the European Union, it has been recognized as a new, oilseed crop. Mostly used for the production of durable fabrics and specialty papers, industrial hemp has been attracting growing interest worldwide for oil production. Industrial hemp contains trace amounts of δ-9-tetrahydrocannabinol (THC) (<0.3%). Moreover, THC and other cannabinoids have been used as therapeutic media. Due to the uniqueness of its composition, hemp oil has been positioned as a highly valuable product usable in food, pharmaceutical, nutraceutical, and cosmetic industries, thus justifying hemp processing, even if its oil yields are lower than those of conventional oilseeds [8]. However, there are no reports whatsoever regarding the extraction of polyphenolic substances from by-products originating from hemp oil processing and the estimation of the antioxidant properties of the extracts.
According to Shirsath et al. [9], mathematical modelling can help in the design, optimization, and control of the extraction process, as well as provide useful information for scale up of the equipment. The typical kinetic models of extraction include unsteady diffusion, Fick’s law of diffusion, film theory, and empirical models. In recent years, many kinetic studies were carried out in order to describe the extraction process of bioactive compounds from biomass and to achieve the technological transfer from lab to pilot and even industrial scale [10,11]. A mathematical model based on Fick’s law was used for describing the extraction of capsaicin from red peppers [12] and phenolic compounds from grape marc [13]. A two site kinetic model was also reported to be applicable for extraction of phenolics from grape marc [13] and oak chips [14]. A phenomenological model was developed for modelling the kinetics of the ultrasound extraction of resinoid from the aerial parts of white lady’s bedstraw (Galium mollugo L.) [15], whereas the Weibull model was applied for the extraction of phenolic compounds from grape pomace [16]. Many researchers used the Peleg’s model for describing the extraction of polyphenols [9,17,18,19,20]. However, no information is available for the kinetic modeling of polyphenol extraction from hemp oil processing byproducts.
This investigation, therefore, aimed at performing an optimization of an extraction process, for the efficient recovery of polyphenols from by-products originating from hemp, using eco-friendly and non-toxic water/2-hydroxypropyl-β-cyclodextrin mixtures. The optimization was based on a central composite design and the responses considered were the total polyphenol yield and the antiradical activity. In addition, a mathematical model to describe the kinetic mechanisms of polyphenols extraction was developed, whereas the dependence of the best descriptive model constants on extraction variables was expressed by an appropriate type of model.

2. Experimental Section

2.1. Chemicals and Reagents

Folin-Ciocalteu phenol reagent was from Fluka (Steinheim, Germany). 2-Hydroxypropyl-β-cyclodextrin (CD, average MW ~ 1460), gallic acid, trolox™, 2,2-diphenyl-picrylhydrazyl (DPPH•) stable radical were from Sigma Chemical Co. (St. Louis, MO, USA). All the organic solvents used for extraction studies were of analytical grade and purchased from Sigma–Aldrich, USA.

2.2. Plant Material

Hemp flour with particle size >350 μm was supplied by the Institute of Food Technology (FINS) (Novi Sad, Serbia). The hemp flour was produced by grinding hemp meal, a byproduct remaining after the cold mechanical pressing of hemp seeds. Cannabinoid-free hemp variety Helena, bred by the Institute of Field and Vegetable Crops, Novi Sad, Serbia, was grown in 2013 in the South Bačka district in the northern part of Serbia.

2.3. Extraction Procedure

A certain amount of dried hemp solid waste was mixed with 20 mL of solvent in different solid-to-liquid ratio values (1/15.2–1/5.0 g/mL), composed of varying concentrations of CD (1–40% w/v), at different temperatures (20–60 ± 1 °C) in a stoppered glass bottle. The material was subjected to extraction under stirring at 600 rpm. In all experiments, the extracts were collected at 15, 30, 45, 60, 120, and 180 min. Following extraction, samples were centrifuged in a table centrifuge (Hermle Z300K, Gosheim, Germany) at 1957× g for 10 min. The clear supernatant was stored at −20 °C until used for further analysis.
The variation of extraction yield during the extraction process was studied with various temperatures (T), CD concentrations (CCD), and solid ratio values (S/L). A central composite design was applied to determine the effects and the optimum levels of the above parameters. A three-factor, five-level central composite rotatable design 23 + star was used. This design consisted of three groups of design points, including two-level factorial design points, axial or star points, and center points. Therefore, the three selected independent variables were studied at five different levels coded as −a, −1, 0, 1, and +a (Table 1). The value for alpha (1.68) was chosen to fulfill the rotatability in the design. According to the central composite design matrix, a total of 20 experiments were required (Table 2).
The extraction yield (YTP) and the antiradical activity (AAR) were chosen as the dependent variables or responses because of their well-known respective dependency on the extraction process [21].

2.4. Determination of Total Polyphenol Yield (YTP)

The concentration of total polyphenols in the extracts was determined according to a well-established protocol [22], using the Folin-Ciocalteu methodology. Yield in total polyphenols (YTP) was expressed as mg gallic acid equivalents (GAE) per g of dry hemp flour weight after 180 min of extraction.

2.5. Determination of the Antiradical Activity (AAR)

For AAR determination, a previously described protocol was essentially used [23]. Briefly, an aliquot of 0.025 mL of sample was added to 0.975 mL DPPH● solution (100 μM in MeOH) and the absorbance was read at t = 0 and t = 30 min. Trolox™ equivalents (mM TRE) were determined from linear regression, after plotting %ΔA515 of known solutions of trolox™ against concentration, where % Δ A 515 = A 515 t = 0 A 515 t = 30 A 515 t = 0 × 100 . Results were expressed as μmol TRE per g of dry hemp solid waste weight.

2.6. Kinetic Models

In the present study, three different mathematical approaches were selected for the kinetic modelling of extraction of hemp polyphenols, namely, the Peleg’s model, the first-order kinetic model, and the second-order kinetic model. These three models were compared by fitting the experimental data obtained from extraction into each model.

Peleg’s model

Peleg’s equation [Equation (1)] is a non-exponential empirical equation proposed as [20]:
C t = t K 1 + K 2 t
where Ct is the concentration of polyphenols in the extract (mg/mL) at time t (min), K1 is Peleg’s rate constant (min mL/mg), and K2 is Peleg’s capacity constant (mL/mg). Peleg’s K1 parameter refers to the extraction rate (B0, mg/min mL) at the very beginning (t = t0) according to Equation (2):
B 0 = 1 K 1
Peleg’s capacity constant K2 refers to the maximum extraction yield, that is, the equilibrium concentration of total extracted analyte when t → ∞ (Ceq, mg/mL), as indicated in Equation (3).
C e q = 1 K 2

First-order kinetic model

According to Poojary and Passamonti [20], when we plot the concentration of extracted polyphenols in the matrix against time, the curve that describes the extraction kinetics usually shows an exponential decay. The most usual form of the first-order kinetic model is presented in Equation (4).
C t = C e q ( 1 e K A t )
where KA is the overall extraction rate constant (1/min).

Second order kinetic model

The solid-liquid extraction process can be considered as the reverse of an adsorption operation, therefore the bases of the adsorption kinetic equations can be applied to solid-liquid extraction and the second-order law was found to give the best fits for the extraction rate [24]. The general second-order model can be written as [25]:
d C t d t = K B ( C e q C t ) 2
where KB is the second-order extraction rate constant (mL/mg min). The integrated rate law for a second-order extraction under the boundary conditions t = 0 to t and Ct = 0 to Ct, can be written as an Equation (6) [26]:
C t = K B t C e q 2 1 + K B t C e q
where h is the initial extraction rate (mg/mL min) when t approaches 0:
h = K B C e q 2

2.7. Statistical Analysis

Extractions were repeated twice and all determinations were carried out in triplicate. The values obtained were averaged.
The parameters of the kinetic models were estimated by nonlinear regression. To evaluate the goodness of fit of each model, two criteria were used: the coefficient of determination, R2, which is the relative variance explained by the model with respect to the total variance, and the standard error of the estimate, SEE (Equation (8)), which is a measure of the accuracy of predictions.
S E E = ( C t , e x p C t , p r e d ) 2 N
where Ct,exp is the experimental value of the polyphenols concentration in the extract at time t, Ct,pred is the predicted concentration, and N is the number of observations.
The effect of process variables on extraction yield and antiradical activity (extraction for 180 min) and on kinetic parameters were analyzed using the statistical software MINITAB (Release 13.32, Minitab Inc., State College, PA, USA). Regression analysis was used to fit a full second order polynomial, reduced second order polynomials, and linear models to the data of each of the variables evaluated (response variables). F values for all reduced and linear models were calculated to determine if the models could be used in place of full second order polynomials to predict the response of a variable to the independent variables. The square root of mean square error (S) and the Mallows’ Cp statistic (Cp) were used as comparison criteria to compare models with different numbers of predictors.

3. Results and Discussion

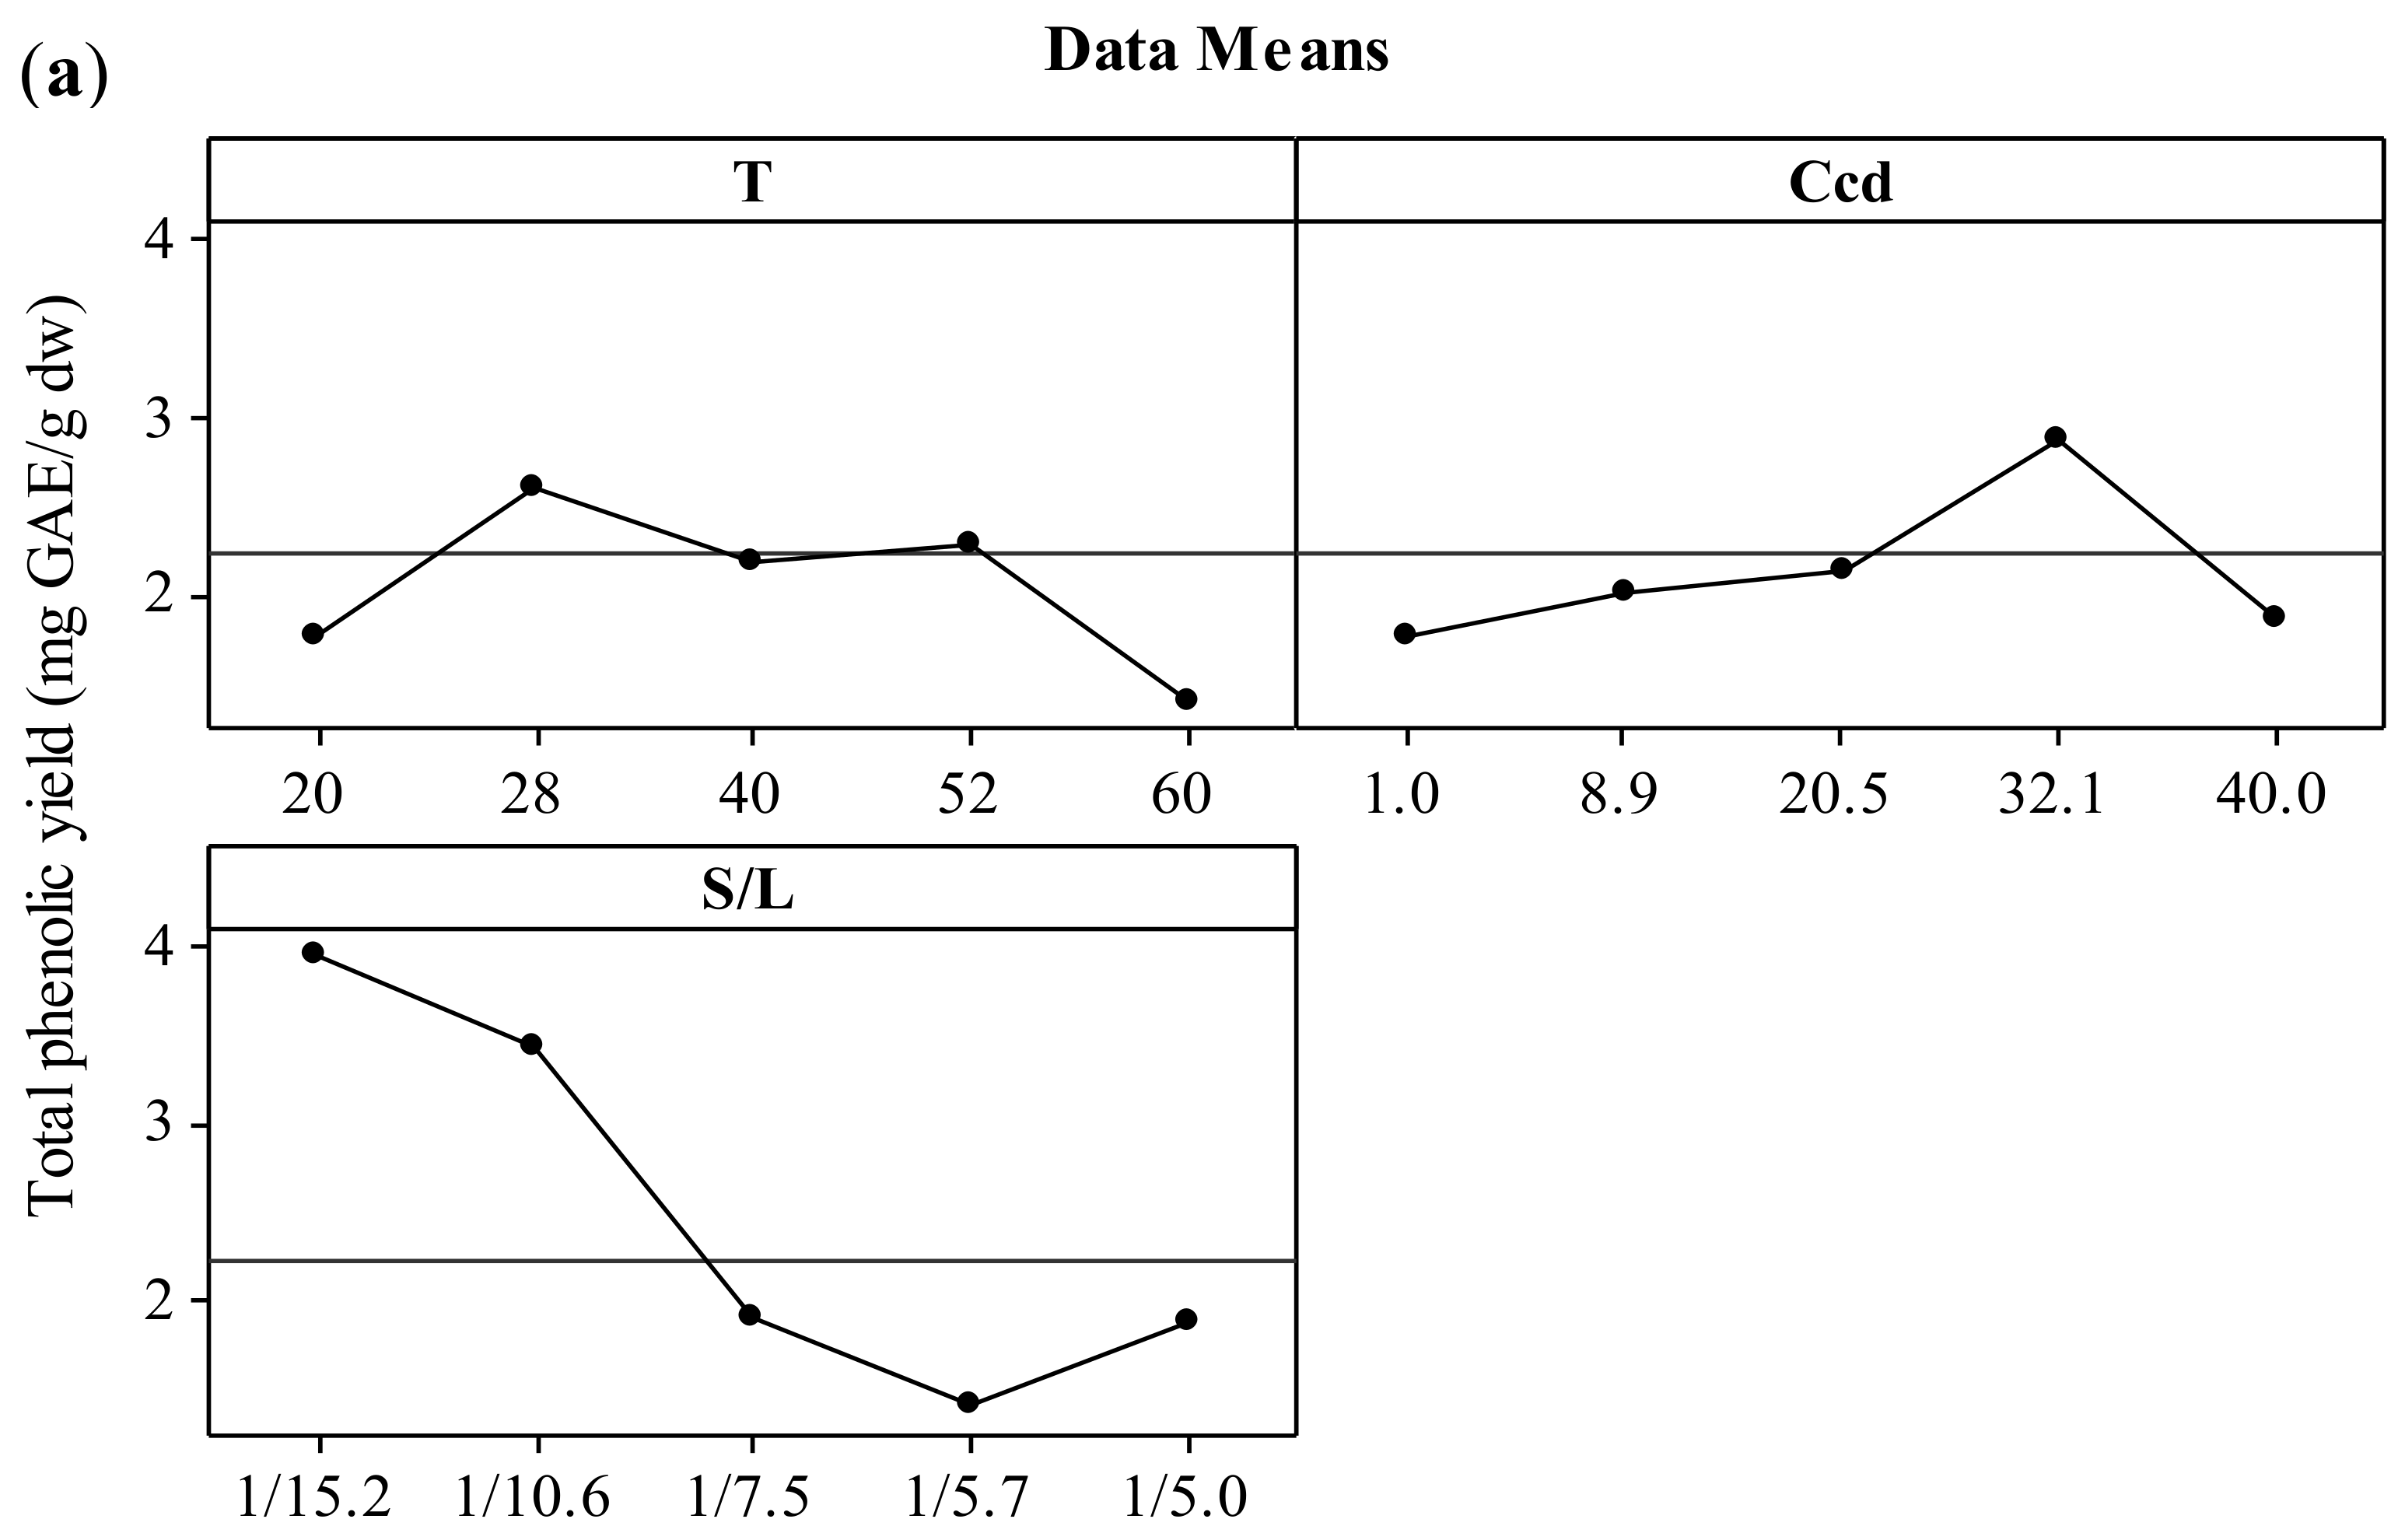
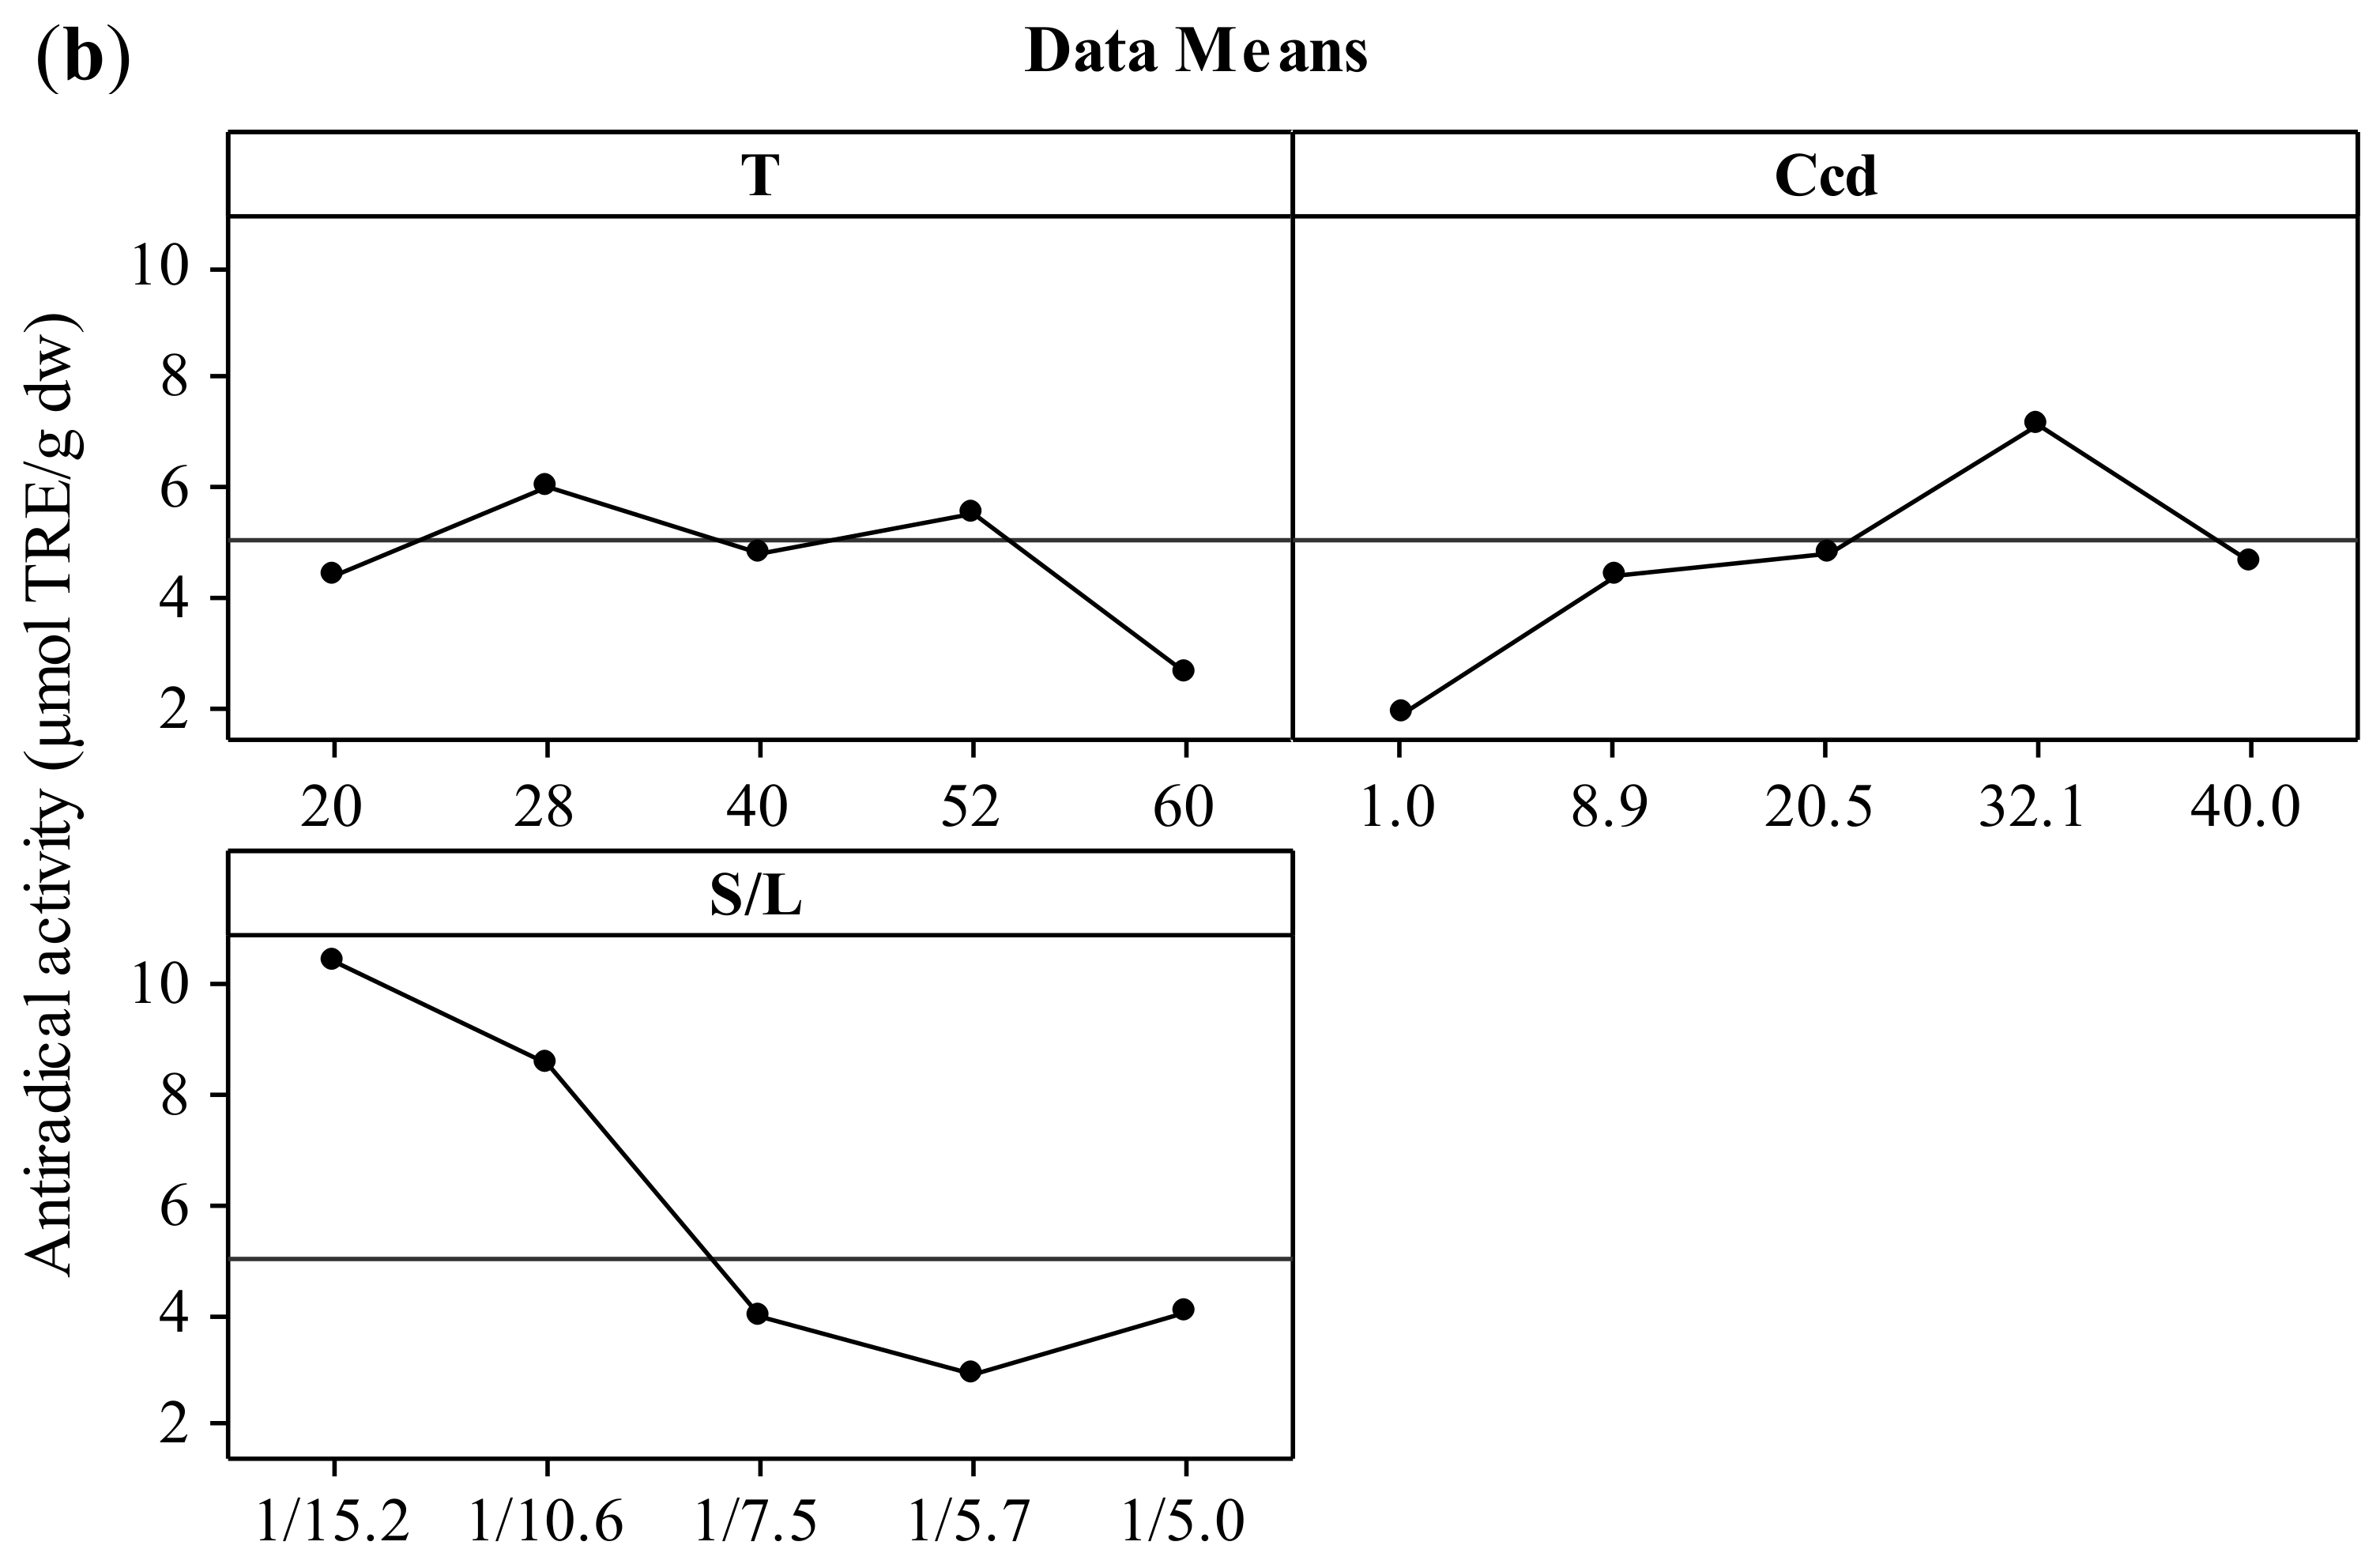
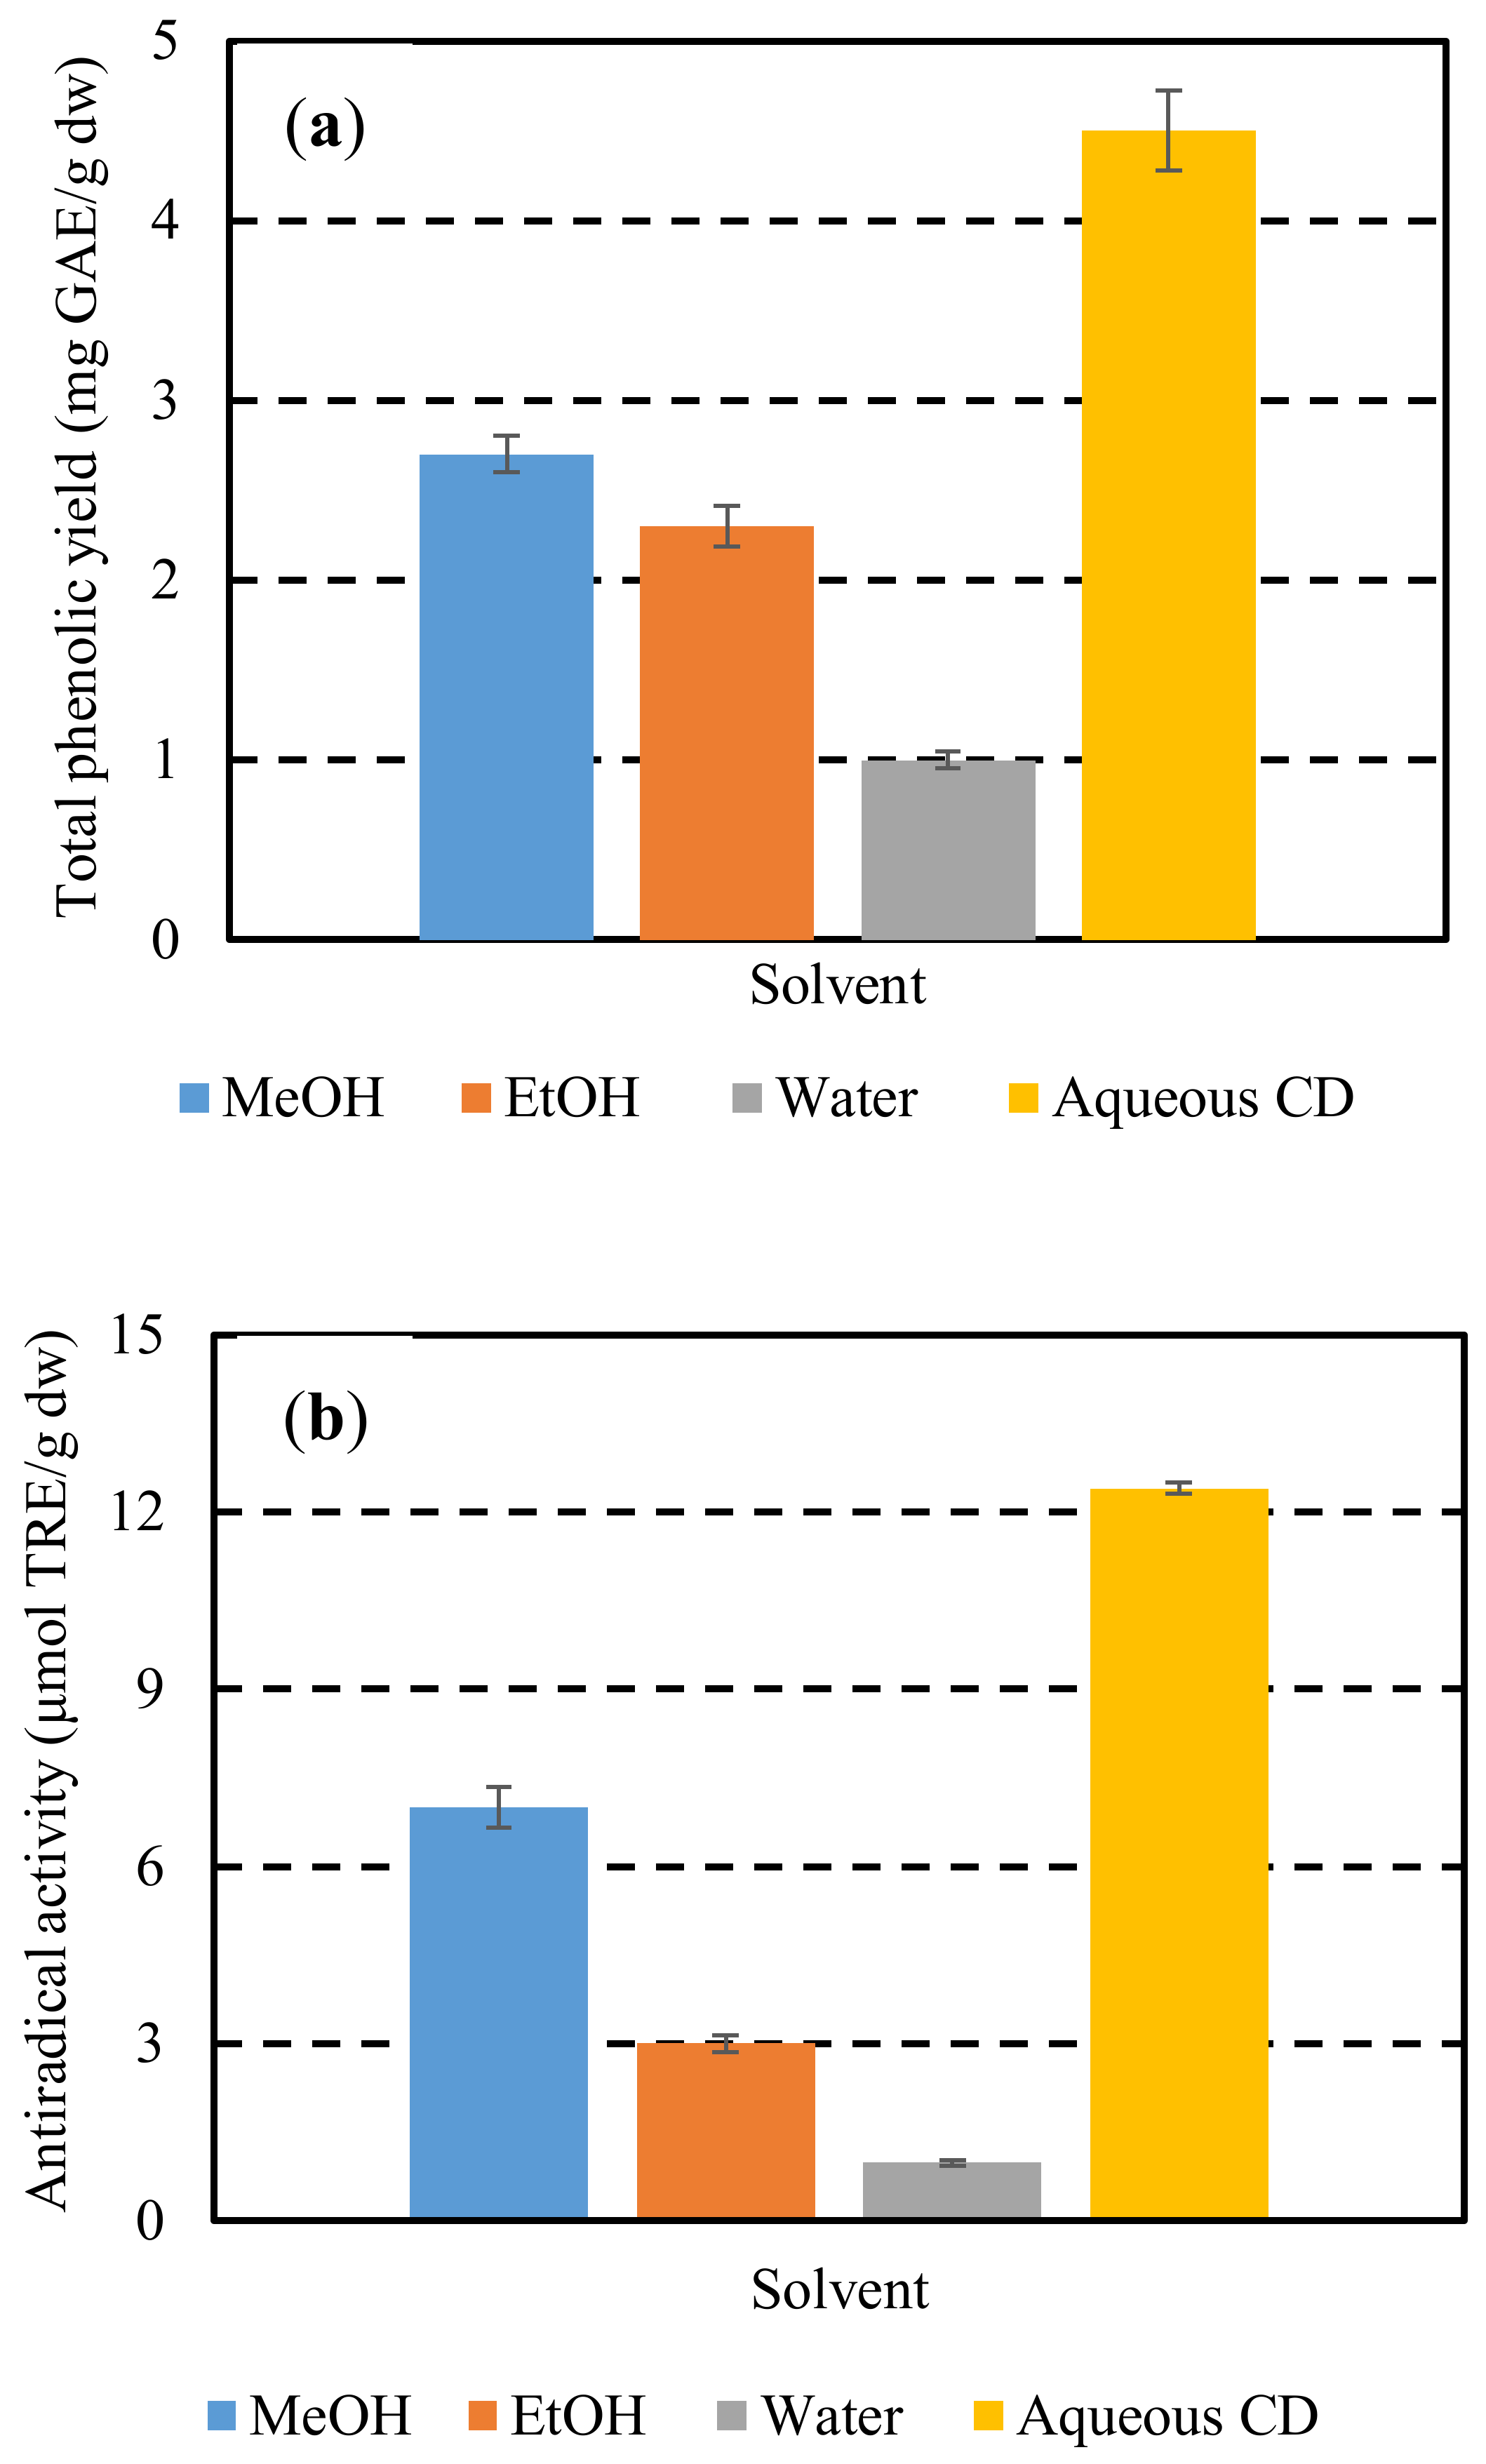
3.1. Extraction Yield

The screening carried out was designed to evaluate the effect of three selected variables, that is the solid-to-liquid ratio (S/L in g/mL), the CD concentration (CCD in % w/v), and the temperature (T in °C) on the total polyphenol yield (YTP in mg GAE/g dw) and the antiradical activity (AAR in μmol TRE/g dw). The regression coefficients were calculated and the data was fitted to second-order polynomial equations. F values for all reduced second-order polynomials and linear models with an R2 ≥ 0.70 were calculated to determine if the models could be used in place of full second order polynomials to predict the responses. The best models are presented in Equations (9) and (10). The significance of model fitting was assessed using the square coefficient of correlation (R2), the mean square error (S), the Mallows’ Cp statistic (Cp), and the F value, that is the ratio of variation explained by the model to variation left unexplained. This outcome clearly pointed to a statistically significant match between observed and predicted responses and that the models given in Equations (9) and (10) can predict the optimal experimental conditions with high reliability.
Y T P = 10.134 + 0.023 C CD 103.560 S / L 9.389 10 4 T 2 + 238.600 S / L 2 + 0.479 T S / L
Equation (9) has a R2 value of 0.754, and F, Cp, and S equal to 8.60, 2.2, and 0.567, respectively.
A A R = 33.862 0.234 T + 9.797 10 2 C CD 335.02 S / L + 798.4 S / L 2 + 1.524 T S / L
Equation (10) has a R2 value of 0.764, and F, Cp, and S equal to 9.04, 2.5, and 1.670, respectively.
Values of the independent process variables considered, as well as measured and predicted values for all responses are analytically given in Table 2.
The effect of the three independent variables (temperature, CD concentration, and solid-to-liquid ratio) on the two responses (total polyphenol yield and antiradical activity) is presented in the form of main effects plots (Figure 1). The increment of the temperature up to 52 °C leads to increased values of both YTP and AAR. This effect could be attributed to the solubilization of polyphenols that has been proven to be endothermic, hence thermodynamically favored at elevated temperatures [27,28]. According to Bonfigli et al. [29], the increment of extraction yield with temperature under conventional solvent extraction may be explained by the accelerated softening and swelling of materials and the increased solubility and diffusivity of the extracted compounds. The decrease of polyphenolic content above 52 °C may be attributed to the degradation of polyphenols. Similar effects were found by Ursache et al. [30], who studied the effect of thermal processing (50–100 °C) on the phytochemicals degradation in sea buckthorn extract. Their results showed that heating the extracts at 60 °C for 5–20 min resulted in a total polyphenol content reduction of 87 to 89%. According to Spigno, Tramelli, and De Faveri [31], the use of extraction temperatures higher than 50 °C decreases the total polyphenol yield, which is probably due to their degradation. This effect may be associated with the fact that the heat could solubilize the phenolic compounds but without breaking the covalent bonds of these compounds bound to the walls of the solid [32]. Cacace and Mazza [33] and Karacabey and Mazza [34] also observed that lower temperatures yielded higher quantities of extracted anthocyanins and ferulic acid from milled berries and grape canes, respectively. In addition, increasing extraction temperature might result in more solvent volatilization, more energy cost, and extraction of undesired materials [9]. When the results for temperatures of 28 and 52 °C were compared, no significant difference in the extraction yield was observed. Hence, 28 °C was selected as the optimum temperature with reasonable yield and lower energy requirements.
Increasing CCD up to 32.1% (w/v) led to increased values of both YTP and AAR. The optimization of CD content by implementing a central composite experimental design in the extraction medium is also crucial as the total amount of ingredients (polyphenols or not) that can form inclusion complexes with CD and thereby influence positively the extraction process cannot be estimated theoretically. This fact is corroborated by studies using single-polyphenol solutions and β-cyclodextrin, where the molecular stoichiometry observed was 1:1 [35]. Thus, increased CD enabled the entrapment of more polyphenol molecules that diffused from the solid particles, leading to higher solubilization in the liquid phase [36], hence higher YTP and AAR values. Furthermore, inclusion of polyphenols in CD has been shown in several instances to enhance the antioxidant potency [21], mainly by enhancing polyphenol solubility, although contrasting results have also been reported [37]. The optimum value for CCD was 32.1% (w/v).
The S/L ratio was assayed within a range varying from 1/15.2 to 1/5 g/mL and the optimum value was found to be 1/15.2 g/mL. It is important to optimize the solid to liquid ratio as the excess of solvent does not have a significant role on the extraction yield, which can result in wastage of the solvent and larger vessel size or decreased throughput. The effect that decreasing S/L ratio leads to increased extraction efficiency was attributed to the concentration gradient between the solid and the bulk of the liquid, which defines mass transfer and it is greater when a lower solid-to-solvent ratio is used [24]. Goula [24] and Qu, Pan, & Ma [26] also reported this trend during extraction of antioxidants from pomegranate peels and marc, respectively. However, according to Prasad et al. [38], with further decrease in solid-to-liquid ratio, a decrease in total extracted compounds may be observed. If the solution is very dilute, an increased quantity of solvent would not lead to a sufficient increase in the concentration gradient and the increase in extraction yield would be limited [9]. Thus, the optimum value of solid to solvent ratio is specific to the system under investigation and needs to be established experimentally. In the present work, based on the obtained results, the optimum ratio of dried hemp solid waste to solvent was selected at 1/15.2 g/mL.
To further demonstrate the efficiency of the CD in the polyphenol extraction, extraction of hemp waste polyphenols was also comparatively studied using conventional solvents such as methanol, ethanol, and water. The extractions performed under continuous stirring at 600 rpm, for 180 min, at a solids-to-solvent ratio of 1/15 g/mL and an extraction temperature of 28 °C (optimum conditions of extraction with CD at optimum concentration) (Figure 2). Extraction with CD at optimum conditions afforded an antiradical activity of 12.4 μmol TRE/g dw, which was higher than those achieved with methanol, ethanol, and water by 43, 76, and 90%, respectively.
Similar results obtained for total phenolis yield. Albehari et al. [39] also showed that β-cyclodextrin as extraction solvent resulted in increased extraction yields, indicating that the extraction of polyphenols could be effectively enhanced by cyclodextrins. The ultrasound-assisted extraction of resveratrol and other polyphenols from the milled roots of Polygonum cuspidatum has been efficiently carried out in a water solution of β-cyclodextrin (1.5%) [40]. According to Mantegna et al. [41], the selective inclusion properties of cyclodextrins toward phenolic stilbenes gave a much cleaner analytical extract profile if compared with that obtained with methanol. Thanks to polyphenol encapsulation, this extract showed excellent water dispersibility, higher stability and antioxidant power. Extraction using a water solution of β-cyclodextrin can fulfill almost all the principles as defined by Chemat, Vian, and Cravotto [40] to be considered as a green process e.g., applying environmentally friendly solvents, reducing the energy consumption, and producing the non-denatured extract without contaminants.

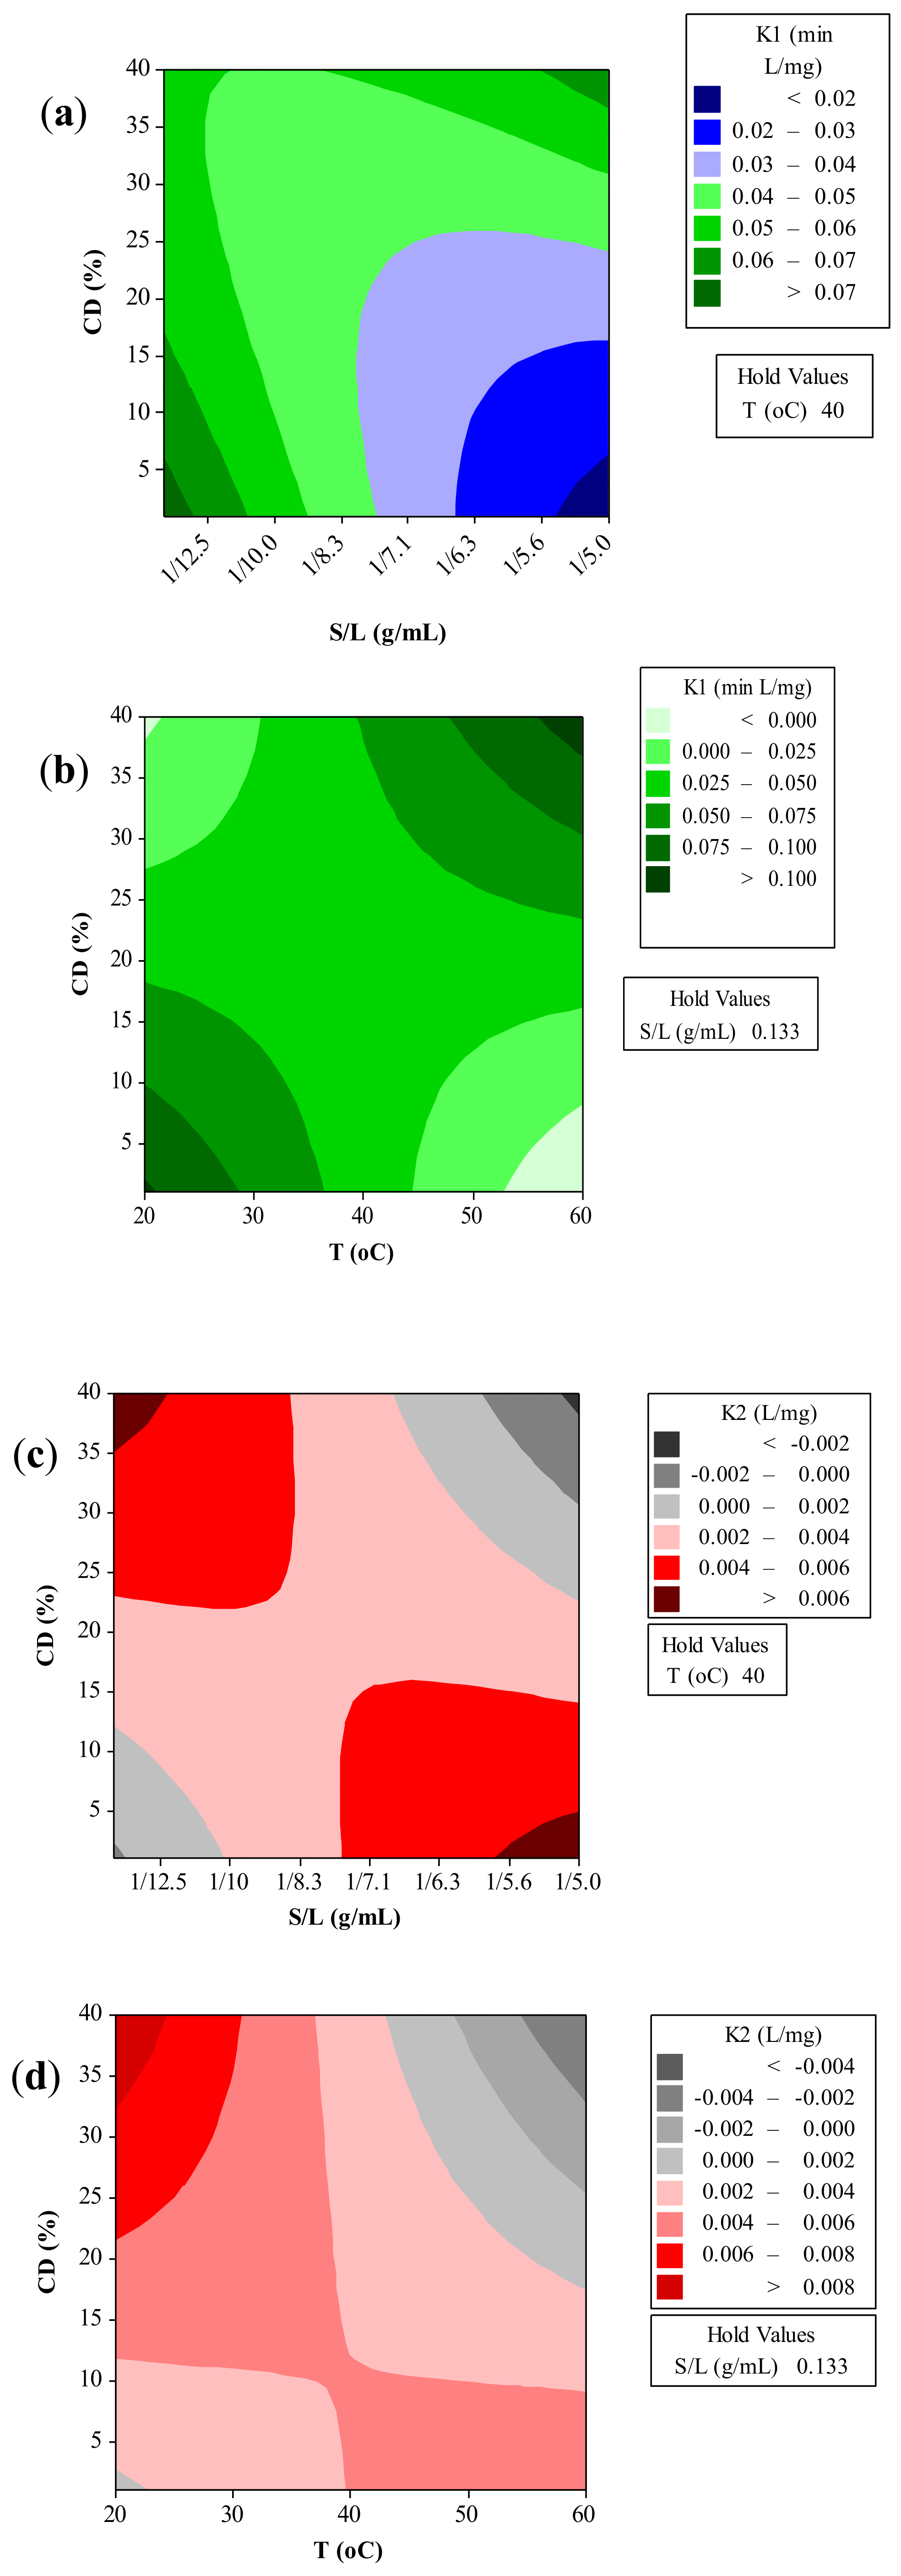
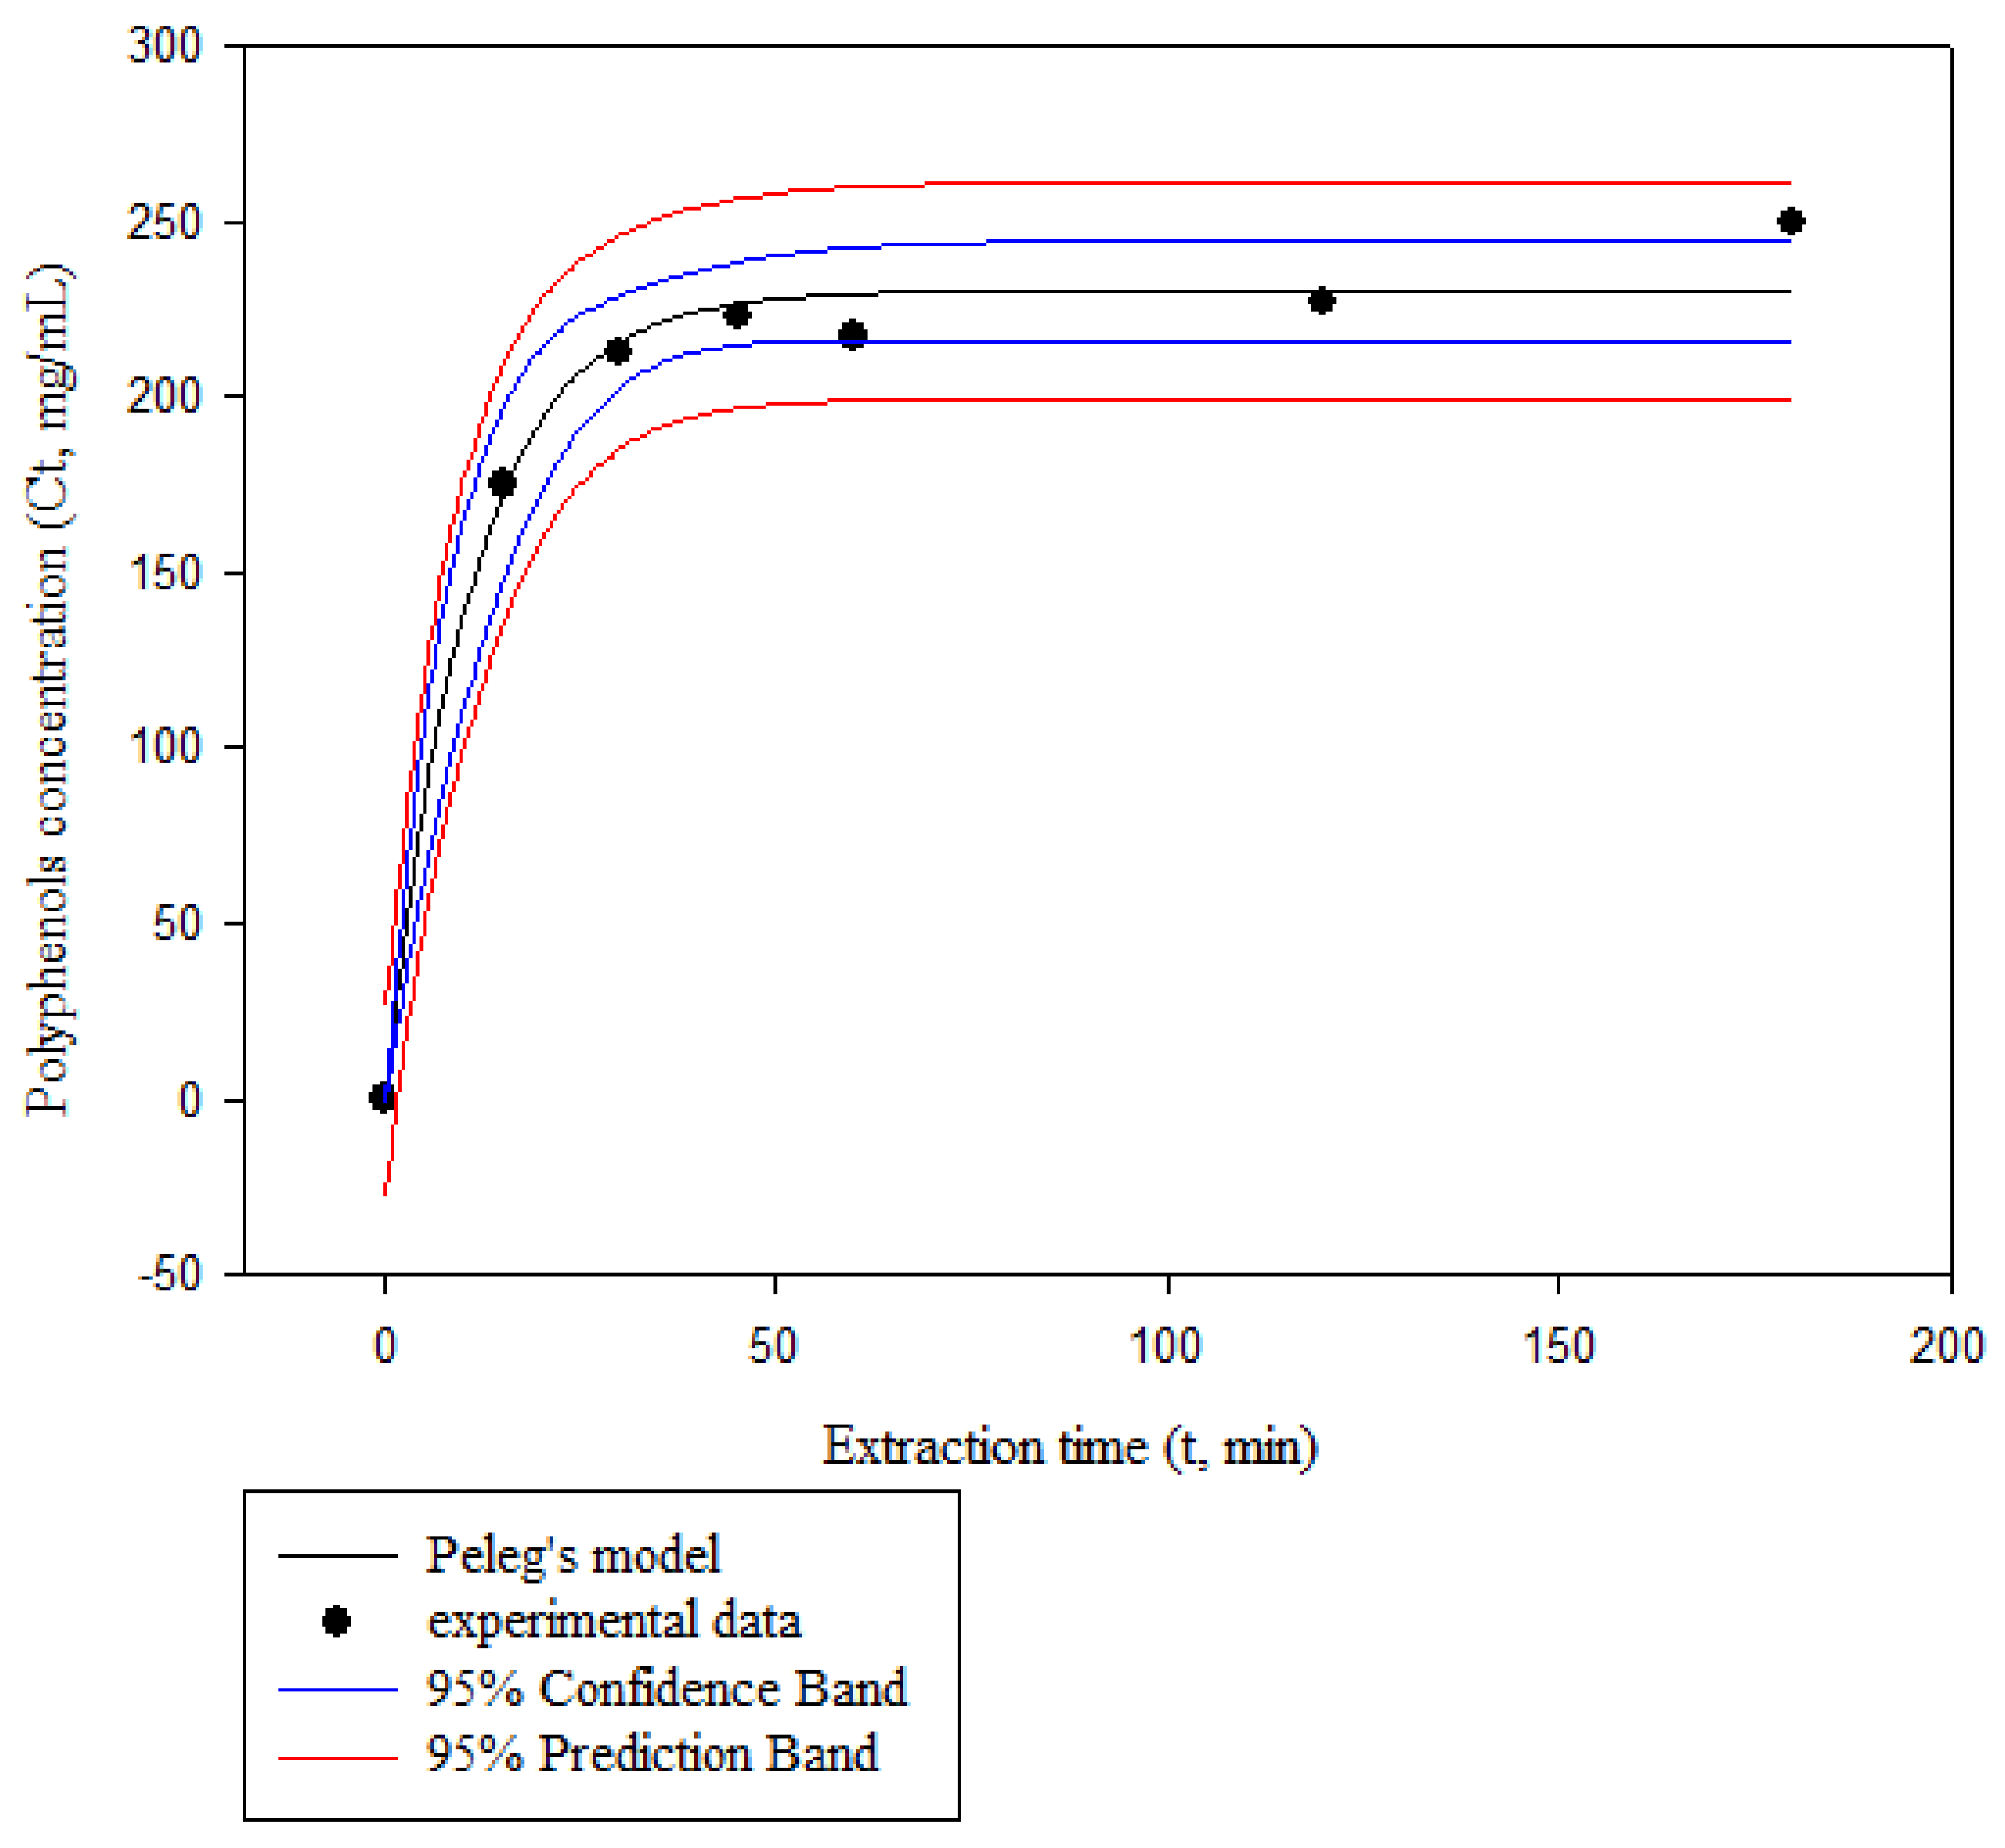
3.2. Extraction Kinetics

Different kinetic models were employed to fit with the experimental data. The highest values of R2 and lowest values of SEE were chosen for goodness of fit. Table 3 presents the R2 and SEE values for the kinetic models. Among these, the Peleg’s model fits the best with experimental values showing the highest average values of R2 (0.899–0.993) and the lowest average values of SEE (7.175–34.917). The applicability of Peleg’s equation on food materials has been demonstrated extensively [20].
The kinetic parameters of the Peleg’s model at different extraction conditions are presented in Figure 3. It should be noted that a lower K1 value in Equation (1) implies a faster rate of the process, whilst the lower K2 value indicates maximum yield [42]. As it can be seen, the kinetic parameters decreased with the increase of temperature as expected based on the experimental results. The extraction rate and capacity decreased with a decrease in solid-to-liquid ratio. According to Rakotondramasy-Rabesiaka et al. [43], who studied the extraction of protopine from Fumaria officinalis L., when solid/liquid ratio is small the quantity of protopine is small.
Figure 4 presents the comparison of predicted and experimental values of polyphenols concentration in the extract for the Peleg’s model at an extraction temperature of 60 °C, a CD concentration of 20.5%, and a solid-to-liquid ratio of 1/7.5 g/mL. The figure presents also the confidence band (CB) and prediction band (PB) for the polyphenols concentration at the solvent phase against time. It is noted that similar trends were observed for all experiments. The PB is the region where 95% of the experimental data points are expected to be and it is observed that all obtained observations fall within it. Likewise, the CB is the region where 95% of the regression lines are expected to be, and contain the experimental values for all the observations reported here [28].
It was also observed that, for all experiments, the polyphenols concentration increased asymptotically, tending to an equilibrium concentration. About 80% of polyphenols were extracted in the first 30 min. These values were close to the ones reported by many researchers for the extraction of antioxidants. The mass transfer mechanism of bioactive compounds from the interior of plant materials to the bulk of the liquid extract can be simply explained with two stages, involving the rapid washing of free target solute from the plant particles and slow diffusion of solute through plant material; the latter one is usually the rate limiting step of the overall process. According to Goula [24], extraction presents two stages: the first stage, which is characterized by a rapid rate, involves the penetration of the solvent into the cellular structure followed by the dissolution of soluble constituents in the solvent, whereas the second stage involves the external diffusion of soluble constituents through the porous structure of the residual solids and its transfer from the solution in contact with the particles to the bulk of the solution. In addition, as the solid cell walls ruptured, impurities such as insoluble substances, are suspended in the extract, lowering the solvent’s permeability into cell structures [44]. Furthermore, target components also re-adsorb into the ruptured tissue particles due to their relatively large specific surface areas, lowering extraction yields [45].
Qu et al. [26], who studied the extraction of antioxidants from pomegranate marc, fitted the relationships between kinetic parameters and processing factors (particle size, water/sample ratio, and temperature) by linear, power or second-order polynomial functions. However, they developed a different model for each factor. In this work, multiple regression analysis was used to develop equations predicting the effect of all extraction factors simultaneously. The effect of extraction variables on Peleg’s model constants can be expressed by Equations (11) and (12).
K 1 = 0.0404 0.000106 T 0.020 S / L + 0.000315 C CD 0.000006 T 2 0.000006 C CD 2 + 0.980 S / L 2 + 0.000064 T C CD 0.0022 T S / L 0.0170 C CD S / L ( R 2   =   0.897 )
K 2 = 0.00714 0.000103 T + 0.0122 S / L 0.000004 C CD 0.000001 C CD 2 0.078 S / L 2 + 0.000301 T S / L 0.000254 C CD S / L ( R 2   =   0.897 )
Substituting Equations (11) and (12) into Equation (1), a kinetic model for predicting polyphenols extraction from hemp waste can be obtained. Even though the empirical models in (11) and (12) cannot account for the phenomena governing extraction processes, they could be used to determine the effects of temperature, CD concentration, and solid-to-liquid ratio on the polyphenols extraction capacity [24]. According to Goula, Chasekioglou, and Lazarides [46], mechanistic models provide more from a basic understanding of a given system, a greater basis for extrapolation and a representation of a response function that is more precise than one attained empirically. In the food industry, on the other hand, if it is desired to optimize a given unit process, the process of developing an empirical model would most likely be more economically feasible. Such models may be more limiting than mechanistic models. However, for the purposes of the manufacturer, the main concern is narrowing the range of processing variables to produce the best product possible [47].

4. Conclusions

The study presented herein showed for the first time that the usage of aqueous solutions of 2-hydroxypropyl-β-cyclodextrin might be a very effective solvent system regarding the extraction of antioxidant polyphenols from hemp solid waste, acting as a simultaneous extraction/inclusion system. The experimental design based on a response surface optimization methodology permitted the determination of the optimal set of conditions, which enabled the generation of extracts with enhanced antioxidant properties. The results indicated that the recovery yield in total polyphenols, as well as the antioxidant activity observed, may surpass the values reported in the literature for other agri-food waste extracts and in this respect hemp solid waste may be considered as a very rich source of functional constituents, with a high potential in developing bioactive formulations for the food, pharmaceutical, and cosmetics industries.

Author Contributions

I. Mourtzinos, laboratory experiments, experimental design, data handling; N. Menexis, laboratory experiments; D. Iakovidis, laboratory experiments; D.P. Makris, experimental design, data handling, statistics, manuscript editing; A. Goula data interpretation, manuscript editing.

Conflict of Interest

The authors declare no conflict of interest.

Nomenclature

AARantiradical activity (μmol TRE/g dw)
Ctconcentration of polyphenols in the extract (mg/mL)
C0polyphenols concentration (mg/mL) at time t = 0
CpMallows’ Cp statistic
CCDhydroxypropyl-β-cyclodextrin concentration (%, w/v)
CTPtotal polyphenol concentration (mg GAE/L)
K1Peleg’s rate constant (min mL/mg)
K2Peleg’s capacity constant (mL/mg).
R2square coefficient of correlation
S/Lsolid-to-liquid ratio
Smean square error
Ttemperature (°C)
YTPyield in total polyphenols (mg GAE/g dw)
Abbreviations
CDhydroxypropyl-β-cyclodextrin
DPPH•2,2-diphenyl-picrylhydrazyl
GAEgallic acid equivalents
TREtrolox equivalents

References

  1. Previtera, L.; Fucci, G.; De Marco, A.; Romanucci, V.; Di Fabio, G.; Zarrelli, A. Chemical and organoleptic characteristics of tomato purée enriched with lyophilized tomato pomace. J. Sci. Food Agric. 2016, 96, 1953–1958. [Google Scholar] [CrossRef] [PubMed]
  2. Li, Y.; Fabiano-Tixier, A.S.; Tomao, V.; Cravotto, G.; Chemat, F. Green ultrasound-assisted extraction of carotenoids based on the bio-refinery concept using sunflower oil as an alternative solvent. Ultrason. Sonochem. 2013, 20, 12–18. [Google Scholar] [CrossRef] [PubMed]
  3. Galanakis, C.M. Recovery of high added-value components from food wastes: Conventional, emerging technologies and commercialized applications. Trends Food Sci. Technol. 2012, 26, 68–87. [Google Scholar] [CrossRef]
  4. Di Fabio, G.; Malgieri, G.; Isernia, C.; D’Onofrio, J.; Gaglione, M.; Messere, A.; Zarrelli, A.; De Napoli, L. A novel synthetic strategy for monosubstituted cyclodextrin derivatives. Chem. Commun. 2012, 48, 3875–3877. [Google Scholar] [CrossRef] [PubMed]
  5. Mourtzinos, I.; Anastasopoulou, E.; Petrou, A.; Grigorakis, S.; Makris, D.; Biliaderis, C.G. Optimization of a green extraction method for the recovery of polyphenols from olive leaf using cyclodextrins and glycerin as co-solvents. J. Food Sci. Tech. 2016, 53, 3939–3947. [Google Scholar] [CrossRef] [PubMed]
  6. Diamanti, A.C.; Igoumenidis, P.E.; Mourtzinos, I.; Yannakopoulou, K.; Karathanos, V.T. Green extraction of polyphenols from whole pomegranate fruit using cyclodextrins. Food Chem. 2017, 214, 61–66. [Google Scholar] [CrossRef] [PubMed]
  7. Oreopoulou, V.; Tzia, C. Utilization of plant by-products for the recovery of proteins, dietary fibers, antioxidants, and colorants. In Utilization of By-Products and Treatment of Waste in the Food Industry; Oreopoulou, V., Russ, W., Eds.; Springer Science Business Media, LLC: New York, NY, USA, 2007; pp. 209–232. [Google Scholar]
  8. Pojić, M.; Mišan, A.; Sakač, M.; Dapčević, H.T.; Šarić, B.; Milovanović, I.; Hadnađev, M. Characterization of byproducts originating from hemp oil processing. J. Agric. Food Chem. 2014, 62, 12436–12442. [Google Scholar] [CrossRef] [PubMed]
  9. Shirsath, S.R.; Sable, S.S.; Gaikwad, S.G.; Sonawane, S.H.; Saini, D.R.; Gogate, P.R. Intensification of extraction of Curcumin from curcuma amada using ultrasound assisted approach: Effect of different operating parameters. Ultrason. Sonochem. 2017, 38, 437–445. [Google Scholar] [CrossRef] [PubMed]
  10. Charpe, T.W.; Rathod, V.K. Extraction of glycyrrhizic acid from licorice root using ultrasound: Process intensification studies. Chem. Eng. Process. Process Intensif. 2012, 54, 37–41. [Google Scholar] [CrossRef]
  11. D’Alessandro, L.G.; Dimitrov, K.; Vauchel, P.; Nikov, I. Kinetics of ultrasound assisted extraction of anthocyanins from Aronia melanocarpa (black chokeberry) wastes. Chem. Eng. Res. Des. 2014, 92, 1818–1826. [Google Scholar] [CrossRef]
  12. Yue, L.; Zhang, F.; Wang, Z. Ultrasound-assisted extraction of capsaicin from red peppers and mathematical modeling. Sep. Sci. Technol. 2012, 47, 124–130. [Google Scholar] [CrossRef]
  13. Tao, Y.; Zhang, Z.; Sun, D.W. Kinetic modeling of ultrasound-assisted extraction of phenolic compounds from grape marc: Influence of Acoustic Energy Density and Temperature. Ultrason. Sonochem. 2014, 21, 1461–1469. [Google Scholar] [CrossRef] [PubMed]
  14. Tao, Y.; Zhang, Z.; Sun, D.W. Experimental and modeling studies of ultrasound assisted release of phenolics from oak chips into model wine. Ultrason. Sonochem. 2014, 21, 1839–1848. [Google Scholar] [CrossRef] [PubMed]
  15. Milić, P.S.; Rajković, K.M.; Stamenković, O.S.; Veljkovic, V.B. Kinetic modeling and optimization of maceration and ultrasound extraction of resinoid from the aerial parts of white lady’s bedstraw (Galium mollugo L.). Ultrason. Sonochem. 2013, 20, 525–534. [Google Scholar] [CrossRef] [PubMed]
  16. González-Centeno, M.R.; Comas-Serra, F.; Femenia, A.; Rosselló, C.; Simal, S. Effect of power ultrasound application on aqueous extraction of phenolic compounds and antioxidant capacity from grape pomace (Vitis vinifera L.): Experimental kinetics and modeling. Ultrason. Sonochem. 2015, 22, 506–514. [Google Scholar] [CrossRef] [PubMed]
  17. Jokic, S.; Velic, D.; Bilic, M.; Bucic-Kojic, A.; Planinic, M.; Tomas, S. Modeling of the process of solid–liquid extraction of total polyphenols from soybeans. Czech J. Food Sci. 2010, 28, 206–212. [Google Scholar] [CrossRef]
  18. Karacabey, E.; Bayindirli, L.; Artik, N.; Mazza, G. Modeling solid–liquid extraction kinetics of trans-resveratrol and trans-ε-viniferin from grape cane. J. Food Process Eng. 2013, 36, 103–112. [Google Scholar] [CrossRef]
  19. Vetal, M.D.; Lade, V.G.; Rathod, V.K. Extraction of ursolic acid from Ocimum sanctum by ultrasound: Process intensification and kinetic studies. Chem. Eng. Process. 2013, 69, 24–30. [Google Scholar] [CrossRef]
  20. Poojary, M.M.; Passamonti, P. Extraction of lycopene from tomato processing waste: Kinetics and modelling. Food Chem. 2015, 173, 943–950. [Google Scholar] [CrossRef] [PubMed]
  21. Kyriakidou, K.; Mourtzinos, Ι.; Costas, G.; Biliaderis, C.G.; Makris, D.P. Optimization of a green extraction/inclusion complex formation process to recover antioxidant polyphenols from oak acorn husks (Quercus robur) using aqueous 2-hydroxypropyl-β-cyclodextrin/glycerol mixtures. Environments 2016, 3, 3. [Google Scholar] [CrossRef]
  22. Paleologou, I.; Vasiliou, A.; Grigorakis, S.; Makris, D.P. Optimisation of a green ultrasound-assisted extraction process for potato peel (Solanum tuberosum) polyphenols using bio-solvents and response surface methodology. Biomass Convers. Biorefin. 2016, 6, 289–299. [Google Scholar] [CrossRef]
  23. Bassil, D.; Makris, D.P.; Kefalas, P. Oxidation of caffeic acid in the presence of L-cysteine: Isolation of 2-S-cysteinylcaffeic acid and evaluation of its antioxidant properties. Food Res. Int. 2005, 38, 395–402. [Google Scholar] [CrossRef]
  24. Goula, A.M. Ultrasound-assisted extraction of pomegranate seed oil—Kinetic modeling. J. Food Eng. 2013, 117, 492–498. [Google Scholar] [CrossRef]
  25. Pan, Z.; Qu, W.; Ma, H.; Atungulu, G.G.; McHugh, T.H. Continuous and pulsed ultrasound-assisted extractions of antioxidants from pomegranate peel. Ultrason. Sonochem. 2012, 19, 365–372. [Google Scholar] [CrossRef] [PubMed]
  26. Qu, W.; Pan, Z.; Ma, H. Extraction modeling and activities of antioxidants from pomegranate marc. J. Food Eng. 2010, 99, 16–23. [Google Scholar] [CrossRef]
  27. Kiassos, E.; Mylonaki, S.; Makris, D.P.; Kefalas, P. Implementation of response surface methodology to optimise extraction of onion (Allium cepa) solid waste phenolics. Innov. Food Sci. Emerg. Technol. 2009, 10, 246–252. [Google Scholar] [CrossRef]
  28. Katsampa, P.; Valsamedou, E.; Grigorakis, S.; Makris, D.P. A green ultrasound-assisted extraction process for the recovery of antioxidant polyphenols and pigments from onion solid wastes using Box–Behnken experimental design and kinetics. Ind. Crops Prod. 2015, 77, 535–543. [Google Scholar] [CrossRef]
  29. Bonfigli, M.; Godoy, E.; Reinheimer, M.A.; Scenna, N.G. Comparison between conventional and ultrasound-assisted techniques for extraction of anthocyanins from grape pomace. Experimental results and mathematical modeling. J. Food Eng. 2017, 207, 56–72. [Google Scholar] [CrossRef]
  30. Ursache, F.-M.; Ghinea, I.O.; Turturică, M.; Aprodu, I.; Râpeanu, G.; Stănciuc, N. Phytochemicals content and antioxidant properties of sea buckthorn (Hippophae rhamnoides L.) as affected by heat treatment—Quantitative spectroscopic and kinetic approaches. Food Chem. 2017, 233, 442–449. [Google Scholar] [CrossRef] [PubMed]
  31. Spigno, G.; Tramelli, L.; De Faveri, D.M. Effects of extraction time, temperature and solvent on concentration and antioxidant activity of grape marc phenolics. J. Food Eng. 2007, 81, 200–208. [Google Scholar] [CrossRef]
  32. Kim, S.Y.; Jeong, S.M.; Park, W.P.; Nam, K.C.; Ahn, D.U.; Lee, C. Effect of heating conditions of grape seeds on the antioxidant activity of grape seed extracts. Food Chem. 2006, 97, 472–479. [Google Scholar] [CrossRef]
  33. Cacace, J.E.; Mazza, G. Mass transfer process during extraction of phenolic compounds from milled berries. J. Food Eng. 2003, 59, 379–389. [Google Scholar] [CrossRef]
  34. Karacabey, E.; Mazza, G. Optimization of solid–liquid extraction of resveratrol and other phenolic compounds from milled grape canes (Vitis vinifera). J. Agric. Food Chem. 2008, 56, 6318–6325. [Google Scholar] [CrossRef] [PubMed]
  35. Karathanos, V.T.; Mourtzinos, I.; Yannakopoulou, K.; Andrikopoulos, N.K. Study of the solubility, antioxidant activity and structure of inclusion complex of vanillin with β-cyclodextrin. Food Chem. 2007, 101, 652–658. [Google Scholar] [CrossRef]
  36. Korompokis, K.; Igoumenidis, P.E.; Mourtzinos, I.; Karathanos, V.T. Green extraction and simultaneous inclusion complex formation of Sideritis scardica polyphenols. Int. Food Res. J. 2017, 24, 1233–1238. [Google Scholar]
  37. Shehata, E.; Grigorakis, S.; Loupassaki, S.; Makris, D.P. Extraction optimisation using water/glycerol for the efficient recovery of polyphenolic antioxidants from two Artemisia species. Sep. Purif. Technol. 2015, 149, 462–469. [Google Scholar] [CrossRef]
  38. Prasad, K.N.; Hassan, F.A.; Yang, B.; Kong, K.W.; Ramanan, R.N.; Azlan, A.; Ismail, A. Response surface optimization for the extraction of phenolic compounds and antioxidant capacities of underutilised Mangifera pajang Kosterm peels. Food Chem. 2011, 128, 1121–1127. [Google Scholar] [CrossRef] [Green Version]
  39. Albahari, P.; Jug, M.; Radić, K.; Jurmanović, S.; Brnčić, M.; Brnčić, S.R.; Vitali Čepo, D. Characterization of olive pomace extract obtained by cyclodextrin-enhanced pulsed ultrasound assisted extraction. Food Sci. Technol. 2018, 92, 22–31. [Google Scholar] [CrossRef]
  40. Chemat, F.; Vian, M.A.; Cravotto, G. Green extraction of natural products: Concept and principles. Int. J. Mol. Sci. 2012, 13, 8615–8627. [Google Scholar] [CrossRef] [PubMed]
  41. Mantegna, S.; Binello, A.; Boffa, L.; Giorgis, M.; Cena, C.; Cravotto, G. A one-pot ultrasound-assisted water extraction/cyclodextrin encapsulation of resveratrol from Polygonum cuspidatum. Food Chem. 2012, 130, 746–750. [Google Scholar] [CrossRef]
  42. Ghafoor, M.; Misra, N.N.; Mahadevan, K.; Tiwari, B.K. Ultrasound assisted hydration of navy beans (Phaseolus vulgaris). Ultrason. Sonochem. 2014, 21, 409–414. [Google Scholar] [CrossRef] [PubMed]
  43. Rakotondramasy-Rabesiaka, L.; Havet, J.-L.; Porte, C.; Fauduet, H. Solid–liquid extraction of protopine from Fumaria officinalis L.-Kinetic modelling of influential parameters. Ind. Crops Prod. 2009, 29, 516–523. [Google Scholar] [CrossRef]
  44. Liu, G.; Xu, X.; Hao, Q.; Gao, Y. Supercritical CO2 extraction optimization of pomegranate (Punica granatum L.) seed oil using response surface methodology. Lebensm. Wiss. Technol. 2009, 42, 1491–1495. [Google Scholar] [CrossRef]
  45. Dong, J.E.; Liu, Y.B.; Liang, Z.S.; Wang, W.L. Investigation on ultrasound assisted extraction of salvianolic acid B from Salvia miltiorrhiza root. Ultrason. Sonochem. 2010, 17, 61–65. [Google Scholar] [CrossRef] [PubMed]
  46. Goula, M.; Chasekioglou, N.; Lazarides, H.N. Drying and shrinkage kinetics of solid waste of olive oil processing. Dry. Technol. 2015, 33, 1728–1738. [Google Scholar] [CrossRef]
  47. Goula, A.M.; Ververi, M.; Adamopoulou, A.; Kaderides, K. Green ultrasound-assisted extraction of carotenoids from pomegranate wastes using vegetable oils. Ultrason. Sonochemi. 2017, 34, 821–830. [Google Scholar] [CrossRef] [PubMed]
Figure 1. Main effects plots illustrating the effect of extraction temperature (T), CD concentration (CCD), and solid-to-liquid ratio (S/L) on the extraction yield (YTP) (a) and the antiradical activity (AAR) (b) during extraction of polyphenols from hemp waste for 180 min.
Recycling 03 00015 g001aRecycling 03 00015 g001b
Figure 2. Total phenolic yields (YTP) (a) and antiradical activities (AAR) (b) obtained by extraction with methanol, ethanol, water, and aqueous solutions of CD at optimum conditions.
Recycling 03 00015 g002
Figure 3. Contour plots illustrating the effect of extraction temperature (T), CD concentration (CCD), and solid-to-liquid ratio (S/L) on the kinetic parameters K1 (a, b) and K2 (c, d) of the Peleg’s model.
Recycling 03 00015 g003
Figure 4. Experimental and predicted by the Peleg’s model values of polyphenols concentration in the extract at an extraction temperature of 60 °C, a CD concentration of 20.5% w/v, and a solid-to-liquid ratio of 1/7.5 g/mL.
Recycling 03 00015 g004
Table 1. Experimental values and coded levels of the independent variables used for the central composite design.
Independent VariableCoded Variable Level
−1.68−1.000+1.00+1.68
T (°C)2028405260
CCD (%, w/v)18.920.532.140
S/L (g/mL)1/15.21/10.61/7.51/5.71/5.0
Table 2. Measured and predicted values of extraction yield (YTP) and antiradical activity (AAR) (extraction for 180 min) determined for the individual design points.
Design PointIndependent VariablesResponses
YTP (mg GAE/g dw)AAR (μmol TRE/g dw)
T (°C)CCD (%, w/v)S/L (g/mL)MeasuredPredictedMeasuredPredicted
12020.51/7.51.781.904.384.78
2528.91/10.62.662.527.015.68
34020.51/5.01.891.714.063.63
4401.01/7.51.761.601.902.25
54020.51/7.52.242.053.974.16
64020.51/7.51.762.054.204.16
72832.11/5.71.471.632.813.76
85232.11/10.63.373.068.227.95
9288.91/5.71.181.092.121.49
104020.51/15.21.812.053.434.16
114020.51/7.53.954.5210.4311.79
124020.51/7.52.232.054.474.16
134040.01/7.51.862.504.646.07
144020.51/10.61.002.051.894.16
152832.11/5.74.513.7912.4010.17
165232.11/5.72.141.825.144.50
17528.91/10.60.941.291.722.23
18288.91/7.53.233.266.817.90
194020.51/7.53.272.058.514.16
206020.51/7.51.401.452.613.55
Table 3. Statistical parameters of the kinetic models for extraction of polyphenols from hemp waste.
A/APeleg’s ModelFirst-Order Kinetic ModelSecond-Order Kinetic Model
R2SEER2SEER2SEE
10.9909.2270.96915.8980.92924.134
20.9937.7370.98710.6480.93124.435
30.97920.7370.96028.4120.86353.006
40.95917.5490.93322.3890.90127.315
50.89934.9170.87538.7610.74155.937
60.9899.3640.96915.5180.93721.891
70.98212.5760.96118.6350.94222.680
80.95226.1990.93729.9660.66469.036
90.97113.7690.95217.7880.88227.912
100.9889.5580.96117.3200.76941.936
110.95820.5670.96020.2440.73751.557
120.98513.5060.96919.5500.73557.516
130.97515.8770.97216.5980.84139.876
140.9827.1750.9856.7270.9817.385
150.96527.4240.92639.8310.79566.248
160.98516.9360.95230.1730.86151.337
170.94712.9780.92016.0150.90217.707
180.95721.8660.91530.5520.82044.596
190.97823.5390.95235.2430.80770.339
200.96912.0500.94915.5560.85925.782
Average0.97016.6780.95022.2910.84540.031

