Sustainability Assessment of Waste Management System for Mexico City (Mexico)—Based on Analytic Hierarchy Process


1
School of Computing Science, Business Administration, Economics, and Law (Faculty II), Carl von Ossietzky University of Oldenburg, 26129 Oldenburg, Germany
2
Department of Energy, Area of sustainable technologies, Universidad Autónoma Metropolitana UAM—Azcapotzalco, 02200 Mexico City, Mexico
*
Author to whom correspondence should be addressed.
Recycling 2018, 3(3), 45; https://doi.org/10.3390/recycling3030045
Submission received: 28 July 2018
/
Revised: 7 September 2018
/
Accepted: 7 September 2018
/
Published: 12 September 2018
(This article belongs to the Special Issue Waste Management Practices in Developing Countries)
Abstract
:Mexico City introduced the new legal waste norm Norma NADF-024-AMBT-2013 in July 2017. This report compares the proposed system with three alternatives: a baseline scenario with composting of organics, a scenario which involves anaerobic digestion of organics, and a mechanical–biological treatment scenario with no source separation. The comparison was done using an Analytic Hierarchy Process. Eleven different indicators were chosen for the evaluation: general waste performance indicators (landfill disposal and recycling rates), environmental indicators (greenhouse gas emissions, acid gas emissions, Biological Oxygen Demand (BOD), and mercury content in water and soil), economic indicators (investment and operation costs) ($ per Mg municipal solid waste (MSW)), and social indicators (jobs created and social acceptance). The scenario ranking based on pairwise comparison made by 5 experts from Mexico City showed that the most sustainable scenario, environmentally, socially, and economically, is that which corresponds to Norma NADF-024-AMBT-2013 with a ranking priority of 30.78%.
1. Introduction
Waste management in emerging countries has become urgent during recent years, because economic growth and rise of consumption have caused a rise in waste production. The escalation of generation of residues has resulted in a shortage of disposal sites and higher waste management costs. In Accra, Ghana, the expenditure for municipal solid waste (MSW), for example, increased from 2013 to 2015 by 8% [1]. Other important waste management issues which developing countries must face include lack of proper governance instruments, inefficient resource use, overdependence on imported equipment, improper financing methods and application of technology, inequality in service stipulation, and deficient technical expertise [2]. In many cases, especially in lower-income countries, governance issues play a more important role than technical aspects [3]. Therefore, it is vital to find implementable, knowledge-based solutions for the governments of countries with poor municipal waste management performance. For example, in Mexico City, which produces 12,920 Mg per day of MSW and experiences the problem of shortage of landfill capacity, the waste infrastructure requires an alternative scenario. However, with the variety of technologies for treatment, recovery, and energy generation from waste, it is hard for decision makers, not experts themselves, to make a correct choice. Diverse technologies have distinctive climate change effects, and different investment and operation costs. An overall assessment of a waste management system is needed in such cases. This assessment should combine aspects such as environmental performance, economic viability, and social acceptability. Also, local conditions should always be a consideration before a system is implemented.
Extensive research has been done to determine sustainable decision-making models to assess waste management scenarios. Among the existing models, the most popular ones are life-cycle assessment (LCA), cost–benefit analysis, and multicriteria analysis. LCA calculates the environmental impact of all processes of the waste treatment from “cradle to grave”; cost–benefit analysis considers the monetary dimension, while multicriteria decision analysis (MCDA) compares social, economic, and environmental criteria [4]. There is literature available which compares different waste management systems in emerging and developing countries. Brunner and Fellner [5] conducted a study to determine appropriate waste management systems in less-developed economies. Zubruegg [6] developed an assessment tool based on a questionnaire. Elsaid and Aghezzaf [7] presented a progress-indicator-based assessment guide for integrated municipal solid waste management systems.
MCDA is often used in waste management. One of the MCDA methods widely applied in waste management is ELECTRE (Elimination and Choice Expressing the Reality). ELECTRE can incorporate many evaluation criteria for selecting an optimal alternative, coupled with the possibility of involving several decision-makers. It has been applied to the real choice process of a solid waste management system in Bosnia and Herzegovina by Vučijak et al. [8]. Another, PROMETHEE (Preference Ranking Organization Method for Enrichment Evaluations), was developed by Brans [9] and further extended by Brans and Vincke [10]. Queiruga et al. [11] used PROMETHEE, combined with a survey of experts, to rank Spanish municipalities for the installation of Waste Electrical and Electronic Equipment (WEEE) recycling plants. Demesouka et al. [12] used a combination of geographical information systems (GIS) and MCDA methods in the analysis of municipal solid waste landfill suitability.
In this study, the alternative scenarios of MSW management in Mexico City are compared based on MCDA. The purpose of the analysis is to determine the most sustainable scenario for the city. The method used was chosen because it allows the involvement of environmental, economic, and social criteria, by comparing diverse quantitative and qualitative dimensions to produce a ranking. Moreover, it allows the participation of different stakeholders with various interests. Therefore, it has been chosen as a tool to assess the sustainability of waste management in this work.
The goal of this study is to find the most sustainable waste management scenario for Mexico City based on waste composition, experts’ opinions, and overall assessment of state-of-the-art technologies, by using MCDA. No research combining economic, environmental, and social dimensions has been previously conducted to determine a sustainable residues management model for Mexico City. This study is the first to visualize and compare the economic benefits, the impact of waste treatments on the environment, and social benefits of specific waste technologies for Mexico City. The outcome should help decision makers in the introduction of a successful, sustainable waste management system. The results are assumed to be transferable to other megacities in emerging countries and help decision makers in the selection of waste management scenarios with energy and resource recovery.
2. Methods
2.1. Analytical Hierarchy Process (AHP)
The present study applied the Analytical Hierarchy Process (AHP). Although AHP is one of the oldest MCDA methods, developed by Saaty [13], it is still widely used today. AHP allows the problem to be broken down into its constitutive elements, listed in relation to the main goal [14]. AHP is a multicriteria decision-making technique, which can concurrently consider qualitative and quantitative comparison criteria and where a lot of baseline research literature is available. Therefore, AHP is ideally suited to a project such as this, which needs to do comparative research involving many stakeholders having various interests [15]. AHP is applicable in a wide range of fields, including management, business, and policy [16,17], and is also often used to solve complex problems in environmental management. AHP application in land management is discussed by Schmoldt et al. [18].
The AHP method is widely applied in emerging countries, where waste management decisions need to be made in the absence of established sound environmental solutions. It has been used to compare solid waste treatment scenarios for cities [19] and university campuses [2] or to select the recycling strategy for specific waste categories like WEEE [20]. Taboada-González et al. [21] used AHP to select the best waste treatment with energy recovery for Ensenada, Baja California (Mexico). Araiza Aguilar et al. [22] looked for the zones suitable for the emplacement of waste management infrastructure in Mexico with the help of geographical information systems (GIS) and AHP. Martínez-Morales et al. [23] applied AHP to identify the municipalities of Mexico State with major waste management problems. Gomez Jauregui Abdo [24] discussed development of domestic water supply in Guadalajara with the help of AHP. A wide range of applications of the AHP method shows that it is a powerful decision tool for assisting decision makers in the selection of sustainable waste management strategies.
The AHP hierarchical structure allows decision makers to prioritize solutions in terms of relevant criteria. Additional criteria can be added later in the hierarchical structure after the first results are obtained. The decision procedure using the AHP is made up of four steps, as described by Saaty [25]:
- (1)
- Define the problem and determine the kind of knowledge sought.
- (2)
- Structure the decision hierarchy according to the goal of the decision in the following order: the objectives from a broad perspective, through the intermediate levels (criteria on which subsequent elements depend), up to the lowest level (which usually is a set of the alternatives).
- (3)
- Construct a set of pairwise comparison matrices. Each element of the matrix in the upper level is used to compare elements in the level immediately below.
- (4)
- Use the priorities obtained from the comparisons to weigh the priorities in the neighboring level. Do this for every element. For each element in the level below, add its weighed values and obtain its overall or global priority. Continue this process of weighing and adding until the final priorities of the alternatives in the bottom-most level are reached.
2.2. Study Area
Mexico is a diverse country with 125 million residents and abundant natural resources. It is a member of the Organization for Economic Co-operation and Development and simultaneously a developing country with a GDP per capita of 8201.3 US$ [26]. Mexico City, the capital and the most populated city, is considered in this case study. The city is located in the Valley of Mexico in the center of the country. It consists of 16 boroughs and is spread over an area of 1485 km2. The estimated population of 9 million [27] generates 12,920 mega grams (Mg) of MSW per day with per capita production of 1.43 kg per day. However, approximately 4 million people travel for work to Mexico City from the nearby states. The composition of collected MSW is presented in Figure 1, based on the analysis made in 2 boroughs of the city, Coyoacán and Venustiano Carranza. These districts can be taken to represent a broad middle of society. Therefore, the waste composition in these areas is assumed to be representative for the whole city. However, it is to be mentioned that the drivers of waste trucks, being part of the informal recycling sector, separate the major part of cardboard, PET, and metals for further sale. The sample thus represents the composition of waste arriving at the transfer station, but not the waste coming directly from the households. The results of the waste composition analysis correspond to the outcomes of the study by the Polytechnic University in 2013 [28]. The waste composition in Mexico City is not typical for developing countries, which tend to have a higher organic fraction (more than 50%). This shows that Mexico is an emerging economy, in transition from developing to an industrialized country. However, the biggest fraction is represented by food waste (27.77%), while plastics and paper/cardboard constitute 15.79% and 10.55%, respectively. The interesting fact here is that around 6% of the MSW is represented by toilet paper, explained by cultural habits and the capacity of the sewage system.
The MSW management system of the city consists of 12 transfer stations, 2 sorting facilities, and 8 composting plants. 14% of the generated waste is recycled with the help of the informal sector [29]. Almost all the collected waste is sent to the five landfills located outside of the city in the nearby state. This is a big challenge because it enormously increases transportation costs. Hence, a new waste legal norm, Norma NADF-024-AMBT-2013, was introduced in July 2017. This aims to increase the amount of collected recyclable materials and thereby decrease the quantity of landfilled material. At the same time, the city is planning to construct an incineration plant, which will treat almost half the collected residues.
2.3. Selection of Technical Alternatives
This research considers the following scenarios: (1) landfilling and composting, (2) anaerobic digestion, (3) MBT (mechanical–biological treatment) with composting as biological stage, and (4) incineration. The first scenario was chosen as a base scenario, which presents a business-as-usual scenario. It involves windrow open composting and engineered landfills. These composting piles are turned to improve porosity and oxygen content. Incineration and MBT plants were selected because these options are the most discussed options of sustainable waste management in developing countries [30,31,32]. The second scenario is considered to be the alternative for the others. Due to the high percentage of organics, wet anaerobic digestion can be very beneficial through energy and fertilizer supply, and is, according to Badri et al. [16], the most favorable treatment option for organic waste through energy and fertilizer supply. However, this option requires the source separation scheme of waste at households.
2.4. Waste Management Scenarios
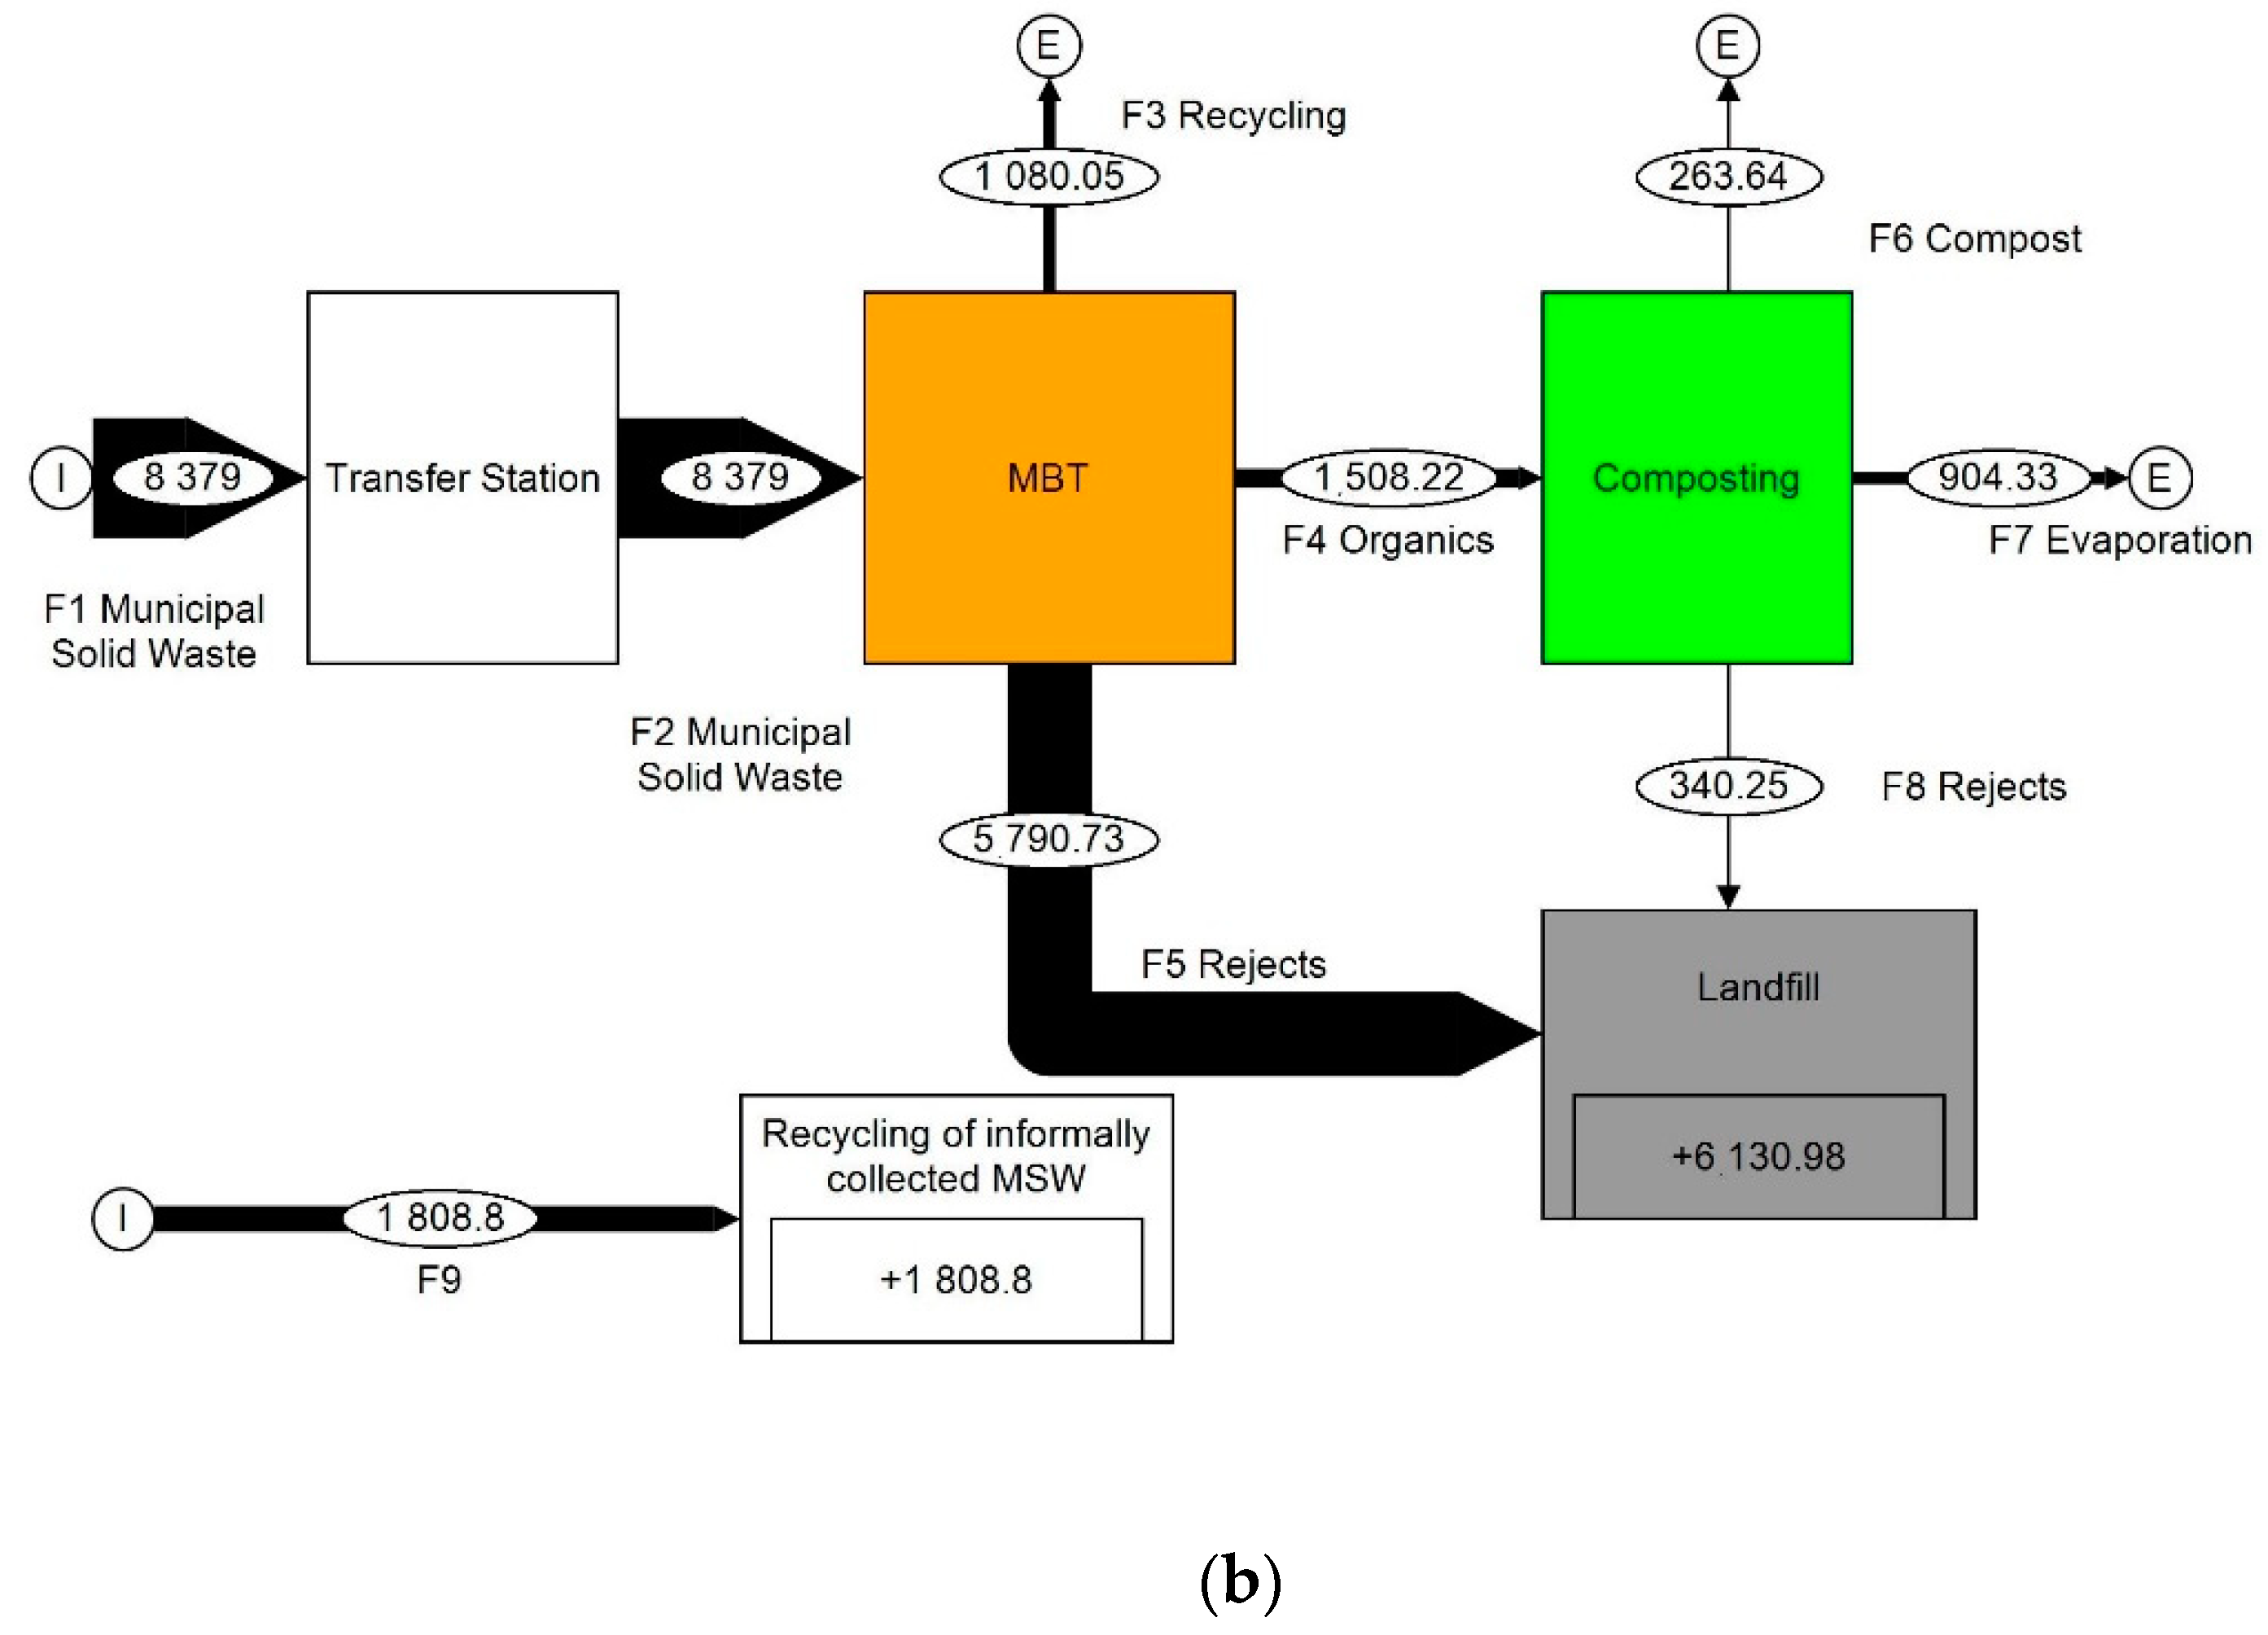
This research assesses the sustainability of several alternative scenarios for waste management for Mexico City. Since 2003, municipal solid waste in Mexico City has been separated at source into two fractions: organics and inorganics. However, the new regulation NADF-024-AMBT-2013 mandates the new segregation of residual waste into five fractions: organic, recyclables, nonrecyclables, hazardous waste, and bulky waste [33]. This work compares the proposed system with three alternatives: a baseline scenario with composting of organics, a scenario which involves anaerobic digestion (AD) of organics, and a mechanical–biological treatment (MBT) scenario with no source separation. MBT is a collective term, mainly used in Europe, which incorporates several variations of MSW treatment, based on a combination of mechanical processing and biological treatment (in most cases aerobic or anaerobic decomposition) [34,35]. According to the new regulation Norma 024, the organics should be composted, recyclable materials should be sorted and recycled, while nonrecyclables, hazardous waste, and bulky waste would be incinerated with energy recovery. The mass flows of each scenario are presented in Figure 2 and Figure 3. The charts were made and flows calculated with the program STAN, developed by TU Vienna [36]. The mass flows were assessed based on the following assumptions: 14% of generated MSW is recycled through the informal sector; the sorting plants receive daily 1725 Mg of recyclables from the State of Mexico. The source separation efficiency of the baseline corresponds with the official data from the Environmental Ministry of Mexico City [33]. The separation in AD and Norma 024 scenarios is determined by the waste composition from Figure 1 and corresponds to the ideal efficiency for comparison. As well, the sorting efficiency of the MBT is based on Navarotto and Llauro [37]. Detailed studies of process efficiency for MBT plants, in terms of sorting efficiencies and quality of recovered materials, are scarce in published literature. According to Cipman et al. [38], the study of Navarotto and Llauro [37] is one of the most detailed descriptions available. During their tests, the MBT Ecoparc 4 was subjected to a three-month-long campaign, and materials flows were recorded, sampled, and analyzed, including waste input, products, plant residue, and some intermediary process flows. The detailed process description of the material recovery section in the Ecoparc 4 MBT plant in Barcelona, Spain, is given in the Supplementary Material.
Hospital and hazardous waste is assumed to be gathered separately and burnt at special incineration plants, however, it is not considered in the mass flow analysis. The sources and methods used for each estimation in the mass flow diagram (MFD) are presented in Table 1. Each MFD is discussed in detail in the Supplementary Material.
2.5. Selection of Indicators
To examine the indicators for the sustainability of a waste treatment scenario a literature review was performed. Hokkanen and Salminen [39] identified a set of 24 indicators for waste management and divided them into six groups: economic, technical, environmental, political, employment and resource recovery. Greene and Tonjes [40] applied 12 indicators: MSW recycled, MSW landfilled, MSW diverted from the landfill, diversion rate, recycling rate, curbside recycling rate, landfilling rate, recycling per capita, landfilling per capita, diversion per capita, GHG reductions, energy savings. The present study applied the sustainable indicators used in the AHP model of Milutinović et al. [41]:
- overall waste management performance: landfill disposal rate; recycling rate;
- environmental indicators: GHG emissions (CO2 Equivalents) per Mg of MSW, acid gases emissions (nitrogen oxides) per Mg of MSW, biological oxygen demand (BOD) and mercury in soil (heavy metals in soil);
- economic indicators: investment and operational costs;
- social indicators: job creation and public acceptance.
The set of indicators was selected according to the following criteria: relevance of the indicator for local sustainability of waste management, potential measurability at the local level and power of the local authority to change the outcomes measured by the indicator [19]. No extra indicators were added during the AHP process.
2.6. Evaluation of Indicators
2.6.1. Overall Waste Management Performance
The amount of waste that remains after treatment for landfill disposal was estimated based on the mass flow modelled with the help of the STAN software. The software was used for both the representation and calculations. The baseline scenario is provided by the data presented by the Environmental Ministry of the city [33]. Information for other scenarios was based on data from the literature, since the technologies considered are not presently available in Mexico City; the data for MBT was based on Navarotto and Llauro [37], AD and incineration data on the report for the Austrian ministry of Ecology [42], and composting on Andersen et al. [43]. These sources have proven reliable when used in previous studies from Rodić and Wilson and Masood et al. [3,44]. Due to the absence of the technologies discussed in Mexico and overall in the region of Latin America, no real data could be used for the research. Therefore, the study could only consider values from the literature.
2.6.2. Environmental Indicators
Nitrogen oxides emissions to the atmosphere, BOD in water, and mercury concentration in soil were estimated within the life-cycle inventory (LCI) using EASETECH software [45] and its last available database version from July 2017. These indicators are assumed to give an overall environmental assessment, considering contamination in the atmosphere, water, and soil. The same criteria were applied in the AHP analysis in Multinovic [41].
This study has been carried out using the EASETECH model. In assessing emissions, this model calculates the emissions from the point at which a material is discarded into the waste stream to the point at which it is either converted into a useful material or finally disposed of (Kirkeby [46]). The EASEWASTE models were elaborated including waste treatment options and external processes, which can appear both upstream and downstream of a waste management system. The program also evaluates emissions associated with the fuel consumption for collection and transportation of waste. However, emissions from transportation to recycling facilities have not been included due to the lack of data on distances. Recycled materials and energy derived from the waste management system are regarded as substitutes for virgin materials or energy. Emissions into water, air, and soil alongside resource consumptions, which are avoided as a result, are subtracted from the other emissions and resource consumptions in the waste system. The model calculates emissions into water, air, and soil, along with the consumption of resources. The model applies life-cycle impact assessment (LCIA) methods for conversion of these exchanges into environmental impacts [46,47].
Climate change impact was estimated based on the International Reference Life Cycle Data System (ILCD) method. It contains the impact categories recommended by the European Commission and described by Hauschild et al. [48] (2013). The source for characterization factors for climate change at midpoint was the IPCC report for a 100-year period [49]. The calculations were made using the database of EASETECH from July 2017. All the processes were based on the premodelled technologies existing in the database, except the MBT. The MBT plant was presented as a combination of a composting and sorting plant. Among others, the emissions from the incineration process were calculated using the data from the Danish plant described by Møller et al. [50]. Emission profiles were not available for some external processes, but most impacts are covered.
2.6.3. Economic Indicators
The economic indicators include investment and operational costs for the prevailing treatment method for each scenario: AD, MBT, and incineration. The assessment was performed based on data from IADB [51], Münnich et al. [52], and Tsilemou and Panagiotakopoulos [53]. The costs of the current scenario are given in IADB [51]. The calculations were based on € Mg MSW−1. For evaluation of investment costs, the expenditures for design and construction of landfills and waste treatment facilities were considered. However, taxation, amortization, and inflation were not considered.
This study does not include the collection and transportation costs, even though they may reach up to 50–80% of the entire costs of a waste management system, as in industrialized countries [54]. The expenditures for education campaigns for citizens regarding source separation are also not included due to the lack of data.
2.6.4. Social Indicators
The number of new jobs in waste treatment is calculated depending on the amount of processed waste (Mg MSW). The evaluation was done based on the data from the Environmental Ministry of Mexico City SEDEMA [33], Friends of the Earth [55], and European Commission [56]. Public acceptance is a qualitative criterion which cannot be measured, therefore, the scale established in the AHP (1-worst, 9-best) was used for the assessment of this criterion. These results were obtained during interviews with experts, where they expressed their opinion about different waste treatment options.
2.6.5. Ranking of Indicators
Indicators (not the alternatives) are compared pairwise applying a scale from 1 to 9 for making a ranking. An example questionnaire given to the experts can be found in Table 2. When “7” is chosen in the first row, the landfill elimination rate is much more important than the recycling rate for the sustainability of waste management, according to the personal opinion of the consulted experts, while “5” chosen in the second row means that the emissions of greenhouse gases are considerably more important than the rate of elimination of landfills.
Pairwise comparisons were used to determine the relative importance of each alternative in terms of each criterion. To make a pairwise comparison and subjective priority weightings for the criteria, experts working in the waste management sector in Mexico City were consulted. This includes scientists working at the Universities UAM, UNAM, and Instituto Politécnico Nacional (the three main public universities in the City) in environmental and economic science and in the field of waste treatment, as well as experts from the government of Mexico dealing with the problem of waste management and environmental consultants. These Mexico-based scientists and experts were asked to rank the importance of the criteria with respect to the goal, selection of the most sustainable waste management scenario. The pairwise comparison was made by 5 experts. The process of filling out the questionnaire is time-consuming and the authors received only 5 filled out ones out of 14 distributed. The experts were not informed of the results of the indicators presented in Table 3. The filled-out questionnaires received by the authors are presented in Supplementary Material.
2.7. Limitations of Methodology
The methodology has some limitations. The mass flow analysis for the scenarios b, c, and d was based on Navarotto and Llauro [37], the report for the Austrian Ministry of Ecology [42], and Andersen et al. [43], due to the absence of real data in the regional context. The calculations made in the EASETECH model were based on the default data, because no chemical analysis of the waste composition was made. For the social indicators, the number of the workplaces was estimated through reports which were applied in other, previous studies. The costs of waste treatment were based on data from IADB [51], Münnich et al. [52], and Tsilemou and Panagiotakopoulos [53]. These limitations may affect the outcome of the study. The evaluation of indicators directly influences the ranking, which may lead to biased results. Nevertheless, the assumptions should to be made to implement the research.
3. Results and Discussion
3.1. Assessment of Indicators
The evaluation of the indicators (overall waste management performance, environmental, economic, and social criteria) is presented in Table 3.
Figure 4 shows the ranking of indicators made based on the pairwise comparison of the experts. According to the preferences of the experts, environmental criteria are most crucial for integrated sustainable waste management, while the economic indicators play the least significant role. The calculation of ranking of indicators is available in Supplementary Material.
3.2. Scenario Ranking
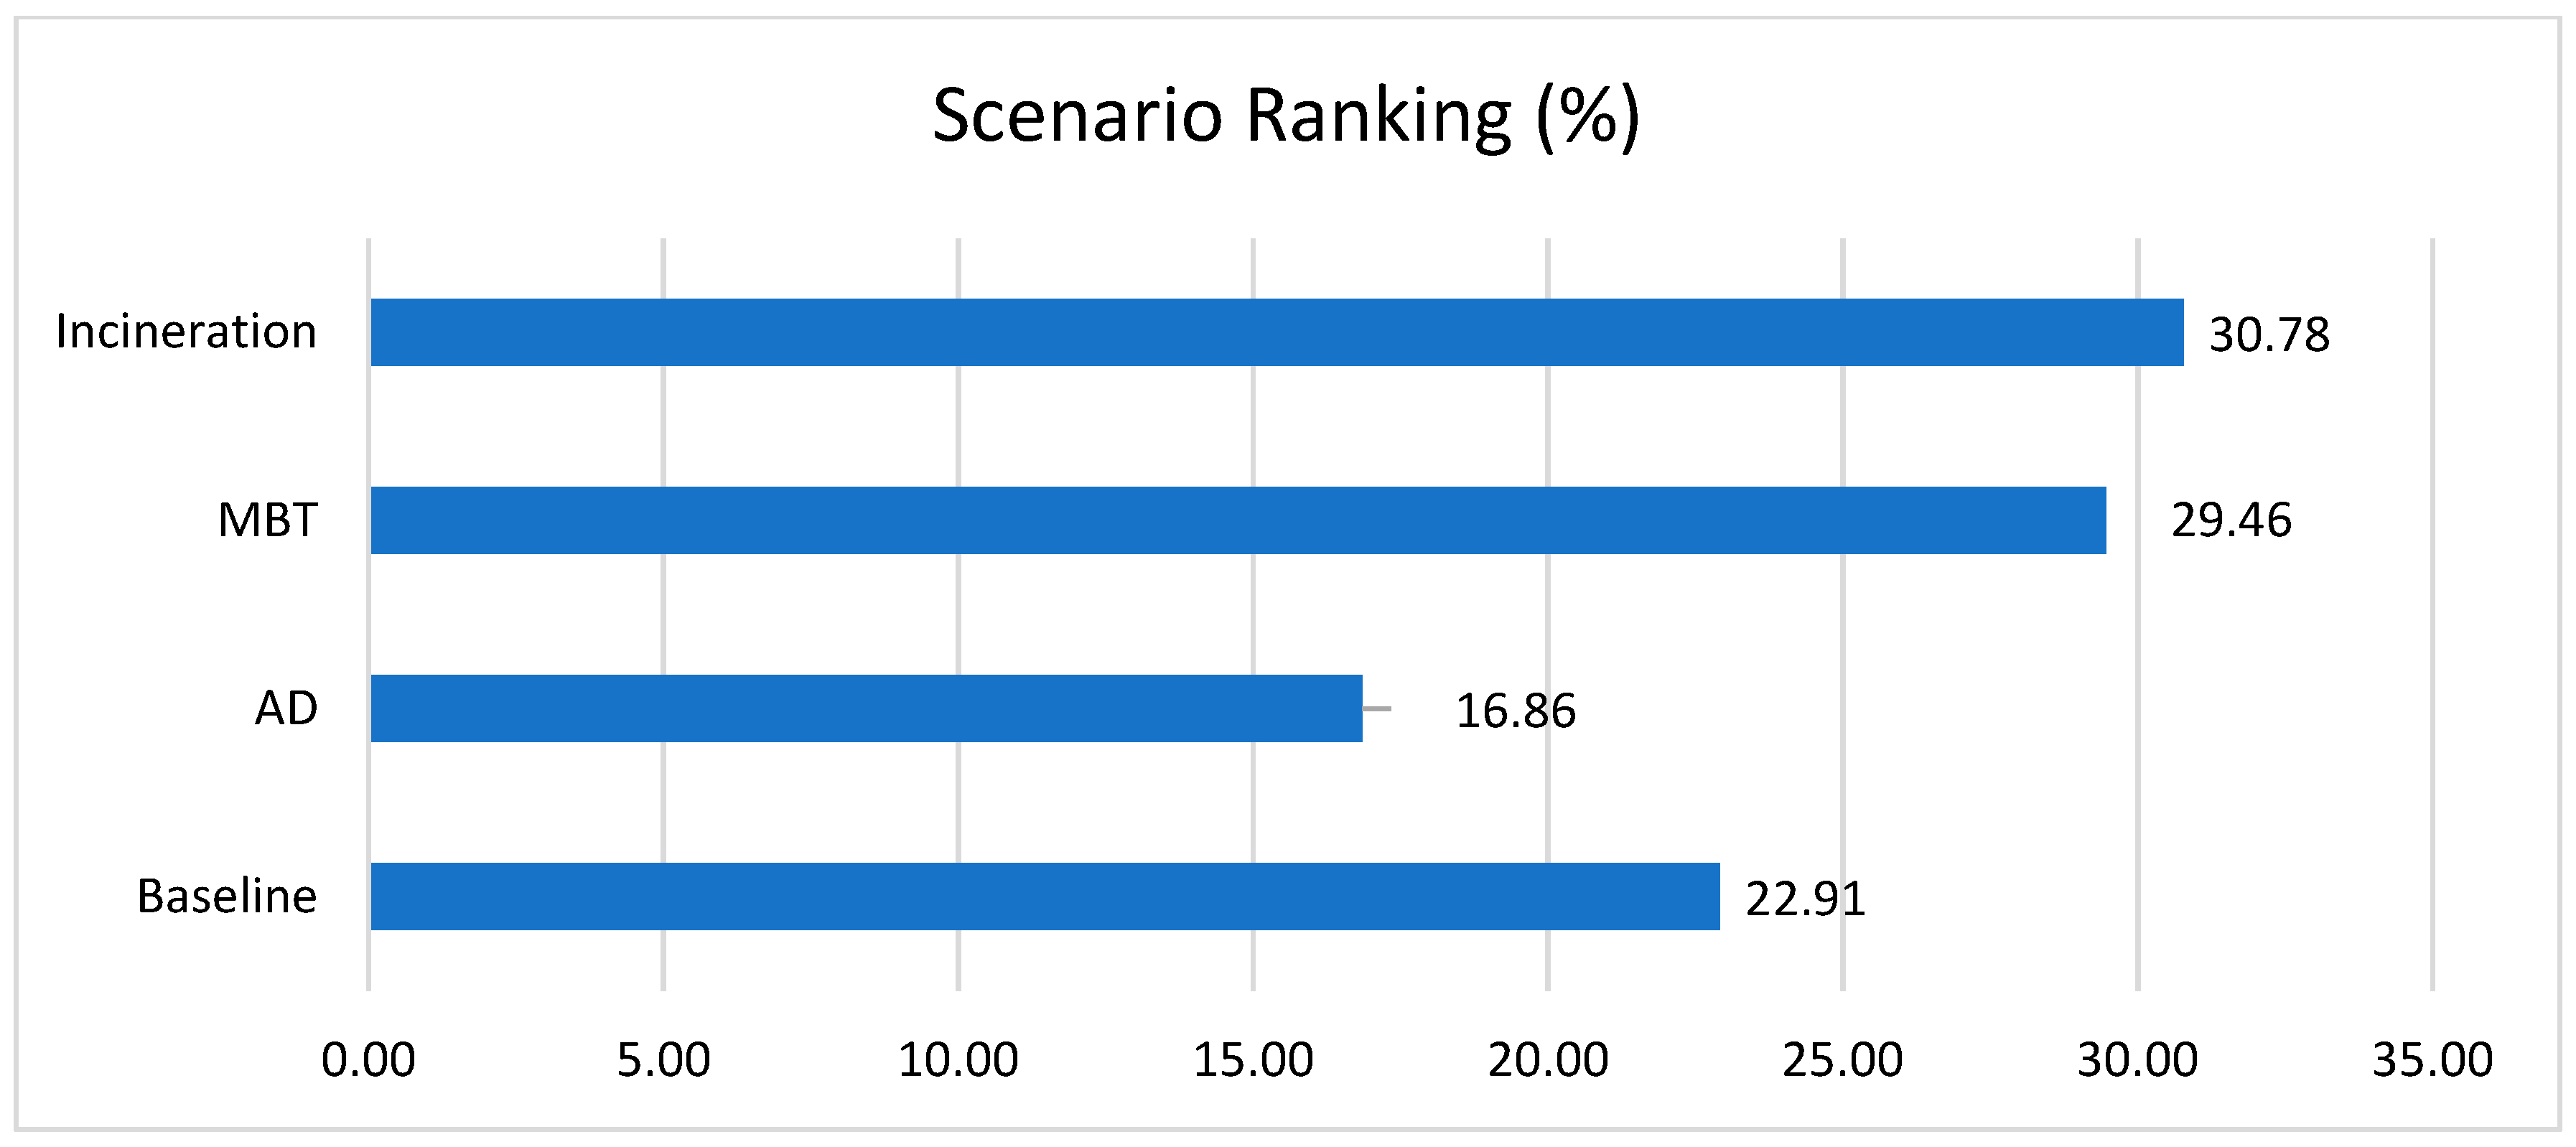
Following the pairwise criteria, the criteria weight of each scenario with respect to the goal was obtained as shown in Figure 5, presented in Supplementary Material Criteria’s evaluation. The results show that Scenario 4, involving recycling of recyclable waste, composting of organic waste, and the thermal treatment of the remaining mixed waste for energy recovery (WTE), has the highest-ranking priority of 30.78%. The results show that the more separately collected categories of waste are involved in the plan, the more sustainable the scenario is considered to be by the experts.
Figure 4 indicates that in assessing the sustainability of waste treatment, the most relevant indicator is the GHG emissions. Therefore, the WTE scenario was ranked as the highest. However, it should be considered that the evaluation of indicators for this scenario was based on data from the literature, under the assumption that source separation rate is 100%. In order to achieve that result, the new incineration plant would have to comply with European standards, including emissions standards [57].
3.3. Sensitivity Analysis
The last step of the decision process using the AHP method is sensitivity analysis, where the input data of criteria weighting are modified to observe their impact on the results. If the ranking of scenarios does not change, the results are said to be robust [58]. The sensitivity analysis was performed to assess the influence of individual sustainability indicators on the proposed waste treatment scenarios. The following cases were examined following the procedure of Milutinović et al. [41]:
Case 1: All indicators had an equal weighting factor (10%). In this case, scenario ranking was changed. Baseline Scenario was top-ranked and most sustainable in terms of all indicators with a priority ranking of 29.9%. Scenario 4, which corresponds to the new waste management regulation in Mexico City and involves the incineration process and composting, was then in 2nd place.
Case 2: The group of environmental indicators was assigned a weighting factor of 100% in total (each of them had a weighting factor of 25%), while all the others had a weighting factor of 0%. In this case, Scenario 4 was ranked as the best with priority ranking of 34.62%, due to smaller CO2 and nitrogen oxides emissions, as well as the fact that recycling greatly reduces the disposed waste volume.
Case 3: One waste indicator had a weighting factor of 100%, while all others had a weighting factor of 0%. There are 10 options, and the results showed that when economic and social waste management indicators had a weighting factor of 100%, while others had a weighting factor of 0%, Scenario 1 (baseline) got the first place. Scenario 4 (WTE) ranked best in cases where indicators of landfill disposal, CO2 emission, and content of heavy metals in soil indicators had a weighting factor of 100%, while others had a weighting factor of 0%.
Case 4: The group of economic indicators were weighted at 100% in total (each at 50%), while all others had a weighting factor of 0%. Here, Scenario 1 is mostly preferred with a priority ranking of 54.57%. Under these conditions, the ranking changed because of the lower investment and operation costs of the existing waste management system.
Case 5: The group of social indicators was given a weighting factor of 100% in total (each 50%), while all others had a weighting factor of 0%. In this case, Scenario 3 was ranked in first place with a priority ranking of 40.68%. Scenario 4 had the lowest place in the ranking due to the small number of jobs created and public disquiet about thermal waste treatment.
All the results of the sensitivity analysis are presented in Figure 6 and Figure 7. The calculations are presented in Supplementary Material.
The main conclusions from sensitivity analysis are the following:
Scenario 4 (WTE) ranked first when priority was given to the environmental indicators. However, this result is not stable due to fluctuations in the weighting of criteria. When priority was given to the economic and social impact of waste management strategies, Scenario 4 was not ranked first. In Case 4, the baseline scenario was ranked the highest, and in Case 5, the scheme involving MBT.
Scenario 2 (AD) is the most stable solution. With different indicators rankings, it is ranked third in Cases 1, 2, and 5 and never ranked first, however other scenarios change their rating so much that Scenario 2 emerges as the most stable.
4. Conclusions
AHP method was applied for sustainability assessment of waste treatment scenarios with energy and resources recovery for Mexico City. This research extends the knowledge basis of comparison of waste management in emerging countries with low municipal waste management performance. The study does not only present information on economic instruments but also ranks them.
The study was conducted to compare the new waste management plan for the city (WTE) with alternatives: “business-as-usual” scenario, AD of organic fraction, and MBT. The goal of the study was a scenario ranking using a model based on multicriteria analysis for sustainability assessment of the waste management scenarios. The pairwise comparison was done by a group of experts from Mexico City. The results of this show that the most sustainable scenario, environmentally, socially, and economically, is Scenario 4-WTE, with a ranking priority of 30.78%. These results confirm that the decision made by the government of Mexico City to introduce waste incineration is sustainable from environmental, economic, and social aspects. The analysis suggests the next steps should focus on the introduction of the new regulation, improving the infrastructure, including roads, and increasing human resources. These results can help decision makers in other megacities in developing countries in introducing a successful and sustainable waste management system. However, this is challenging for emerging economies that cannot easily afford waste-to-energy plants due to their high costs. Since the willingness to pay for waste management is not higher than 0.4% of GDP, WTE is out of the reach of countries with a per capita GDP below 3000 US$ [59].
The following constraints of this model should, however, be considered. According to the indicator ranking, environmental criteria have the highest priority, therefore, the WTE scenario was ranked first. But it should be noted that, due to the lack of data, European standards were used for the life-cycle inventory, and the efficiency rate of the source separation was assumed to be perfect. Another restriction of the present AHP analysis is that pairwise comparison was made by only 5 experts, because the process is time-consuming and the authors received only 5 filled-out questionnaires out of 14. The results of sensitivity analysis showed that the outcome of the study is not stable and, therefore, less reliable. Further research should involve a larger number of experts making the indicators ranking, to give higher validation to the results. Determination and precise evaluation of the indicators for assessing the sustainability of waste management should be focused on as well. Moreover, further study needs to be undertaken on the feasibility of WTE technology in the Mexican context, which has the typical constrains in developing countries: data acquisition, inadequate collection systems, and reduced ability to collect charges [60].
Supplementary Materials
The following are available online at https://www.mdpi.com/2313-4321/3/3/45/s1. Figure S1: Mass flow diagram of Baseline Scenario; Figure S2: Mass flow diagram of AD Scenario; Figure S3: Mass flow diagram of MBT Scenario; Figure S4: Mass flow diagram of Incineration Scenario; Table S1: Details of the flows of the MFD of Baseline Scenario; Table S2: Details of the flows of the MFD of AD Scenario; Table S3: Details of the flows of the MFD of MBT Scenario; Table S4: Details of the flows of the MFD of incineration Scenario.
Author Contributions
N.T. realized the interviews and wrote the paper. A.V.M. conceived and supervised the study. A.A.C.S. contributed in the data analysis.
Funding
The first author received financial support for the conduct of this study from DAAD (German Academic Exchange Service) within the program IPID4ALL and Heinz Neumüller Foundation.
Conflicts of Interest
The authors declare no conflict of interest.
References
- Oduro-Appiah, K.; Scheinberg, A.; Mensah, A.; Afful, A.; Kofi Boadu, H.; de Vries, N. Assessment of the municipal solid waste management system in Accra, Ghana: A ‘Wasteaware’ benchmark indicator approach. Waste Manag. Res. 2017, 35, 1149–1158. [Google Scholar] [CrossRef] [PubMed]
- Ghazvinei, P.T.; Mir, M.A.; Ariffin, J. University Campus Solid Waste Management [Combining Life Cycle Assessment and Analytical Hierarchy Process]; Springer: Berlin, Germany, 2017; ISBN 978-3-319-43227-4. [Google Scholar]
- Rodić, L.; Wilson, D.C. Resolving governance issues to achieve priority sustainable development goals related to solid waste management in developing countries. Sustainability 2017, 9, 404. [Google Scholar] [CrossRef]
- Morrissey, A.J.; Browne, J. Waste Management Models and Their Application to Sustainable Waste Management. Waste Manag. 2004, 24, 297–308. [Google Scholar] [CrossRef] [PubMed]
- Brunner, P.H.; Fellner, J. Setting priorities for waste management strategies in developing countries. Waste Manag. Res. 2007, 25, 234–240. [Google Scholar] [CrossRef] [PubMed]
- Assessment Methods for Waste Management Decision-Support in Developing Countries. Available online: https://www.dora.lib4ri.ch/eawag/islandora/object/eawag%3A13531/datastream/PDF/view (accessed on 30 December 2017).
- Elsaid, S.; Aghezzaf, E.H. A progress indicator-based assessment guide for integrated municipal solid-waste management systems. JSMCWM 2017, 20, 4–11. [Google Scholar] [CrossRef]
- Vučijak, B.; Kurtagić, S.M.; Silajdžić, I. Multicriteria decision making in selecting best solid waste management scenario: a municipal case study from Bosnia and Herzegovina. J. Clean. Prod. 2016. [Google Scholar] [CrossRef]
- Brans, J.P. Lingénierie de la décision. Elaboration dinstruments daide à la décision. Méthode PROMETHEE. In L′aide à la décision: Nature, instruments et perspectives d’avenir; Nadeau, R., Landry, M., Eds.; Presses de l′Université Laval: Québec city, QC, Canada, 1982; pp. 183–214. [Google Scholar]
- Brans, J.P.; Vincke, P. A Preference Ranking Organisation Method: (The PROMETHEE Method for Multiple Criteria. Decision-Making). Manag. Sci. 1985, 31, 647–656. [Google Scholar] [CrossRef]
- Queiruga, D.; Walther, G.; González-Benito, J.; Spengler, T. Evaluation of sites for the location of WEEE recycling plants in Spain. Waste Manag. 2008, 28, 181–190. [Google Scholar] [CrossRef] [PubMed]
- Demesouka, O.E.; Vavatsikos, A.P.; Anagnostopoulos, K.P. GIS-based multicriteria municipal solid waste landfill suitability analysis: a review of the methodologies performed and criteria implemented. Waste Manag. Res. 2014, 32, 270–296. [Google Scholar] [CrossRef] [PubMed]
- Saaty, T. The Analytic Hierarchy Process, Planning, Piority Setting, Resource Allocation; McGraw-Hill: New York, NY, USA, 1980. [Google Scholar]
- Achillas, C.; Moussiopoulos, N.; Karagiannidis, A. The use of multi-criteria decision analysis to tackle waste management problems: a literature review. Waste Manag. Res. 2013, 31, 115–129. [Google Scholar] [CrossRef] [PubMed]
- Kling, M.; Seyring, N.; Tzanova, P. Assessment of economic instruments for countries with low municipal waste management performance: An approach based on the analytic hierarchy process. Waste Manag. Res. 2016, 34, 912–922. [Google Scholar] [CrossRef] [PubMed]
- Badri, M.; Al Qubaisi, A.; Mohaidat, J.; Al Dhaheri, H.; Yang, G.; Al Rashedi, A.; Greer, K. An analytic hierarchy process for school quality and inspection: Model development and application. Int. J. Educ. Manag. 2016, 30, 437–459. [Google Scholar] [CrossRef]
- Baba, Y.; Kallas, Z.; Realini Cujó, C. A multi-criteria stated method to analyze consumers’ preference and sensory evaluation towards omega-3 enriched eggs: The Analytical Hierarchy Process (AHP). In Proceedings of the 29th Conference if the IAAE, International Association of Agricultural Economists, Milan, Italy, 1–3 August 2015. [Google Scholar]
- Schmoldt, D.; Kangas, J.; Mendoza, G.A.; Pesonen, M. The Analytic Hierarchy Process in Natural Resource and Environmental Decision Making; Springer: Berlin, Germany, 2013; ISBN 978-94-015-9799-9. [Google Scholar]
- Milutinović, B.; Stefanović, G.; Dassisti, M.; Marković, D.; Vučković, G. Multi-criteria analysis as a tool for sustainability assessment of a waste management model. Energy 2014, 74, 190–201. [Google Scholar] [CrossRef]
- Kim, M.; Jang, Y.C.; Lee, S. Application of Delphi-AHP methods to select the priorities of WEEE for recycling in a waste management decision-making tool. J. Environ. Manag. 2013, 128, 941–948. [Google Scholar] [CrossRef] [PubMed]
- Taboada-González, P.; Aguilar-Virgen, Q.; Ojeda-Benítez, S.; Cruz-Sotelo, S. Application of analytic hierarchy process in a waste treatment technology assessment in Mexico. Environ. Monit. Assess 2014, 186, 5777–5795. [Google Scholar] [CrossRef] [PubMed]
- Araiza Aguilar, J.A.; Nájera Aguilar, H.A.; Gutiérrez Hernandez, R.F.; Rojas Valencia, M.N. Emplacement of solid waste management infrastructure for the Frailesca Region, Chiapas, México, using GIS tools. EJRS 2017. [Google Scholar] [CrossRef]
- Martínez-Morales, I.N.; del Consuelo Mañón-Salas, M.; del Consuelo Hernández-Berriel, M.; Ojeda-Benítez, S.; Carreño-de León, M.C. Selección de Municipios del Noreste del Estado de México y Estados Aledaños Mediante el Método AHP. In Proceedings of the Memorias 9 ENERS 2018, Guadalajara, Mexico, 13 June 2018; Dra. María del Consuelo Mañón Salas: Calimaya, Estado de México, Mexico, 2018; pp. 189–199. [Google Scholar]
- Gomez Jauregui Abdo, J.P. Sustainable Development of Domestic Water Supply in Emerging Megacities: The Case of the City of Guadalajara, Mexico. Ph.D. Thesis, Brandenburg Technical University, Cottbus, Germany, 2015. [Google Scholar]
- Saaty, T. Decision making with the analytic hierarchy process. Int. J. Serv. Sci. 2008, 1, 83–98. [Google Scholar] [CrossRef]
- World Bank, Data Bank, 2016. Available online: http://data.worldbank.org/country/mexico (accessed on 25 July 2018).
- INEGI. Encuesta Intercensal. Available online: http://www.inegi.org.mx/est/contenidos/proyectos/encuestas/hogares/especiales/ei2015/doc/eic_2015_presentacion.pdf (accessed on 30 December 2017).
- PAOT, Centro Interdisciplinario de Investigaciones y Estudios sobre Medio Ambiente y Desarrollo del IPN and Instituto Politécnico Nacional, Diagnóstico actual del flujo de residuos sólidos urbanos que se genera en el Distrito Federal, 2013. Available online: http://centro.paot.org.mx/documentos/paot/estudios/flujo_residuos_DF.pdf (accessed on 15 July 2018).
- Gómez, F.L.; Quintero, M.J. Acuerdan GDF y Edomex canalización de basura ante cierre de Bordo Poniente. La Jornada. 2011. Available online: http://www.jornada.unam.mx:8810/2011/12/22/capital/036n2cap (accessed on 5 March 2018).
- Bezama, A.; Aguayo, P.; Konrad, O.; Navia, R.; Lorber, K.E. Investigations on mechanical biological treatment of waste in South America: Towards more sustainable MSW management strategies. Waste Manag. 2007, 27, 228–237. [Google Scholar] [CrossRef] [PubMed]
- Menikpura, N.; Sang-Arun, J.; Bengtsson, M. Mechanical biological treatment as a solution for mitigating greenhouse gas emissions from landfills in Thailand. In Proceedings of the ISWA World Solid Waste Congress, Florence, Italy, 17–19 September 2012. [Google Scholar]
- Guidebook for the Application of Waste to Energy Technologies in Latin America and the Caribbean. Available online: http://www.seas.columbia.edu/earth/wtert/pressreleases/Guidebook_WTE_v5_July25_2013.pdf (accessed on 10 June 2016).
- SEDEMA. El Inventario de Residuos Sólidos. 2016. Available online: http://www.sedema.cdmx.gob.mx/storage/app/media/IRS-2016.pdf (accessed on 31 December 2017).
- Beckmann, M.; Karl, H.C.; Thome-Kozmiensky, J. Waste-derived fuels—Opportunities and problems [Ersatzbrennstoffe—Chancen und probleme]. Aufbereit.-Tech. 2006, 47, 28–37. [Google Scholar]
- Thiel, S.; Thomé-Kozmiensky, K.J. Mechanical-Biological Pre-Treatment of Waste–Hope and Reality. In Proceedings of the ISWA World Congress 2010—Urban Development and Sustainability—A Major Challenge for Waste Management in the 21th Century, Hamburg, Germany, 15–18 November 2010. [Google Scholar]
- Cencic, O.; Rechberger, H. Material Flow Analysis with Software STAN. J. Environ. Eng. Manag. 2008, 18, 440–447. [Google Scholar]
- Navarotto, P.; Dominguez Llauro, R. Materials recovery from municipal solid waste: ECOPARC 4 Barcelona a case study. In SIDISA 2012 Sustainable Technology for Environmental Protection; Bonomo, L., Ed.; Atti del Convegno Sidisa: Milan, Italy, 2012. [Google Scholar]
- Cimpan, C.; Maul, A.; Jansen, M.; Pretz, T.; Wenzel, H. Central sorting and recovery of MSW recyclable materials: A review of technological state-of-the-art, cases, practice and implications for materials recycling. J. Environ. Manag. 2015. [Google Scholar] [CrossRef] [PubMed]
- Hokkanen, J.; Salminen, P. Choosing a solid waste management system using multicriteria decision analysis. Eur. J. Oper. Res. 1997, 98, 19–36. [Google Scholar] [CrossRef]
- Greene, K.L.; Tonjes, D.J. Quantitative assessments of municipal waste management systems: using different indicators to compare and rank programs in New York State. Was Manag. 2014, 34, 825–836. [Google Scholar] [CrossRef] [PubMed]
- Milutinović, B.; Stefanović, G.; Kyoseva, V.; Yordanova, D.; Dombalov, I. Sustainability assessment and comparison of waste management systems: The Cities of Sofia and Niš case studies. Waste Manag. Res. 2016, 34, 896–904. [Google Scholar] [CrossRef] [PubMed]
- BLFUW-Bundesministerium für Land-und Forstwirtschaft, Umwelt und Wasserwirtschaft. Benchmarking für die österreichische Abfallwirtschaft. 2015. Available online: https://publik.tuwien.ac.at/files/PubDat_247861.pdf (accessed on 31 December 2017).
- Andersen, J.K.; Boldrin, A.; Christensen, T.H.; Scheutz, C. Mass balances and life-cycle inventory for a garden waste windrow composting plant (Aarhus, Denmark). Waste Manag. Res. 2012, 30, 1010–1020. [Google Scholar]
- Masood, M.; Barlow, C.Y.; Wilson, D.C. An assessment of the current municipal solid waste management system in Lahore, Pakistan. Waste Manag. Res. 2014, 32, 834–847. [Google Scholar] [CrossRef] [PubMed]
- Clavreul, J.; Baumeister, H.; Christensen, T.H.; Damgaard, A. An environmental assessment system for environmental technologies. Environ. Model Softw. 2014, 60, 18–30. [Google Scholar] [CrossRef] [Green Version]
- Kirkeby, J.T.; Birgisdottir, H.; Hansen, T.L.; Christensen, T.H.; Bhander, G.S.; Hauschild, M. Environmental assessment of solid waste systems and technologies: EASEWASTE. Waste Manag. Res 2006, 24, 3–15. [Google Scholar] [CrossRef] [PubMed]
- Kirkeby, J.T.; Birgisdottir, H.; Hansen, T.L.; Christensen, T.H.; Bhander, G.S.; Hauschild, M. Evaluation of environmental impacts from municipal solid waste management in the municipality of Aarhus, Denmark (EASEWASTE). Waste Manag. Res. 2006, 24, 793–799. [Google Scholar]
- Hauschild, M.; Goedkoop, M.; Guinée, J.; Heijungs, R.; Huijbregts, M.; Jolliet, O.; Margni, M.; Schryver, A.D.; Humbert, S.; Laurent, A.; et al. Identifying best existing practice for characterization modeling in life cycle impact assessment. Int. J. LCA 2013, 18, 683–697. [Google Scholar] [CrossRef]
- IPCC (2007) Climate Change: The Physical Science Basis. Contribution of Working Group I to the Fourth Assessment Report of the Intergovernmental Panel on Climate Change. 2007. Available online: http://www.ipcc.ch/publications_and_data/publications_ipcc_fourth_assessment_report_wg1_report_the_physical_science_basis.htm (accessed on 31 December 2017).
- Møller, J.; Jensen, M.B.; Kromann, M.; Neidel, T.L.; Jakobsen, J.B. Miljø-og samfundsøkonomisk vurdering af muligheder for øget genanvendelse af papir, pap, plast, metal og organisk affald fra dagrenovation. Miljøprojekt nr. 1458. 2013. Available online: https://www2.mst.dk/Udgiv/publikationer/2013/01/978-87-92903-80-8.pdf (accessed on 31 December 2017).
- IADB—Inter-American Development Bank (2015) Solid Waste Management in Latin America and the Caribbean. Available online: https://publications.iadb.org/handle/11319/7177#sthash.1YBgmSCS.dpuf (accessed on 31 December 2017).
- Münnich, K.; Mahler, C.F.; Fricke, K. Pilot project of mechanical-biological treatment of waste in Brazil. Waste Manag. 2006, 26, 150–157. [Google Scholar] [CrossRef] [PubMed]
- Tsilemou, K.; Panagiotakopoulos, D. Approximate cost functions for solid waste. Waste Manag. Res. 2006, 24, 310–322. [Google Scholar] [CrossRef] [PubMed]
- Christensen, T. Solid Waste Technology and Management; Wiley: Chichester West Sussex, UK, 2011; ISBN 978-1-405-17517-3. [Google Scholar]
- Friends of the Earth. More Jobs, Less Waste. 2010. Available online: https://www.foeeurope.org/sites/default/files/publications/foee_more_jobs_less_waste_0910.pdf (accessed on 31 December 2017).
- European Commission, Directorate-General Environment. 2001. Effects of Waste Management Policies. Available online: http://ec.europa.eu/environment/enveco/waste/pdf/waste_management_employment.pdf (accessed on 31 December 2017).
- Veolia (2017) Weekly Update—Invitation to Respond [Veolia—Mexico Thermo-Valorization]. Available online: https://business-humanrights.org/sites/default/files/documents/Business%20and%20Human%20Right%20Resource%20Center%20Answer_EN_veolia.pdf (accessed on 31 December 2017).
- Ishizaka, A.; Labib, A. Analytic hierarchy process and expert choice: benefits and limitations. OR Insight 2009, 22, 201–220. [Google Scholar] [CrossRef] [Green Version]
- Brunner, P.H.; Rechberger, H. Waste to energy-key element for sustainable waste management. Waste Manag. 2015, 37, 3–12. [Google Scholar] [CrossRef] [PubMed]
- Vujic, G.; Stanisavljevic, N.; Batinic, B.; Jurakic, Z.; Ubavin, D. Barriers for implementation of ‘‘waste to energy’’ in developing and transition countries: a case study of Serbia. JSMCWM 2017, 19, 55–69. [Google Scholar] [CrossRef]
Figure 1.
MSW waste composition in Mexico City 2017.

Figure 2.
Mass flows of waste scenarios: (a) baseline scenario; (b) scenario with MBT.


Figure 3.
Mass flows of waste scenarios: (a) scenario with wet AD; (b) scenario in compliance with Norma 024.
Figure 3.
Mass flows of waste scenarios: (a) scenario with wet AD; (b) scenario in compliance with Norma 024.


Figure 4.
Ranking of indicators with respect to the goal.

Figure 5.
Ranking of scenarios.

Figure 6.
Results of sensitivity analysis: Case 1, Case 2, Case 3.

Figure 7.
Results of sensitivity analysis: Case 4, Case 5.


Table 1.
Description of the discussed scenarios.
| Scenario | Description |
|---|---|
| Scenario a | Landfilling without landfill gas utilization 1928.33 Mg per day of waste (paper, cardboard, plastic, metal, and glass) is recycled, 1324.72 Mg per day of waste is composted, 69.09 Mg of waste is used for RDF production, 8745.21 Mg per day of waste is landfilled. |
| Scenario b | Mechanical–Biological treatment 2878.05 Mg per day (paper, cardboard, plastic, metal, and glass) is recycled, 1508.22 Mg per day of organic waste (food and garden waste) is composted, the rest is landfilled. |
| Scenario c | Anaerobic digestion with biogas utilization 2006.77 Mg per day of waste (paper, cardboard, plastic, metal, and glass) is recycled, 2501.97 Mg per day of waste is sent to anaerobic digestion plant, 940.36.98 Mg of waste is used for RDF production, the rest is landfilled. |
| Scenario d | Incineration with energy recovery 2006.77 Mg per day (paper, cardboard, plastic, metal, and glass) is recycled, 2652.79 Mg per day of residual waste is sent to incineration plant. |
Table 2.
Example of ranking questionnaire for the experts.
| Indicators | Ranking of Importance | Indicators | |||||||||||||||||
|---|---|---|---|---|---|---|---|---|---|---|---|---|---|---|---|---|---|---|---|
| Extreme importance | Very strong importance | Strong importance | Moderate importance | Equal importance | Moderate importance | Strong importance | Very strong importance | Extreme importance | |||||||||||
| Landfill disposal rate | 9 | 8 |  | 6 | 5 | 4 | 3 | 2 | 1 | 2 | 3 | 4 | 5 | 6 | 7 | 8 | 9 | Recycling rate | |
| Landfill disposal rate | 9 | 8 | 7 | 6 | 5 | 4 | 3 | 2 | 1 | 2 | 3 | 4 |  | 6 | 7 | 8 | 9 | GHG emissions | |
Use the scale from 1 to 9 (where 9 is extreme importance and 1 of no importance) to indicate the relative importance of indicator in the left column to the indicator in the right column. Between 1 and 9, all situations are intermediate. Only one entry can be made in each row.
Table 3.
Evaluation of indicators.
| Category | Criteria | Baseline | AD | MBT | Incineration | Source |
|---|---|---|---|---|---|---|
| Overall waste management performance | Landfill disposal rate (%) | 86 | 64 | 60 | 56 | Calculated by the authors (Mg of landfilled MSW/Mg of MSW collected) |
| Recycling rate through formal sector (%) | 1 | 2 | 11 | 2 | Calculated by the authors (Mg of recycled MSW/Mg of MSW collected) | |
| Environment | GHG (MgCO2eq Mg MSW−1) | 0.458 | 0.175 | 0.03 | −0.04 | LCIA IPCC2007 Analysis made in Easetech. Available in Supplementary Material |
| Nitrogen oxides (kg) | 0.547 | −0.14 | −2.64 | 0.27 | LCI Analysis made in Easetech. Available in Supplementary Material | |
| Biochemical oxygen demand (BOD) (kg) | 0.27 | 0.21 | 3.66 | 0.39 | LCI Analysis made in Easetech. Available in Supplementary Material | |
| Mercury in soil (kg) | 0.000003 | 0.00009 | 0.000002 | 0.000002 | LCI Analysis made in Easetech. Available in Supplementary Material | |
| Economics | Investment costs ($ Mg−1) | 0 | 13.67 | 415.92 | 94 | Tsilemou and Panagiotakopoulos, 2006; Münnich, 2005 |
| Operation costs ($ Mg−1) | 8.53 | 26.73 | 429.99 | 44.40 | Tsilemou and Panagiotakopoulos, (2006), Münnich, 2005; IDB (2015) | |
| Social | Social acceptance | 9 | 8 | 6 | 3 | Evaluations done by authors based on the interview |
| Number of jobs (Persons/day) | 320.76 | 12.83 | 32.77 | 14 | Calculated by authors based on Friends of the Earth (2010), European Commission, Directorate-General Environment (2001) Employment Effects of Waste Management Policies, SEDEMA (2016) |
© 2018 by the authors. Licensee MDPI, Basel, Switzerland. This article is an open access article distributed under the terms and conditions of the Creative Commons Attribution (CC BY) license (http://creativecommons.org/licenses/by/4.0/).
Share and Cite
MDPI and ACS Style
Tsydenova, N.; Vázquez Morillas, A.; Cruz Salas, A.A. Sustainability Assessment of Waste Management System for Mexico City (Mexico)—Based on Analytic Hierarchy Process. Recycling 2018, 3, 45. https://doi.org/10.3390/recycling3030045
AMA Style
Tsydenova N, Vázquez Morillas A, Cruz Salas AA. Sustainability Assessment of Waste Management System for Mexico City (Mexico)—Based on Analytic Hierarchy Process. Recycling. 2018; 3(3):45. https://doi.org/10.3390/recycling3030045
Chicago/Turabian StyleTsydenova, Nina, Alethia Vázquez Morillas, and Arely Areanely Cruz Salas. 2018. "Sustainability Assessment of Waste Management System for Mexico City (Mexico)—Based on Analytic Hierarchy Process" Recycling 3, no. 3: 45. https://doi.org/10.3390/recycling3030045