Article

Characterization of Polystyrene Wastes as Potential Extruded Feedstock Filament for 3D Printing

Fiber Composite Laboratory, School of Energy Systems, Lappeenranta University of Technology, 53850 Lappeenranta, Finland
*
Author to whom correspondence should be addressed.
Recycling 2018, 3(4), 57; https://doi.org/10.3390/recycling3040057
Submission received: 24 October 2018 / Revised: 21 November 2018 / Accepted: 22 November 2018 / Published: 28 November 2018

Abstract

:
The recyclability of polystyrene, acrylonitrile butadiene styrene and polyvinylchloride waste and their use as a source for 3D printing were studied. Filaments of about 3 mm in diameter were extruded successfully with a small-size extruder. The processed filaments were tested on a broad range of parameters-melt flow index, glass transition temperature, tensile properties and a pyrolysis scenario were obtained. The measured parameters were compared with parameters of virgin counterparts presented in the literature. In order to estimate the composition of the recycled material, Fourier Transform Infrared and elemental analysis of the samples was done.

Graphical Abstract

1. Introduction

Plastic, being a highly versatile and resource-efficient material, has become irreplaceable material in many economic sectors, such as packaging, building and construction, transportation, and renewable energy, among others [1]. Growing plastic production and consumption have led to an increasing dependence of plastic manufacture from fossil fuel, the main resource for plastic processing, as well as to an increase of plastic waste. Statistics show that of the 27.1 million tons of post-consumer plastic collected in 2016, 31.1% was recycled, 41.6% incinerated and 27.3% landfilled. Thus, a large portion of plastic is still landfilled; however, this was the first time in Europe when recycling overcame landfill [1]. In the European Commission Action Plan for a circular economy from 2015, plastic production is identified as a key priority [2]. The circular plastic economy vision is based on the need for innovative solutions for developing new sustainable products, durable with a long lifespan, and for high-quality recyclable products after use. Among other waste management options, mechanical recycling of plastics is the most resource-effective, providing also more jobs than landfilling or incineration [3]. However, mechanical recycling can be limited by the presence of toxic components in the recyclant [4,5].
Recently, 3D printing technology, related to additive or direct manufacturing, has developed rapidly, raising interests in many fields of business and household services. Unlike conventional manufacturing, direct manufacturing makes it possible to manufacture product by using computer-aided design (CAD) software or online services for product model design, whereby avoiding some intermediate stages. Such flexibility in design options allows to organize manufacturing at small companies, e.g., home 3D printing and local fabrication at a printshop [6]. Yet, 3D printing is a way for effective use of raw materials, minimizing waste and saving energy and other resources. Moreover, using “household”-scale recycling systems can be an alternative to centralized recycling due to the fact that some negative environmental impacts can be overcome. The collection, transport and transfer (CTT) of recyclable waste plays a significant part in greenhouse gas emissions from the total global warming potential of the recycling process [7].
The rapid development of 3D printing technology also includes development of the technology of 3D printer filaments. Today, multiple companies are specialized in the production and distribution of them [8,9,10]. The most popular plastics in 3D printing technology are acrylonitrile-butadiene-styrene (ABS) and polylactic acid (PLA). Local recycling presumes that the filaments are produced from local recycled material and the quality of this material influences its recyclability, e.g., the quality of the final product. Examples of virgin and secondary plastic waste processing by using a small-scale filament extruder that converts plastic (chips, particles) into filament can be found in the literature. Baechler et al. studied the applicability of small-scale extruder for the processing of high density polyethylene (HDPE) filament [7]. Their study was focused on the estimation of filament uniformity, time of processing, and energy consumption. Mirón et al. studied influence of extrusion temperature on other extrusion parameters of PLA, such as extrusion speed and filament diameter and regularity [11]. Researchers also showed that the mechanical properties of the processed filament were similar to a commercially available one. Anderson compared 3D printed samples from virgin and recycled PLA and found that their mechanical properties are comparable or even higher for samples made from recycled source [12]. However, variability in the results of the recycled materials was significantly higher in comparison to virgin ones. Zander et al. showed that the tensile strength of printed material from recycled polyethylene terephthalate (PET) was equivalent to printed samples from commercial PET [13]. Moreover, commercial B-PET 3D filaments 100% made from recycled post-consumer PET bottles have been available on the market since 2015 [10].
The main aim of this study was to estimate the recyclability of ABS, polystyrene (PS) and polyvinylchloride (PVC) plastic waste, i.e., to measure the mechanical and physical properties of filaments manufactured from these plastics and to compare them with virgin grades. In addition, possible chemical contaminants that can present in plastic waste were also estimated. Plastic waste was collected from a local landfill or obtained from commercial companies. The plastics were separated into singular plastic grades. The samples for testing were manufactured by using a Filabot extruder. The extruded material was studied for its mechanical properties (tensile strength and modulus), melt flow index, and glass transition temperature, and a thermal degradation scenario was obtained. Elemental analysis of the samples was performed by using energy-dispersive X-ray spectroscopy (EDS). Emitted volatiles during pyrolysis were measured by a mass spectrophotometer (MS).

2. Materials and Methods

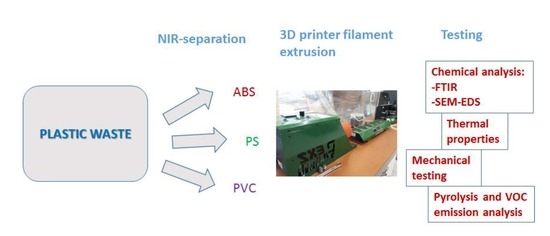
2.1. Plastic Sources and Filament Manufacturing

The materials were obtained from the companies Etelä-Karjalan Jätehuolto Oy (Lappeenranta, Finland) and Destaclean Oy (Tuusula, Finland). From the mixed plastic waste, three plastic types, ABS, PVC and PS were extracted by using a near infrared (NIR) spectroscopy device (Thermo ScientificTM MicroPHAZIRTM PC Analyzer for Plastic, Waltham, MA, USA). The plastic fragments were reduced to approx. 0.5 cm-sized flakes and then extruded by using a low speed extruder Filabot EX2 (Barre, VT, USA). The PVC filaments were extruded at 196 °C, PS at 200 °C and ABS at 180 °C constant temperatures, cooled with an Airpath-device (Tamil Nadu, India) using forced convection at ambient temperature. The extrusion flow rate was adjusted manually for each material. The diameter of the extruded filament was approx. 3 mm.

2.2. Melt Flow Index

Experimental melt flow index (MFI) was measured by using Dynisco LMI 5000 (Dynisco, Franklin, MA, USA) in accordance with standard EN ISO 1133-1. The MFI of ABS and PS was measured at 220 °C and 200 °C, respectively.

2.3. Fourier-Transform Infrared Analysis (FTIR)

Extruded filaments were analyzed with the Fourier-transform infrared (FTIR) technique. An FTIR spectrometer (Perkin-Elmer, Buckinghamshire, UK) equipped with an attenuated total reflection (ATR) device (MIRacle PIKE Technologies, Madison, WI, USA) with zinc selenide crystal was used. The spectra were collected by co-adding 4 scans at a resolution of 4 cm−1 in the range from 4000 to 400 cm−1.

2.4. Tensile Property Testing

The tensile tests of the filaments were performed according to EN-527 standard on a Zwick Z020 machine (Ulm, Germany). The cross-head speed was 2 mm/min for modulus testing and 50 mm/min for the other measurements. The gauge length was 25 mm. The test samples, 120 mm long filaments were cut from a trial sample, conditioned according to above standard. Tests were carried out with 12 sample replicates.

2.5. Differential Scanning Calorimeter (DSC) and Thermogravimetric Analysis (TGA)

Thermal analysis measurements were performed by mean a differential scanning calorimeter (DSC), and thermogravimetric analysis (TGA) with a linear temperature increase (Simultaneous TG-DTA/DSC Apparatus STA 449 C/4/MFC/G/Jupiter®, NETZSCH-Gerätebau GmbH, Selb, Germany). DSC was performed under a nitrogen atmosphere, at a 40 mL/min flow rate and heating rate of 10 °C/min. The sample of approx. 10 mg, was placed in an aluminum pan and heated from 25 to 200 °C and then cooled down to 25 °C after keeping at 200 °C for 10 min. This procedure was done twice, and the thermogram of the second scan was used for the analysis. For thermogravimetric analysis, approx. 10 mg of the specimen was heated from 25 °C to 800 or 900 °C at a rate of 10 °C/min under a helium atmosphere of 40 mL/min at a constant flow rate. Evolved gas emission (EGA) during TGA was analyzed by using a mass spectrophotometer (MS 403C Aëolos Mass Spectrophotometer, NETZSCH-Gerätebau GmbH, Selb, Germany) which was coupled with TGA. The MS analysis was limited to 160 m/z. The results were interpreted with N-Proteus® software (NETZSCH-Gerätebau GmbH, Selb, Germany. For further EGA spectra interpretation, the database “NIST Chemistry WebBook 69” was used [14].

2.6. Scanning Electron Microscope (SEM) Analysis and Energy-Dispersive Spectroscopy (EDS)

The surface morphology of the samples was studied with a scanning electron microscope (SEM), Hitachi SU3500 (Chiyoda, Tokyo, Japan). Surfaces were observed directly after processing as well as surface fracture after the tensile testing. Elemental analysis was performed with energy-dispersive X-ray spectroscopy (EDS) (Thermo Scientific, Waltham, MA, USA). The results were interpreted with Pathfinder software (PathfinderTM X-ray Microanalysis Software, Thermo Scientific, Waltham, MA, USA).

3. Results and Discussion

3.1. Melt Flow Index (MFI)

Table 1 presents the measured MFI parameters for the recycled polymers and parameters found in the literature for virgin ones. According to the results, the MFI value of recycled ABS was significantly lower than that of the virgin one, 8.9 and 15 g/10 min or 43.1 g/10 min [15,16], respectively. The MFI of the PS, 11.5 g/10 min, was very close to the virgin grade, 12–16 g/10 min. The MFI of virgin rigid PVC varies from 1.4 to 60 g/10 min [17]. The attempts to measure the MFI of recycled PVC were not successful due to the material degrading and clogging the equipment during testing. MFI is sensitive to environmental impact and thermomechanical stress, e.g., during lifecycle and reprocessing. Jin et al. who studied the influence of multiple extrusion on the flow properties of low-density polyethylene (LDPE) reported that MFI decreased from 2.31 g/10 min to 0.02 g/10 min after 100 extrusions [18].

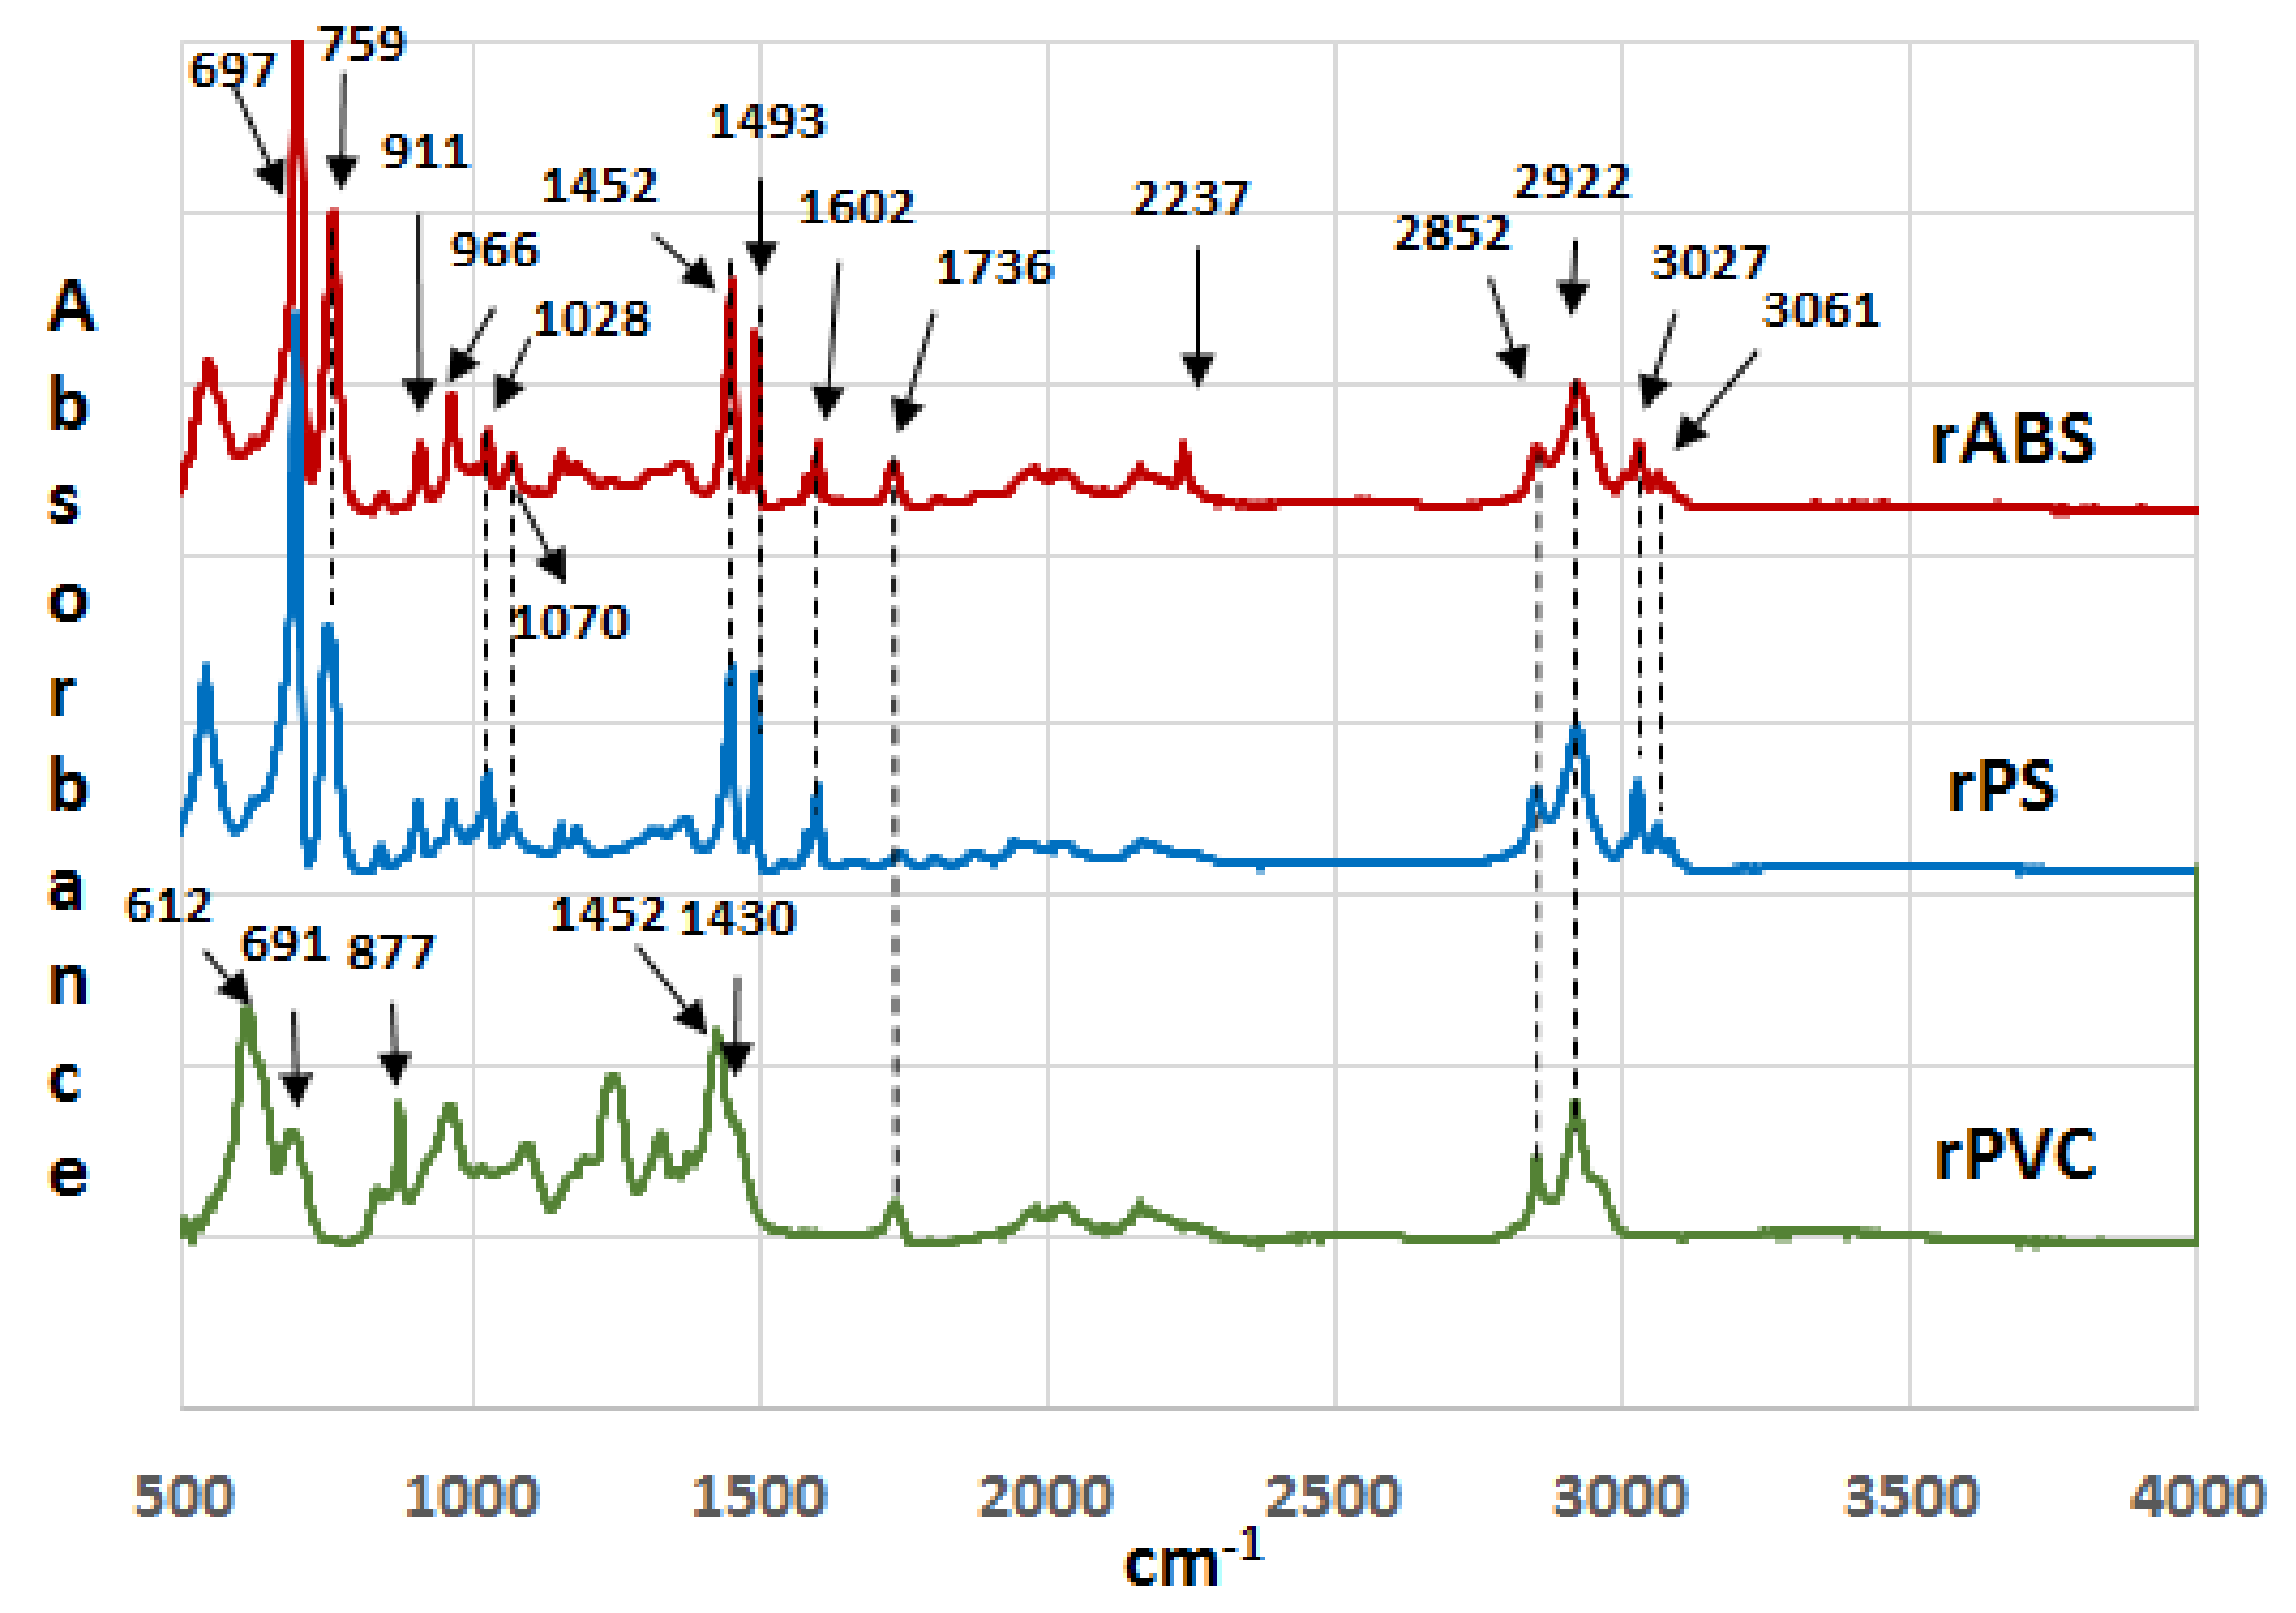
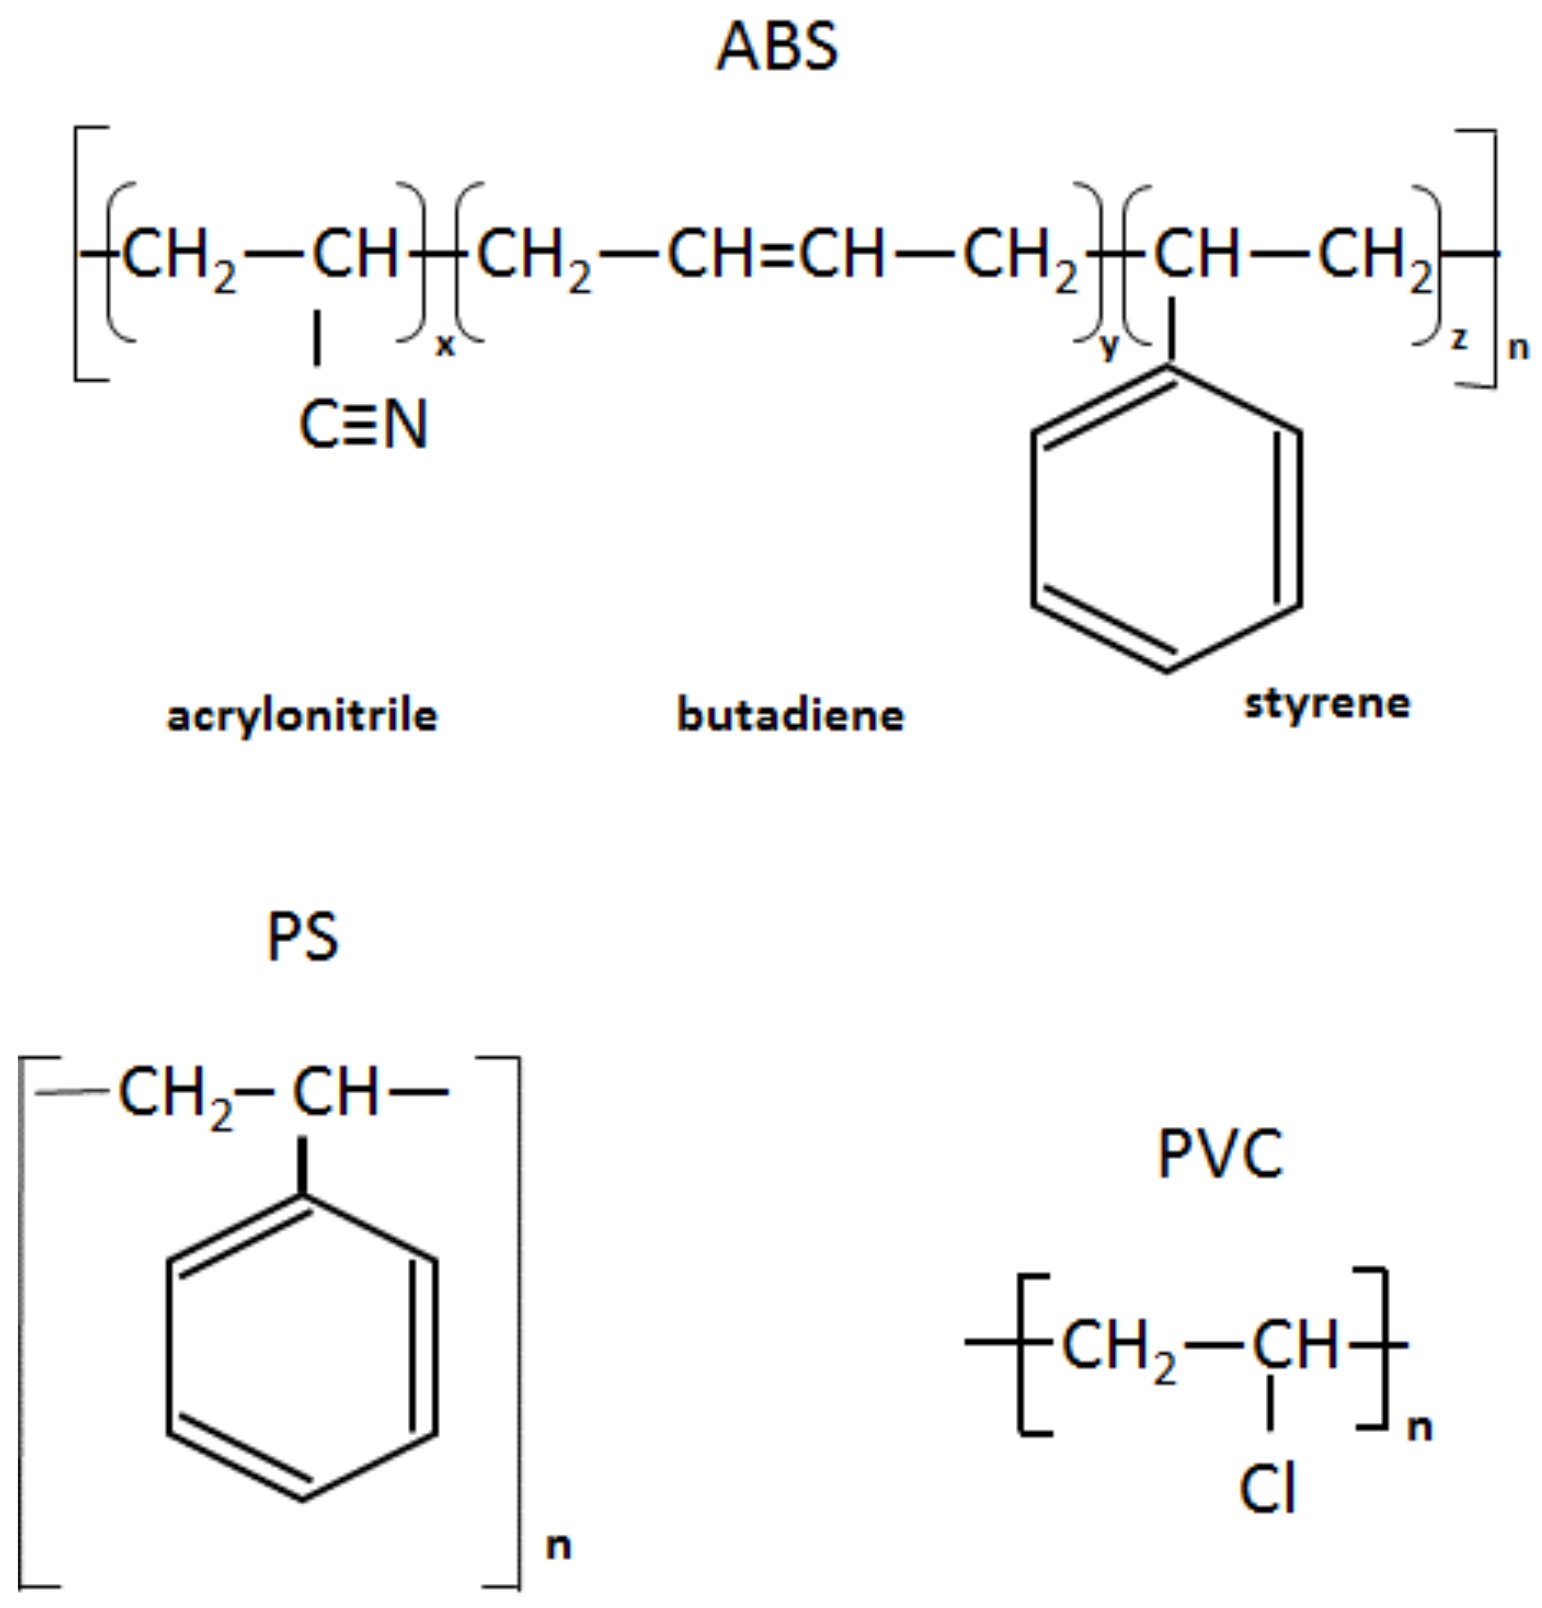
3.2. Fourier-Transform Infrared Analysis

Infrared spectra of the recycled (rABS, rPS and rPVC) samples are shown in Figure 1. Comparative analysis of the samples with virgin counterparts, whose spectra are available in the literature, show that the samples are homogeneous, e.g., without noticeable impurities. The similarity in the molecular structure of ABS and PS, Figure 2, is also reflected in the similarity of their FTIR spectra. The characteristic peaks of ABS and PS, the C–H stretching vibration aromatic, at 3200–3000 cm−1, and aliphatic, at 3000–2800 cm−1, are clearly observed in both spectra. The band at 2237 cm−1 corresponds to the C≡N bond observed in the ABS spectra. The band at 1736 cm−1, oxygen containing carbonyl groups (C=O) band is probably due to an oxidation process in the polymers during usage [20]. The peaks at 1602 cm−1 and 1592 cm−1 correspond to C=C aromatic double bond-stretching vibration. The absorptions at 1493 cm−1 and 1452 cm−1 are also due to carbon–carbon stretching vibrations in the aromatic ring. However, the band at 1452 cm−1 may have resulted from both ring breathing of the benzene ring and the deformation vibration of –CH2 [21]. The peaks at 1070 cm−1 and 1028 cm−1 are in-plane C–H bending of the aromatic ring. The two peaks at 757 cm−1 and 697 cm−1 are due out-of-plane aryl C–H bending for the (mono)substituted benzene ring. The absorbance bands at 966 cm−1 and 911 cm−1 in the ABS spectra correspond to C=C unsaturation (vinyl) in polybutadiene, and the 1,2 butadiene terminal vinyl C-H band, respectively [22]. The PVC spectra are characterized by aliphatic C–H stretching vibration, 3000–2800 cm−1, the peak at 1452 cm−1 is due to –CH2 stretching vibration, and the peaks near 612 cm−1 and 691 cm−1 are due to C–Cl stretching vibration [23]. This spectrum also reveals the absence of phthalates, which have a specific region at 1620–1560 cm−1 [24]. Thus, this is consistent with the TGA-MS analysis, which also did not reveal phthalate emitting (see the section below). The peaks at 1430 cm−1 and 880 cm−1 might belong to calcium carbonate CaCO3 [25], the presence of which, i.e., Ca-ion, was detected by EDS analysis (see Table 2). The Ca-ion was also detected in the other samples, but in much smaller amounts than in PVC, which was the reason for the absence of CaCO3-specific regions in the IR spectra of ABS and PS. The ageing sign of rPVC could be detected by the presence of a peak near 1740 cm−1, the carbonyl groups region.

3.3. Differential Scanning Calorimeter (DSC) Analysis

The glass transition temperature, Tg, for the second and third heating-cooling cycles of the DSC analysis of the recycled polymers and their virgin counterparts, found in the literature, are listed in Table 3. As can be seen, the Tg of rPS and rPVC is lower than that of virgin ones. The Tg of rABS is similar to that of unprocessed conventional ABS [26]. Influence of additional heating-cooling cycle was insignificant for rPVC and rABS, however the Tg of rPS decreased by 2 degrees. The main reason for Tg changing is usually thermomechanical impact during reprocessing, as well as different external factors during material usage. During ageing, as known, random thermal scission or crosslinking can occur, which in turn decreases or increases Tg, respectively. However, changes in the Tg for recycled materials cannot be attributed solely to ageing due to other factors, as e.g., contaminants or additives, which are often present in recycled materials, can have an influence on the Tg parameter.

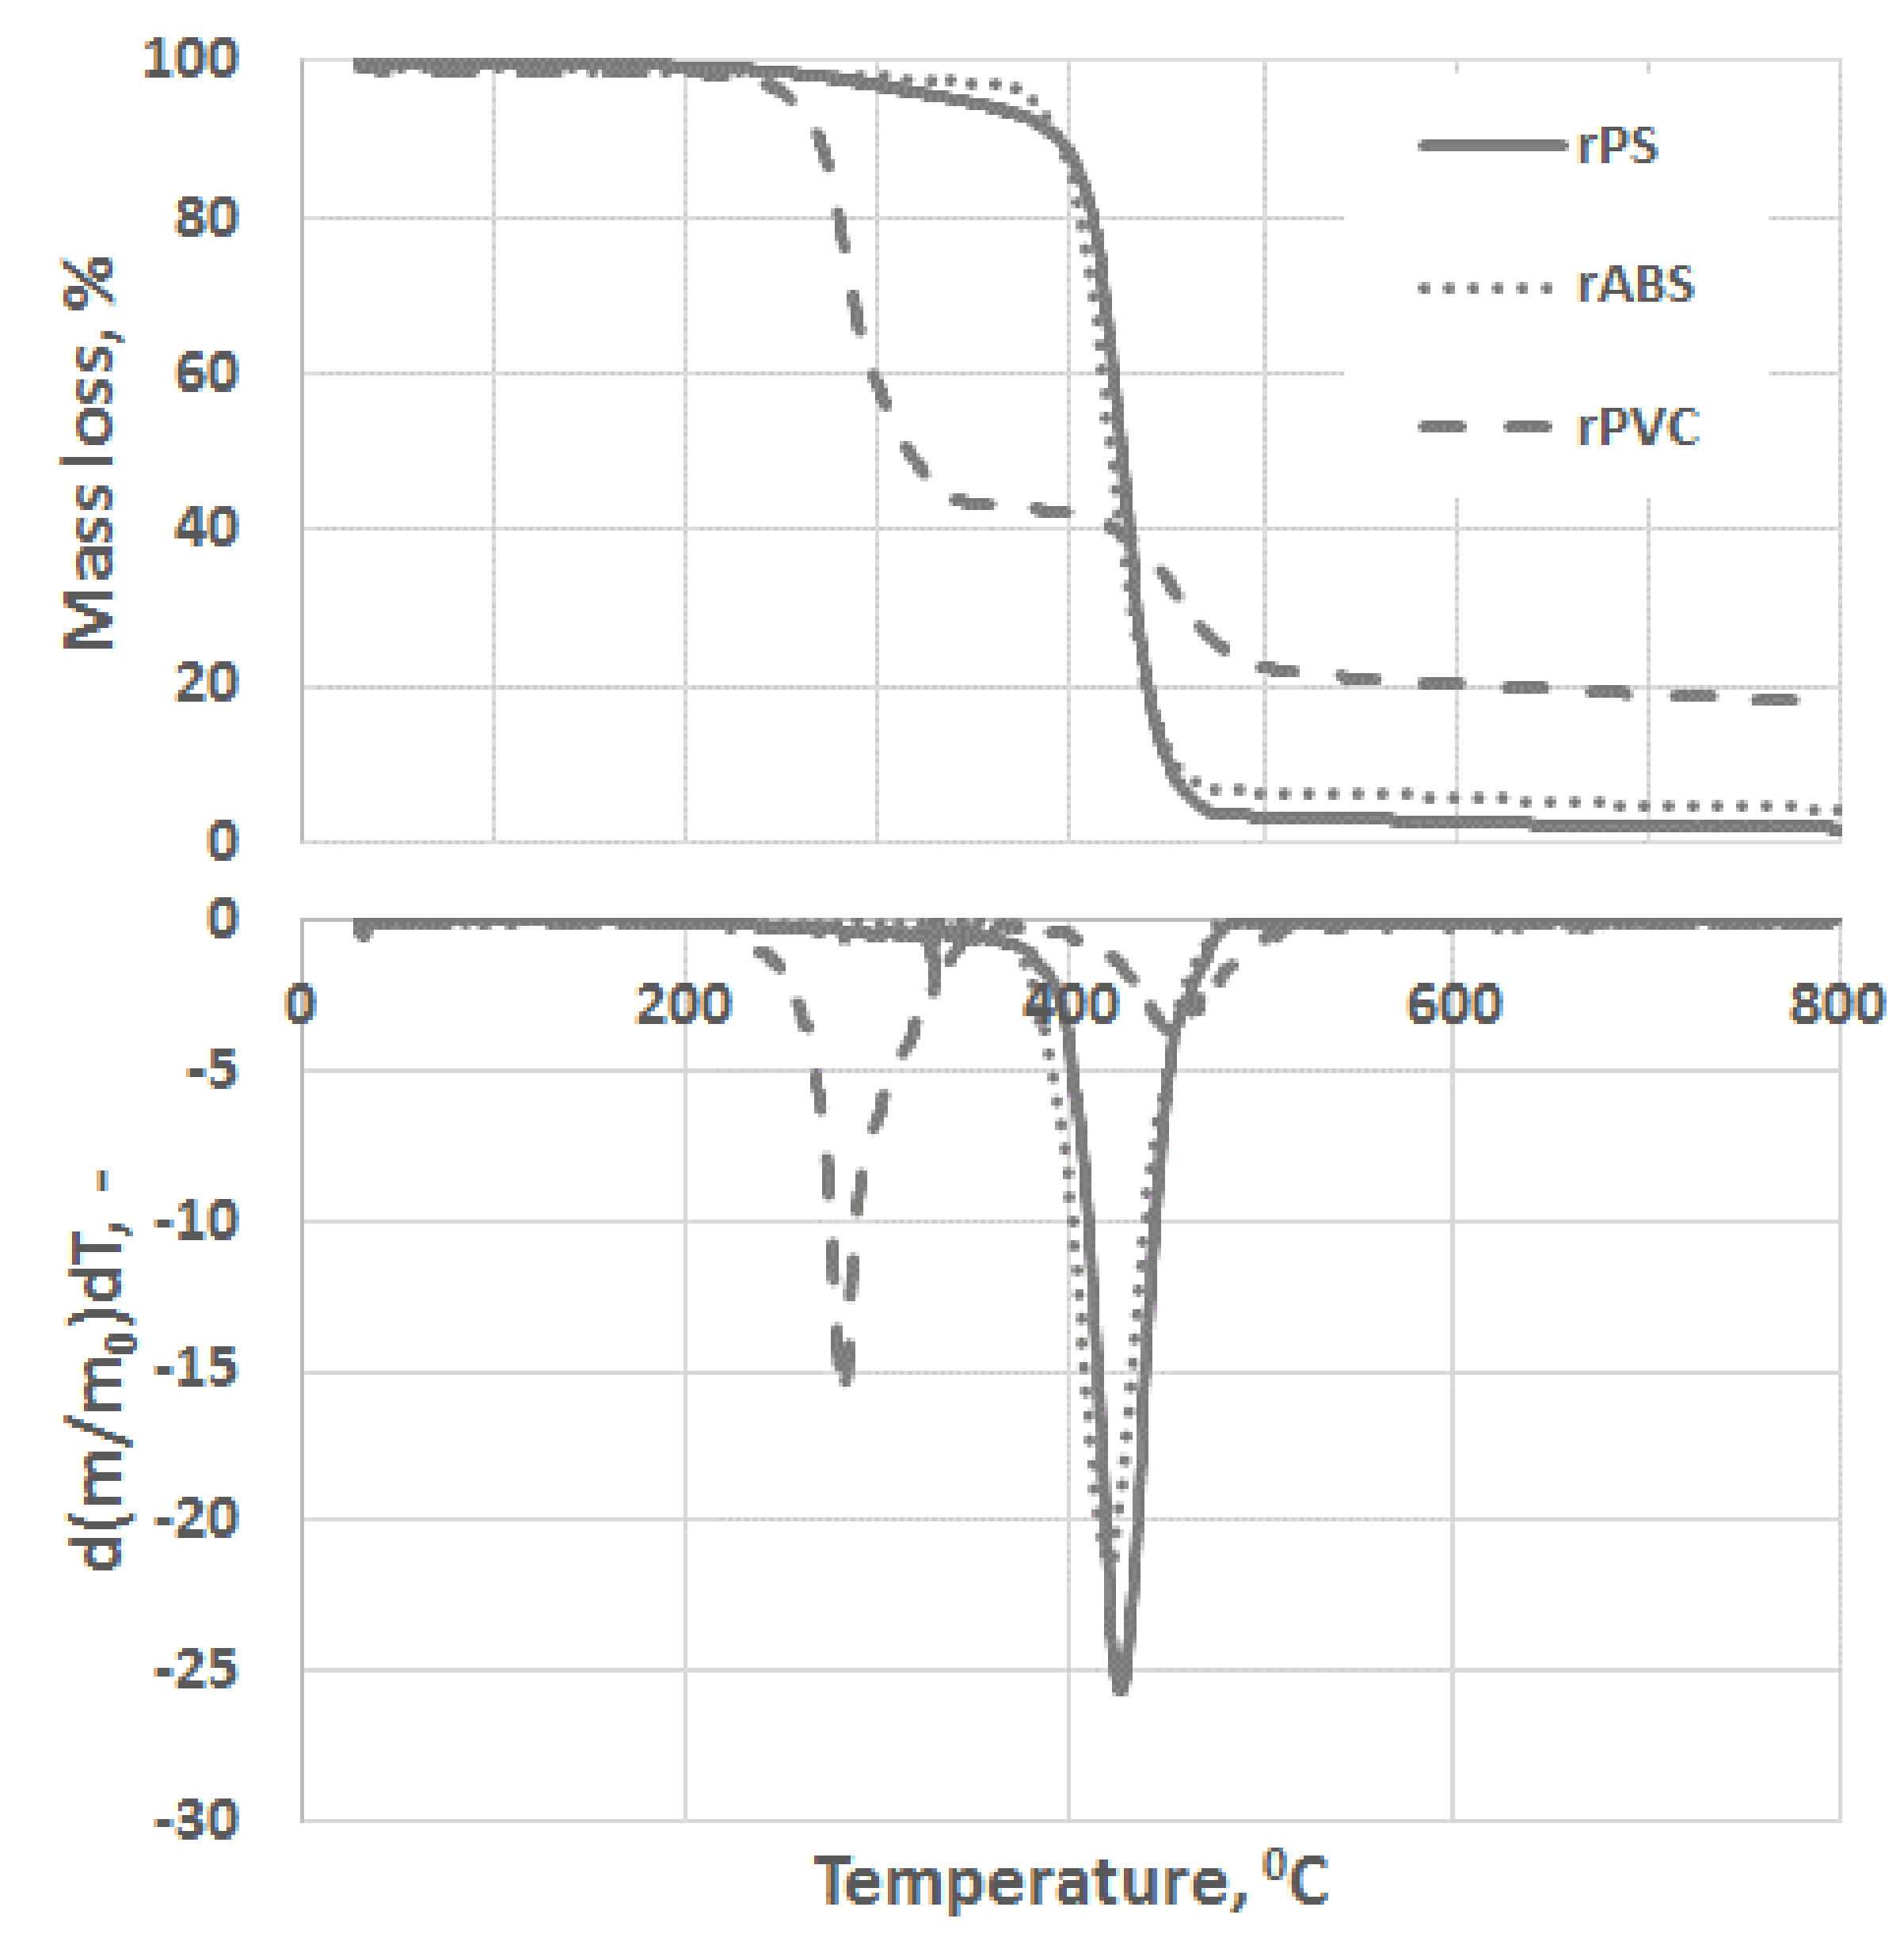
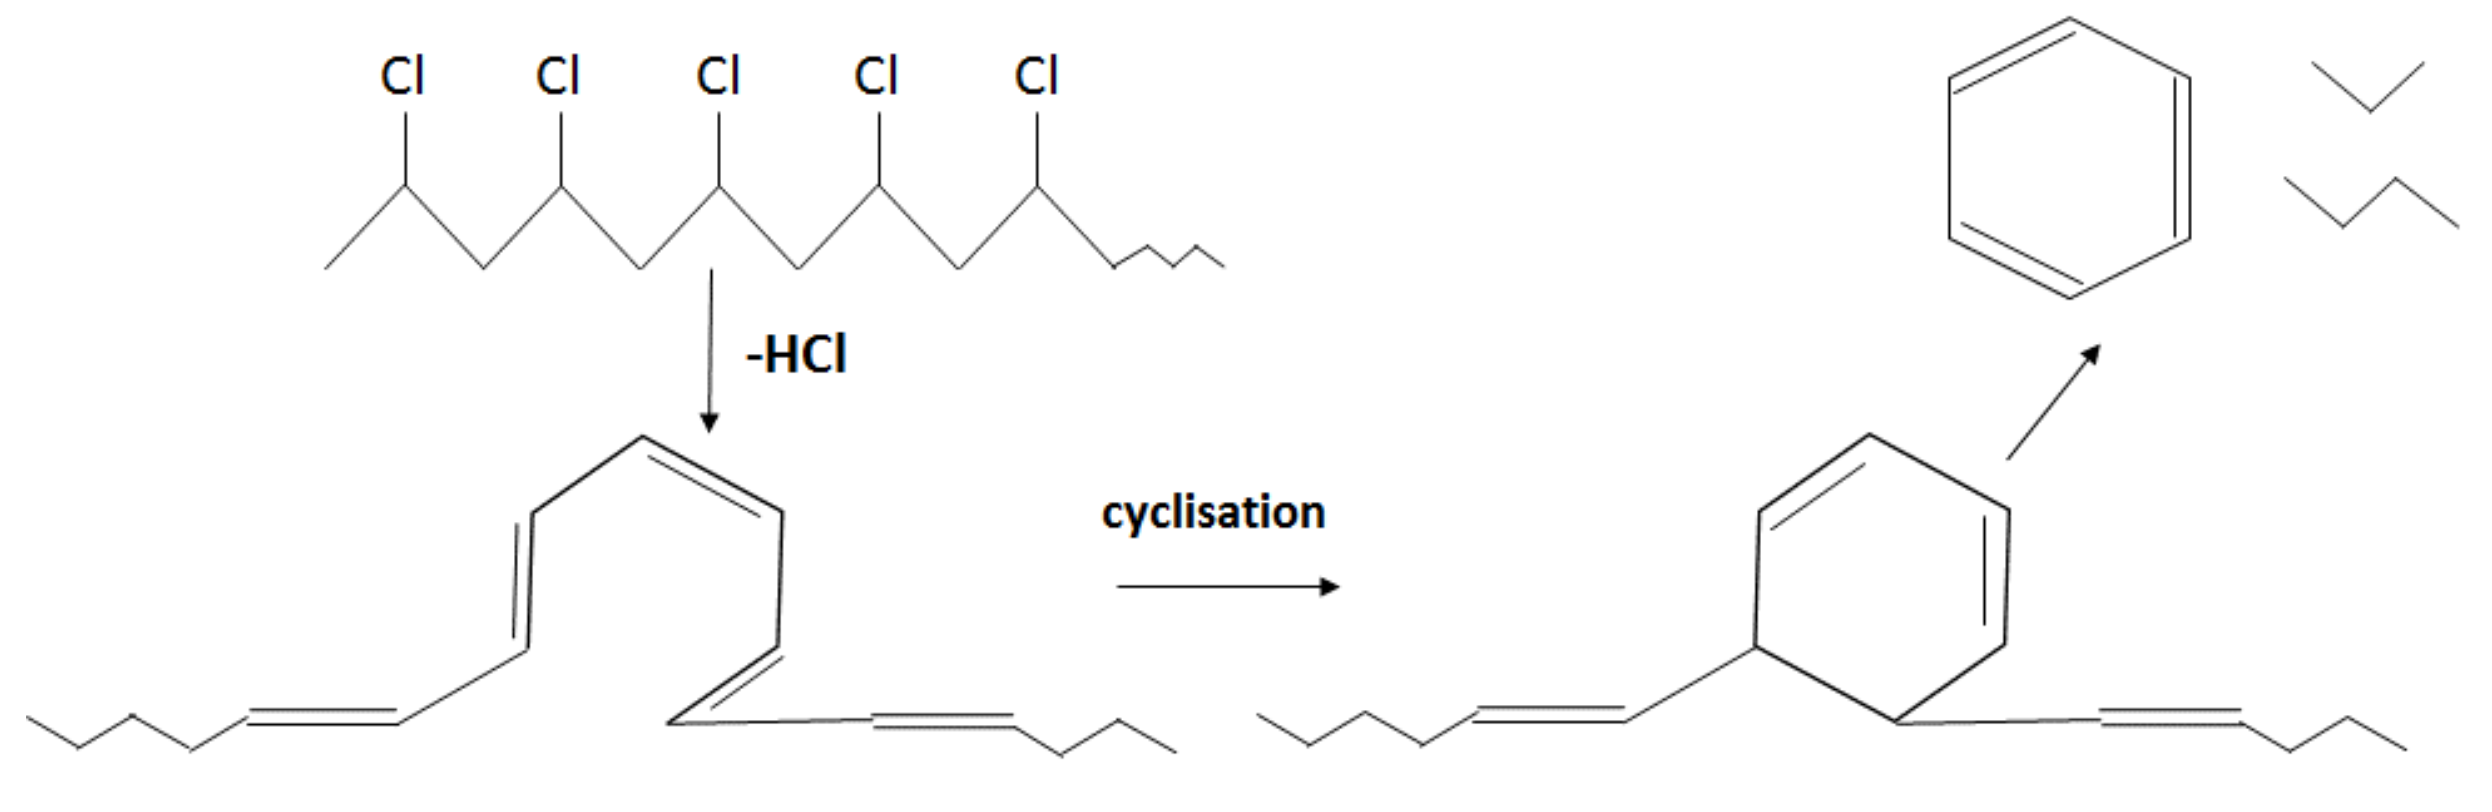
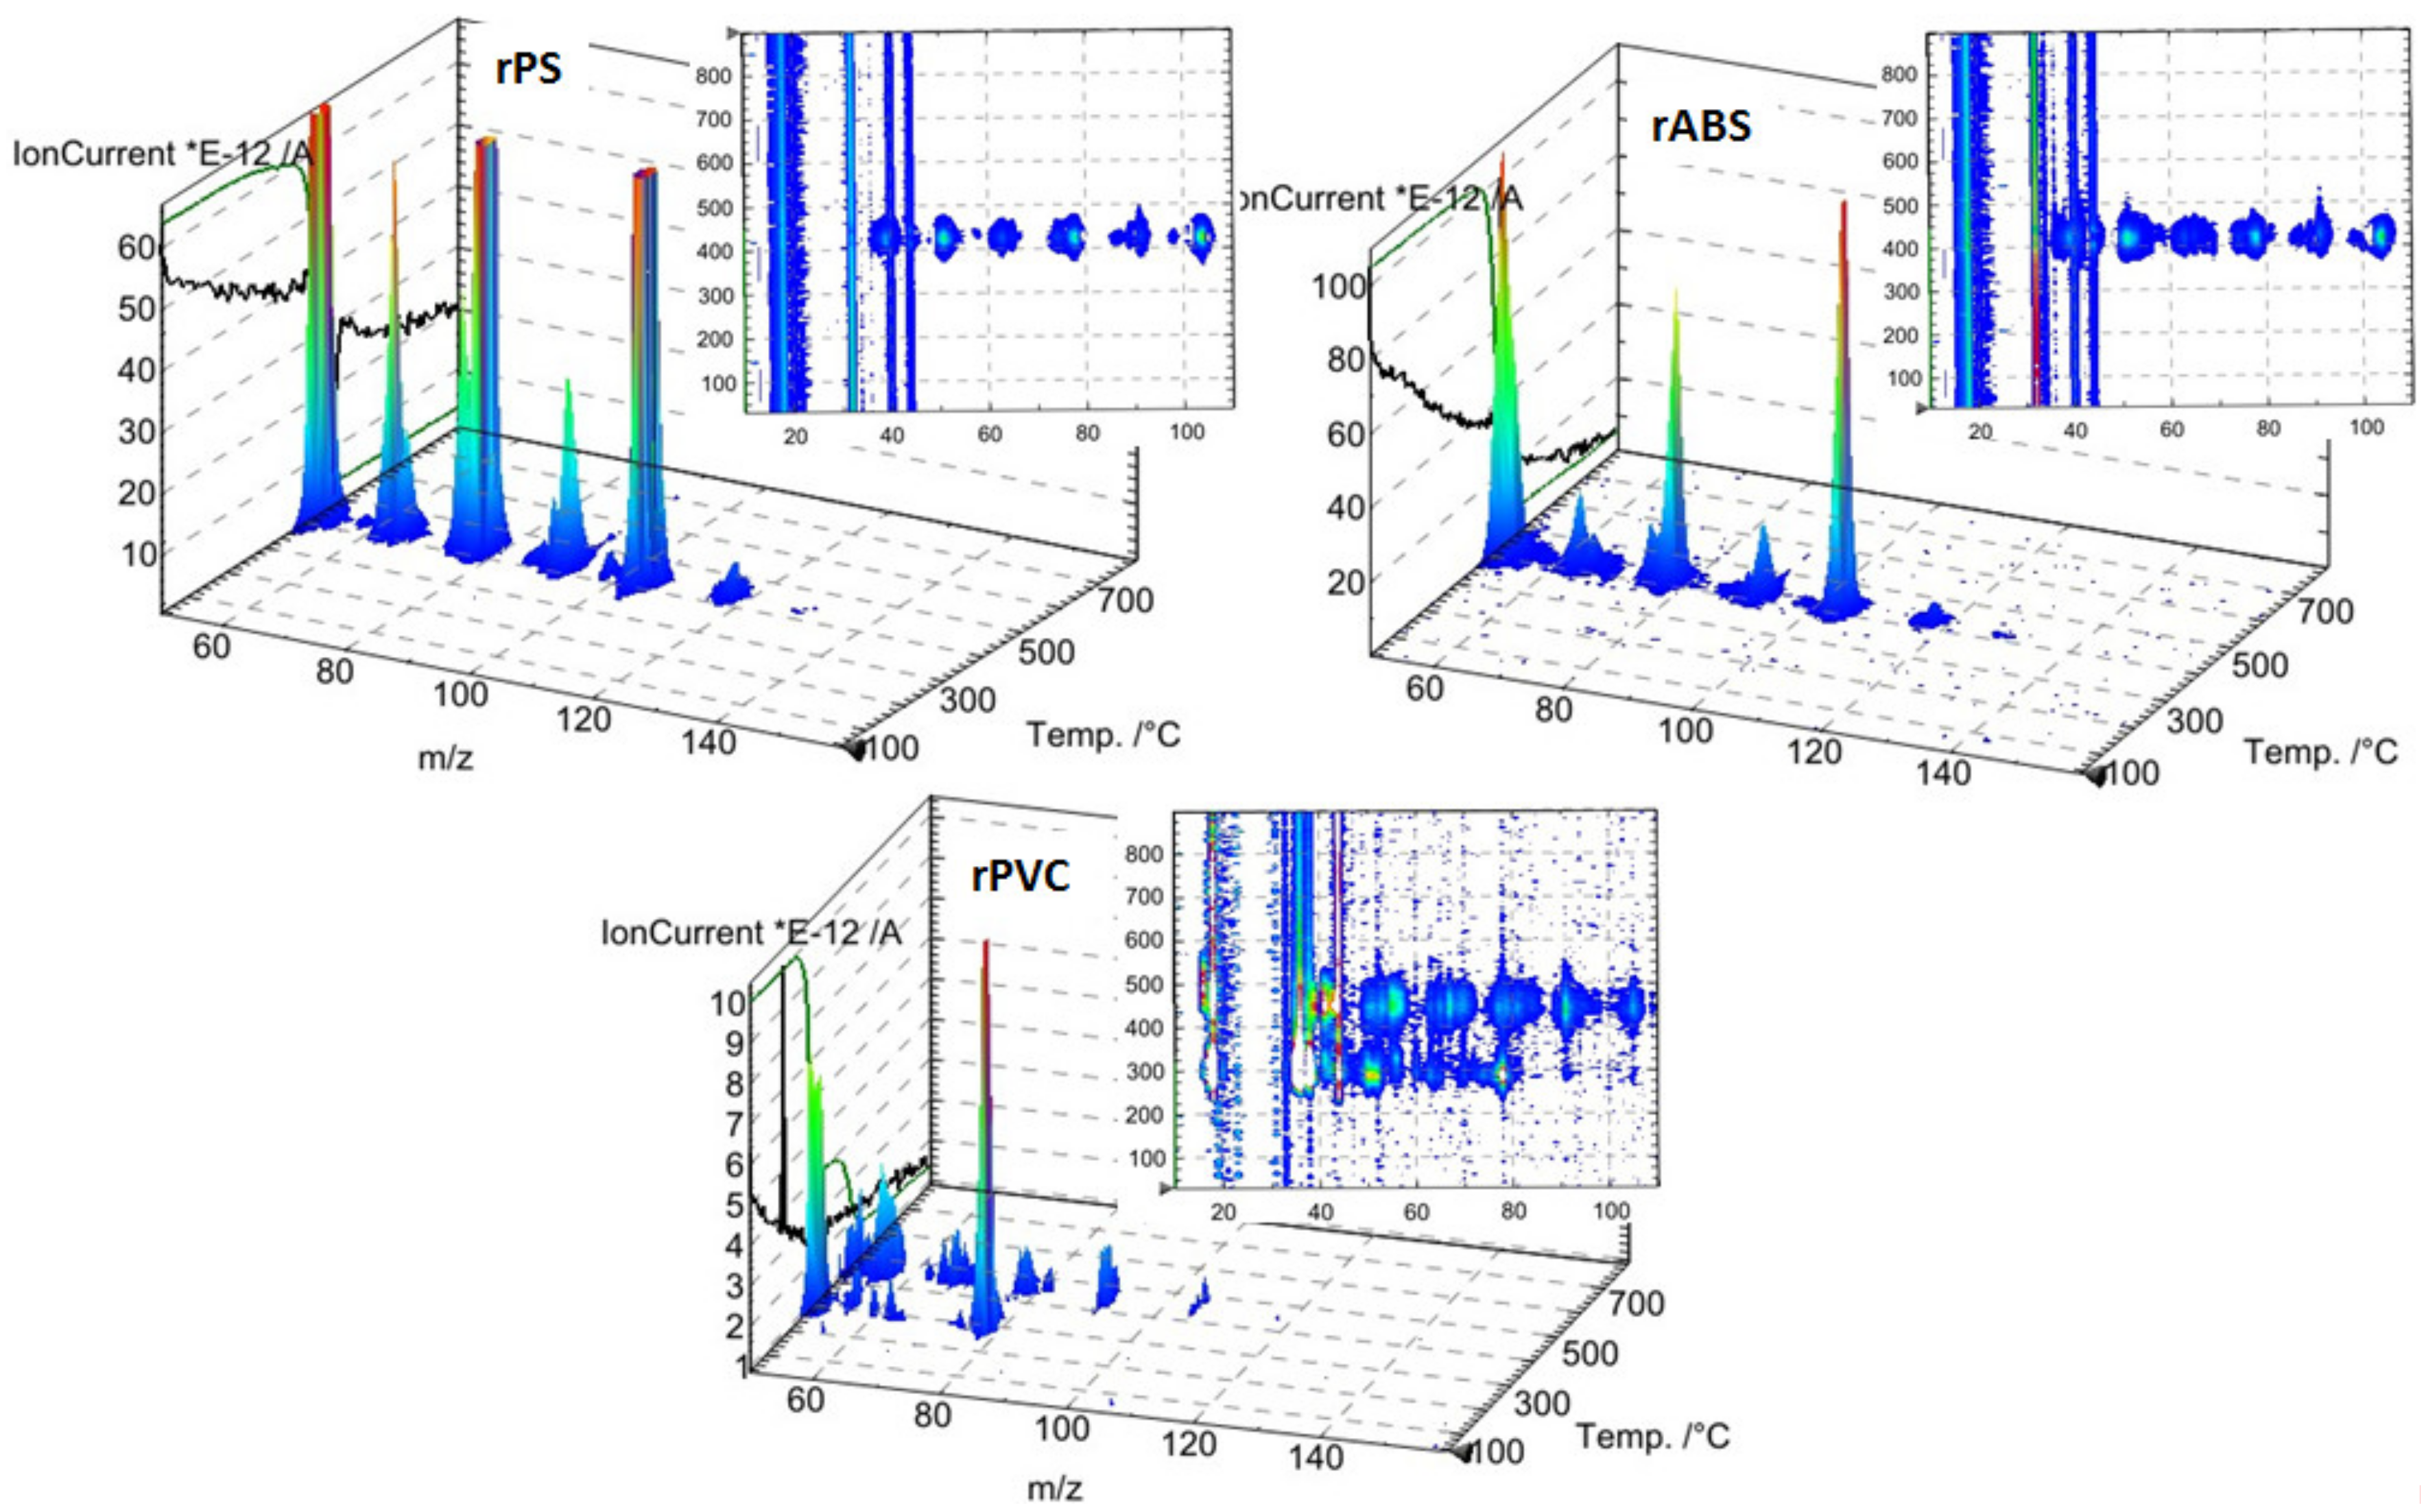
3.4. Heat Resistance and Thermal Stability

Experimental results of the thermal degradation of the polymers, mass losses, and the corresponding differential thermogravimetry (DTG) curves, are shown in Figure 3. As can be seen, PVC has a significantly faster mass loss rate compared to the ABS and PS grades. The sensitivity of PVC to heat is mostly related to the low binding energy of the C–Cl and thus process dechlorination starts at lower temperatures [28]. The low thermal stability of PVC is also associated with defects presence in the PVC structure, e.g., allylic and tertiary chloride moieties, which are formed during PVC polymerization [29]. This instability of PVC toward heat is compensated by leaving a large char portion at the end of pyrolysis. Char formation can be attributed to the formation of reactive carbonium-ion centers in the polymer, which act as an active center for crosslinking and char building [30].
Unlike in the other samples, the mass loss curve of PVC shows two steps, at the temperature region from 210 °C to 360 °C and from 360 °C to 540 °C, with peaks at 282 °C and 454 °C for the first and second steps, respectively (Figure 3). The mass losses were about 58 wt.% in the first step and in the second step about 83 wt.% as a whole. Such large amount of residue was formed due to carbonaceous char formation and presence of inorganic additives [29]. In general, virgin PVC burns incompletely under inert atmosphere, leaving up to 10 wt.% of carbon-rich char [31,32,33]. Based on this, the inorganic part of PVC can be estimated as about 7 wt.%. Two-step mass loss during PVC pyrolysis is well known and has been described in various reports [34,35]. Briefly, the decomposition of PVC starts from dehydrochlorination, elimination of HCl, followed by benzene formation through cyclization of (CH=CH)n [36]. This process is displayed schematically in Figure 4. Along with HCl and benzene, many other volatiles are generated during PVC burning, and can be detected with FTIR, gas chromatography (GC), and MS analyzers or their combinations [34,35,37,38]. In this study, the probable gas emission was estimated on the basis of the masses-to-charge ratios (m/z) of the volatiles released, and interpreted by using the “NIST Chemistry WebBook 69” data base [14] and compared with published results found in the literature. According to the emitted gas analysis, two main components, HCl (m/z 36, 38) and benzene (m/z 77, 78), were emitted during the first degradation step, see Figure 5. Intensive water vapor, a peak at m/z 17, 18, and a large peak at m/z 44 due to CO2 evolution were also detected. Oxygen-containing gases can probably be formed due to the presence of O-containing additives. The presence of O-ion in the PVC was detected by EDS analysis (see the chapter below). Xu et al. defined CO2 generation in the presence of ferrites, O-containing fire retardants, whereas pure PVC did not emit CO2 during pyrolysis in the inert atmosphere [35]. A few peaks at m/z 39–65 can be attributed to the generation of light aliphatic hydrocarbons, C2–C5 (m/z 39–65), also including chlorinated ones [34]. McNeill et al. studied virgin PVC thermal degradation and found evolution of aliphatic hydrocarbons, namely C10–C13 alkenes (m/z 55–57) and cyclopentene (m/z 67) [36]. The second step of PVC degradation, which is clearly distinguishable in the mass loss curve and the related gas emission diagram is due to the increased emission of aliphatic hydrocarbons as well as cyclic compound generation. Along with benzene (m/z 77, 78), other aromatic compounds, toluene (m/z 91, 92), styrene (m/z 51, 78, 104), C3–C5 alkyl benzenes (m/z 105) and ethylbenzene (m/z 104), and the isomers of xylene (m/z 106) were formed [36]. It can be said that these aromatic components were formed during the first step in small amounts, with significantly increased amounts during the second step, observed previously for virgin PVC pyrolysis [36]. Phthalates, which are often used in PVC manufacturing as plasticizers, were not detected. Phthalates can be identified by the presence of a peak at m/z 149 [39]. This is in line with the FTIR analysis, which did not detect a peak associated with phthalates either. In this study, rigid PVC from water tube PVC waste was used, where the amount of plasticizers should be very insignificant.
PS is a homopolymer where styrene is the monomer, see Figure 2. PS had one-step mass loss scenario with onset at 360 °C and offset at 500 °C, showing a DTG peak at 426 °C. The PS sample decomposed almost completely, with 2 wt.% residual material left. In general, pure PS burns completely without char, which was reported in various studies [40,41,42]. The small residue in our case can be attributed to the additives and possible contaminants that can be present in recycled materials. Mass spectrometry analysis of the evolved gases (Figure 5) showed ion currency peaks at 39, 51, 63, 65, 78, 91, 104, 117, 118 and 130 m/z. The signals at 51, 78 and 104 m/z belong to the styrene monomer; the peaks at 77 and 78 m/z originated from benzene; the peaks at 91 and 92 m/z came from toluene; and the signals at 118 and 130 m/z might belong to methylstyrene and phenylbutadiene, respectively [43]. Seleem et al. report that PS was pyrolyzed to toluene, styrene, benzaldehyde, and 4-phenyl-1-butyne [42].
The ABS polymer is a complex molecule composed of acrylonitrile (15 wt.%), butadiene (40 wt.%) and styrene (45 wt.%). The ABS molecule monomer is shown schematically in Figure 2. The sample showed one-step mass loss which started from 360 °C and completed at about 500 °C, leaving a residue of about 4 wt.%. The peak of mass loss was at 420 °C. This is consistent with a previously published result [43]. The evolved gas analysis of rABS showed that possible gases were acrylonitrile (m/z 53), benzene (m/z 77, 78), styrene (m/z 51, 78, 104), toluene (m/z 91, 92) and methylstyrene (m/z 118). The one-step pyrolysis of ABS was described in other reports [37,44]. However, in the quasi-isothermal TGA method multicomponent ABS showed more than one step mass loss due to the possibility of separation of overlapped decomposition events [44]. It was shown that ABS decomposed, first, styrene acrylonitrile, followed with butadiene (m/s 54). In another study, the researchers showed that ABS generated, first, butadiene, starting from 340 °C, then styrene at 350 °C, and acrylonitrile starting at about 400 °C [37]. According to Vouvoudi et al., ABS starts to degrade from the abstraction of the side –CN groups [45]. Vouvoudi et al. studied the pyrolysis of recycled ABS from waste electrical and electronic equipment (WEEE), and showed that ABS had a three-step mass loss curve where acetonitrile, acrylonitrile and styrene emission, along with several aromatic compounds with 1, 2 or 3 phenyl rings and substituted nitriles were detected [45].

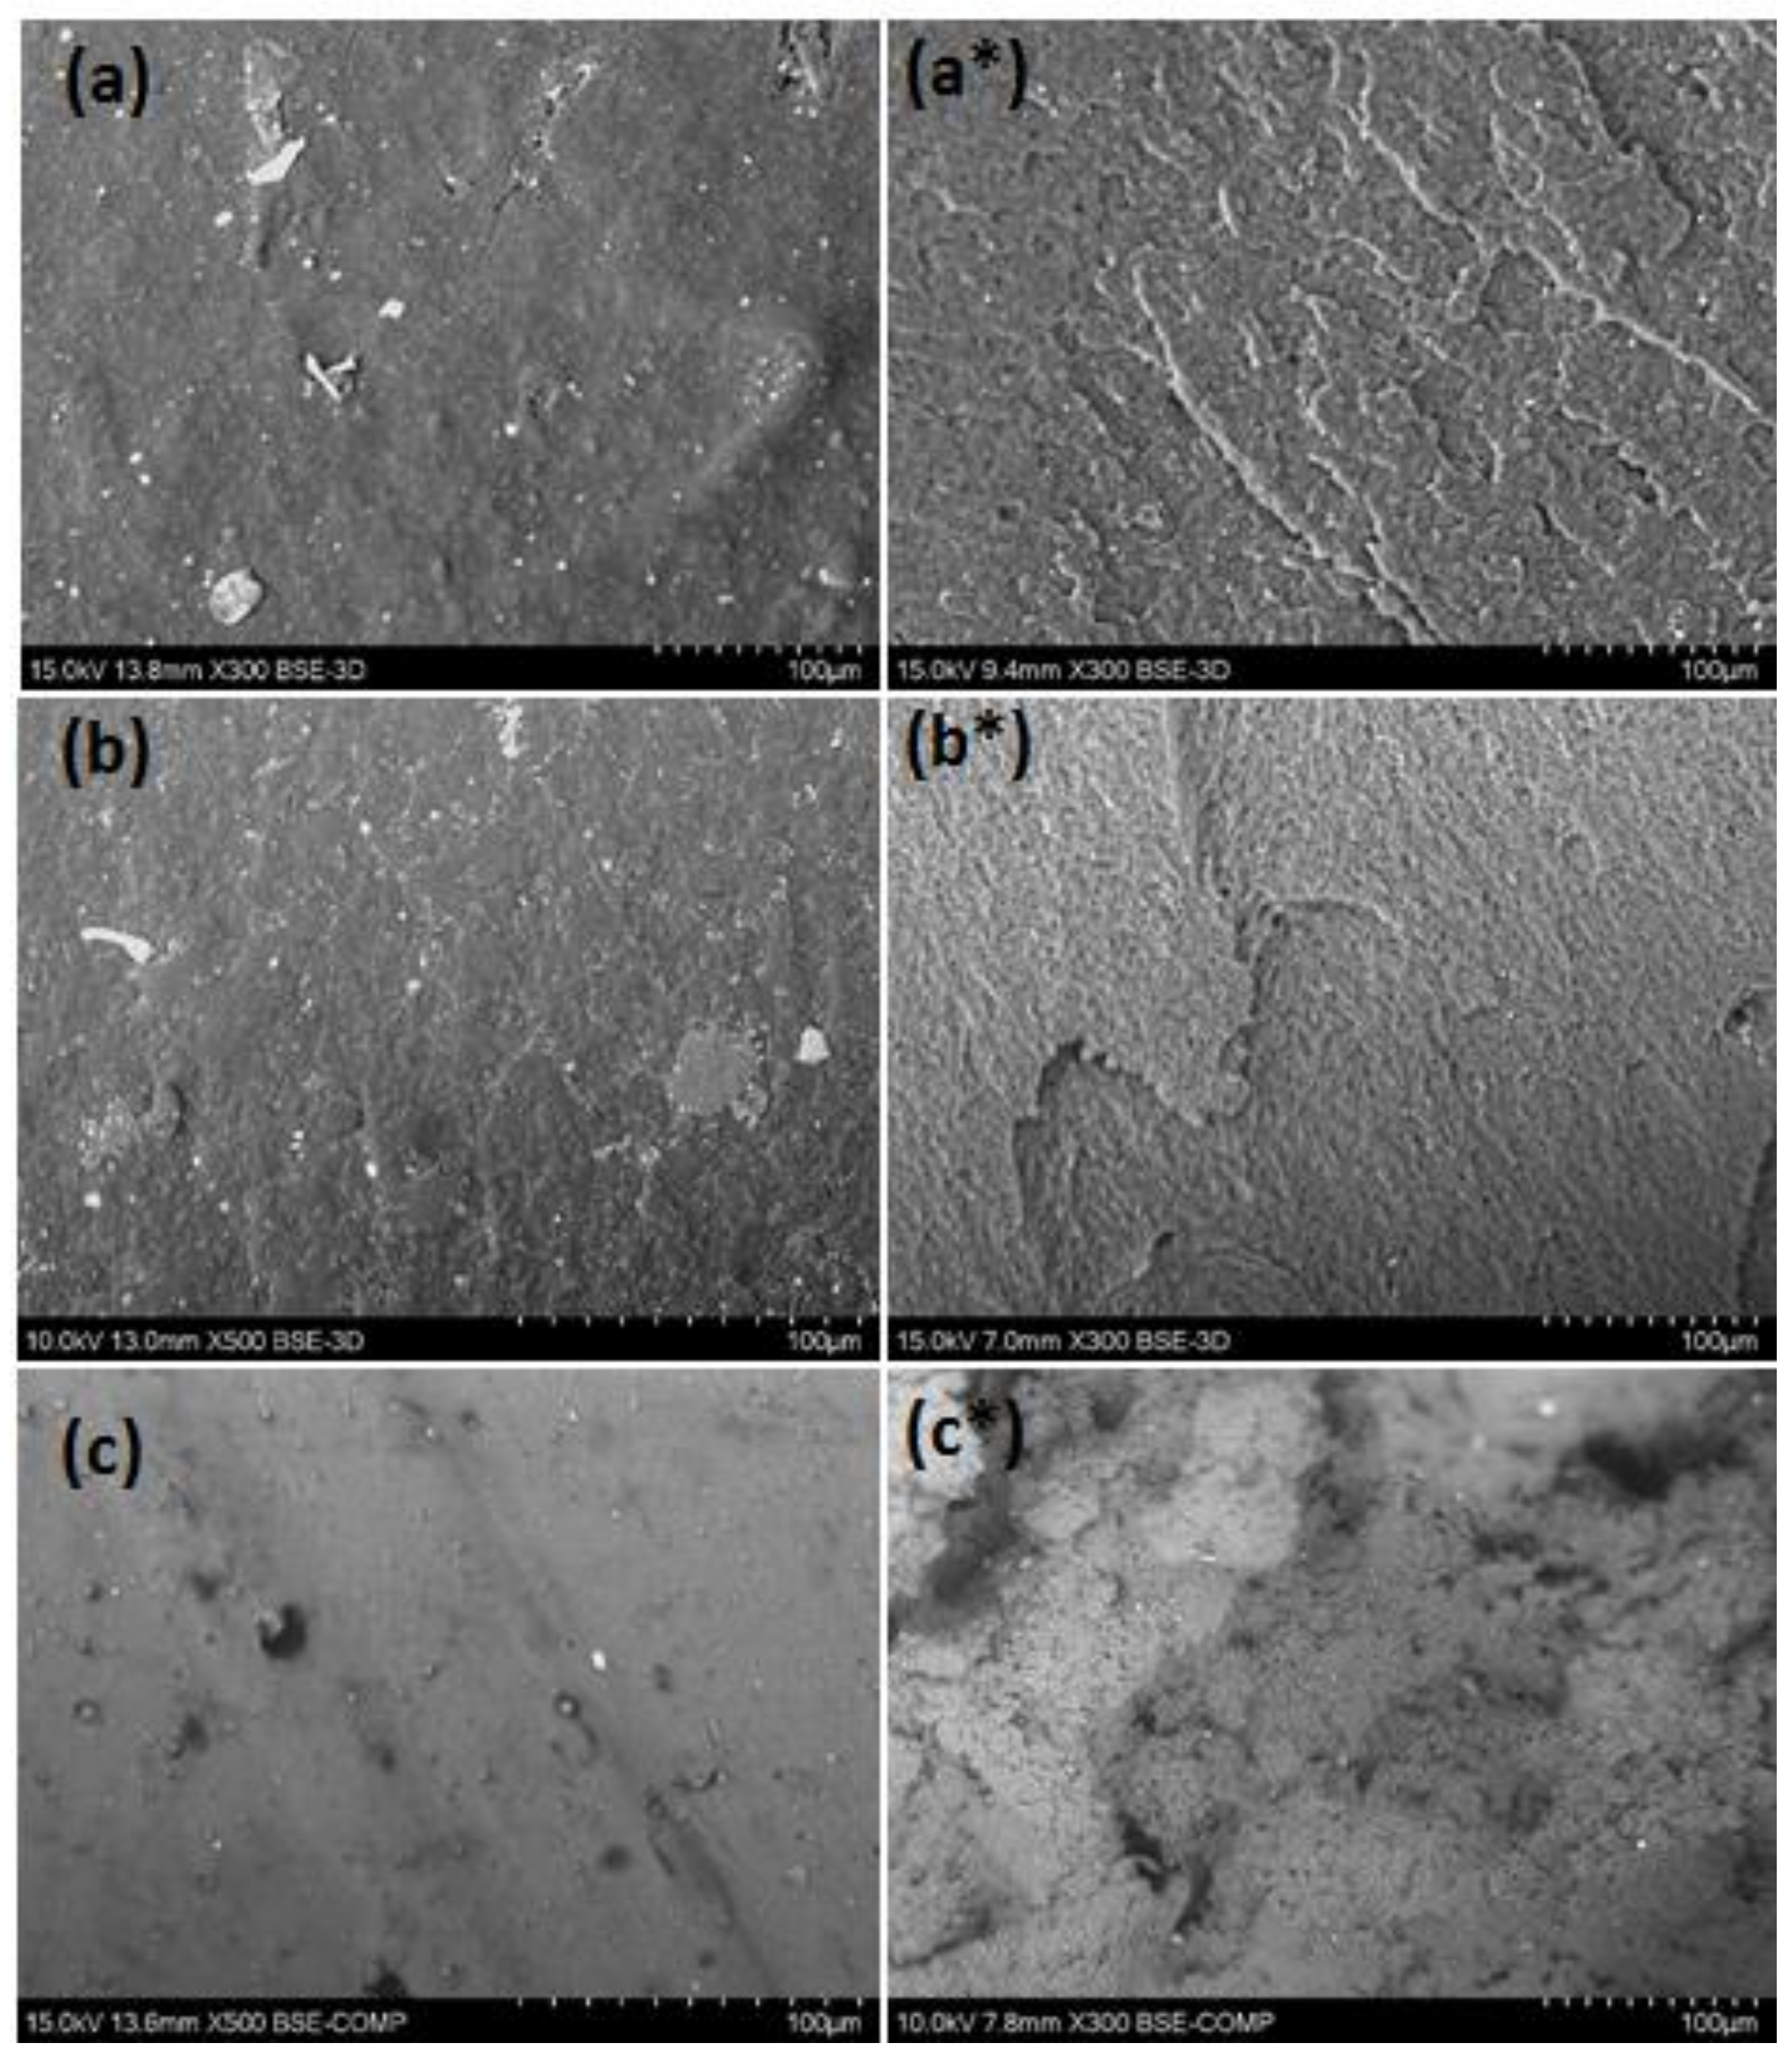
3.5. SEM-EDS Analysis

EDS is a fast method for the analysis of constituent elements. The elemental composition detected in the polymers is shown in Table 2. In PVC, as expected, the share of chlorine (Cl) is high, about half of the total sample weight. Elements such as Mg, Ca, Ti, Al and oxygen originated from additives that are usually applied in plastic production. For instance, they can be attributed to metal-containing fire-retardant Mg(OH)2 and Al(OH)3, Ca-based stabilizer and pigment (TiO2). In fact, a large amount of Ca belongs to a Ca-based stabilizer which is widely applied in PVC manufacturing [46]. The small amount of silicon, Si, which is a component of sand, can have originated from soil impurities. In addition, small amounts of Na, K, Fe and Cu were detected in ABS.

3.6. Mechanical Properties

The extruded filaments were tested for their tensile properties. Experimental results and values for the virgin counterparts taken from the internet sources are listed in Table 4. As can be seen, the tensile strength of recycled materials was much smaller than those of the virgin ones. The tensile modules of rABS and rPVC, in turn, were comparable with the neat equivalents. Reduction of the mechanical properties in the recycled materials can be attributed to thermomechanical action during reprocessing, aging of material during usage and presence of additives and impurities. Important information related to the mechanical properties can be received form the study of the material microstructure. Inspection of the samples with SEM, Figure 6, showed that the microstructure on the side surface of the filaments is smooth without pores and cavities. However, small particles of inclusions associated with additives and impurities can be observed. The presence of the inclusions was detected with EDS analysis (see above). A PVC filament fracture after the tensile test detected heterogeneous morphology, whereas fracture surfaces of PS and ABS are regular, without any defects. Microstructural failings in PVC filaments can be attributed to an insufficient reduction of flake size or/and the non-optimal temperature regime of the extrusion. In addition, PVC can start to degrade at enhanced temperature resulting in structural defects.

4. Conclusions

Filament samples of about 3 mm in diameter were extruded with a small-scale extruder from recycled polystyrene (PS), acrylonitrile butadiene styrene (ABS) and polyvinylchloride (PVC) materials. No visible difficulties in the filaments’ processing were detected. However, filament fracture micrograph analysis detected heterogeneous morphology in the case of PVC, while PS and ABS showed regular microstructures. In terms of mechanical properties, the tensile strength of the recycled plastics was lower than those of the virgin counterparts, whereas the modulus was comparable. Thermal analysis showed that the glass transition temperatures (Tg) of the recycled PS and PVC were lower than for their virgin counterparts, whereas Tg of recycled and neat ABS was similar. The melt flow index (MFI) of rPS was similar to virgin PS, whereas the MFI of rABS was significantly lower than that of virgin ABS; the MFI of PVC was not detected. Samples burned under inert atmosphere with solid residue left about 17, 2 and 4 wt.% for PVC, PS and ABS, respectively. The analysis of gases evolved during pyrolysis showed that the studied plastics decomposed in accordance with a scenario similar to their virgin counterparts.

Author Contributions

Conceptualization and methodology, T.K. and I.T.; formal analysis, I.T. and S.K.; investigation, I.T.; resources, T.K.; data curation, I.T. and T.K.; writing—original draft preparation, I.T.; writing—review and editing, I.T. and T.K.; visualization, I.T.; supervision, project administration and funding acquisition, T.K.

Funding

This research received no external funding.

Acknowledgments

This study was supported by the LUT RE-SOURCE (Resource efficient production processes and value chains) research platform coordinated by LUT University.

Conflicts of Interest

The authors declare no conflict of interest.

References

  1. PlasticsEurope. An analysis of European plastics production, demand and waste data. Available online: https://www.plasticseurope.org/application/files/5715/1717/4180/Plasti2cs_the_facts_2017_FINAL_for_website_one_page.pdf (accessed on 26 November 2018).
  2. A European Strategy for plastics in a circular economy. Available online: http://ec.europa.eu/environment/circular-economy/pdf/plastics-strategy.pdf (accessed on 26 November 2018).
  3. Huysman, S.; Sala, S.; Mancini, L.; Ardente, F.; Alvarenga, R.A.F.; Meester, S.; Mathieux, F.; Dewulf, J. Toward a systematized framework for resource efficiency indicators. Resour. Conserv. Recycl. 2015, 95, 68–76. [Google Scholar] [CrossRef] [Green Version]
  4. REACH Restricted Substances Finder. Available online: https://www.chemsafetypro.com/Topics/EU/REACH_Restricted_Substances_List_RRS_Finder.html (accessed on 26 November 2018).
  5. Quaghebeur, M.; Laenen, B.; Geysen, D.; Nielsen, P.; Pontikes, Y.; Van Gerven, T.; Spooren, J. Characterization of landfilled materials: Screening of the enhanced landfill mining potential. J. Clean. Prod. 2013, 55, 72–83. [Google Scholar] [CrossRef]
  6. Rayna, T.; Striukova, L. From rapid prototyping to home fabrication: How 3D printing is changing business model innovation. Technol. Forecast. Soc. Chang. 2016, 102, 214–224. [Google Scholar] [CrossRef]
  7. Baechler, C.; DeVuono, M.; Pearce, J.M. Distributed recycling of waste polymer into RepRap feedstock. Rapid Prototyp. J. 2013, 19, 118–125. [Google Scholar] [CrossRef]
  8. Available online: www.3d-printer-filaments.com (accessed on 23 November 2018).
  9. Available online: www.bigrep.com (accessed on 23 November 2018).
  10. Available online: www.bpetfilament.com (accessed on 23 November 2018).
  11. Mirón., V.; Ferrándiz, S.; Juárez, D.; Mengual, A. Manufacturing and characterization of 3D printer filament using tailoring materials. Procedia Manuf. 2017, 13, 888–894. [Google Scholar] [CrossRef]
  12. Anderson, I. Mechanical properties of specimens 3D printed with virgin and recycled polylactic acid. 3D Print. Addit. Manuf. 2017, 4, 110–115. [Google Scholar] [CrossRef]
  13. Zander, N.E.; Gillan, M.; Lambeth, R.H. Recycled polyethylene terephthalate as a new FFF feedstock material. Addit. Manuf. 2018, 21, 174–182. [Google Scholar] [CrossRef]
  14. Available online: https://webbook.nist.gov/chemistry/ (accessed on 23 November 2018).
  15. Available online: https://cdn.shopify.com/s/files/1/0762/2839/files/TDS_ABS_Filament.pdf (accessed on 23 November 2018).
  16. Available online: https://www.innofil3d.com/wp-content/uploads/2016/05/TDS-Innofil3D-ABS-160609.pdf (accessed on 23 November 2018).
  17. Available online: www.merck.com.
  18. Jin, H.; Gonzales-Gutierrez, J.; Oblak, P.; Zupancic, B.; Emri, I. Effect of extensive recycling on flow properties of LDPE. In Proceedings of the ANTEC, Cincinnati, OH, USA, 22–24 April 2013; pp. 98–101. [Google Scholar]
  19. Available online: https://plastics.ulprospector.com/generics/46/c/t/polyvinyl-chloride-pvc-properties-processing/sp/7 (accessed on 23 November 2018).
  20. Wang, J.; Li, Y.; Song, J.; He, M.; Song, J.; Xia, K. Recycling of acrylonitrile-butadiene-styrene (ABS) copolymers from waste electrical and electronic equipment (WEEE), through using an epoxy-based chain extender. Polym. Dégrad. Stab. 2015, 112, 167–174. [Google Scholar] [CrossRef]
  21. Olmos, D.; Martén, E.V.; González-Benito, J. New molecular-scale information on polystyrene dynamics in PS and PS-BaTiO3 composites from FTIR spectroscopy. Phys. Chem. Chem. Phys. 2014, 16, 24339–24349. [Google Scholar] [CrossRef] [PubMed]
  22. Tiganis, B.E.; Burn, L.S.; Davis, P.; Hill, A.J. Thermal degradation of acrylonitrile-butadiene-styrene (ABS) blends. Polym. Dégrad. Stab. 2002, 76, 425–434. [Google Scholar] [CrossRef]
  23. Mallakpour, S.; Sadaty, M.A. Thiamine hydrochloride (vitamin B1) as modifier agent for TiO2 nanoparticles and the optical, mechanical and thermal properties of poly(vinyl chloride) composite film. RSC Adv. 2016, 6, 92596–92604. [Google Scholar] [CrossRef]
  24. Available online: www.asminternational.org/documents/10192/1883419/amp (accessed on 23 November 2018).
  25. Available online: www.shimadzu.com/an/industry/petrochemicalchemical/chem0201010.htm (accessed on 23 November 2018).
  26. Scheirs, J.; Priddy, D. Modern Styrenic Polymers: Polystyrene and Styrenic Copolymers; John Willey & Sons, Ltd: West Sussex, UK, 2003; p. 323. [Google Scholar]
  27. Available online: www.misumi-techcentral.com/tt/en/mold/2011/12/106-glass-transition-temperature-tg-of-plastics.html (accessed on 23 November 2018).
  28. Castro, A.; Soares, D.; Vilarinho, C.; Castro, F. Kinetics of thermal de-chlorination of PVC under pyrolytic conditions. Waste Manag. 2012, 32, 847–851. [Google Scholar] [CrossRef] [PubMed] [Green Version]
  29. Starnes, W.H. Structural and mechanical aspects of the thermal degradation of poly(vinyl chloride). Prog. Polym. Sci. 2002, 27, 2133–2170. [Google Scholar] [CrossRef]
  30. Carty, P.; White, S. Char formation in polymer blends. Polymer 1994, 35, 343–347. [Google Scholar] [CrossRef]
  31. Slapak, M.J.P.; Kasteren, J.M.N.; Drinkengburg, A.A.H. Determination of the pyrolytic degradation kinetics of virgin-PVC and PVC-waste by analytical and computational methods. Comput. Theor. Polym. Sci. 2000, 10, 481–489. [Google Scholar] [CrossRef]
  32. Miranda, R.; Yang, J.; Roy, C.; Vasile, C. Vacuum pyrolysis of PVC I. Kinetic study. Polym. Dégrad. Stab. 1999, 64, 127–144. [Google Scholar] [CrossRef]
  33. Matsuzawa, Y.; Ayabe, M.; Nishino, J.; Kubota, N.; Motegi, M. Evaluation of char fuel ratio in municipal pyrolysis waste. Fuel 2004, 83, 1675–1687. [Google Scholar] [CrossRef]
  34. Schartel, B.; Kunze, R.; Neubert, D.; Tidjani, A. ZnS fire retardant in plasticized PVC. Polym. Int. 2002, 51, 213–222. [Google Scholar] [CrossRef]
  35. Xu, J.; Liu, C.; Qu, H.; Ma, H.; Jiao, Y.; Xie, J. Investigation on the thermal degradation of flexible poly(vinyl chloride) filled with ferrites as flame retardant and smoke suppressant using TGA-FTIR and TGA-MS. Polym. Dégrad. Stab. 2013, 1506–1514. [Google Scholar] [CrossRef]
  36. McNeill, I.C.; Memetea, L.; Cole, W.J. A study of the products of PVC thermal degradation. Polym. Dégrad. Stab. 1995, 49, 181–191. [Google Scholar] [CrossRef]
  37. Suzuki, M.; Wilkie, C.A. The thermal degradation of acrylonitrile-butadiene-styrene terpolymer as studied by TGA/FTIR. Polym. Dégrad. Stab. 1995, 47, 217–221. [Google Scholar] [CrossRef]
  38. Available online: www.perkinelmer.com/labsolutions/resources/docs/APP_009908_01_Characterization_of_Polymers_using_TGA.pdf (accessed on 23 November 2018).
  39. Available online: http://www.thermal-instruments.co.uk/ABR_PVCbyTG-GCMS.pdf (accessed on 23 November 2018).
  40. Chigwada, G.; Kandare, E.; Wang, D.; Majoni, S.; Mlambo, D.; Wilkie, C.A.; Hossenlopp, J.M. Thermal stability and degradation kinetics of polystyrene/organically-modified montmorillonite nanocomposites. J. Nanosci. Nanotechnol. 2008, 8, 1927–1936. [Google Scholar] [CrossRef] [PubMed]
  41. Özsin, G.; Pütün, A.E. Insights into pyrolysis and co-pyrolysis of biomass and polystyrene: Thermochemical behaviors, kinetics and evolved gas analysis. Energy Convers. Manag. 2017, 149, 675–685. [Google Scholar] [CrossRef]
  42. Seleem, S.; Hopkins, M.; Olivio, J.; Schiraldi, D.A. Comparison of thermal decomposition of polystyrene products vs. bio-based polymer aerogels. Ohio J. Sci. 2017, 117, 50–60. [Google Scholar] [CrossRef]
  43. Saraji-Bozorgzad, M.; Geissler, R.; Streibel, T.; Mühlberger, F.; Sklorz, M.; Kaisersberger, E.; Denner, T.; Zimmermann, R. Thermogravimetry coupled to single photon ionization quadrupole mass spectrometry: A tool to investigate the chemical signature of thermal decomposition of polymeric materials. Analyt. Chem. 2008, 80, 3393–3403. [Google Scholar] [CrossRef] [PubMed]
  44. Available online: www.hitachi-hightech.com/file/global/pdf/products/science/appli/ana/thermal/application_TA_066e.pdf (accessed on 23 November 2018).
  45. Vouvoudi, E.C.; Rousi, A.T.; Achilias, D.S. Thermal degradation characteristics and products obtained after pyrolysis of specific polymers found in waste electrical and electronic equipment. Front. Environ. Sci. Eng. 2017, 11, 1–10. [Google Scholar] [CrossRef]
  46. Matuana, L.M.; Kamdem, D.P.; Zhang, J. Photoaging and stabilization of rigid PVC/wood-fiber composites. J. Appl. Polym. Sci. 2001, 180, 943–960. [Google Scholar] [CrossRef]
  47. Available online: https://www.multistation.com/voy_content/uploads/2017/11/161219_tds_ps_owa.pdf (accessed on 23 November 2018).
Figure 1. Infrared spectra of recycled acrylonitrile-butadiene-styrene (rABS), recycled polystyrene (rPS) and recycled polyvinylchloride (rPVC).
Recycling 03 00057 g001
Figure 2. Chemical structure of ABS, PS and PVC.
Recycling 03 00057 g002
Figure 3. Thermogravimetric analysis (TGA) and differential thermogravimetry (DTG) curves of rPS, rABS and rPVC pyrolysis under a neutral atmosphere.
Recycling 03 00057 g003
Figure 4. Schematic cyclisation reaction during PVC pyrolysis (adapted from [34]).
Recycling 03 00057 g004
Figure 5. TGA mass spectrophotometer (MS) analysis of rPS, rABS and rPVC.
Recycling 03 00057 g005
Figure 6. Scanning electron microscope (SEM) micrographs of filaments: extruded side surface of rPS (a) rABS (b) and rPVC (c) (×300 or 500) and fractured surfaces of rPS (a*), rABS (b*) and rPVC (c*) (×300).
Recycling 03 00057 g006
Table 1. Parameters of extruded filaments for recycled samples and their virgin counterparts found in the literature.
Material/ParameterTextr (°C)d (cm)MFI (g/10 min)MFI, Virgin (g/10min)
ABS1803.81(0.12)8.9(0.8)15 [15], 43.1 [16]
PS2002.98(0.08)11.5(0.9)12–16 [17]
PVC1963.57(0.14)N/A1.4–54 [19]
Table 2. Elemental composition of rABS, rPS and rPVC, wt.%; standard deviation is given in parentheses.
Material/
Element
COClMgAlCaNaTiSiSKFe, Cu
ABS86(8)3(2)0.3(0.1)0.02(0.03)1.1(0.4)0.2(0.1)0.2(0.1)0.7(0.3)0.1(0.06)0.04(0.04)0.3(0.1)<0.02
PS98(0.4) 0.14(0.02) 0.7(0.4)0.1(0.03)0.1(0.1)0.6(0.1)<0.1
PVC57(6)4(0.6)37(9)<0.010.6(0.1)1.3(0.1) 0.1(0.01)0.02(0.01)
Table 3. Thermal parameters of rABS, rPS and rPVC.
Material/
Property
Tg (°C)Tg Virgin (°C)
II cycIII cyc
rABS106.4106.5105 [26]
rPS87.585.6100 [26,27]
rPVC8180.987 [27]
Table 4. Tensile properties of extruded filaments from recycled materials and virgin counterparts taken from internet sources.
Material/
Property
Tensile, MeasuredTensile, Virgin
Strength, MPaModulus, GPaElongation at Break, %Strength, MPaModulus, GPaElongation at Break, %
rABS14.5(1)2.7(2.8)2(2)45 [15]2.3 [15]-
rPS4.3(0.35)1.85(0.4)1(1)15 [47]-5.2 [47]
rPVC17(1)2.9(0.1)8(8)28–51 * [17]2.5–3.2 * [17]10–180 [17]
* rigid PVC.

