1. Introduction
Currently, plastic pollution is one of the biggest hazards faced by our planet. According to the United Nations, marine pollution includes 8 million tons of plastic waste annually, causing 1 million seabirds and 0.1 million sea mammals to die every year [
1]. Furthermore, the expanse of terrestrial plastic pollution is so huge that it has yet to be quantified. According to [
2,
3] if the current rates of goods production and waste generation persist, the total annual mismanaged waste worldwide will be more than double by 2050. Plastic bottles have become one of the major causes of plastic pollution, due to the rapid increase of the consumption of soft and cold drinks in the last decade or so, resulting in environmental pollution as well as resource depletion [
4]. The production of plastic involves a significant amount of oil. Currently, 4% of the oil produced in the world is used in plastic production [
5], which is alarming, as oil is a non-renewable resource, and oil consumption causes further air pollution. Recycling plastic is one the most effective ways to deal with plastic pollution [
6] by allowing reuse. Recycling plastic reduces its presence and threat to biodiversity. Furthermore, recycled plastic can be used as raw material in different industries, such as automotive, concrete, textiles, and others [
7]. In Pakistan, with a population of 220 million, plastic bottles are thrown into bins along with other waste due to the lack of domestic recycling mechanisms. Some of them are picked out by manual laborers and sold to recycling factories. However, most plastic waste is either burnt or dumped by municipal authorities, adding to land and air pollution. Hence, systematic techniques, low-cost solutions, and incentive-based approaches are required in the country to collect plastic bottles and motivate the general public to recycle plastic. Rewarding has proven most effective in encouraging the public to recycle [
8]. Implementing a Reverse Vending Machine (RVM) is an innovative way to reward people who recycle [
9]. An RVM can boost recycling activities through its reward system. Furthermore, it can sort and separate different waste materials, such as plastic bottles and cans, making the waste management system more efficient. However, the cost of an RVM is a crucial factor for determining whether or not an RVM system can be deployed on a mass scale to help with effective waste management. RVM cost is highly correlated with the hardware and methodology used for bottle identification and sorting.
Traditional RVMs are expensive (10,000 to 25,000 USD) because their object recognition technology is based on infrared (IR) spectroscopy and barcode readers [
10,
11], and on integrated features, such as the crushing and processing of various materials, such as glass, plastic, and cans. A few of these examples include the G-1 Smart RVM [
12], RVMX2-3–10 [
13] and H10–11 [
14]. These expensive machines cannot be deployed on a large scale. Therefore, various local manufacturers in China and India are making low-cost solutions, such as an 1800 USD machine from Shenzen Guigu Intelligence Co. Ltd. [
15] and a 3000 USD machine from Europack Machine (India) Pvt Ltd. [
16]. However, these low-cost solutions have serious limitations. For example, the RVM developed in [
16] is only viable for indoor installation because it is made of non-durable materials such as fiberboard or paperboard. In addition, none of these machines were developed as a complete end-to-end solution, comprising a low-cost robust hardware as well as a user interface linking their rewards data saved to a cloud, connected with international food chains for redemption. Hence, there is a requirement for a low-cost, endogenously developed RVM device.
Computer vision is a popular method for plastic waste identification and classification. Image classification categorizes an image into different groups. The accuracy of an image classification method depends on its feature extraction capability. Deep learning has recently achieved state-of-the-art image classification results [
17]. Unlike traditional machine learning, where handcraft features are extracted and fed into a classifier such as SVM, deep learning optimizes the features that are extracted. The deep learning architectures learn rich features from a large amount of data, and these features are learned layer by layer, resulting in more comprehensive and direct learning [
18]. A Convolutional Neural Network (CNN) is one type of deep learning algorithm that achieves better image classification results. By using convolution to extract features, CNN significantly reduces the number of parameters required for model training. CNN achieved better results in 1997 on handwritten digit data recognition, as reported by Nebauer [
9]. Moreover, the image classification challenge 2012, which was won by Alexnet [
19], which had many convolution layers, marked the beginning of the new era. The competition had 1.2 million high-resolution pictures with 1000 different classes. Nowadays, there are many high-performing convolutional neural network architectures that have performed well on Imagenet, namely, VGG, Exception, Inception, and GoogLeNet. Yoo et al., achieved a waste classification accuracy of 95%, however, we will show later that our model was able to achieve up to 99–100% accuracy, in addition to creating a low-cost, working RVM [
20].
Many researchers have used deep learning in the domain of waste management. Nowakowski et al. [
21] used CNN and R-CNN to detect and classify electrical waste to assist waste collection companies. Zhang et. al. [
22] used transfer learning based on DenseNet to classify the TrashNet data-set into waste paper, plastic, fabric, metal, and glass, with 83% accuracy.
Bottle classification, however, is quite a challenging task, because not only do bottles have different sizes, colors, and shapes, they may have been compressed or crushed, thereby deforming their shape being. Furthermore, the light reflection of bottles can make feature extraction harder. Researchers have used both traditional machine learning and deep learning for bottle classification. Tachwali et. al. [
23] used chemical composition and color to classify plastic bottles.
Near reflectance measurement was used to identify bottle composition class, and the whole charged couple device camera was used, with the fusion of quadratic discriminant analysis (QDA) and tree classifier, to detect bottle color. The apparatus is not only expensive, as it adds a Near-Infrared (NIR) sensor, but the prediction accuracy is only 83%, which limits its performance and intended advantage for waste recycling. Wang et al. [
24] combined the ReliefF algorithm for features extraction with a support vector machine to classify plastic bottles into seven categories based on their color, which include light blue bottles, lilac bottles, brown bottles, blue bottles, light green bottles, dark green bottles, and colorless bottles, and achieved 94.6% accuracy. Kokoulin et al. [
10,
11] trained and compared different lightweight architectures for the classification of input objects into bottle, can, or fraud (anything which is not a bottle or can). The trained models including SqueezeNet [
25], LeNet [
26], MobileNet [
27], and AlexNet [
27] were used. AlexNet achieved 93%, MobileNet 88%, LeNet 80%, and SqueezeNet 87%, respectively. Although SqueezeNet’s accuracy was lower than that of AlexNet, it is 50 times lighter than AlexNet.
This paper proposes an in-house fabricated, easy-to-replicate, open-source, and reliable solution. Due to the indigenous development, the system is likely to be maintained at lower cost compared to the imported solutions, which are expensive to maintain. This is an end-to-end, low-cost solution for implementing a plastic bottle waste management hardware framework, which also rewards the user through a reward system, by employing separate mobile applications for the consumer and business. The bottle classification mechanism of the RVM is based on deep learning instead of traditional IR-spectrometers. Moreover, the RVM uses a low-computing, self-designed IoT device and a lightweight MobileNet for image classification. Our study is novel in the sense that no other research in the region has targeted the complete design, implementation, deployment, and evaluation of a self-designed, low-cost IoT and deep learning system-based RVM solution (under 750 USD) for plastic waste management. The authors have extensive research experience with regard to IoT-based and deep learning-based solutions [
28]. This machine was designed with cost and mass-scale-production in mind. The mechanical design is extremely simple, so that anyone working on the RVM is able to replicate it effectively. Furthermore, this paper also discusses the challenges for the electrical and mechanical design of a standard RVM in the following sections, to aid in the replication of this work. The low cost enables mass production and deployment of RVMs in public places, to encourage plastic recycling. The developed product was launched as a social initiative by Smart City Lab. The product is in the process of deployment at various public places all over the city of Karachi, in collaboration with the local government of Pakistan.
2. Materials and Methods
This section discusses the basic working principle, hardware implementation, and bottle identification and classification mechanism for the developed RVM shown in
Figure 1. In the following subsection, an understanding of the basic operation flow of the machine is presented.
2.1. System Overview
The RVM for plastic bottle waste management accepts empty bottles and assigns rewards to respective users. The process starts once the machine is powered up and an Internet connection is established. As shown in
Figure 2, when the user inserts an object into the RVM, the camera inside the machine starts capturing the images. The primary controller then classifies the captured image using a deep learning-trained model. After this classification, the secondary controller gets a response from the primary controller, identifying the object inserted. If a bottle is not identified in the captured image, then the conveyor belt throws the object out of the machine and the whole process restarts. However, if the object in the image is identified as a bottle, it is further classified into various sizes through the deep learning algorithm. It is then moved to a weighing platform using a mechanical arm, and in the meantime, the machine asks the user to input their contact details using the keypad. Afterwards, the contact details and the measured weight of the bottle are updated in the database, based on which, the system determines the reward points. In the meantime, the secondary controller checks if the bin is full. If yes, a system notification is sent to the bin manager to collect the waste. If no, the object is put into the designated bin using the mechanical arm. The machine runs continuously, and accepts bottles from users as long as there is power availability and Internet. In the below sections, details about the hardware design for the RVM and bottle detection model will be discussed.
2.2. Hardware Implementation
The hardware implementation of the RVM is discussed with respect to its mechanical, electronic, and communication design.
Firstly, a CAD model was designed to estimate the mechanical production cost and visualize the end product. This model also helped brainstorm an effective layout for the electronics module installation. As shown in
Figure 3, the mechanical dimensions of the machine reflect a trade-off between an efficient and compact design. This metal-made structure with a capacity of approximately 1.5 tons of plastic waste contains a long conveyor belt, as well as the electronic wiring. After completing the mechanical design, the next step was the effective realization of the design. To do so, metal was cut to cm precision with repetitive measurements, and all the parts were welded together to create the designed model. To conclude the mechanical production of the machine, a conveyor belt was installed into the machine structure, along with the door and wheels. The wheeled structure now was ready for the installation of the electronics, which will be discussed in the following paragraph.
Electronics module installation is another key element of the RVM. As illustrated in
Figure 4, different sensors, motors, and controlling units were used in the design of the RVM. Physically, the machine has a conveyor belt that moves the trash within the machine through various modules, and eventually, to the two separate bins for small and large bottles, hence, it is actually the platform for the majority of the electronics installation. At the start of the conveyor, at the place where a bottle is inserted into the machine, two capacitive proximity sensors are positioned at both sides of the conveyor, to make sure that there is no dead-zone through which a bottle can pass undetected. These sensors are installed and their range is adjusted in such a manner that they avoid interference. When an object passes through these proximity sensors, a camera starts capturing images, then sends these images to the primary controller, the Edge Computing Device (ECD).
The response from the ECD determines if the conveyor will move forward to drop a bottle into its designated bin or return it back to the user. If the ECD recognises the input as a bottle, it then determines the size of the bottle. If the bottle is classified as large, the mechanical arm directly next to camera pushes the bottle onto the particular weighing platform, and later drops it into its designated bin. However, if the camera detects a bottle classified as small, the conveyor keeps moving and drops the small bottle onto other weighing platform that is installed at the end of the conveyor. From there, it is later dropped into its designated bin.
For weighing the plastic bottles, which could weigh as little as 15 g, we required a high-precision weighing sensor. Hence, a 5 kg load cell was used for effective weighing. A relatively small value load cell could have been used, but considering the weight of the mechanical platform onto which, the bottle is supposed to land, 5 kg was the best fit. Regarding the conveyor, it was ensured that the secondary controller would control its direction of rotation and speed, therefore, a motor driver to control the high torque dc conveyor motor was used. Whereas, for the mechanical arms, small servo motors were used. All these sensors and actuators were controlled from an ESP32, a secondary controller, with Arduino programming. The ESP32 and communication setup is comprehensively discussed in the following paragraph.
Communication is a very essential part of hardware integration and assembly. Thus, a robust communication system was deployed for a seamless machine process. An ESP32 was chosen to be the secondary controller, since an ECD was being used as the primary controller. ESP32 is commonly used as an embedded device, as it is a low-power system with two cores, one for the WiFi, and the other for the execution of the programs. It has 32 GPIO pins with a large memory and has integrated WiFi and Bluetooth modules [
29].
A C/C++ compiler was used for the ESP32 microcontroller, but it also works with other interpreters, such as Python, Java, and Lua. With ESP32, we deployed Transmission Control Protocol (TCP) for reliable data transfer without having to worry about data loss. As shown in
Figure 5, ESP32 was configured as the server, hence, it can entertain ECD as a network host. The primary function of the ESP is to share hardware information from the keypad, proximity sensor, and load cell available at its general-purpose input/output (GPIO), with the ECD using a JavaScript Object Notation (JSON) document. Once the input is detected through the proximity sensor, the ESP asks the ECD to turn on the camera and capture five images. These images are later transferred to the image classification model (TfLite). The TfLite model classifies the image and sends the signal back to the ESP32 through TCP, indicating whether the detected object is a bottle. It also determines if the bottle inserted was small or large. The TfLite model is discussed in further details in the following section.
The ECD is primarily responsible for communication with the ESP, running the TfLite model and updating data received from the ESP to the firebase cloud. In communication with the ESP, the ECD receives input from the proximity sensors, load cell, and keypad over TCP, and reflects this data onto an ECD application developed for user interaction. This ECD application in default mode runs a sponsored campaign video, and when an object is detected through the ESP, it prompts the user to answer whether they intend to redeem or donate plastic points. If user chooses to redeem, it then asks the user to input their contact details using the keypad, and when the user inputs their contact details, the ECD updates the plastic points against their contact details in the firebase database. The ECD, while reflecting this information on the user interface, also sends it to the ESP, and based on this information, the ESP moves the mechanical arm and conveyor motor to drop the inserted bottles into their respective bins. When a bottle is on the weighing platform, the ECD asks the ESP to check if the bin is full. This is done through level sensors continuously monitoring the trash level inside the bin, and when the bin is full, the ESP prompts the ECD to contact the bin manager. In response to this request from the ESP, the ECD sends a default email to the relevant stakeholders for trash collection. The following section discusses the bottle detection mechanism in detail.
2.3. RVM Bottle Detection Mechanism
In this section, we discuss the RVM bottle classification mechanism. First, we give details of the data collection, followed by the data pre-processing that includes data scaling, data augmentation, and data splitting. Transfer learning based on MobileNet, which uses depth wise separable convolution, is presented.
2.3.1. Data Collection
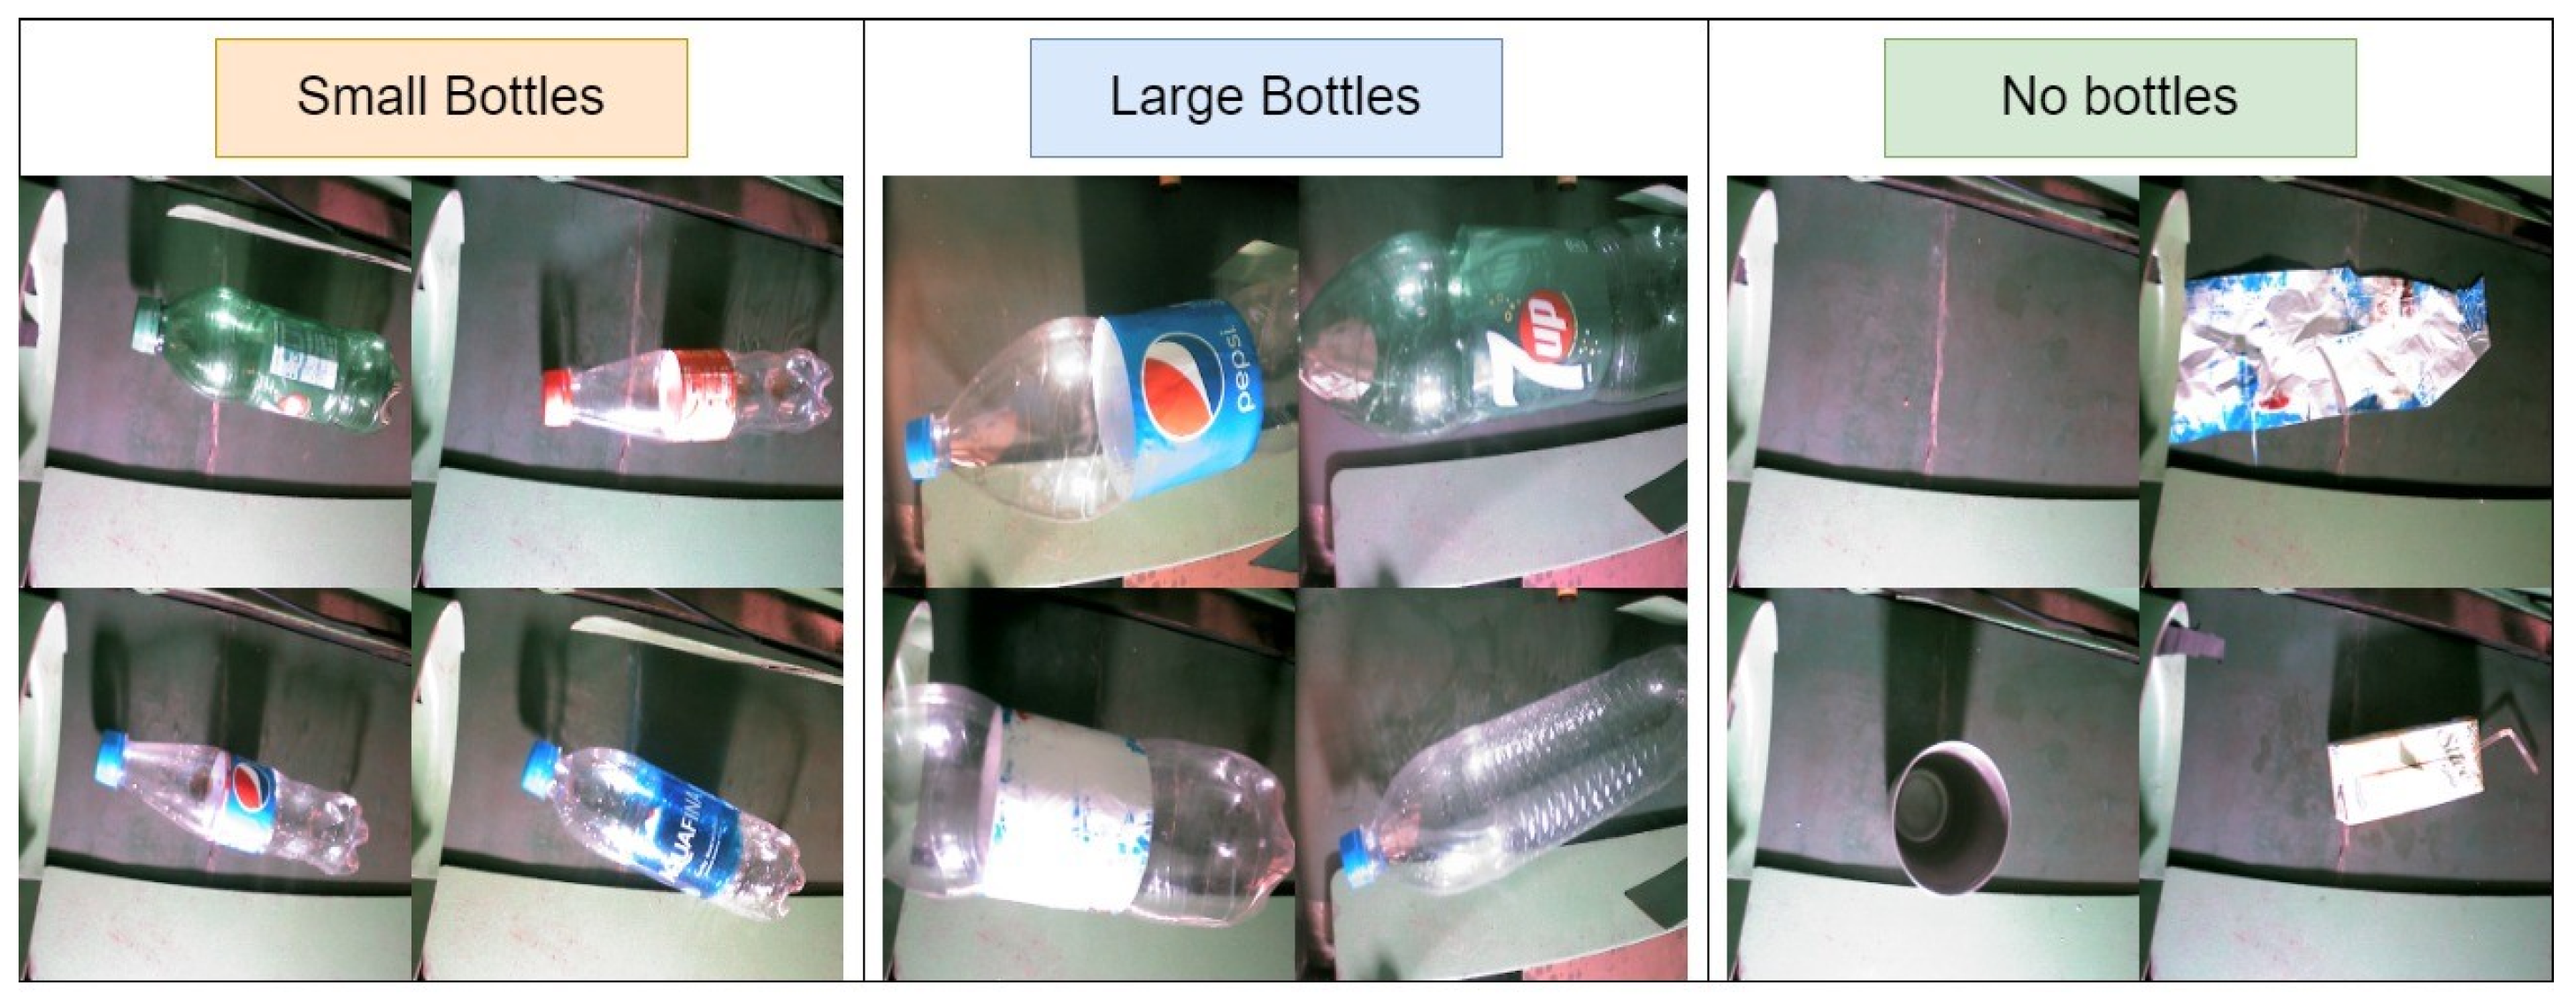
The dataset for the study was collected by taking images inside the RVM using the commercially available RGB camera. The reason for preparing our own data is that model performance is greatly affected by lighting condition and background color. A wide-angle RGB camera was used to capture the images of the input. The camera has a 1080 P resolution with 30 fps and the ability to move 45 degrees up and down. The resultant images are resized to 220 × 220. The dataset has 3 different classes, which include a large bottle, a small bottle, and non-bottle. A sample of the dataset can be seen in
Figure 6. The dataset contains 3299 large bottles (greater than 500 mL), 4754 small bottles (less than 500 mL), and 2930 images of non-bottle objects, which include plastic glasses, paper, wrappers, and many other objects that are not bottles. The images of bottles were taken from different positions on the conveyor.
Furthermore, the images of bottles were taken under different circumstances i.e. by deforming bottles, images with and without the caps, with and without the plastic wrapper containing brand information, and so on. This was done to increase the generalizing capacity of the machine learning model.
2.3.2. Data Preprocessing
The images in our dataset have pixel values ranging from 0–255. Data Standardization is a technique that ensures that all the images in a dataset have the same distribution. Input data having different distributions can result in slow and unstable learning. Standardization transforms the data in such a way that it has 0 mean and 1 standard deviation. To perform standardization, the mean of the image is subtracted from every pixel and then divided by standard deviation Equation (1) [
30], also known as samplewise standardization.
However, calculating the standard deviation and mean for every sample will add computational complexity when the model is deployed on a low-computing IoT device. Therefore, we assume that most of the images have 0 and 255 as min and max values, respectively, and 127.5 as the mean and standard deviation. Therefore, the standardization is performed as shown in Equation (2).
Besides standardization, different augmentation methods were also performed perfunctorily using Keras image generators. These include rescaling, horizontal and vertical flipping, rotation changing, width shifting, height shifting, and zooming.
Augmentation was only performed on the training data. The data was then split into three parts: 65% training, 15% validation, and 20% testing. The splitting was performed to provide more samples for the training (65%). 15% of the data were kept for validation because it was sufficient to check hyper-parameter tuning, and 20% of the unseen data were left for testing of the model. The training data had 5622 images, the validation set contained 1406, and the testing set contained 2197.
2.3.3. Transfer Learning Using Mobile Net
Training a deep learning model can take a lot of time and resources. Furthermore, it also requires a lot of labeled data. Transfer learning is a methodology by which the learned weights of a pre-trained model are reused to solve a machine learning problem instead of building and training a model from scratch. The fine-tuning based on parameter transfer of a pre-trained model makes the convergence of the weights fast [
31]. Furthermore, transfer learning requires fewer datasets than the traditional deep learning methods i.e. building models from the scratch. The head layer of the pre-trained model, which performs prediction, is removed, and a new head layer is added. The parameters of the new head depend on the machine learning problem being solved i.e., is it regression. If it is classification, then how many classes are there, and so on.
There are many pre-trained models that have been trained on millions of images from the ImageNet database, with 1000 different classes, which include Inception, ResNet, and DenseNet. However, these models have a large number of parameters, making them heavy and unsuitable for use in low computing and powered devices like mobile phones. MobileNet [
27] was developed by Google’s research team specifically for mobile devices, which have low memory and power requirements. In this paper, we developed a bottle classification model by transfer learning of MobileNet parameters, as shown in
Figure 7. The training methodology is as follows:
Split the data into training, testing, and validation, randomly (67% of the data will be used for training).
Resize images to 220 × 220.
Build a bottle classification model.
Weight transfer and tuning. The learned weights of a pre-trained machine learning model are transferred to initialize the weights. A new, fully connected layer is created with softmax activation, having the number of neurons equal to the number of classes, as the last layer. This layer will act as a classifier.
Evaluation of the model. The model is evaluated using the test data by calculating the accuracy metrics.
2.3.4. The MobileNet Architecture
MobileNet is a type of deep neural network that is based on depthwise separable convolution, which makes it lightweight and enables it to run smoothly in low computing mobile and embedding devices. Unlike regular convolution, each block in the depthwise convolutional layer has 3 × 3 kernels followed by a 1 × 1 pointwise convolutional layer that combines these kernels to create new features, making it faster than regular convolution while achieving almost the same results.
Depthwise convolution performs
M ∗
Dk ∗
Dk spatial convolutions channelwise, where
Dk is the kernel size and
M represents the numbers of image channels or depth, as can be seen in
Figure 4. Once depthwise convolution is performed, the next step is 1 × 1 pointwise convolution, which changes the dimension. The cost of depthwise convolution can be calculated using Equation (4). While Equation (4) [
32] can be used to calculate the cost of pointwise convolution.
where,
M represents the depth/number of input channels,
N representes the number of output channels,
Dk represents the filter size, and
Df represents the feature image size. The total cost can be calculated using Equation (5), while Equation (6) represents the cost of a regular convolution.
We can find the ratio between depth-wise separable convolution and regular convolution using Equation (7). Simplifying Equation (7), we get Equation (8). Therefore, according to Equation (8), for a 3 × 3 kernel size, depthwise separable convolution is 8–9 times less expensive, with a small tradeoff of accuracy.
MobileNet V1 had 3 × 3 regular convolution and 13 depthwise separable convolution blocks. While MobileNetV2 introduces residual connection blocks that aid the gradient flow through the network. Besides, each layer of MobileNet V2 possesses batch normalization and activation functions, such as Relu. The MobileNet V2 architecture has 17 bottleneck residual blocks in each row, followed by a 1 × 1 regular classification layer, a global average pooling, and the classification layer, as can be seen in
Figure 8. The bottleneck residual block is a type of residual block which uses a 1 × 1 convolution to create a bottleneck, hence reducing the number of parameters and matrix multiplications. The objective is to increase the depth of the residual blocks and make them as thin as possible.
2.3.5. Implementing Resnet and Inception V3
ResNet, also known as Deep Residual [
33] Networks, won the ImageNet Large Scale Visual Recognition Challenge [
34] on the ImageNet dataset. Traditionally, the training and testing error increases as the network is made deeper, i.e., more layers are stacked. This is due to the phenomenon of the vanishing/exploding gradient. As the number of layers in convolutional networks is increased, both training and testing error increases. This increase of error is caused by the gradient vanishing, i.e., becoming too small, or exploding, becoming too large.
ResNet resolves this by using skip connections. The idea is to skip connections from a few layers and directly connect them with the output. ResNet50 has been used in this work with a 220 input size. A regularization technique that introduces noise for the labels so that the model may not predict labels too confidently during training, as it degrades its generalizing capability, is known as label smoothing. InceptionV3 [
34], which is an extension of popular GoogLeNet [
35], uses Label smoothing, along with 7 × 7 factorized convolutions, in order to improve classification and decrease the number of parameters, hence decreasing the computational complexity.
2.3.6. Model Evaluation Metrics
For model evaluation, we used confusion matrices, accuracy, precision, and recall. Equation (9) [
36] represents the formula for accuracy calculation.
where,
Tp represents those samples which belonged to the positive class and was predicted as positive,
Tn represents those that belonged to the Negative class and were predicted as negative,
Fp represents those samples that belonged to the negative class but were predicted true by the model, and
Fn represents those which were positive but predicted as negative by the model. Precision as formulated in Equation (10) [
36] is the ratio of true positive samples among those, which were predicted as positive.
2.3.7. Experimental Setup
All the pre-trained models were tested using the Keras framework. The Kaggle kernel was used for training, which provides the Nvidia P100 GPU with 16 GB memory. The Adam optimizer [
37] with a 0.001 learning rate was used as an optimization algorithm. Adam is one of the most effective optimization algorithms. As we are working on a multi-classification, hence, the last layer used softmax activation with 3 neurons for each layer, and categorical cross-entropy was used as a loss function. Callbacks were used to save the best model i.e., the model with the lowest validation loss. All the pre-trained models were trained for 10 epochs. Data augmentation was performed for each model perfunctorily, using Keras image generators. For training, we first created a base model from a pre-trained MobileNetV2, which had been trained on ImageNet data, and we removed the head layer, which performs classification. The parameters of the first 20 layers were frozen. Three more new layers were added, which included a global pooling layer, a fully connected layer, and the final fully-connected layer with a softmax activation function. This final layer acts as a classifier. The model summary can be seen in
Table 1. All the parameters of the newly added layers were initialized randomly. The first 20 layers of the base model act as a feature extractor, as their parameters were frozen, while the remaining layers, including the newly added ones, were fine-tuned.
The same strategy for conducting transfer learning was used for ResNet50 and InceptionV3. The first 20 layers in both models were frozen for use as a feature extractor. The remaining layers were retrained on the collected bottle dataset. Moreover, three custom layers, including a global pooling layer and two fully connected layers, were added. Finally, a final, fully connected layer with a softmax activation function was added to perform classification.
3. Results and Discussion
While writing this article, we produced two versions of the proposed RVM. The first version of the machine was huge in size, costly, could only be used indoors, and was not very accurate. However, after major improvements, we deployed the second version discussed in this paper: it was more accurate at bottle detection, robust in electronic processing, compact in size, and could function effectively in all weather conditions.
3.1. Bottle Detection Results
We first collected data from inside of the machine to validate the model. Afterwards, we did real time validation of the bottle detection mechanism of the machine. This validation consisted of 200 repetitions of rigorous testing with different types of bottles.
3.1.1. Model Validation
The confusion matrix is a table that represents the performance of the classifier on the test data set. The confusion matrix of the proposed model on the testing data can be seen in
Figure 9. The blue color intensity represents the number of samples correctly classified by the model; the darker the color, the more accurate the classification [
38]. The horizontal axis in
Figure 9 represents the predicted values by the proposed model on the test data, and the vertical axis represents the true label. The diagonal values of the confusion matrix represent the correctly classified samples, while values outside the diagonal represent wrongly classified samples. Looking at the confusion matrix, we can see that our model misclassified fourteen large bottles as small bottles, five large bottles as no bottles, and two no bottles as small bottles, out of 2197 samples. The remainder of the 2176 samples were classified correctly. The other metrics, including accuracy and precision, which were calculated using a confusion matrix, can be seen in
Table 2. Small bottles were successfully classified wich one hundred percent accuracy.
Table 3 represents a detailed comparison between MobileNet, Resnet, and Inception in terms of size, number of parameters, and validation accuracy. It is clear from the table that MobileNet not only achieves high accuracy both on training and testing data, it is also six times smaller than Resnet and fifteen times smaller than Inception. It weighs only 47 Mb. After converting it to the TensorFlow lite version, which is supported by mobile, its size was reduced to 14 MB. Besides, being low weight, there is also mobileNet integration support to add the model to android or IOS. MobileNet achieved 99.6% accuracy on the validation set and 99.2% accuracy on the training dataset. InceptionV3 achieved 98.6% validation accuracy, and ResNet50 achieved 96.5% validation accuracy and 95.4% testing accuracy. The confusion matrix for mobileNet can be seen in
Figure 9.
3.1.2. Machine Validation
Initially, we tested the complete machine function 100 times, where the model failed 29 times to recognize the input correctly. This data consisted of 19 non-bottle objects, 38 large bottles, and 43 small bottles. Three times, the model detected no bottle objects as large or small bottles, seventeen times, it detected large bottles as small bottles, and nine times, it detected small bottles as large. This was largely because of bad light inside of the machine and a camera posture that dragged the aspect ratio and resulted in incorrect detection. Because of this significant error, we tested the same dataset again but this time with improved camera posture, resulting in better aspect ratio. Only by changing camera posture were we able to reduce the incorrect detection number from 29 times to 13 times, which can further be improved with better lighting inside the machine. Out of these thirteen inaccurate detections, four times, the machine misclassified no bottles as small or large bottles, seven times, it inaccurately classified small bottles as large bottles, and two times, it wrongly classified large bottles as small bottles. Through this rigorous testing process of the machine, we realized the impact of mechanical aspects like camera posture on computer vision models.
3.2. Hardware Findings
Since the deployment of the first version of RVM in July 2021 and the second version in December 2021, we collected about 650 kg of plastic waste with both machines installed at the NED University of Engineering and Technology campus.
In the latest version of the machine, we used ultrasonic sensors, because infrared sensors generally are sensitive to light, dust, smoke, and mist. This helped us make the machine equally effective in outdoor settings. The later version of the machine was also fabricated in metal so that, when installed outdoors, the electronics stay intact and operational in case of heavy rain. Since one of the most important parts of the machine was the electronics, we worked to make it robust by using a high-speed, stand-alone processing unit, thereby making the overall operation fast and reliable. The machine completes one operational cycle in about 30–60 s, depending upon the input speed of the user. While wiring up the electronics, and especially the load cell, we observed a lot of noise coming from the metal. Since load cells deal with current values in milliamperes, we had to filter out noise, up until the 3rd digit of the analog reading. We did this by using a filter circuit, covering up the electronic joints properly, and by the choice of wire connecting the load cell with the controlling unit. In this multi-disciplinary study, we were able to resolve some challenges, as mentioned. Following are some of the problems that do not affect the machine performance but do need to be addressed, as they contribute to the overall standard of the RVM as a public utility product.
3.3. Challenges
Since the development of this machine involved mechanical fabrication and outdoor deployment, we faced a few post-development challenges. These included jerky and noisy conveyor motors, highly sensitive weighing sensors, light conditions inside the RVM, and transportation of the heavy mechanical body of the machine. The machine enclosure was made of metal for effective operation in outdoor conditions, which made the overall machine heavy and difficult to transport. Hence, at the time of deployment, we needed a dedicated vehicle to carry it to the destination, and a few people to load and unload the machine. In order to reduce the deployment cost, we used a cheaper motor, resulting in jerky and noisy conveyor behavior. The light conditions inside the RVM, as well as the highly sensitive weighing sensor, were other prominent issues faced after the development of the machine. However, both of these issues were resolved by installing a bulb inside the machine and by eventually replacing the weight parameter with length, in order to determine weight of the bottle.
4. Conclusions
The Reverse Vending Machine can play a key role in reducing plastic bottle pollution. Along with an accurate bottle classification model, the cost of the RVM is also crucial if it is to be deployed on a mass scale. The machine discussed will also raise public awareness of plastic recycling by rewarding users for every piece of plastic. The machine learning model deployed in the proposed RVM is both accurate and lightweight. Hence, it helped reduce computing power, and eventually, cost.
Among the different pre-trained models, MobileNet has 99.2% accuracy, while its size is only 47 MB. Furthermore, conversion of MobileNet into Tensorflow lite version compresses its size from 47 MB to 14 MB, which can run robustly on low computing devices. In addition to an accurate and lightweight deep learning model, the machine is fabricated in-house, and uses electronic devices that are available locally, to push the machine cost down to only 750 USD.
As for the future work, there is a lot that can be done, relative to an increase of the machine cost. Firstly the scope of the machine can be widened by accepting a greater variety of material waste, including glass and metal. This would require an advance sorting system that can identify different materials, along with multiple processing setups for each material type. Furthermore, the conveyor motor can be replaced with a stepper motor to make the conveyor operation smoother and noise-free. Lastly, the machine body is made of metal, which makes it heavy but rigid. With rising interest in material engineering, a detailed review of the enclosure material can help make the machine both lightweight and rigid at the same time.


 ,
, 


