
The Recycling of End-of-Life Lithium-Ion Batteries and the Phase Characterisation of Black Mass
 , , , , and
Abstract
:1. Introduction
2. Overview of Analytical Methods
- Manual scanning electron microscopy (SEM), with linked energy dispersive spectrometers (EDS).
- Automated SEM-EDS.
- Micro X-ray computed tomography (X-CT).
- Scanning Micro-XRF elemental and phase analysis (Micro-XRF).
- Laser ablation inductively coupled plasma mass spectrometry (LA-ICP-MS).
2.1. SEM-EDS
2.2. Automated Phase Analysis
2.3. Micro X-CT
2.4. Micro-XRF
2.5. LA-ICP-MS
3. Phase Characterisation
3.1. Visual Examination and Binocular Microscopy
3.2. Sample Preparation
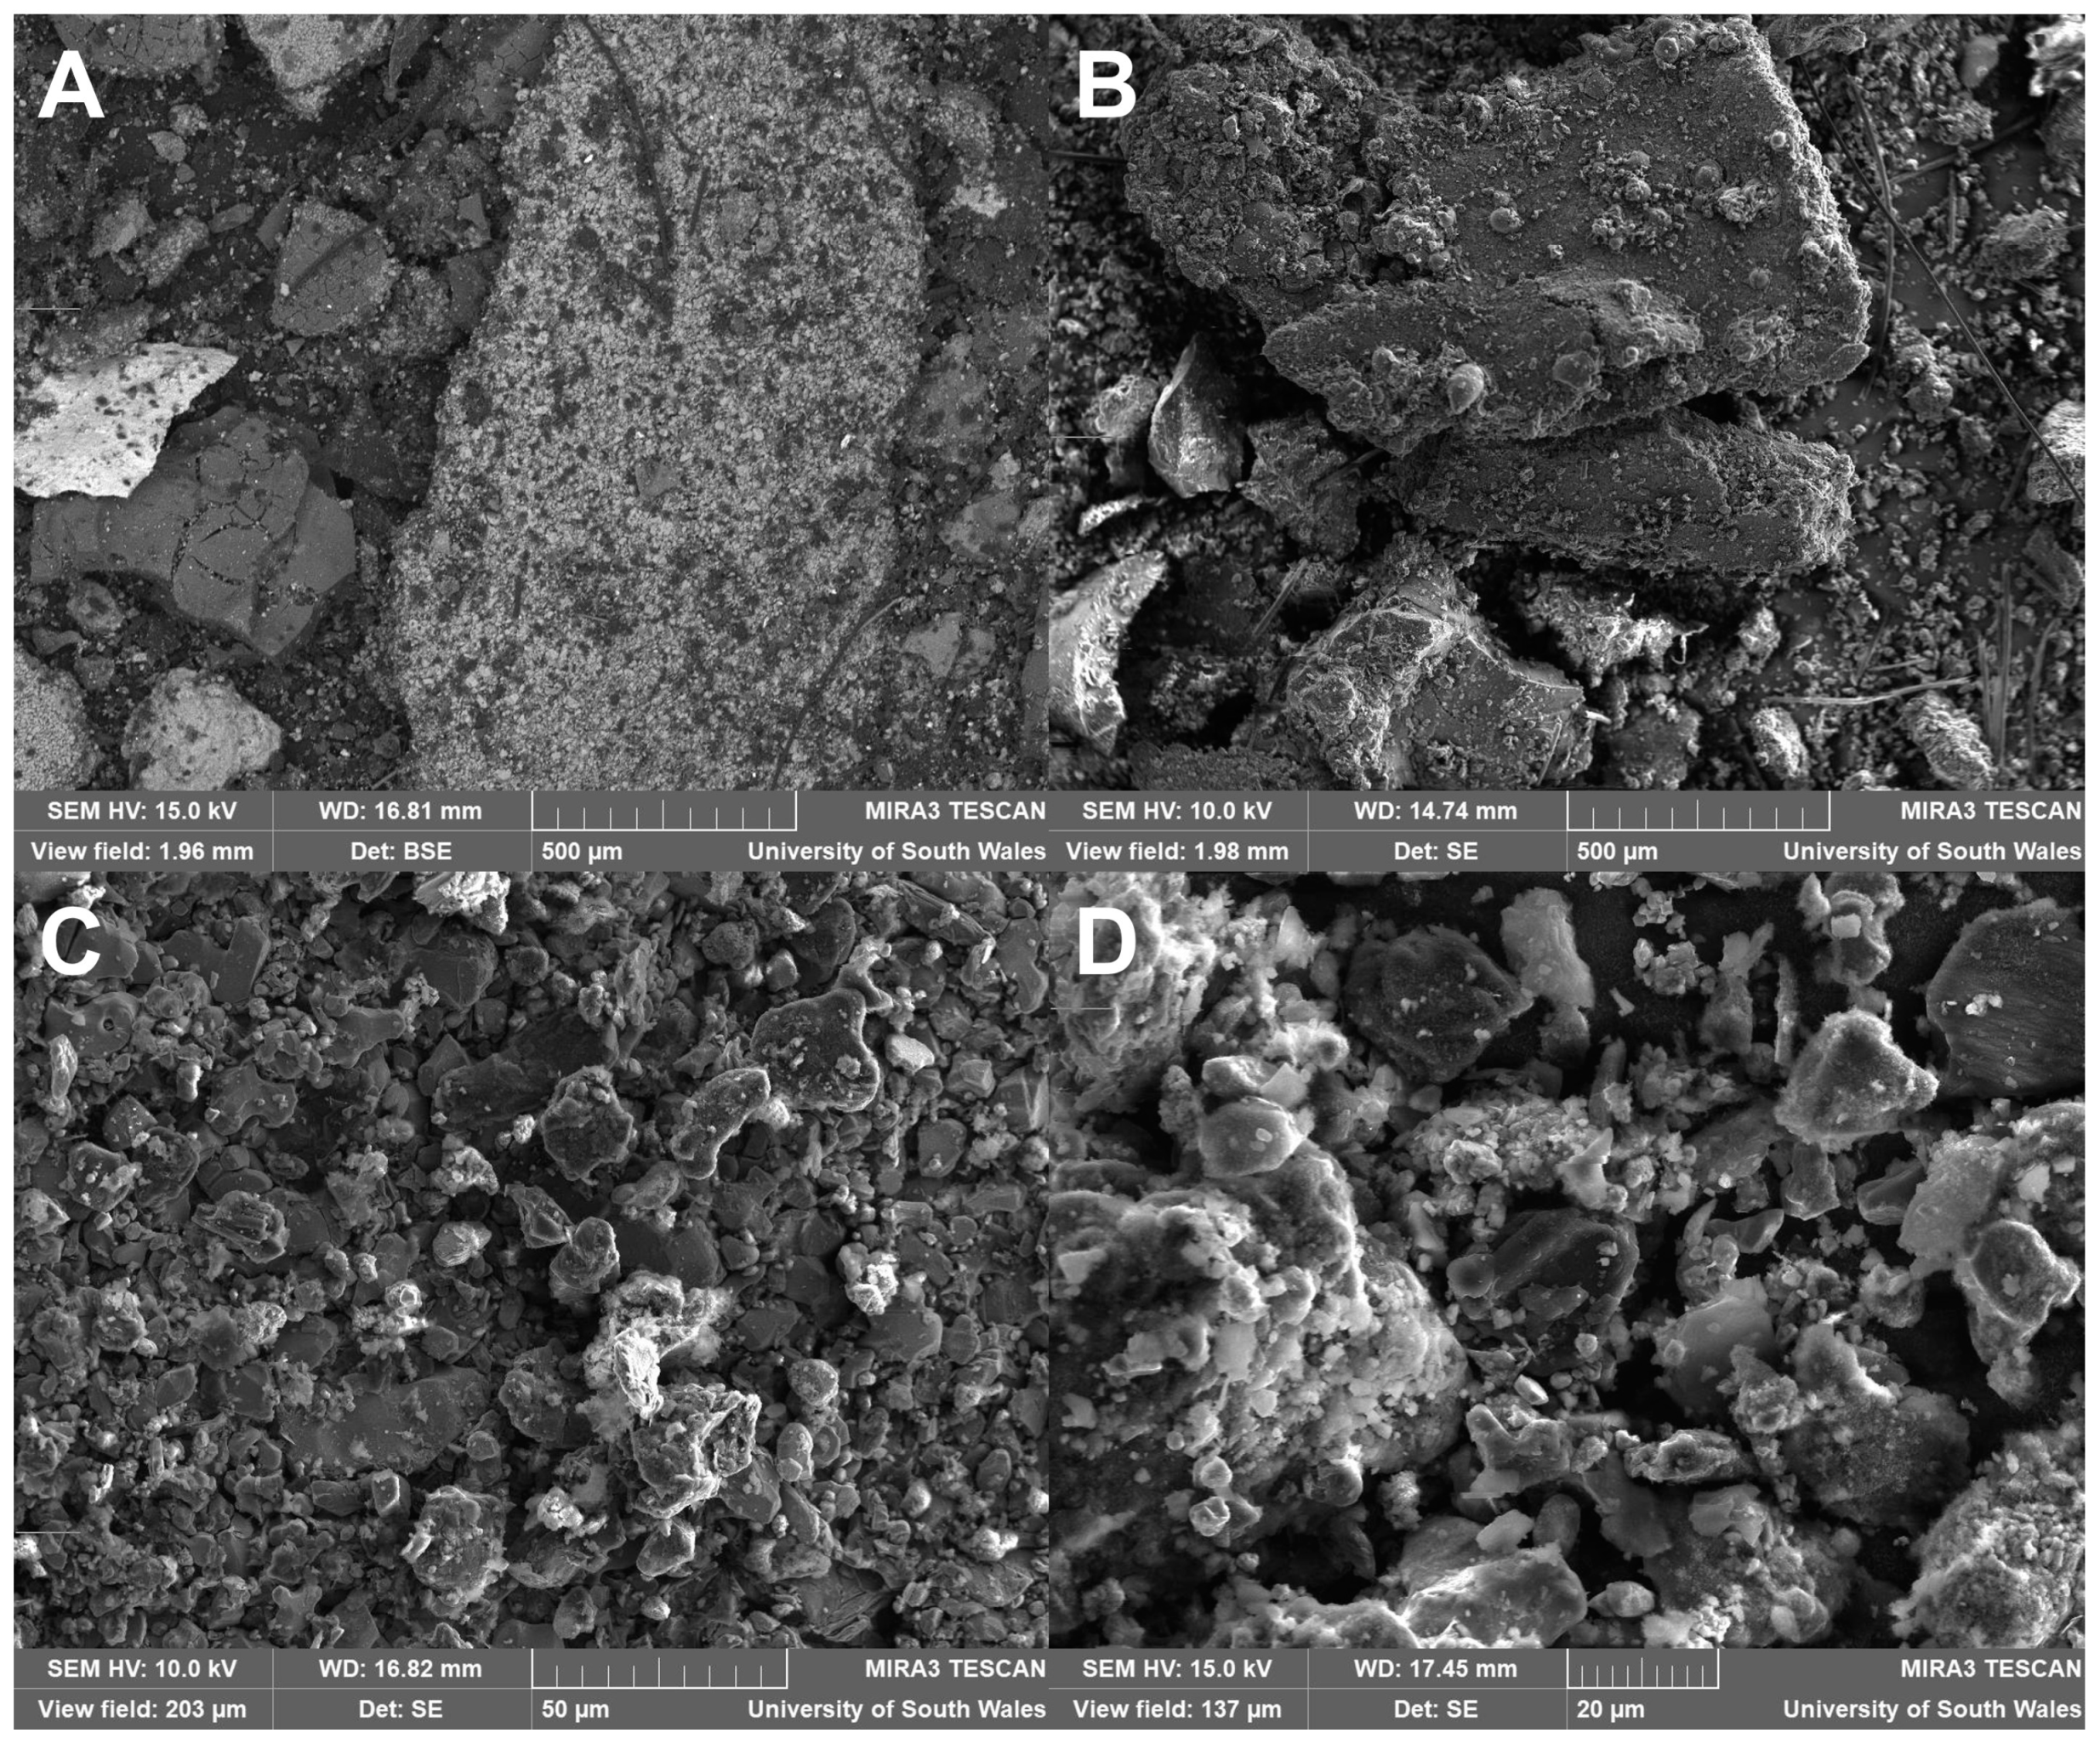
3.3. Manual SEM
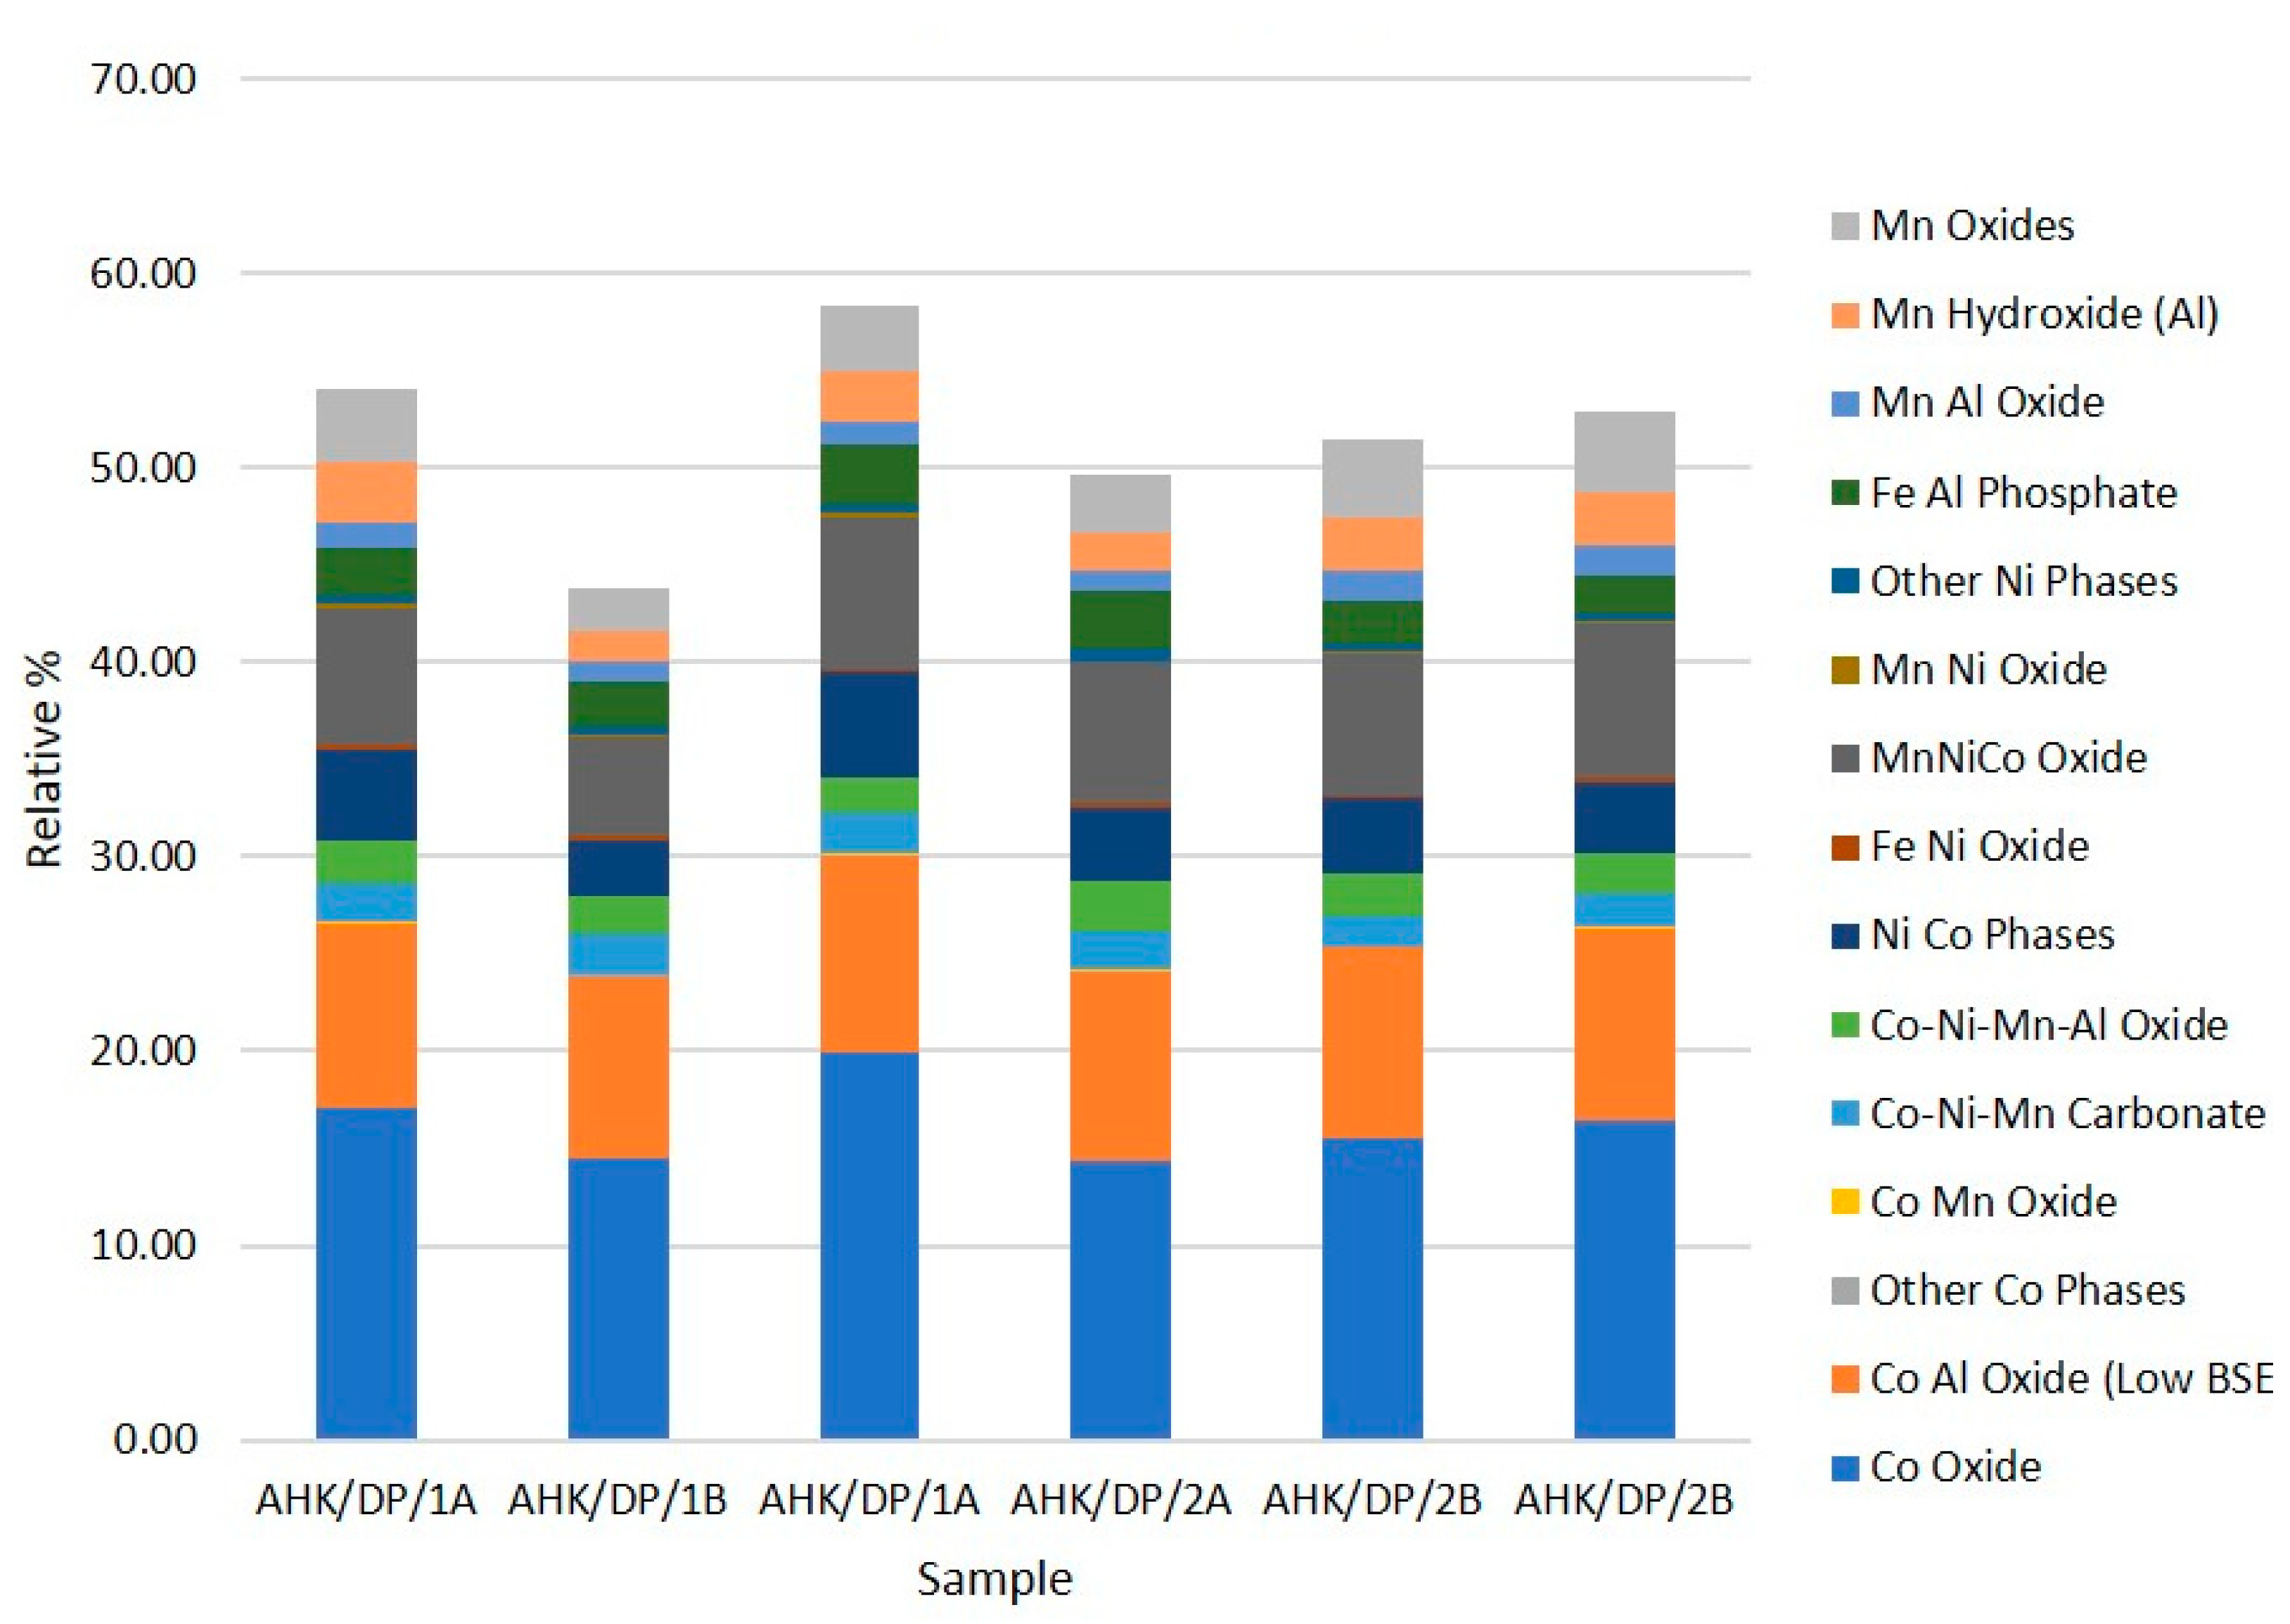
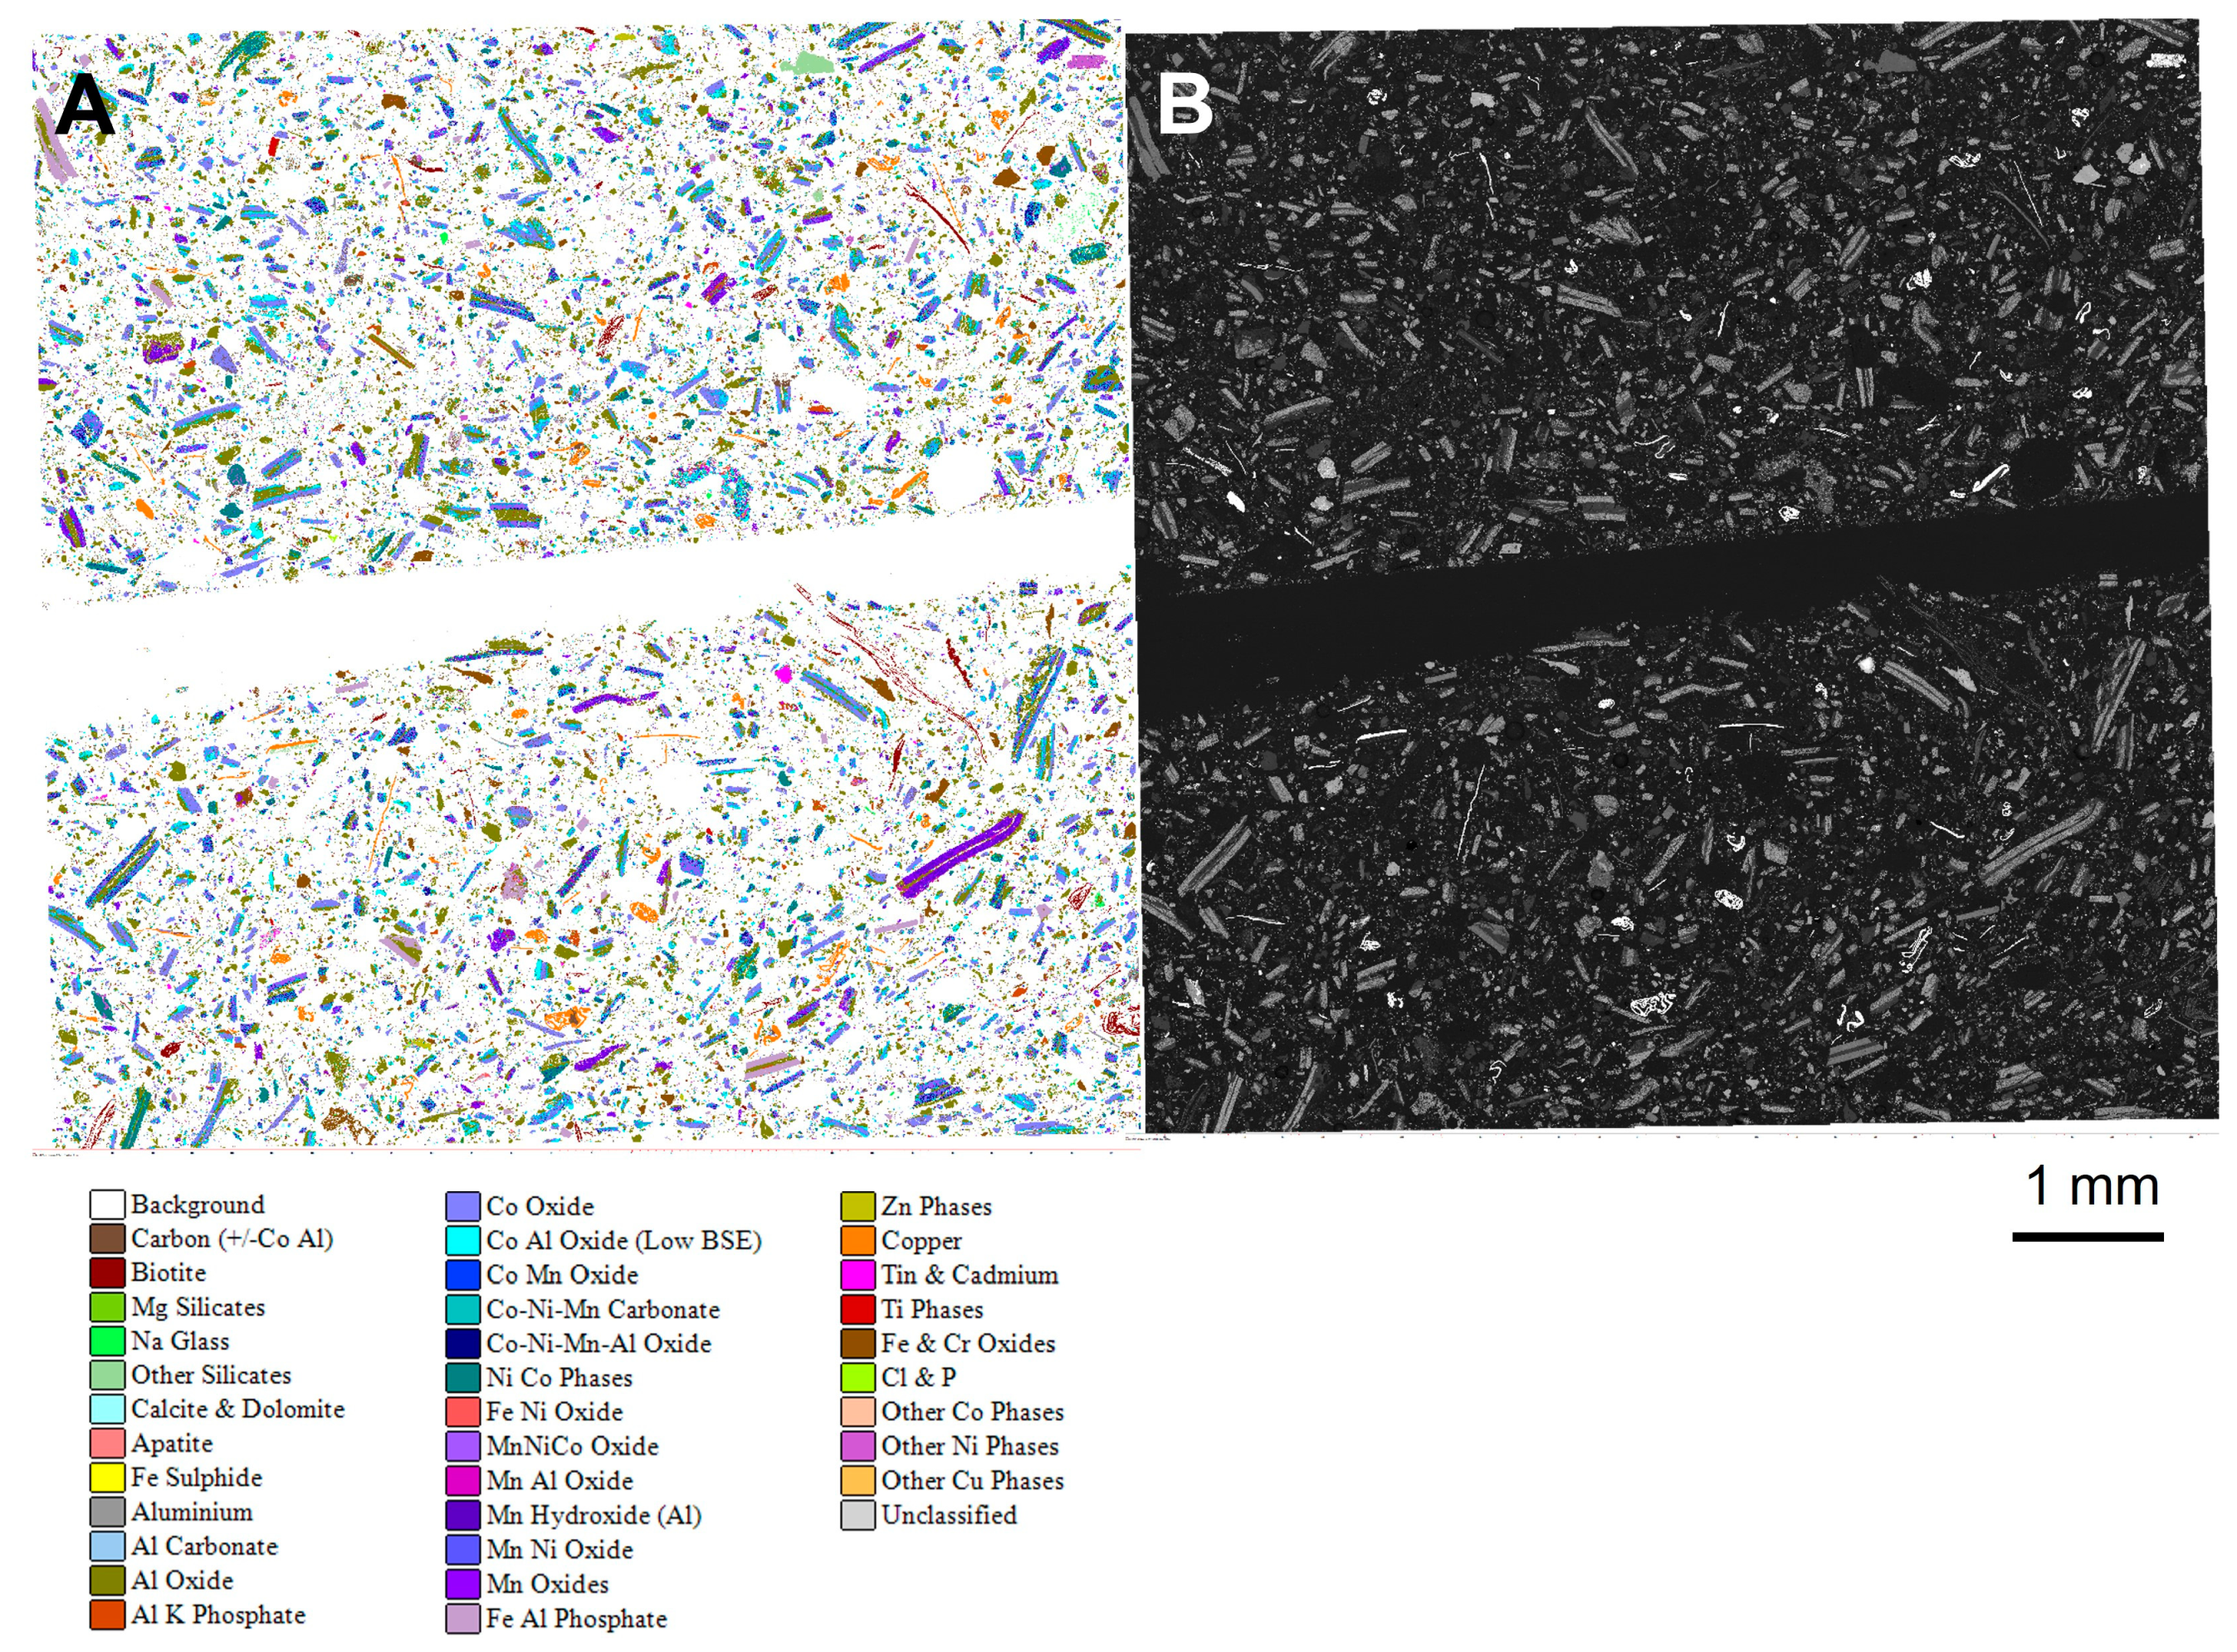
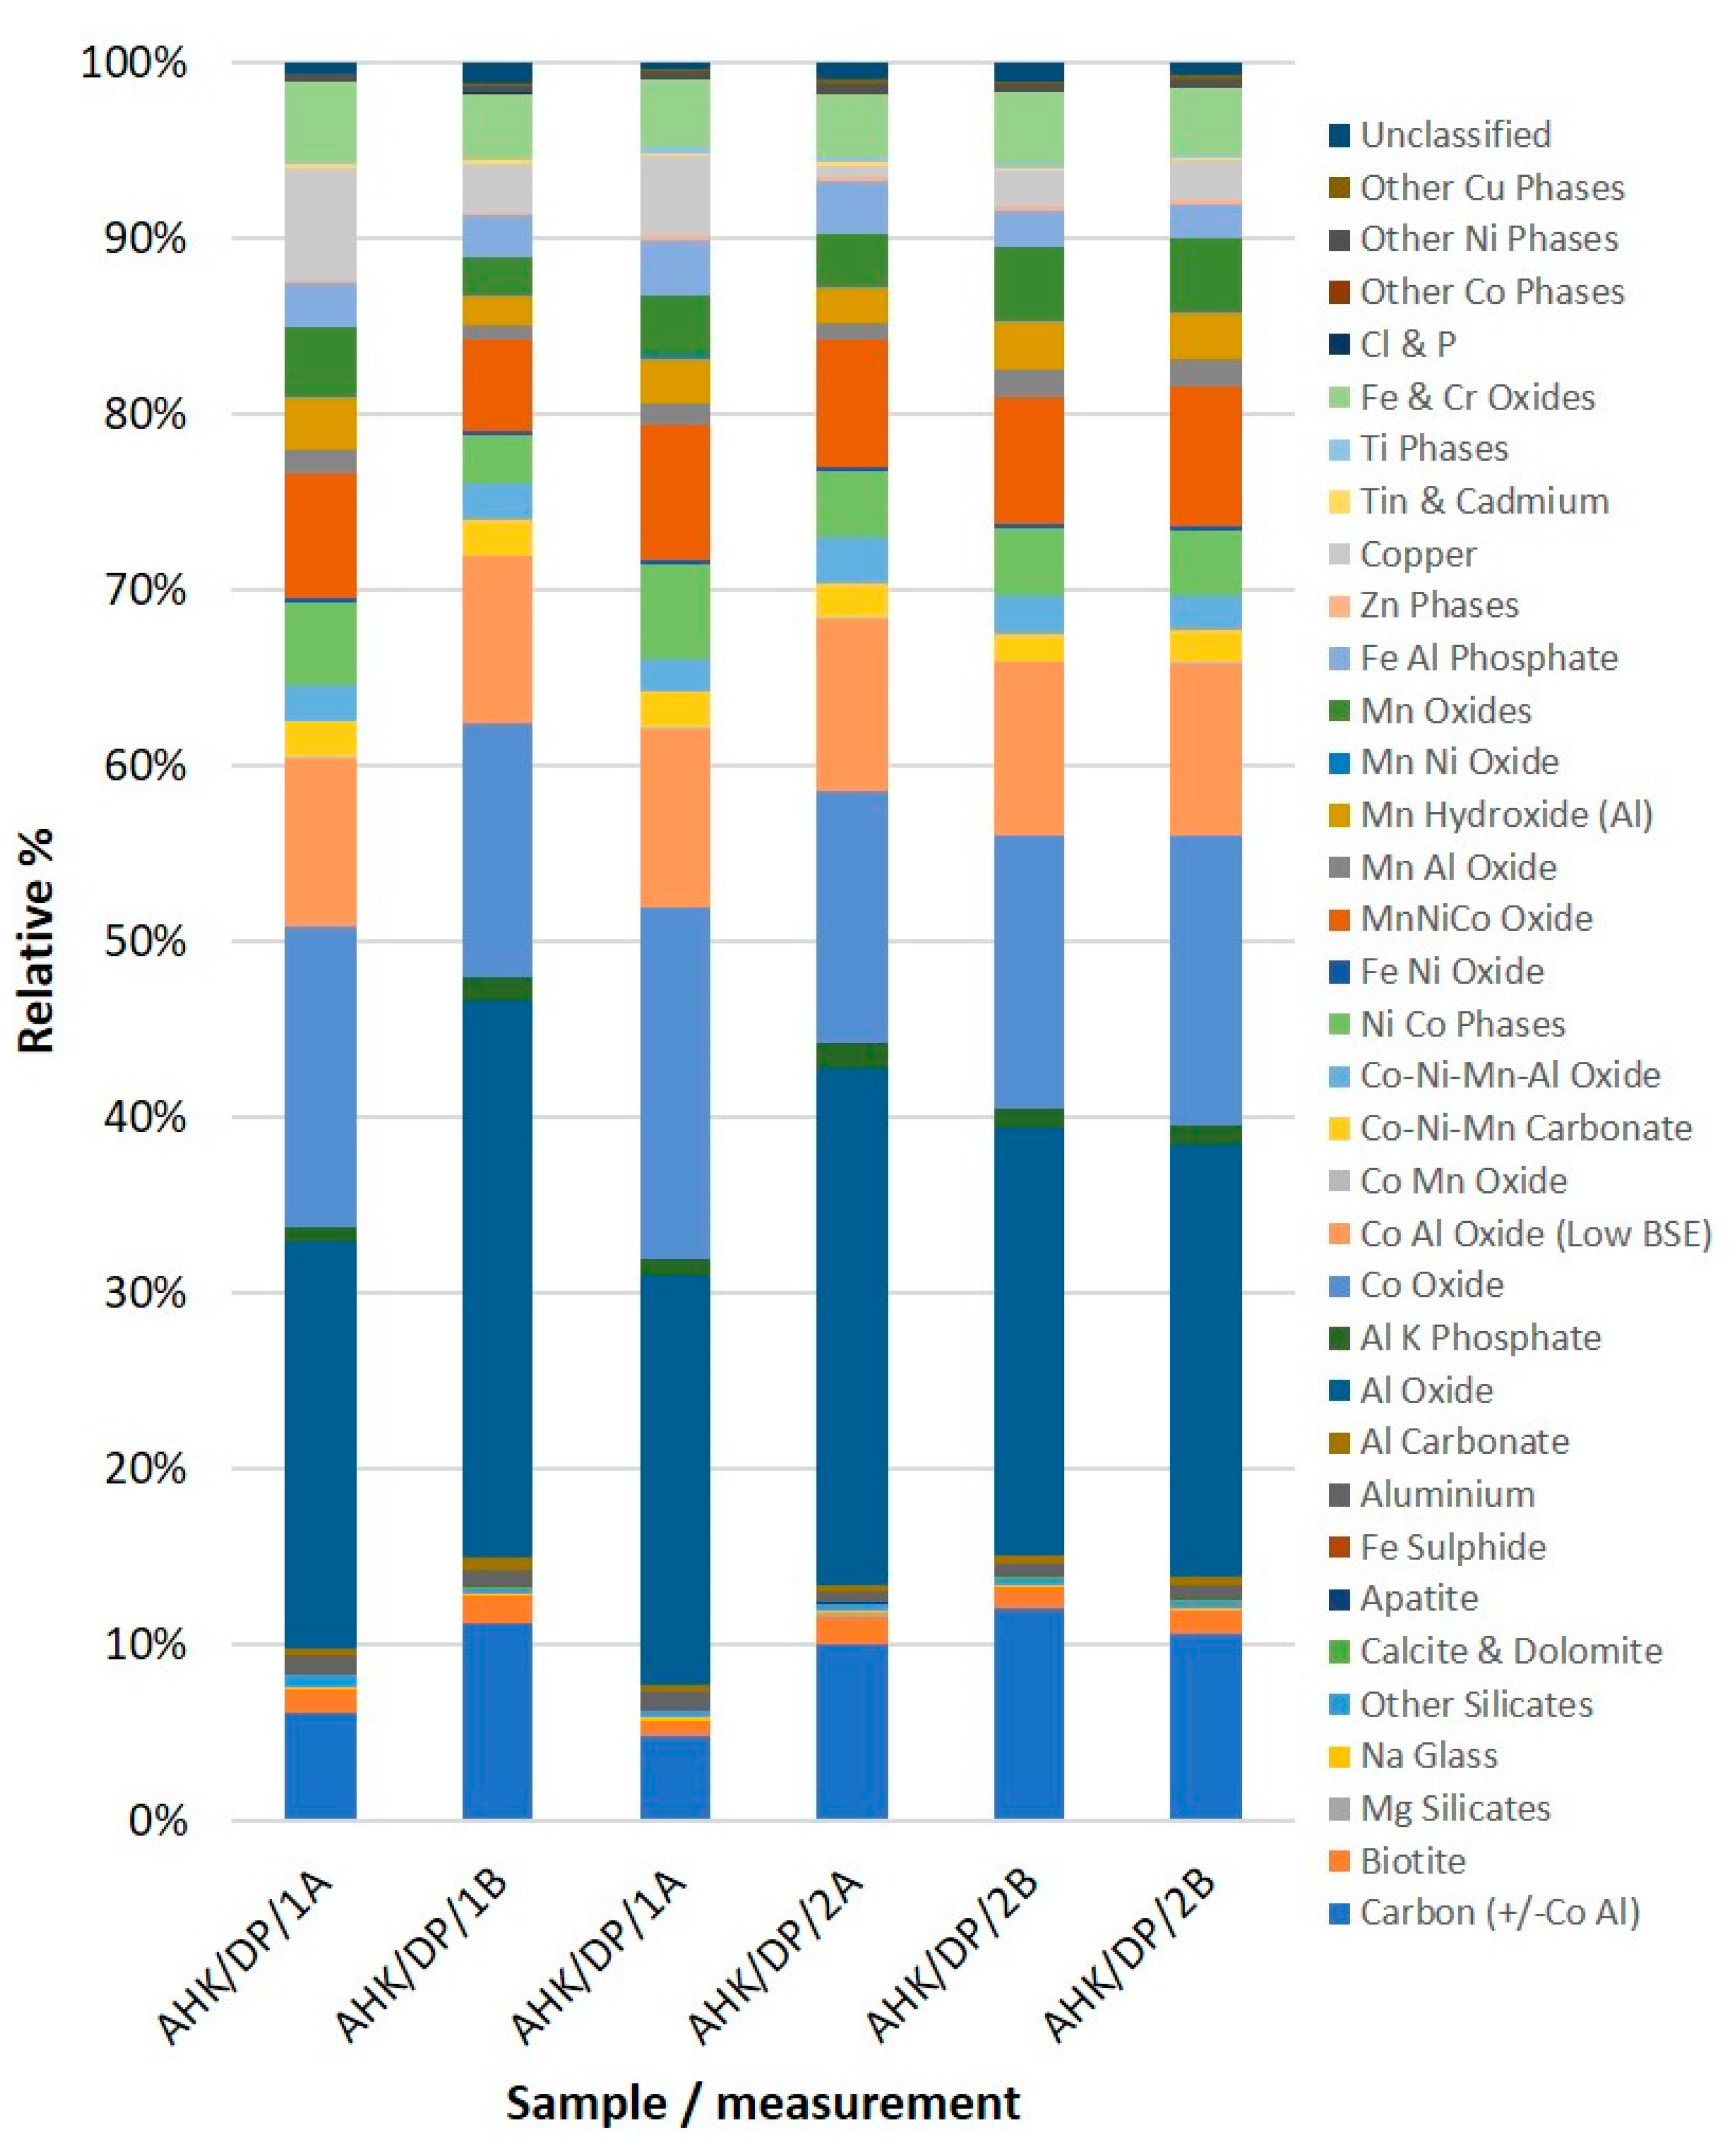
3.4. Automated Phase Analysis
- Replicate block A—An area including the two cross-sectioned halves in the block (100× magnification/1.6 µm measurement resolution).
- Replicate block B—An elongated area of one of the sectioned halves (100× magnification/1.6 µm measurement resolution).
- A detailed area of one of the halves (150× magnification/0.83 µm measurement resolution).
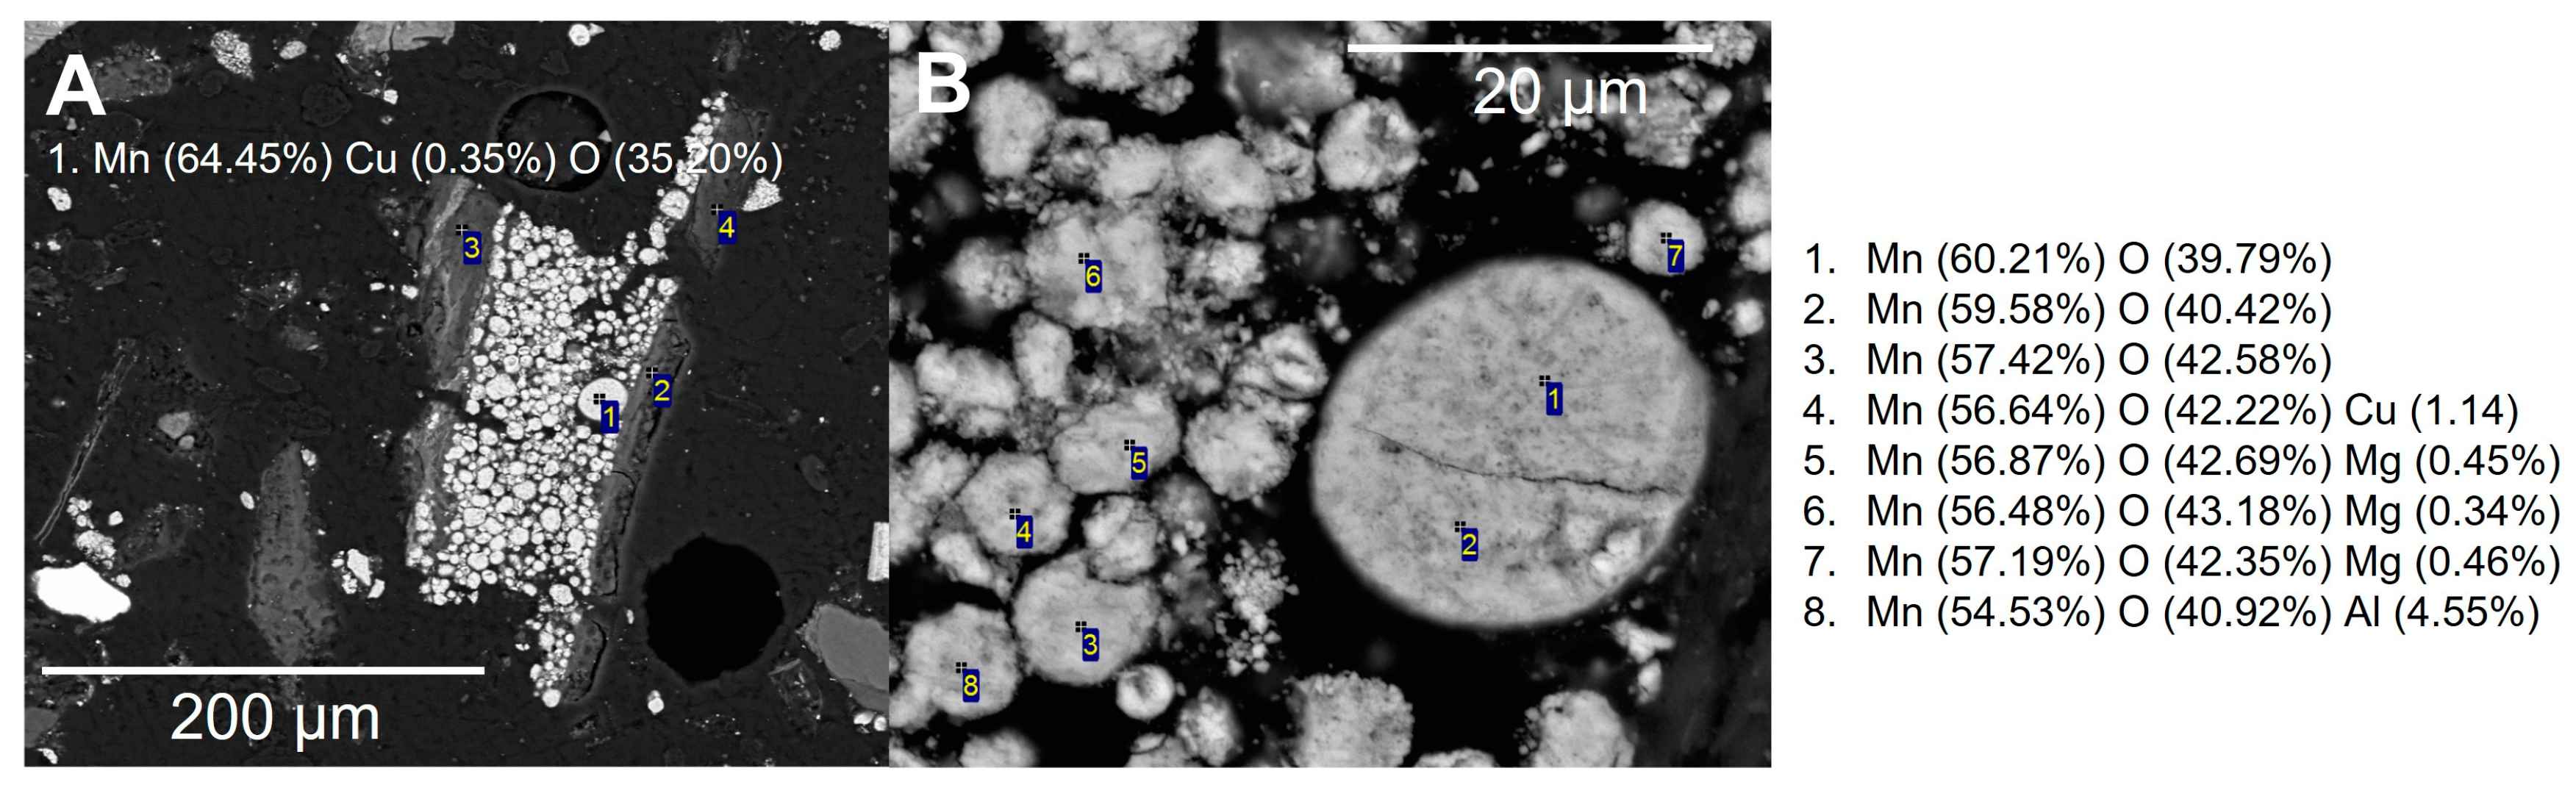
3.5. Interactive SEM-EDS Analysis
3.6. Micro X-CT
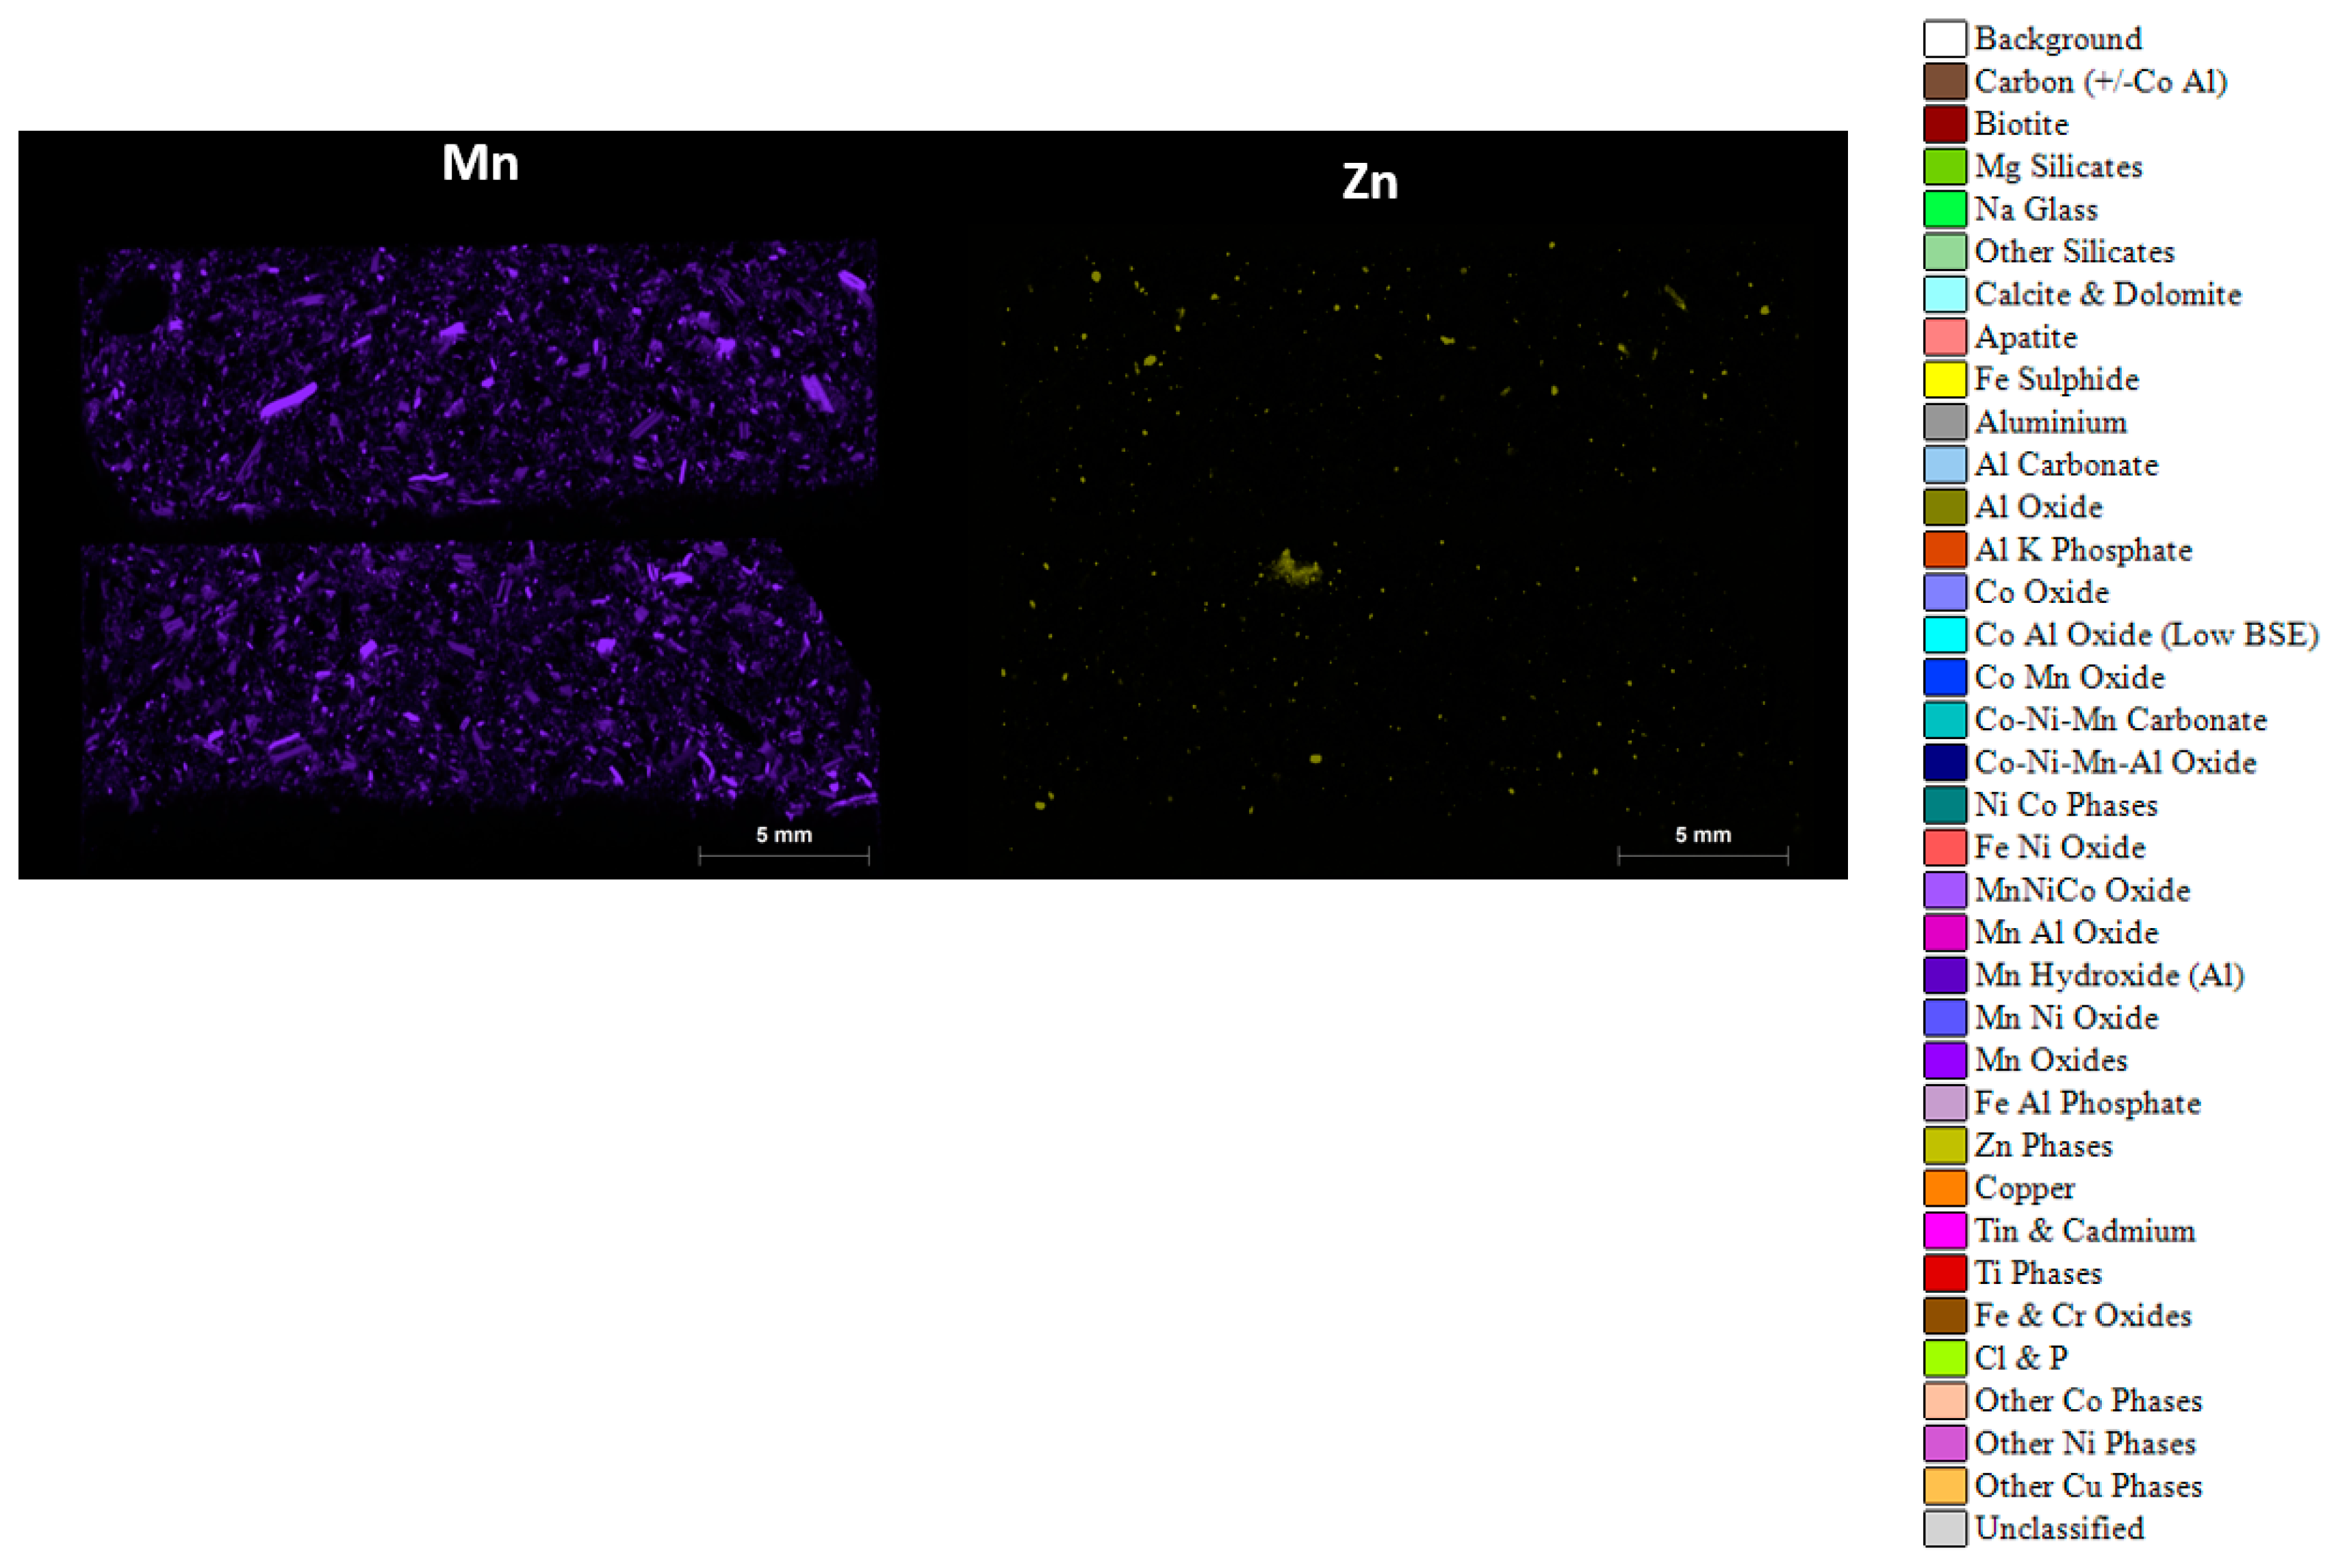
3.7. Micro-XRF
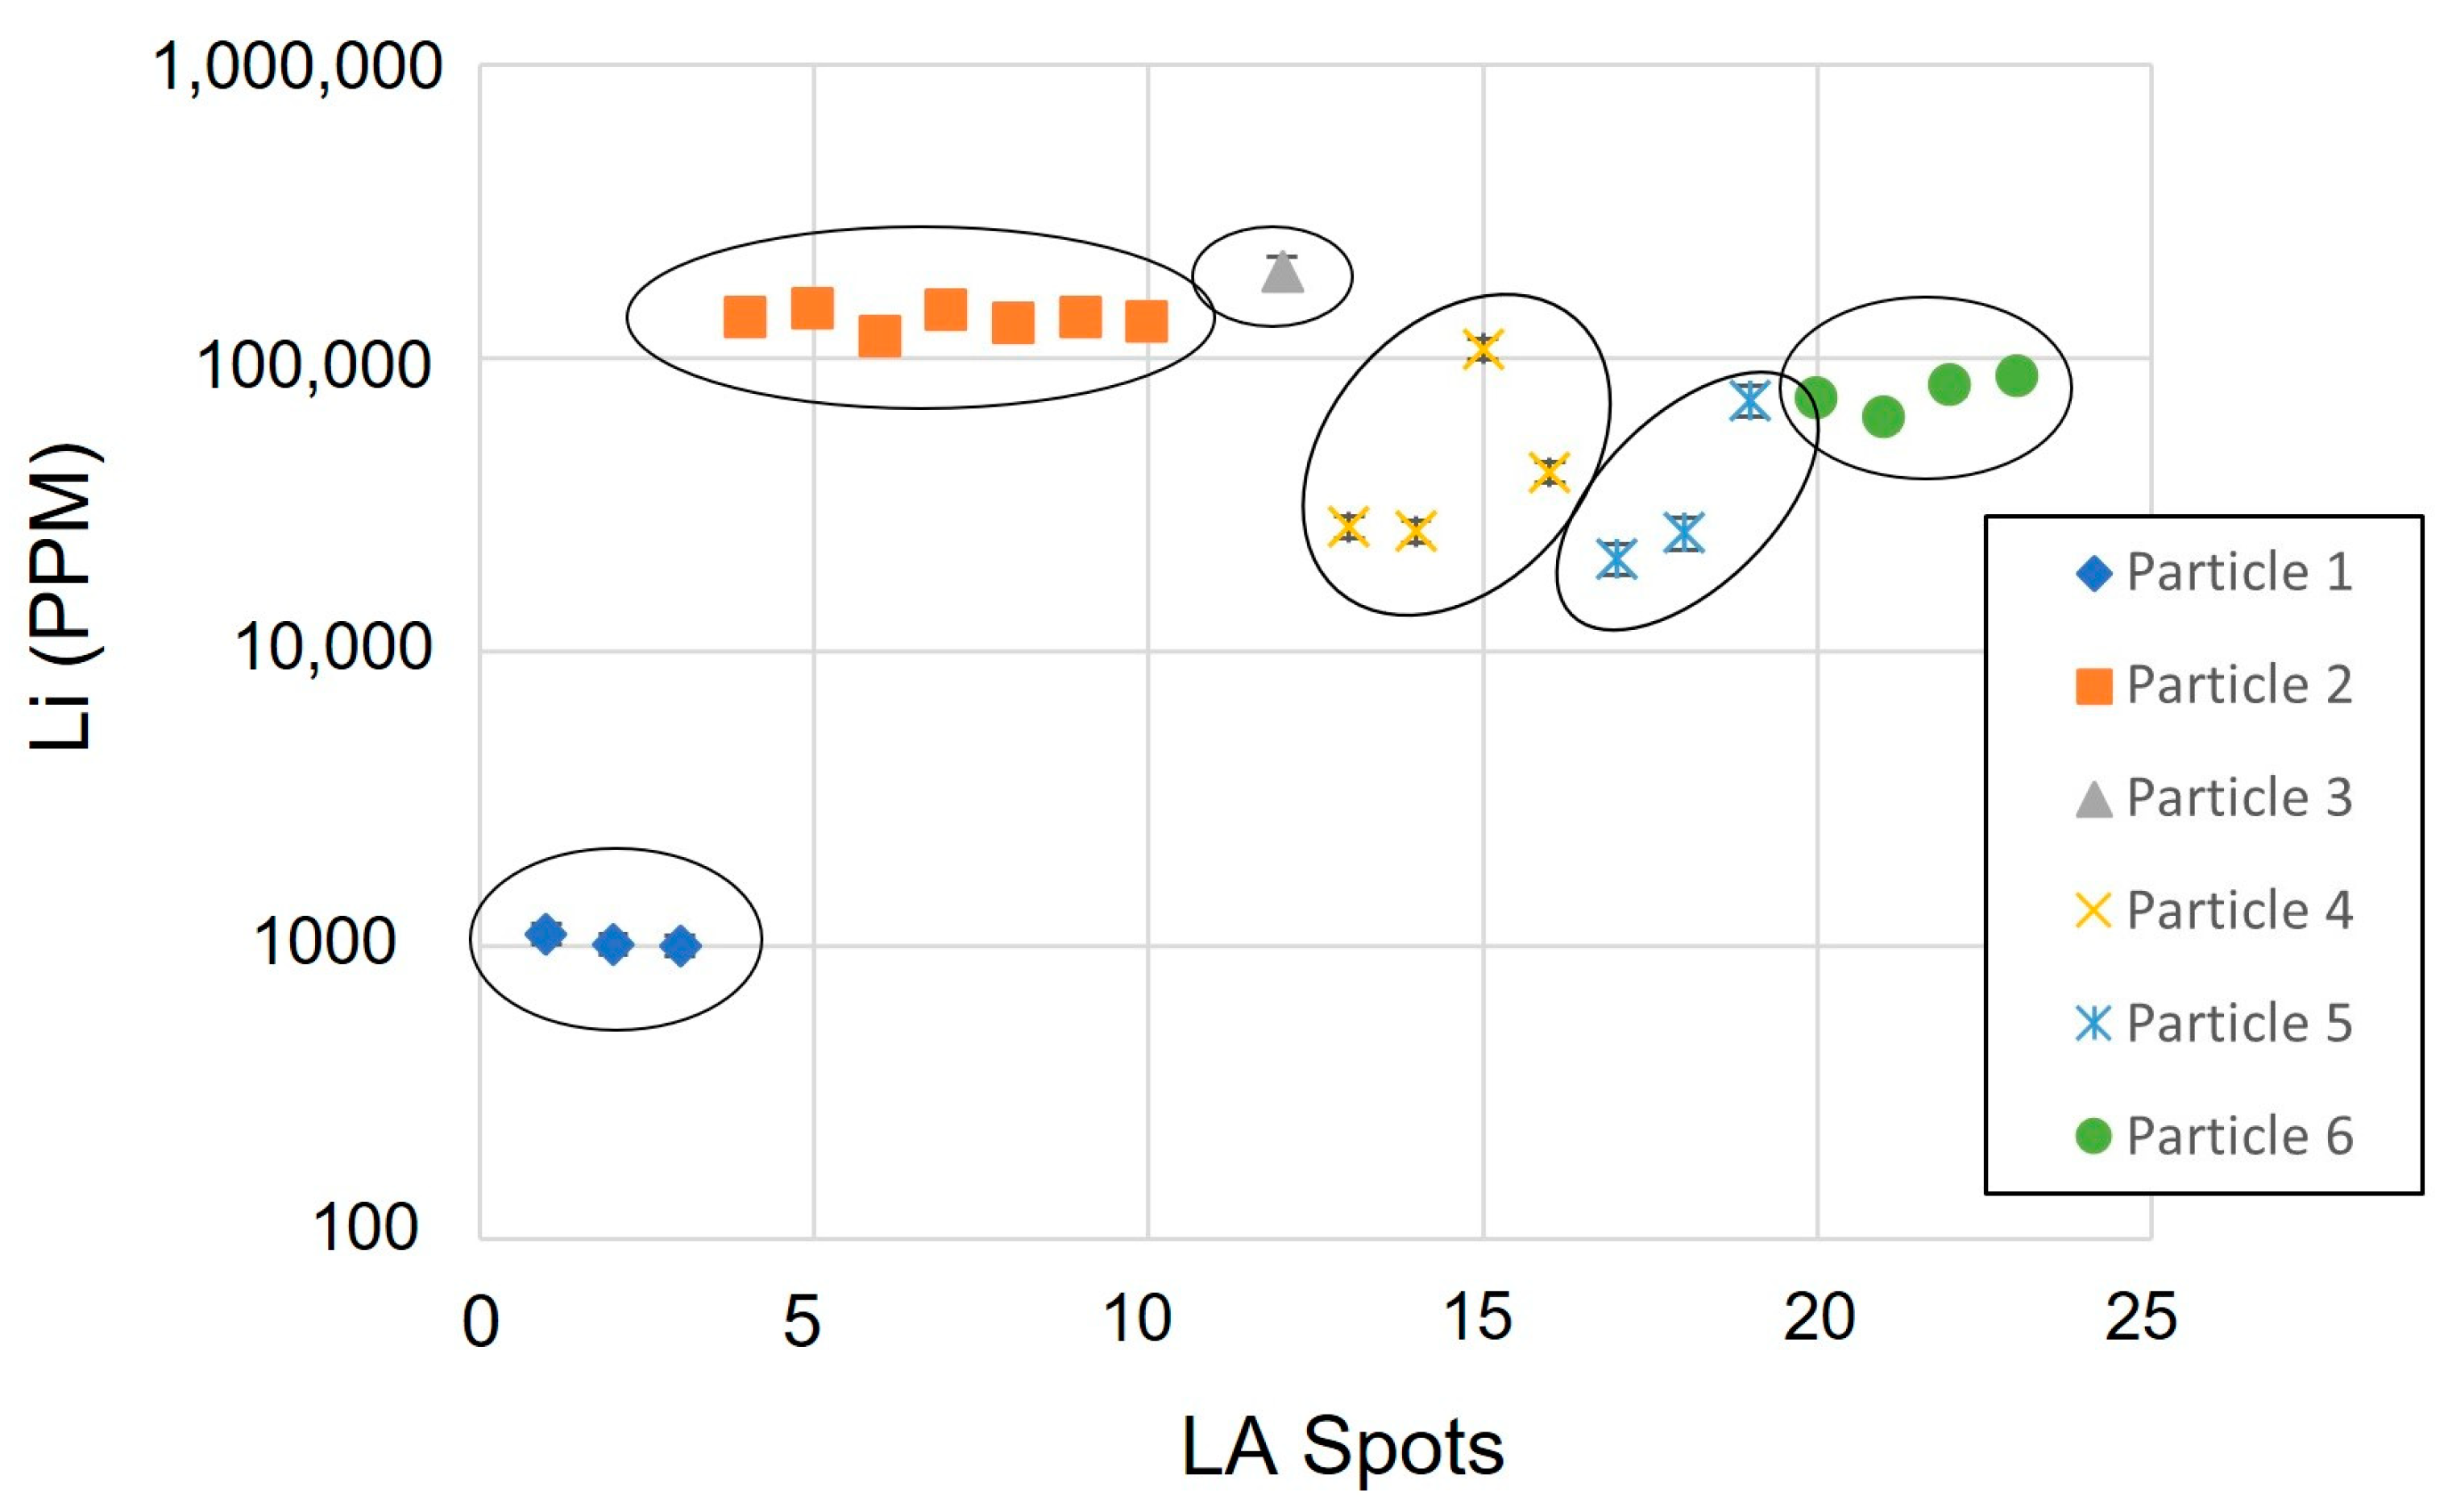
4. Detection and Quantification of Lithium
5. Discussion
- To confirm that a recycled battery material being purchased, sold or traded is actually black mass.
- For the characterisation of the component phases present, prior to sampling and sample preparation.
- To provide quality control measures and to monitor the effectiveness of the preliminary processing stages such as shredding and pyrolysis. Particle and grain size data are important factors in the design and optimisation of grinding circuits.
- To assist in determining the optimal hydrometallurgical and/or pyrometallurgical processing route.
- To detect and quantify payable and penalty phases, which may hinder valuable or precious metal recovery.
- To identify, manage and mitigate hazards and associated levels of risk.
- To assist in determining whether black mass should be regarded as a ‘waste’ or ‘commodity’.
6. Conclusions
Author Contributions
Funding
Data Availability Statement
Conflicts of Interest
Appendix A

| Phase | Description |
|---|---|
| Carbon | Graphite. |
| Biotite | Biotite and phlogopite mica. Typically occurs in long, expanded flakes. |
| Mg Silicates | Mg silicates such as talc and serpentine. |
| Na Glass | Na-bearing glass compositions. Often occurs as small prills and elongated rod-like particles. May also include other glass compositions (e.g., Ca-bearing glasses, etc.). |
| Other Silicates | Quartz, feldspar and other silicates. May include either naturally occurring mineral matter or anthropogenic material. |
| Calcite and Dolomite | Calcite and dolomite. May include Ca oxides and hydroxides. |
| Apatite | Ca phosphates. |
| Fe Sulphide | Fe sulphides and sulphates. |
| Aluminium | Aluminium metal. |
| Al Carbonate | Carbon with a high Al content. May include aluminium metal finely mixed with carbon. |
| Al Oxide | Aluminium oxides and hydroxides. Typically with a low carbon content. |
| Al K Phosphate | Aluminium oxides and hydroxides containing minor amounts of P and K. Typically has a low carbon content. |
| Co Oxide | Granular masses of cobalt oxide. Granules typically less than approximately 15 microns and bound together with an organic binder. Comparatively low BSE indicates that light elements such as Li may also be present. |
| Co Al Oxide (Low BSE) | Aluminium-bearing cobalt oxide. Typically occurs between Co oxide granules, but also occurs as thick, uniform laminae. |
| Co Mn Oxide | Mn-bearing cobalt oxides. Occurs as occasional granules surrounded by an organic binder. |
| Co-Ni-Mn Carbonate | Nickel and cobalt-bearing cobalt oxides and hydroxides. Occurs as granules surrounded by an organic binder. |
| Co-Ni-Mn-Al Oxide_1 | Aluminium-bearing nickel and cobalt-bearing cobalt oxides and hydroxides. Occurs as granules surrounded by an organic binder. |
| Ni Co Phases | Nickel oxides and hydroxides containing small amounts of Co. Often occur as granular masses surrounded by an organic binder. The granules are generally spherical. May also occur as more massive particles. |
| Fe Ni Oxide | Fe oxides and hydroxides containing variable amounts of iron. May include Ni–Fe alloys. |
| MnNiCo Oxide | Similar to Co Ni Mn Oxide but with a slightly lower cobalt content. Occurs as granular masses surrounded by an organic binder. |
| Mn Al Oxide | Manganese-bearing aluminium oxide. High oxygen content but low carbon content. |
| Mn Hydroxide (Al) | Manganese oxide containing minor to trace amounts of Al. |
| Mn Ni Oxide | Nickel-bearing manganese oxides and hydroxides. Often occurs as spherical particles up to ~20 microns in diameter with a radial structure (possibly radiating fibres). |
| Mn Oxides | Mn oxides and hydroxides. Generally occur as aggregates of irregular, angular particles cemented with an organic binder. |
| Fe Al Phosphate | Aluminium-bearing iron phosphate. Occurs as thick, massive laminae up to approximately 100 microns across. Some particles are coated in a layer of aluminium-rich iron phosphate, which has a much lower BSE brightness. |
| Zn Phases | Zinc-bearing phases including zinc oxides, hydroxides and zinc-bearing manganese oxides. |
| Copper | Copper metal. Typically occurs as twisted masses (likely thin, folded sheets). |
| Tin and Cadmium | Cadmium and tin-bearing particles. Most have a high BSE so are likely metal fragments. |
| Ti Phases | Titanium oxides. Fine grained (submicron) granular aggregates are bound by a low BSE (e.g., organic) binder. |
| Fe and Cr Oxides | Iron oxides and hydroxides. Chromium phases are included for brevity. |
| Cl and P | Chlorine and/or phosphorus-bearing materials. Likely organic material or plastics. |
| Other Co Phases | Cobalt-bearing phases not included above. Includes oxides and fluorides. Cobalt typically present only in trace to minor amounts. |
| Other Ni Phases | Nickel phases not included above. Typically includes nickel–REE alloys and oxides. |
| Other Cu Phases | Copper-bearing phases such as copper-aluminium oxides and hydroxides. |
| Unclassified | Particles not reporting to the above categories. May include alloys and hydroxides containing Fe, Co, Ni and Mn in varying amounts. |
Appendix B
| Sample Name | AHK/DP/1 | AHK/DP/1 | AHK/DP/1 | AHK/DP/2 | AHK/DP/2 | AHK/DP/2 |
|---|---|---|---|---|---|---|
| Sample Type | Unprepared | Unprepared | Unprepared | Crushed | Crushed | Crushed |
| Replicate Number | 1A | 1B | 1A | 2A | 2B | 2B |
| Analysis resolution | 1.59 | 1.59 | 0.83 | 1.59 | 1.59 | 0.83 |
| Carbon (+/−Co Al) | 6.17 | 11.21 | 4.89 | 10.08 | 12.05 | 10.62 |
| Biotite | 1.35 | 1.56 | 0.84 | 1.58 | 1.21 | 1.32 |
| Mg Silicates | 0.03 | 0.09 | 0.03 | 0.17 | 0.06 | 0.06 |
| Na Glass | 0.13 | 0.08 | 0.13 | 0.12 | 0.10 | 0.07 |
| Other Silicates | 0.62 | 0.25 | 0.36 | 0.37 | 0.32 | 0.42 |
| Calcite and Dolomite | 0.04 | 0.07 | 0.05 | 0.08 | 0.11 | 0.03 |
| Apatite | 0.00 | 0.03 | 0.00 | 0.01 | 0.00 | 0.00 |
| Fe Sulphide | 0.02 | 0.00 | 0.02 | 0.00 | 0.00 | 0.00 |
| Aluminium | 1.07 | 1.00 | 1.08 | 0.69 | 0.70 | 0.84 |
| Al Carbonate | 0.40 | 0.65 | 0.35 | 0.27 | 0.49 | 0.56 |
| Al Oxide | 23.05 | 31.68 | 23.20 | 29.42 | 24.33 | 24.52 |
| Al K Phosphate | 0.94 | 1.36 | 1.05 | 1.43 | 1.15 | 1.11 |
| Co Oxide | 17.08 | 14.46 | 19.97 | 14.33 | 15.49 | 16.45 |
| Co Al Oxide (Low BSE) | 9.52 | 9.42 | 10.12 | 9.78 | 9.84 | 9.83 |
| Co Mn Oxide | 0.05 | 0.06 | 0.04 | 0.07 | 0.06 | 0.05 |
| Co-Ni-Mn Carbonate | 2.01 | 2.00 | 2.09 | 1.94 | 1.60 | 1.78 |
| Co-Ni-Mn-Al Oxide | 2.10 | 2.07 | 1.87 | 2.65 | 2.09 | 2.01 |
| Ni Co Phases | 4.69 | 2.77 | 5.37 | 3.72 | 3.88 | 3.68 |
| Fe Ni Oxide | 0.26 | 0.23 | 0.24 | 0.25 | 0.25 | 0.23 |
| MnNiCo Oxide | 7.10 | 5.16 | 7.74 | 7.27 | 7.21 | 7.94 |
| Mn Al Oxide | 1.32 | 0.94 | 1.20 | 0.98 | 1.61 | 1.59 |
| Mn Hydroxide (Al) | 3.02 | 1.64 | 2.53 | 2.00 | 2.75 | 2.71 |
| Mn Ni Oxide | 0.15 | 0.08 | 0.24 | 0.08 | 0.08 | 0.10 |
| Mn Oxides | 3.85 | 2.13 | 3.40 | 2.95 | 4.06 | 4.11 |
| Fe Al Phosphate | 2.46 | 2.32 | 3.13 | 3.06 | 2.09 | 1.93 |
| Zn Phases | 0.20 | 0.14 | 0.16 | 0.16 | 0.23 | 0.21 |
| Copper | 6.32 | 2.73 | 4.59 | 0.64 | 2.03 | 2.28 |
| Tin and Cadmium | 0.29 | 0.24 | 0.18 | 0.23 | 0.23 | 0.17 |
| Ti Phases | 0.13 | 0.11 | 0.28 | 0.18 | 0.14 | 0.05 |
| Fe and Cr Oxides | 4.50 | 3.70 | 3.91 | 3.68 | 4.11 | 3.86 |
| Cl and P | 0.02 | 0.04 | 0.04 | 0.02 | 0.01 | 0.01 |
| Other Co Phases | 0.01 | 0.01 | 0.01 | 0.00 | 0.02 | 0.05 |
| Other Ni Phases | 0.47 | 0.46 | 0.42 | 0.56 | 0.49 | 0.45 |
| Other Cu Phases | 0.08 | 0.07 | 0.13 | 0.19 | 0.18 | 0.22 |
| Unclassified | 0.56 | 1.22 | 0.38 | 1.03 | 1.04 | 0.77 |
| Total | 100.00 | 100.00 | 100.00 | 100.00 | 100.00 | 100.00 |
References
- Chen, M.; Zheng, Z.; Wang, Q.; Zhang, Y.; Ma, X.; Chen, C.; Xu, D.; Liu, J.; Gionet, P.; O’Connor, I.; et al. Closed loop recycling of electric vehicle batteries to enable ultrahigh quality cathode powder. Sci. Rep. 2019, 9, 1654. [Google Scholar] [CrossRef]
- Pell, R.; Tijsseling, L.; Goodenough, K.; Wall, F.; Dehaine, Q.; Grant, A.; Deak, D.; Yan, X.; Whattoff, P. Towards sustainable extraction of technology materials through integrated approaches. Nat. Rev. Earth Environ. 2021, 2, 665–679. [Google Scholar] [CrossRef]
- Harper, G.; Sommerville, R.; Kendrick, E.; Driscoll, L.; Slater, P.; Stolkin, R.; Walton, A.; Christensen, P.; Heidrich, O.; Lambert, S.; et al. Recycling lithium-ion batteries from electric vehicles. Nature 2019, 575, 75–86. [Google Scholar] [CrossRef] [Green Version]
- Brückner, L.; Frank, J.; Elwert, T. Industrial Recycling of Lithium-Ion Batteries: A Critical Review of Metallurgical Process Routes. Metals 2020, 10, 1107. [Google Scholar] [CrossRef]
- Werner, D.; Peuker, U.A.; Mütze, T. Recycling chain for spent lithium-ion batteries. Metals 2020, 10, 316. [Google Scholar] [CrossRef] [Green Version]
- Diekmann, J.; Hanisch, C.; Froböse, L.; Schalicke, G.; Loellhoeffel, T.; Folster, A.-S.; Kwade, A. Ecological recycling of lithium-ion batteries from electric vehicles with focus on mechanical processes. J. Electrochem. Soc. 2017, 164, A6184–A6191. [Google Scholar] [CrossRef]
- Or, T.; Gourley, S.W.D.; Kaliyappan, K.; Yu, A.; Chen, Z. Recycling of mixed cathode lithium-ion batteries for electric vehicles: Current status and future outlook. Carbon Energy 2019, 2, 6–43. [Google Scholar] [CrossRef] [Green Version]
- Bruno, M.; Fiore, S. Material Flow Analysis of Lithium-Ion Battery Recycling in Europe: Environmental and Economic Implications: Environmental and Economic Implications. Batteries 2023, 9, 231. [Google Scholar] [CrossRef]
- Baars, J.; Domenech, T.; Bleischwitz, R.; Melin, H.E.; Heidrich, O. Circular economy strategies for electric vehicle batteries reduce reliance on raw materials. Nat. Sustain. 2021, 4, 71–79. [Google Scholar] [CrossRef]
- Barik, S.P.; Prabaharan, G.; Kumar, L. Leaching and separation of Co and Mn from electrode materials of spent lithium-ion batteries using hydrochloric acid: Laboratory and pilot scale study. J. Clean. Prod. 2017, 147, 37–43. [Google Scholar] [CrossRef]
- Friedrich, B.; Schwich, L. New science-based concepts for increased efficiency in battery recycling. Metals 2020, 11, 533. [Google Scholar] [CrossRef]
- Liu, J.; Wang, H.; Hu, T.; Bai, X.; Wang, S.; Xie, W.; Hao, J.; He, Y. Recovery of LiCoO2 and graphite from spent lithium-ion batteries by cryogenic grinding and froth flotation. Miner. Eng. 2020, 148, 106223. [Google Scholar] [CrossRef]
- Lu, J.; Wu, T.; Amine, K. Start-of-the-art characterization techniques for advanced lithium-ion batteries. Nat. Energy 2017, 2, 17011. [Google Scholar] [CrossRef]
- Pinegar, H.; Smith, Y.R. End-of-life lithium-ion battery component mechanical liberation and separation. JOM 2019, 71, 4447–4456. [Google Scholar] [CrossRef]
- Ruismaki, R.; Rinne, T.; Dańczak, A.; Taskinen, P.; Serna-Guerreop, R.; Jokilaakso, A. Integrating flotation and pyrometallurgy for recovering graphite and valuable metals from battery scrap. Metals 2020, 10, 680. [Google Scholar] [CrossRef]
- Schwich, L.; Schubert, T.; Friedrich, B. Early-stage recovery of lithium from tailored thermal conditioned black mass part 1: Mobilizing lithium via supercritical CO2-carbonation. Metals 2021, 11, 177. [Google Scholar] [CrossRef]
- Widijatmoko, S.D.; Gu, F.; Wang, Z.; Hall, P. Selective liberation in dry milled spent lithium-ion batteries. Sustain. Mater. Technol. 2020, 23, e00134. [Google Scholar] [CrossRef]
- Zielinski, M.; Cassayre, L.; Floquet, P.; Macouin, M.; Destrac, P.; Coppey, N.; Foulet, C.; Biscans, B. A multi-analytical methodology for the characterisation of industrial samples of spent Ni-MH battery powders. Waste Manag. 2020, 118, 677–687. [Google Scholar] [CrossRef]
- Otsuki, A.; De La Mensbruge, L.; King, A.; Serranti, S.; Fiore, L.; Bonifazi, G. Non-destructive chara cterization of mechanically processed waste printed circuit boards—Particle liberation analysis. Waste Manag. 2020, 102, 510–519. [Google Scholar] [CrossRef]
- Vanderbruggen, A.; Gugala, E.; Blannin, R.; Backmann, K.; Serna-Guerrero, R.; Rudolph, M. Automated mineralogy as a novel approach for the compositional and textural characterization of spent lithium-ion batteries. Miner. Eng. 2021, 169, 106924. [Google Scholar] [CrossRef]
- Dade, M.; Wallmach, T.; Laugier, O. Detailed microparticle analysis providing process relevant chemical and microtextural insights into the black mass. Minerals 2022, 12, 119. [Google Scholar] [CrossRef]
- Donnelly, L.J. Advancements in the Investigation and Phase Characterisation of Black Mass. 2nd Black Mass Workshop. Lithium-ion Battery Black Mass: Current Situation and Future Developments . In Proceedings of the International Conference on Battery Recycling (ICBR), Salzburg, Austria, 16 September 2022. [Google Scholar]
- Donnelly, L.J.; Pirrie, D.; Power, M.; Corfe, I.; Kuva, J.; Lukkari, S.; Lahaye, Y.; Butcher, A. The Phase Characteristics and Textural Variability of Black Mass. In Proceedings of the 26th International Congress for Battery Recycling, Geneva, Switzerland, 22–24 September 2021. [Google Scholar]
- Donnelly, L.J.; Pirrie, D.; Corfe, I.; Michaux, S.P.; Butcher, A. The Phase Characterization of Black Mass and its Commercial Implications in the Circular Economy. In Proceedings of the 20th International Automobile Recycling Congress, Geneva, Switzerland, 23–25 June 2021. [Google Scholar]
- Donnelly, L.J.; Pirrie, D.; Power, M.; Corfe, I.; Kuva, J.; Lukkari, S.; Lahaye, Y.; Xuan, L.; Butcher, A. The Phase Characterisation of Black Mass Using Manual, Automated and Interactive Scanning Electron Microscopy with Linked Energy Dispersive Spectrometers (SEM-EDS), X-ray Computed Tomography (Micro-CT) and Laser Ablation Mass Spectrometry (LA-ICP-MS). In Proceedings of the 10th World Conference on Sampling and Blending, Kristiansand, Norway, 31 May–2 June 2022; Available online: https://wcsb10.com/ (accessed on 25 June 2023).
- Donnelly, L.J. Black Mass and the Battery Revolution: An Overview of the Experimental Research Conducted by Alfred H Knight. Rho Motion Mag. 2022, Q2, 8–12. [Google Scholar]
- Pirrie, D.; Power, M.R.; Rollinson, G.K.; Wiltshire, P.E.J.; Newberry, J.; Campbell, H.E. Automated SEM-EDS (QEMSCAN) mineral analysis in forensic soil investigations; testing instrumental variability. In Criminal and Environmental Soil, Forensics; Ritz, K., Dawson, L., Miller, D., Eds.; Springer: Berlin/Heidelberg, Germany, 2009; pp. 411–430. [Google Scholar]
- Withers, P.J.; Bouman, C.; Carmignato, S.; Cnudde, V.; Grimaldi, D.; Hagen, C.K.; Maire, E.; Manley, M.; Du Plessis, A.; Stock, S.R. X-Ray Computed Tomography. Nat. Rev. Methods Primer 2021, 1, 18. [Google Scholar] [CrossRef]
- Menzies, A.H.; Tagle, R.; Reinhardt, F.; Hirschle, C.; Schellkopf, L.J.; Kelly, N. High-speed Micro-XRF Analysis of Rock Samples and Drill Cores. Microsc. Microanal. 2022, 28 (Suppl. S1), 650–651. [Google Scholar] [CrossRef]


| Component (Cathode Type) | Sub-Phase | Sample | ||||||
|---|---|---|---|---|---|---|---|---|
| AHK/DP/1 | AHK/DP/1 | AHK/DP/1 | AHK/DP/2 | AHK/DP/2 | AHK/DP/2 | Mean | ||
| Graphite | Carbon (+/−Co,Al) | 6.17 | 11.21 | 4.89 | 10.08 | 12.05 | 10.62 | 9.17 |
| Aluminium Foil | Aluminium | 1.07 | 1.00 | 1.08 | 0.69 | 0.70 | 0.84 | 0.90 |
| Al Carbonate | 0.40 | 0.65 | 0.35 | 0.27 | 0.49 | 0.56 | 0.45 | |
| Al Oxide | 23.05 | 31.68 | 23.20 | 29.42 | 24.33 | 24.52 | 26.03 | |
| Al K Phosphate | 0.94 | 1.36 | 1.05 | 1.43 | 1.15 | 1.11 | 1.17 | |
| Copper Foil | Copper | 6.32 | 2.73 | 4.59 | 0.64 | 2.03 | 2.28 | 3.10 |
| Other Cu Phases | 0.08 | 0.07 | 0.13 | 0.19 | 0.18 | 0.22 | 0.14 | |
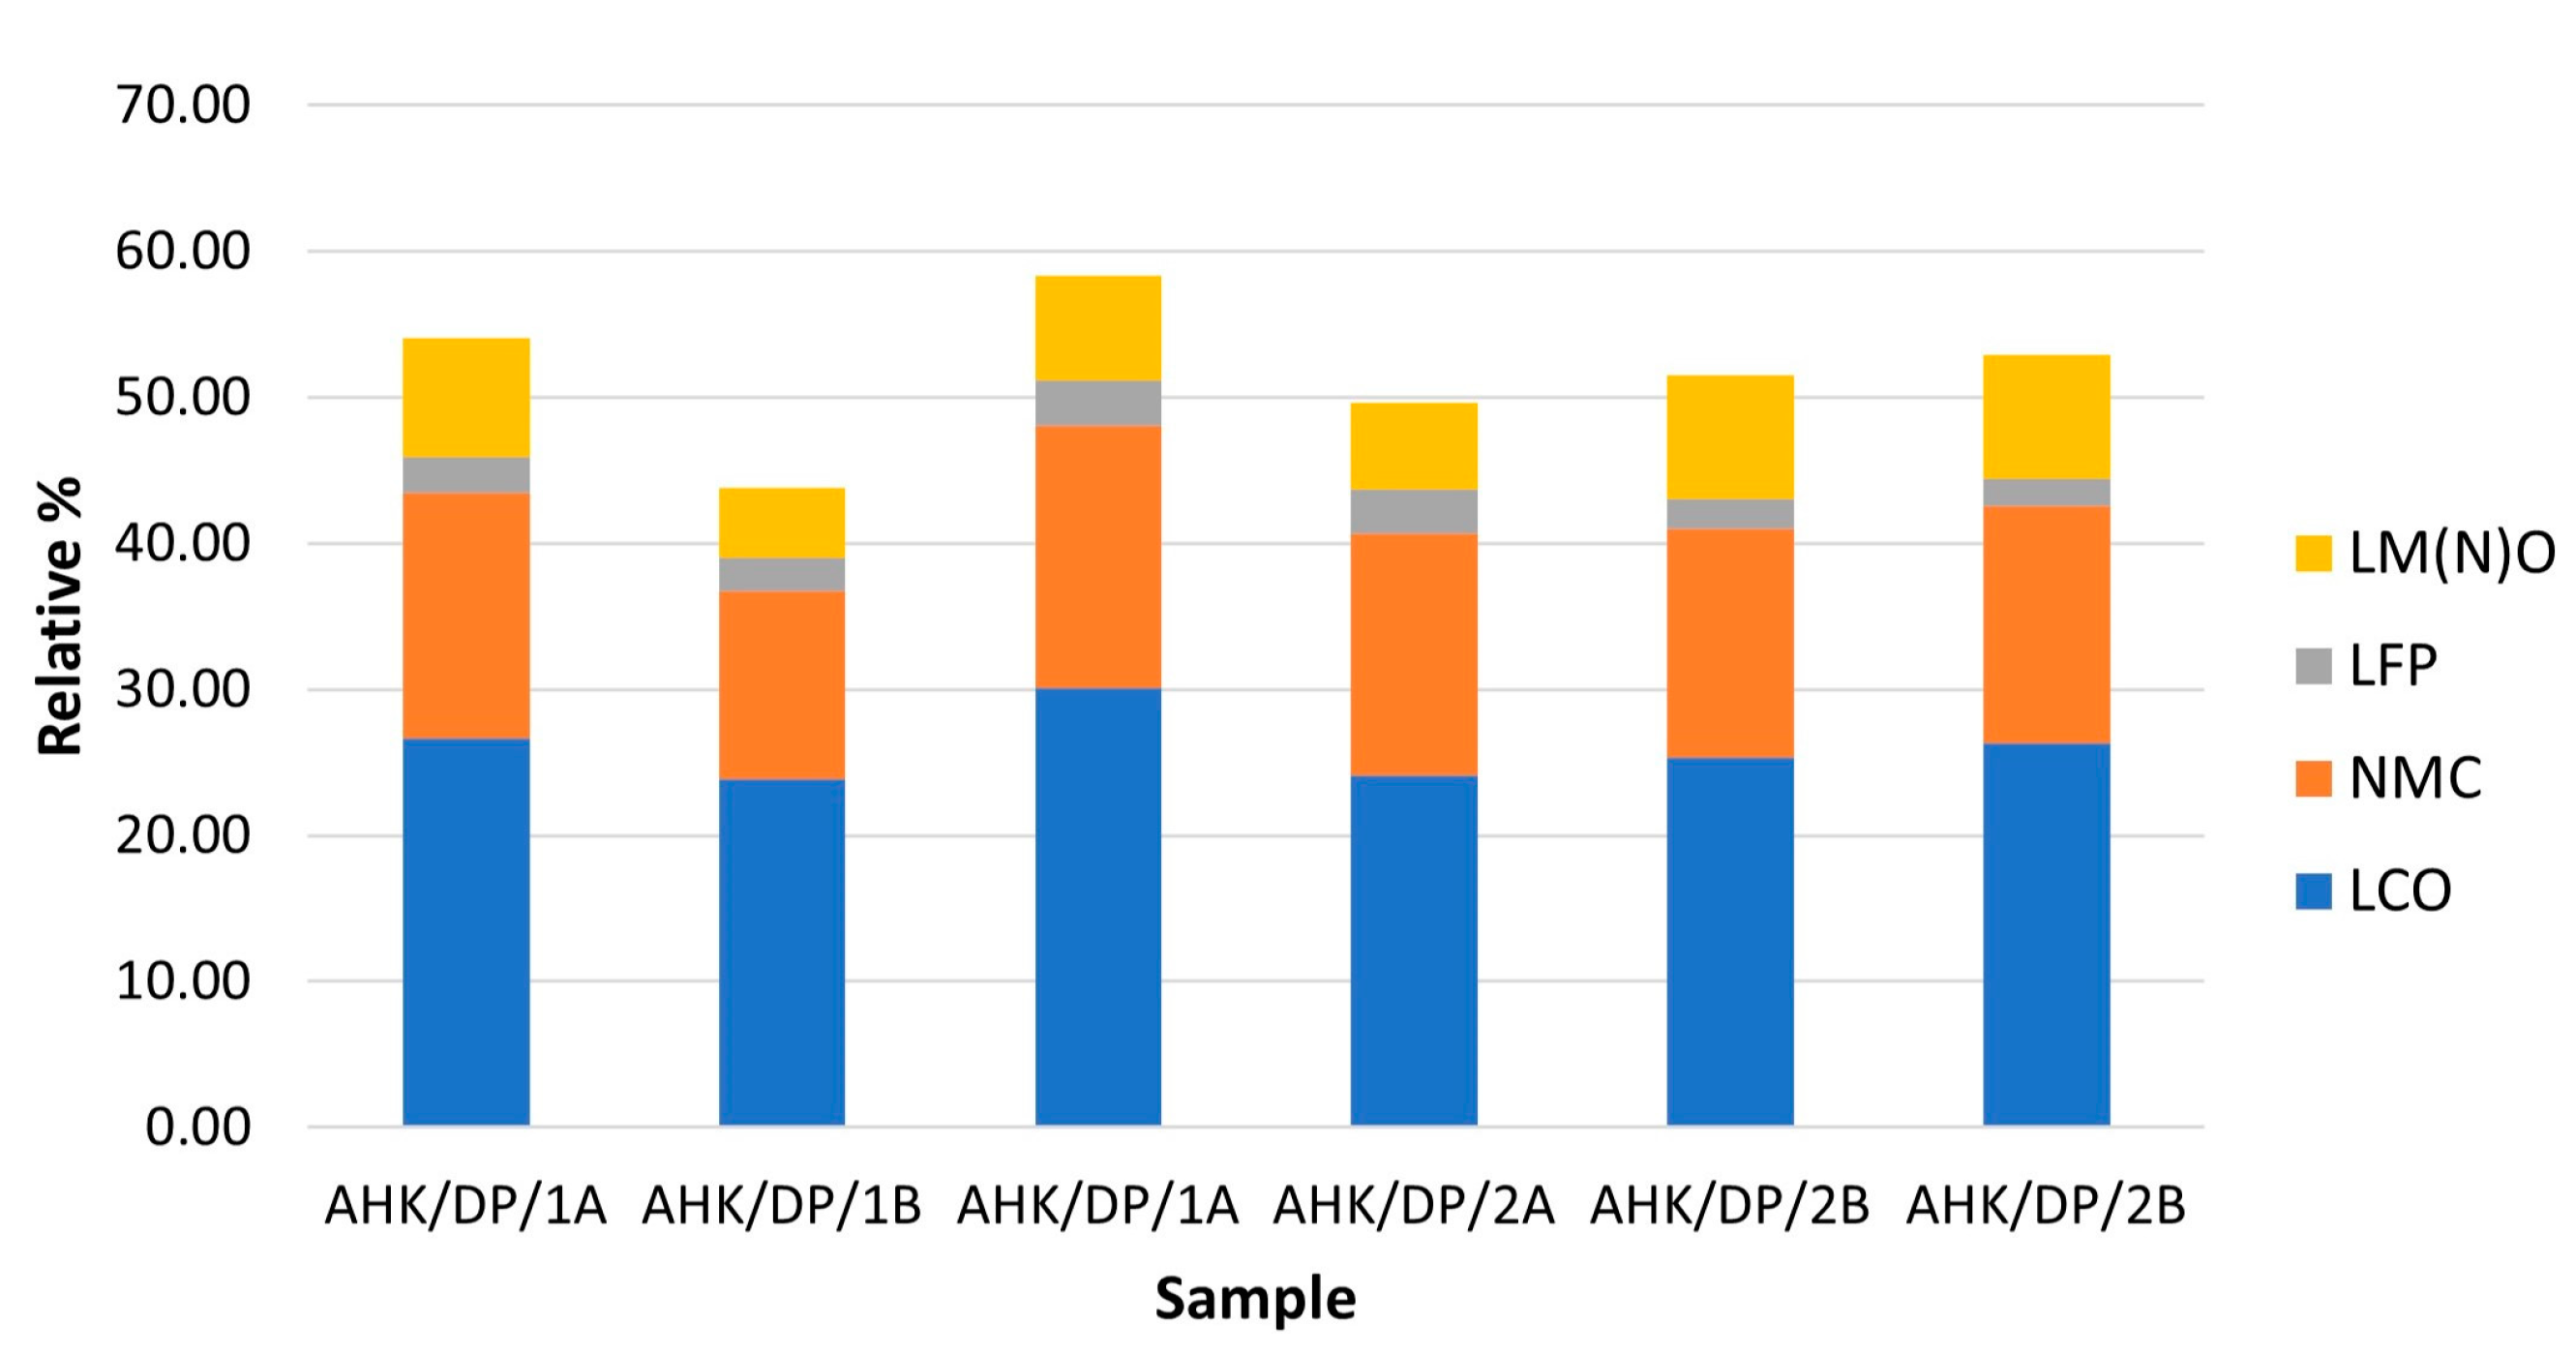
| LMO (LCO) | Co Oxide | 17.08 | 14.46 | 19.97 | 14.33 | 15.49 | 16.45 | 16.30 |
| Co Al Oxide (Low BSE) | 9.52 | 9.42 | 10.12 | 9.78 | 9.84 | 9.83 | 9.75 | |
| Other Co Phases | 0.01 | 0.01 | 0.01 | 0.00 | 0.02 | 0.05 | 0.02 | |
| LMO (NMC) | Co Mn Oxide | 0.05 | 0.06 | 0.04 | 0.07 | 0.06 | 0.05 | 0.06 |
| Co-Ni-Mn Carbonate | 2.01 | 2.00 | 2.09 | 1.94 | 1.60 | 1.78 | 1.90 | |
| Co-Ni-Mn-Al Oxide | 2.10 | 2.07 | 1.87 | 2.65 | 2.09 | 2.01 | 2.13 | |
| Ni Co Phases | 4.69 | 2.77 | 5.37 | 3.72 | 3.88 | 3.68 | 4.02 | |
| Fe Ni Oxide | 0.26 | 0.23 | 0.24 | 0.25 | 0.25 | 0.23 | 0.24 | |
| MnNiCo Oxide | 7.10 | 5.16 | 7.74 | 7.27 | 7.21 | 7.94 | 7.07 | |
| Mn Ni Oxide | 0.15 | 0.08 | 0.24 | 0.08 | 0.08 | 0.10 | 0.12 | |
| Other Ni Phases | 0.47 | 0.46 | 0.42 | 0.56 | 0.49 | 0.45 | 0.48 | |
| LMO (LFP) | Fe Al Phosphate | 2.46 | 2.32 | 3.13 | 3.06 | 2.09 | 1.93 | 2.50 |
| LMO (LM(N)O) | Mn Al Oxide | 1.32 | 0.94 | 1.20 | 0.98 | 1.61 | 1.59 | 1.27 |
| Mn Hydroxide (Al) | 3.02 | 1.64 | 2.53 | 2.00 | 2.75 | 2.71 | 2.44 | |
| Mn Oxides | 3.85 | 2.13 | 3.40 | 2.95 | 4.06 | 4.11 | 3.42 | |
| Mineral Phases | Biotite | 1.35 | 1.56 | 0.84 | 1.58 | 1.21 | 1.32 | 1.31 |
| Mg Silicates | 0.03 | 0.09 | 0.03 | 0.17 | 0.06 | 0.06 | 0.07 | |
| Na Glass | 0.13 | 0.08 | 0.13 | 0.12 | 0.10 | 0.07 | 0.10 | |
| Other Silicates | 0.62 | 0.25 | 0.36 | 0.37 | 0.32 | 0.42 | 0.39 | |
| Calcite and Dolomite | 0.04 | 0.07 | 0.05 | 0.08 | 0.11 | 0.03 | 0.06 | |
| Apatite | 0.00 | 0.03 | 0.00 | 0.01 | 0.00 | 0.00 | 0.01 | |
| Fe Sulphide | 0.02 | 0.00 | 0.02 | 0.00 | 0.00 | 0.00 | 0.01 | |
| Cl and P | 0.02 | 0.04 | 0.04 | 0.02 | 0.01 | 0.01 | 0.02 | |
| Unclassified | 0.56 | 1.22 | 0.38 | 1.03 | 1.04 | 0.77 | 0.83 | |
| Unattributed Metal Phases | Zn Phases | 0.20 | 0.14 | 0.16 | 0.16 | 0.23 | 0.21 | 0.18 |
| Tin and Cadmium | 0.29 | 0.24 | 0.18 | 0.23 | 0.23 | 0.17 | 0.22 | |
| Ti Phases | 0.13 | 0.11 | 0.28 | 0.18 | 0.14 | 0.05 | 0.15 | |
| Fe and Cr Oxides | 4.50 | 3.70 | 3.91 | 3.68 | 4.11 | 3.86 | 3.96 | |
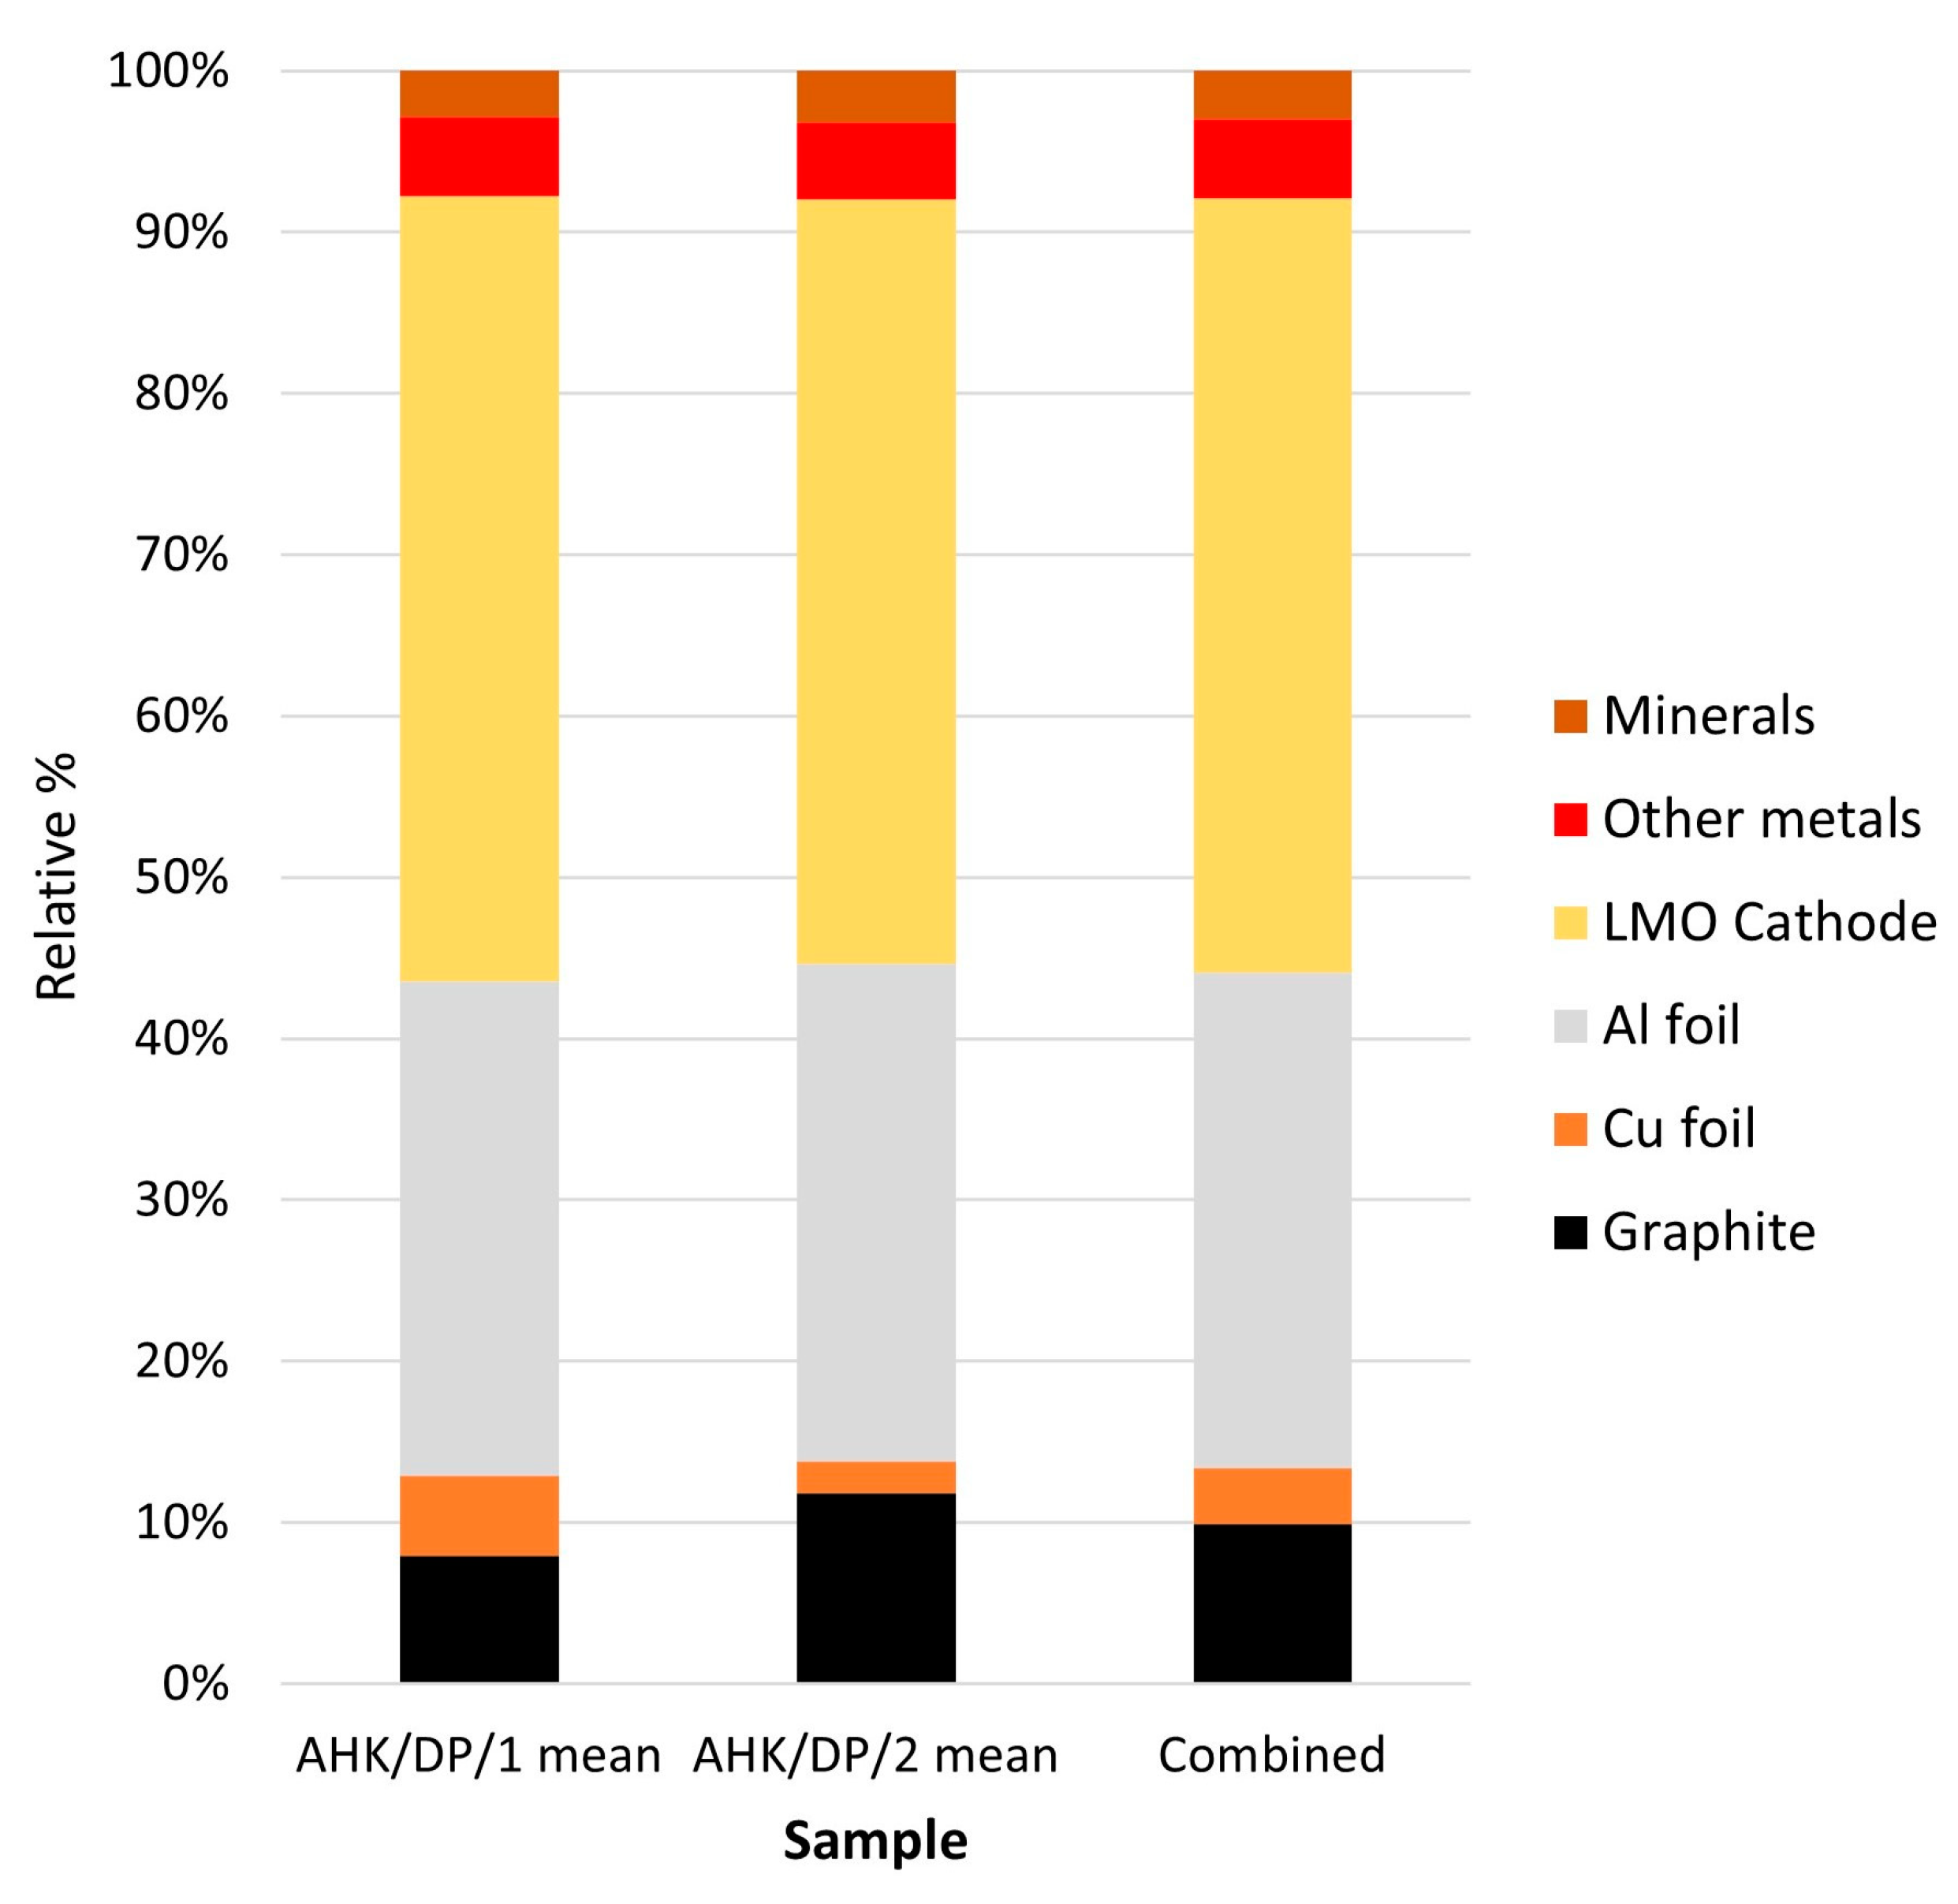
| Phase | AHK/DP/1 Mean | AHK/DP/2 Mean | Combined |
|---|---|---|---|
| Graphite | 7.42 | 10.92 | 9.17 |
| Cu foil | 4.63 | 1.85 | 3.24 |
| Al foil | 28.61 | 28.50 | 28.56 |
| LMO cathode | 52.07 | 51.35 | 51.71 |
| Other metals | 4.61 | 4.41 | 4.51 |
| Minerals | 2.65 | 2.97 | 2.81 |
| Spot | AMICS Compositional Group | Cathode Type | Li | Co | Ni | Cu | Zn | Mn | Al |
|---|---|---|---|---|---|---|---|---|---|
| 1.1 | NiCo phase | NMC | 1098 | 46,850 | 686,876 | 7204 | 82,375 | 642 | 20,112 |
| 1.2 | NiCo phase | NMC | 1010 | 45,606 | 618,201 | 6529 | 84,578 | 469 | 20,112 |
| 1.3 | NiCo phase | NMC | 1002 | 38,854 | 539,715 | 5760 | 69,695 | 496 | 20,112 |
| 3.2 | NiCo phase | NMC | 197,681 | 154,151 | 175,644 | 188,507 | 3667 | 7753 | 413,995 |
| 4.1 | NiCo Phase, Mn Oxide | NMC | 26,626 | 13,047 | 49,907 | 885 | 28 | 183,738 | 30,167 |
| 4.2 | Mn Oxide | NMC | 25,758 | 14,650 | 59,536 | 2046 | 120 | 244,015 | 30,167 |
| 4.3 | NiCo Phase, Mn Oxide | NMC | 107,953 | 66,389 | 347,350 | 2384 | 175 | 34,716 | 30,167 |
| 4.4 | NiCo Phase, Mn Oxide | NMC | 40,916 | 32,230 | 158,666 | 1410 | 32 | 30,993 | 30,167 |
| 5.1 | Mn Oxide | NMC | 20,745 | 3932 | 9903 | 61 | <1.18 | 218,488 | 3574 |
| 5.2 | Mn Oxide | NMC | 25,455 | 3932 | 15,056 | 33 | 3 | 262,565 | 3974 |
| 5.3 | Mn Oxide | NMC | 72,156 | 3932 | 7795 | 83 | 52 | 660,746 | 6607 |
| 6.1 | NiCo Phase | NMC | 72,996 | 39,596 | 214,262 | 448 | 56 | 752 | 19,053 |
| 6.2 | NiCo Phase | NMC | 62,456 | 31,588 | 183,185 | 449 | 50 | 647 | 19,053 |
| 6.3 | NiCo Phase | NMC | 80,840 | 46,952 | 271,822 | 528 | 53 | 462 | 19,053 |
| 6.4 | NiCo Phase | NMC | 86,717 | 47,026 | 269,028 | 896 | 7 | 607 | 19,053 |
| 2.1 | Co Oxide, CoAl Oxide, CoNiMnAl Oxide | LCO | 137,273 | 202,126 | 189,918 | 11,478 | 40 | 190,843 | 282 |
| 2.2 | Co Oxide, CoAl Oxide, CoNiMnAl Oxide | LCO | 146,949 | 202,126 | 198,121 | 23,029 | 93 | 190,577 | 365 |
| 2.3 | Co Oxide, CoAl Oxide, CoNiMnAl Oxide | LCO | 117,094 | 202,126 | 214,525 | 12,929 | 41 | 187,836 | 2998 |
| 2.4 | Co Oxide, CoAl Oxide, CoNiMnAl Oxide | LCO | 144,534 | 202,126 | 216,398 | 15,113 | 215 | 194,614 | 11,248 |
| 2.5 | Co Oxide, CoAl Oxide, CoNiMnAl Oxide | LCO | 130,095 | 202,126 | 206,958 | 11,103 | 16 | 178,263 | 6750 |
| 2.6 | Co Oxide, CoAl Oxide, CoNiMnAl Oxide | LCO | 136,261 | 202,126 | 206,486 | 25,873 | 157 | 198,542 | 16,837 |
| 2.7 | Co Oxide, CoAl Oxide, CoNiMnAl Oxide | LCO | 132,580 | 202,126 | 191,140 | 4507 | 195 | 204,555 | 840 |
Disclaimer/Publisher’s Note: The statements, opinions and data contained in all publications are solely those of the individual author(s) and contributor(s) and not of MDPI and/or the editor(s). MDPI and/or the editor(s) disclaim responsibility for any injury to people or property resulting from any ideas, methods, instructions or products referred to in the content. |
© 2023 by the authors. Licensee MDPI, Basel, Switzerland. This article is an open access article distributed under the terms and conditions of the Creative Commons Attribution (CC BY) license (https://creativecommons.org/licenses/by/4.0/).
Share and Cite
Donnelly, L.; Pirrie, D.; Power, M.; Corfe, I.; Kuva, J.; Lukkari, S.; Lahaye, Y.; Liu, X.; Dehaine, Q.; Jolis, E.M.; et al. The Recycling of End-of-Life Lithium-Ion Batteries and the Phase Characterisation of Black Mass. Recycling 2023, 8, 59. https://doi.org/10.3390/recycling8040059
Donnelly L, Pirrie D, Power M, Corfe I, Kuva J, Lukkari S, Lahaye Y, Liu X, Dehaine Q, Jolis EM, et al. The Recycling of End-of-Life Lithium-Ion Batteries and the Phase Characterisation of Black Mass. Recycling. 2023; 8(4):59. https://doi.org/10.3390/recycling8040059
Chicago/Turabian StyleDonnelly, Laurance, Duncan Pirrie, Matthew Power, Ian Corfe, Jukka Kuva, Sari Lukkari, Yann Lahaye, Xuan Liu, Quentin Dehaine, Ester M. Jolis, and et al. 2023. "The Recycling of End-of-Life Lithium-Ion Batteries and the Phase Characterisation of Black Mass" Recycling 8, no. 4: 59. https://doi.org/10.3390/recycling8040059