1. Introduction
Since ancient civilizations, artisanal fishing has been carried out as an important economic activity and source of employment in rural areas of Colombia [
1]. The resource availability and the low effort required for fishing initially made for short tasks and abundant catches. Over the years, increased demand has extended the duration of working days, leading to concerns regarding preserving the catch. The use of expanded polystyrene containers with added ice or refrigerated seawater is necessary in preserving the catch; artisanal fishers use small boats, have a lack of economic resources, and do not have storage warehouses or cold rooms [
2]. Therefore, fishers use containers built with expanded polystyrene to store and preserve their fish catch; this material is widely used to construct containers due to its good capacity as an insulator. The problem is that it is made up of oil particles, is not biodegradable, and causes pollution; therefore, ecological/natural thermal insulation has been suggested as an alternative [
3]. It is important to mention that expanded polystyrene is a material composed of petroleum industry residues, which have a high impact on the environment when their useful lives end. The material is mainly used to construct containers for preserving cold temperatures and conditions and controlling microbial growth and the progressive deterioration of different foods [
4].
Due to their mechanical and physical properties, some natural wastes from agricultural industries have been used as thermal insulation materials. The advantage of using natural materials will depend on the region (i.e., whether the material is available in abundance); in the future, these natural materials may replace synthetic materials due to drives to reduce pollution in response to climate change. To date, natural materials have been used as alternative replacements for expanded polystyrene that have thermal insulating properties and do not pollute the environment (e.g., hemp, cork, and cellulose are already used). These natural materials, which do not contain plastics or any substances or additives that may be harmful to the environment, are durable, recyclable, and biodegradable [
5].
In a study by Gutiérrez et al., 2014 [
6], starches were used with rice husk to obtain a material with adequate physical stability without affecting its insulating capacity. For this purpose, a process was developed that integrated saccharomyces cerevisiae, brewer’s yeast, as an element that produced porosities in the samples. Subsequently, different tests were developed to evaluate the mechanical and physical properties of the natural insulator, including thermal conductivity; the different properties were considered according to the guidelines of the ASTM C177 standard procedure. The authors found that the agglomerate did not produce a flame when subjected to direct fire (fireproof) and had a resistance of between 80 and 120 kPa when subjected to temperatures of between 150 and 200 °C. The thermal conductivity of the agglomerate was around 0.09 W/m K. Finally, samples of the agglomerate were exposed to outdoor conditions (dry bulb temperature, 30 ± 5 °C; relative humidity, 80 ± 15%), where the chemical stability was analyzed according to its fungal resistance and its high biodegradability when dissolved in the water; this allowed them to conclude that rice-husk-based agglomerates are efficient thermal insulators for industrial applications.
Canto et al., 2018 [
7], established that thermal insulators are usually expensive and many are not environmentally friendly. The main objective was to create a thermal insulator from the organic residues of rice husks. Considering the fact that rice production in Panama exceeds six million quintals annually, the increase in organic waste in landfills is considerable. As such, it was possible to create a compound that decreased the volatility of the rice husk material without impairing its thermal conductivity. One of the most essential requirements is that the compound is flexible and resistant even after drying. In the development of the insulator, mixed organic compounds such as pita palm and cassava starch were used, and various tests were carried out in the laboratory.
Similarly, Colchado and Tapia, 2019 [
8], evaluated the influence of adding banana stem fiber on concrete blocks’ compressive strength and absorption. Four treatments were applied, each with a different percentage of banana fiber: group 1 (0% banana fiber), group 2 (7.5% banana fiber), group 3 (10% banana fiber), and group 4 (12.5% banana fiber). According to the ASTM and NTC standards, the authors developed different tests for the materials: a granulometric analysis of the fine and coarse aggregates; a method utilizing the same unit weight with loose and compacted materials; the specific weight, moisture content, and absorption. In the tests, the authors built 4 blocks of samples for each treatment (32 blocks in total): 16 blocks for compression and 16 for absorption tests. Additionally, the authors designed the mixture to have a resistance of 50 MPa, adhering to the American Concrete Institute (ACI) methods and the E.070 standard procedure. The results showed that the block with 7.5% fiber (group 2) presented the highest compressive resistance (65.54 MPa) and the lowest absorption (6.10%) in relation to the general experimental set. They concluded that adding banana stem fiber in small proportions may increase compression resistance but decrease absorption rate.
On the subject of different experimental laboratory tests, Pardo and Gualdrón, 2019 [
9], studied natural fibers and their viability as thermal insulators. The results showed that natural insulators provide good insulation properties with low costs, making them potentially suitable for application in architectural processes.
In Ecuador, coffee is produced in twenty of the twenty-two zones of the country, giving it great socioeconomic importance; the treatment of this product, until the coffee beans are obtained, generates a lot of waste. This is because the coffee husk is a residue with no purpose in the process. Lopez, 2015 [
10], used coffee husk residues in the sustainable construction of houses; the use of the residues was based on the elaboration of building blocks, serving as thermal insulation, and thus reducing energy consumption and environmental pollution. Sand and cement compositions were tested to determine their resistance and thermal conductivity for block prototypes with different biomaterials. The results showed that using biomaterials for industrial applications is sustainable and viable, considering that this type of biodegradable material has been widely used in the construction sector to obtain lightweight blocks with good thermal insulation properties.
On the other hand, some organic materials from agro-industrial waste (biomaterials) are being used in thermal insulation materials in different industrial sectors. Rice husk, for example, is one of the materials which can be used as natural thermal insulation, but it sometimes needs to be prepared through being compacted, which requires the use of special laboratory equipment. Banana stems and coffee husks can be used in construction as wall coverings, ceilings, and floors in both humid and cold places to maintain controlled temperatures. These three natural materials (biomaterials) were used in the present study; the aim was to evaluate and compare their thermal conductivity coefficients with those of expanded polystyrene. Expanded polystyrene was chosen for the comparison because it is one of the most-used materials for retaining cold temperatures in the containers used by the artisanal fishing industry. In this way, the experimental results were analyzed through the Mann–Whitney U test, using different statistical models to compare the biomaterials’ thermal conductions, and therefore assess their ability to preserve the cold for fishing applications. The contributions of this work are summarized as follows:
(1) Mann–Whitney U analysis was used to determine the significant differences between the assessed variables.
(2) Biomaterials can be used as thermal insulators for fishing applications.
(3) Of the assessed biomaterials, rice husk has the most similar thermal conductivity coefficients to those of expanded polystyrene.
(4) Thermal conductivity values (k) for banana stem, coffee, and rice husk have not yet been reported in the open literature.
(5) Biomaterials with good thermal conductivity have potential economic value for real applications in the fishing industry.
2. Materials and Methods
The biomaterials used in this study were obtained from the northern area of the department of Magdalena, Colombia, in the surroundings of the banana zone in the municipalities of Funda-ción and Santa Marta, including the coffee zone of the Sierra Nevada. The processing of the materials, the construction of the containers, and the thaw test were carried out at the Taganga Fisheries Pilot Plant of Magdalena University.
The process of conserving products using ice entails keeping products at a stable and cold temperature, around 0 °C, to control microbial growth and prevent subsequent food deterioration. At the same time, chemical/enzymatic reactions are also slowed down, which is the main reason food requires specific temperatures and relative humidity values for its preservation [
11]. Fishing boats use ice for short or long working periods. The glaze allows the catch to be kept at low temperatures between 0 and 1.0 °C. In this way, three essential aspects must be considered when preserving fish catches: good fishing practices, cleaning and cooling, and avoiding the proliferation of microorganisms and fish degradation.
A review of the literature allowed to establish the ideal container size and geometry for laboratory tests, as well as the optimal wall thickness. Preliminary experimental tests revealed the requirement for an impermeable inner layer, allowing water leakage from thaw to be avoided. A thin layer of fiberglass was used for this purpose. After container building, it was possible to obtain consistent results for wall tightness. Water drainage (of water resulting from thaw) was carried out by tilting the container and slightly opening the lid until the water drained completely.
2.1. Container Construction
For the construction of the containers employing natural insulators (rice husk, banana stem, and coffee husk), other kinds of materials were used. These have been listed in the order of outside–inside: Triplex (2.5 mm thick sheet), “biomaterial” thermal insulator (2.5 mm thick), Triplex (2.5 mm thick sheet), fiberglass (1.0 mm thick). Fiberglass was employed to prevent the filtration of water from thaw through the walls, as previously mentioned. In addition, to minimize error in the study results, the containers were built with the same dimensions and insulation thicknesses, utilizing the procedure shown in
Figure 1.
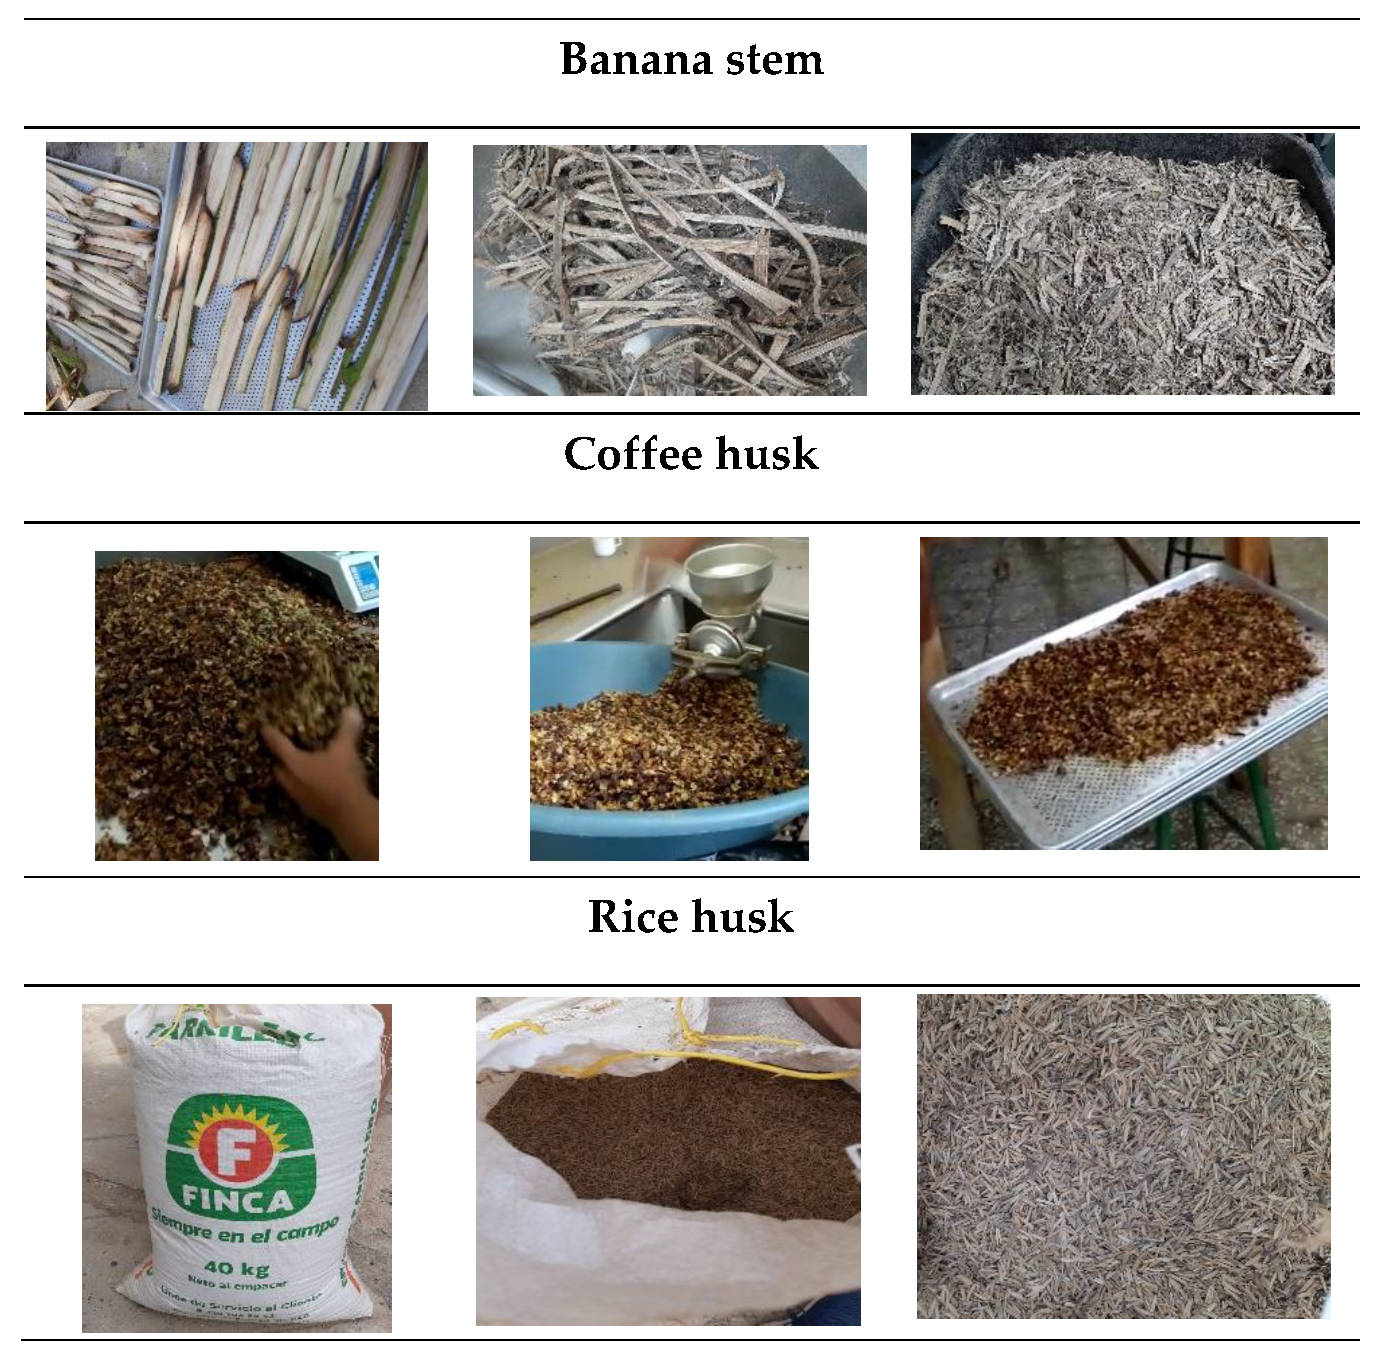
The materials used as natural insulators (biodegradable) in the containers were processed at the Taganga Fisheries Pilot Plant of Magdalena University through the following procedure:
- ➢
Rice husk was collected in the mills around Fundación (Magdalena). Then, it was transported in sacks to the Taganga Pilot Plant, where it underwent a manual cleaning process to be later placed in a dehydration oven at 75 °C for 8 h. Then, the samples were added to the confined space between the Triplex sheets of the container walls.
- ➢
Banana stem was collected from farms in the banana zone of Magdalena and transported to the Taganga Pilot Plant, where it was cut into samples of around 30 × 2 × 2 cm in length, thickness, and height, respectively. Subsequently, pieces were placed on drying trays in the dehydrator oven at 75 °C for 8 h. Once dry, the samples were minced and ground, and the mixture was added to the confined space between the Triplex sheets on the container walls.
- ➢
Coffee husk was obtained from the mills in the Sierra Nevada de Santa Marta (Magdalena); the material was transported to the Taganga Pilot Plant, then subjected to drying through the forced-air process at 60 °C for 24 h. Subsequently, the dry shell was ground, and the powder obtained was placed in the confined space between the Triplex sheets of the container walls.
- ➢
The insulator currently used by fishers (expanded polystyrene) was obtained in a commerce area in the city of Santa Marta (Magdalena) in sheets with a thickness of 25 mm, which, after measurement, were placed in the confined space between the Triplex sheets of the container walls.
Figure 2 presents the process which was developed to obtain adequate granulometry for each natural insulation material for the container’s construction.
2.2. Containers Dimensions
For the container design, average dimensions were selected, as shown in
Table 1. The rectangular container wall characteristics are shown in
Table 2. Note that the internal total volume for cooling fish is 21.562 ± 0.9 m
3, accounting for the total wall thickness of 31 mm.
The container weight and other data for each insulating material are summarized in
Table 3. Note that the container with expanded polystyrene insulation is the lightest, cheapest, and, therefore, the most widely used by fishers, but it causes the most pollution [
13]. However, the container with rice husk insulation, weighing 7.096 kg, is environmentally friendly and has a 145 kg/m
3 density, with similar thermal properties to polystyrene [
4]. Finally, it is important to mention that the coffee husk is the heaviest container due to its density (608 kg/m
3) [
14].
The properties of insulation materials can differ based on factors such as the manufacturer, the product type, and the specific chemical formulations. In addition, the biodegradation of insulation materials can depend on environmental conditions or other purposes/uses. It is important to mention that, when selecting insulation materials for practical industrial applications, it is essential to consider specific insulation needs and environmental goals.
2.3. Data Collection for Final Tests
Experimental laboratory tests were conducted for the entire experimental set (4 containers) with each insulation type and different ice filling levels. The first test was carried out for 100% ice fill, the second for 70% ice fill, and the third for 50% ice fill, to obtain the main differences in heat/thermal conductivity values. Ten (10) replicates were performed for each fill level to ensure the statistical validity of the results. In all the experimental tests, the initial gross weight of the container and the weight after draining the water resulting from the thaw in each period of time were taken. The readings were made within the first 24 h; during this time, the most significant amount of thaw water accumulates, according to the methodology proposed by Cruz Cuevas [
4]. Also, the guidelines proposed in the ASTM C518 standard procedure recommend the use of a heat flow meter (HMF), which was incorporated into this work [
18].
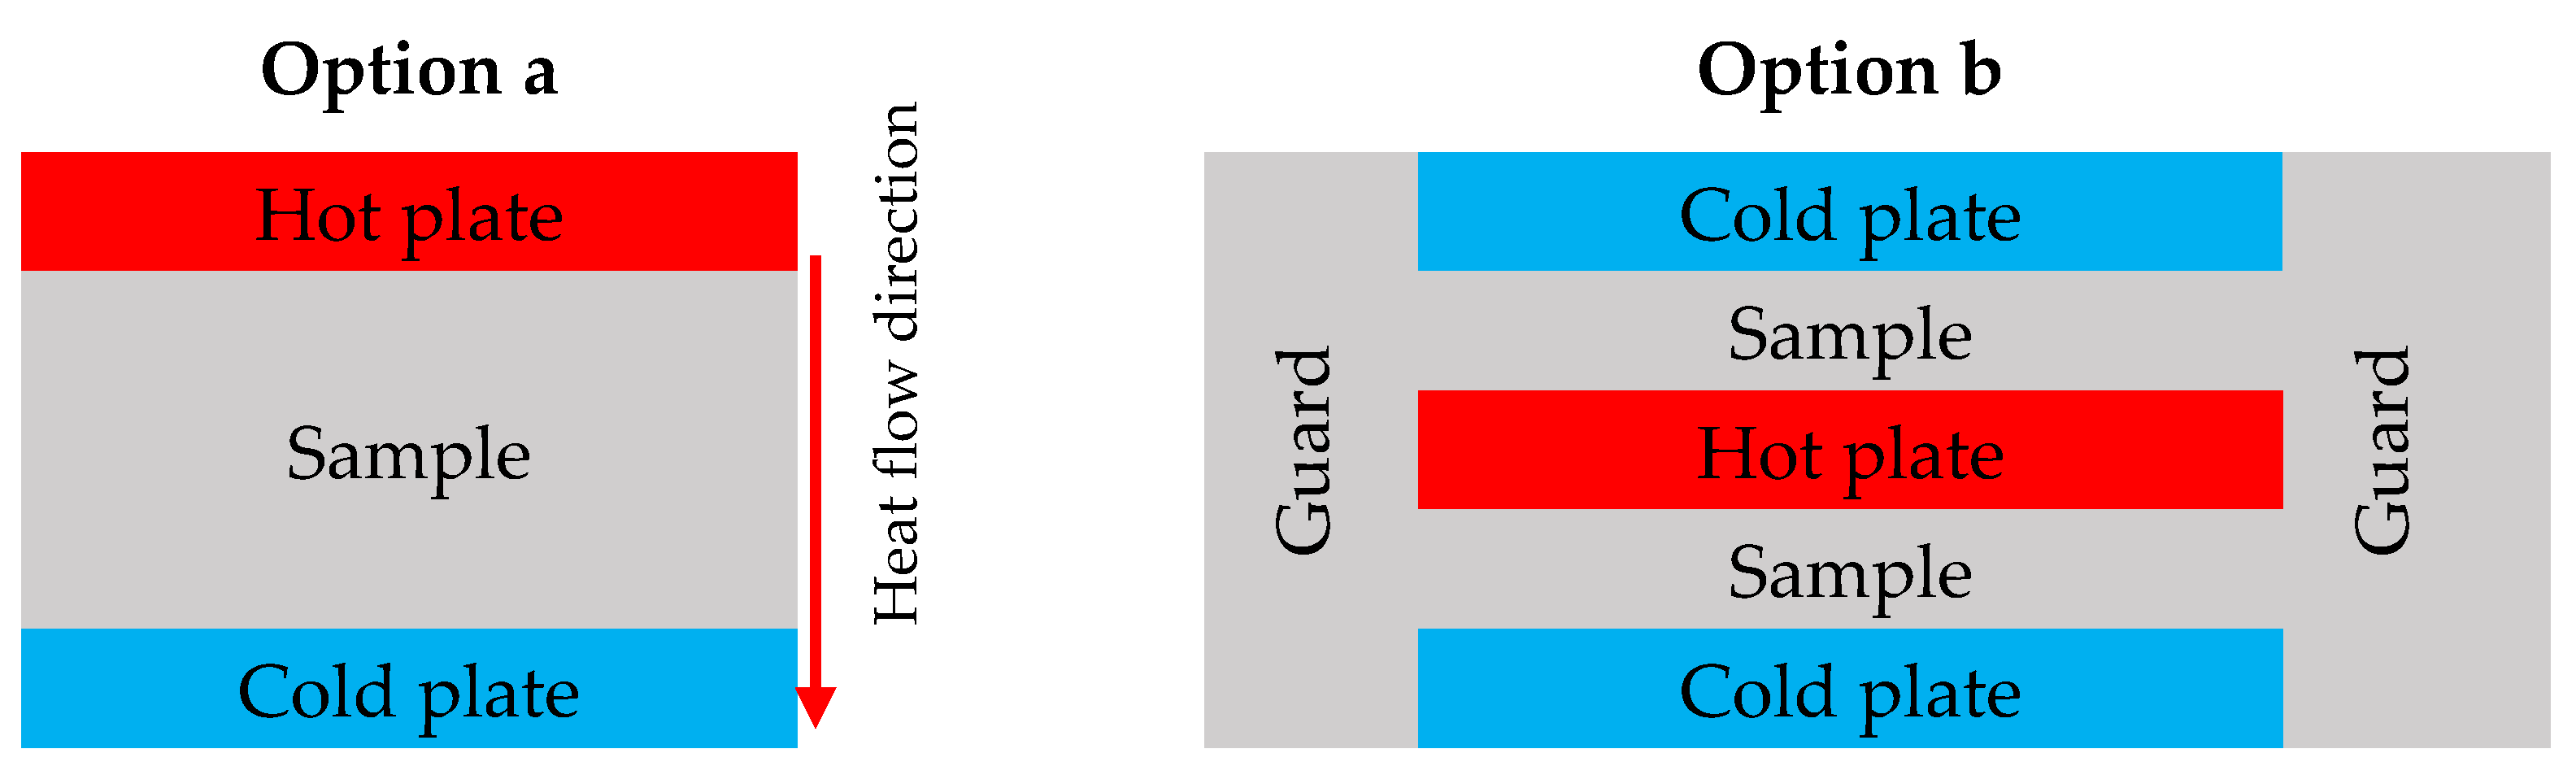
The data were recorded at different experimental times between 1 and 4 h. Then, with the data obtained for each insulator in each test (containers), the amount of ice used (thaw and water removed) was systematically calculated from the amount which was heat-absorbed through thaw during fish preservation. Considering the time elapsed in each test, it was possible to calculate the thaw speed and the heat transfer speed, that is, the amount of heat that the ice absorbed per unit of time; this reached the same amount as that which passed through the container walls. A guard hot plate (GHP), from ASTM C177, is another way to determine thermal conductivity [
19]. This was used in this study, as shown in
Figure 3 considering hot (red) and cold (blue) plates.
2.4. Heat Transfer Calculations
As a first calculation, it is necessary to start with a general balance of heat transfer, assuming that the heat from the sources (Q
source) is equal to the heat from the receivers (Q
receivers−refrigerants), as shown in Equation (1). Note that these assumptions are needed to determine the heat sources from the containers by each insulator.
The heat source is given by the heat that passes through the walls by conduction, and the heat of the receivers is given by the ice (Q
Ice). In this case, no product is cooled, so this value can be equal to zero; for this calculation, see Equation (2):
On the other hand, the ice heat is equal to the ice mass (m
H) times the latent thaw (λ), and the wall heat is equal to the integral heat transfer coefficient (U), area (A) by the temperature differential (ΔT), by the amount of time (z) [
21], as shown in Equation (3).
From Equation (3), the heat transfer integral coefficient (U) is solved; Equation (4) is obtained:
After calculating the U value, the global heat transfer coefficients must be considered, as is shown in Equation (5) [
22]:
Accounting for the above considerations, the convection effect is omitted following a focus on the temperatures of the walls, obtaining Equation (6):
Since the containers walls are made up of different materials that have a different thicknesses (x) and thermal conductivities (k), these must be represented by Equation (7):
Each insulating material used in the container walls has a certain thickness (x). Fiberglass and wood have known thermal conductivity (k) values. From the inside to the outside of the container walls, is possible use Equation (7), where the values of x and k lead to an unknown value: the thermal conductivity of the insulating material.
After evaluating the thermal conductivity of the materials, the amount of ice required was theoretically calculated to determine the values of the frozen fish and the conservation costs of the containers built. In this research work, a theoretical calculation was developed to assess the preservation of red snapper (Lutjanus Campechanus), a species frequently caught in the study area (Santa Marta, Colombia). The total ice consumption (h) was estimated from the ice needed to cool the fish (Hep) to 0 °C; the ice required to compensate for thermal losses (Hf) through the walls; and more ice to account for ice loss (Q). This is shown in Equation (8).
The evaluation of the magnitude and weight of the ice loss (m
h) is necessary for cooling the fish to 0 °C; this is calculated theoretically by Equation (9):
where Cp is the specific heat of the fish (W/m K). The Cp varies with the composition; its value is approximately 0.80 W/m K for lean fish, 0.78 W/m K for semi-lean fish, and 0.75 W/m K for oily fish. Tp is the fish temperature (°C); this is usually taken as the seawater temperature. λ is the latent heat of fusion of ice (kcal/kg), which is usually taken as 80 kcal/kg. mp is the mass of the fish (kg).
2.5. Statistical Analysis of Experimental Data
The means or averages of the samples represent the sum of the numbers in the sample divided by the total number of existing numbers, as shown in Equation (10).
However, to determine whether the calculated average “k values”, the thermal conductivities, were statistically different, it was necessary to carry out rigorous tests on the presented conclusions to analyze this research work. In summary, these equations are crucial in analyzing the thermal performances of insulation materials and systems used for cooling. They allow quantification and evaluate the effectiveness of insulation in maintaining desired temperatures and minimizing heat transfer. This analysis is essential for designing efficient cooling systems and selecting appropriate insulation materials.
2.5.1. Normality Tests
A normality test was utilized to determine whether the datasets were well-modeled and then indicate whether the null hypothesis should be rejected. For this purpose, Lilliefors’s proposed modification of the Kolmogorov–Smirnov (K-S-L) test was used to improve the results based on the same statistical principles with a possible transformation of the statistical model. The Shapiro-Wilk test was also used because it is currently one of the most consolidated analyses available; it is based on a probability graph that considers the regression of the observations against the expected values from a statistical distribution. The W statistic represents the ratio of two estimates of the variance of a normal distribution [
23].
2.5.2. Kruskal–Wallis Test
Let R
ij be the range of X
ij in the pooled sample; then, these variables can be calculated using Equations (11)–(13).
It is important to considerthe following: that
satisfies
; the distribution under H
0 of the R
jj; that the expected value, the variance, and covariance are the same as in the two-sample case but using
. Also, it is important to consider Equations (14) and (15):
If the difference, R
•j, represents the distance between the ranks sum of the individuals in the j-th sample and the expected range of these under the null hypothesis, then large values of these cumulative differences are expected to support the alternative hypothesis of non-equality of the medians of the sampled distributions. The Kruskal–Wallis statistic was used to test the hypothesis
; this is shown by Equation (16):
The exact distribution of the Kruskal–Wallis statistic can be calculated considering the two-sample case; all the arrangements of the pooled observations are equally likely under the null hypothesis. However, this process can be complex if it is considered to be a table of critical values for each value of k. That is, from practical and experimental points of view, this alternative is not very useful. For this reason, it is convenient to develop a construction methodology for the critical region via asymptotic distribution of the test statistic. Critical values of the Kruskal–Wallis statistic test can be found in the Gibbons K table. For other values of K and Nj, the H statistic is asymptotically distributed as a (). So, under the condition that and that the Kruskal–Wallis test rejects the null hypothesis () for an approximate significance level, when , where is such that where is a random variable with a distribution with K − 1 of freedom.
2.5.3. Mann–Whitney U Test
The available information for this test consists of two random samples: X
1, …, X
m y and Y
1….. Y
n. However, now, the first sample comes from a distribution for
and the second from a distribution for
, with
.
are the differences in the populations medians. So, the problem of inference is the test of the hypothesis:
versus
. Without generality loss, it can be assumed that
; then, it can be assumed that that the sampled distributions are F (x) y G(x) = F (x − Δ), respectively. So, the parameter of interest is the difference in locations, not the parameters themselves. To try
versus
, Wilcoxon (1945) [
24] proposed the following procedure: First, the combined sample must be ordered from the least to the greatest: X
1, …, X
N. Second, the corresponding ranks are determined; then, calculate the U sum of the treaties ranks, that is, the observations of Y. The condition is rejected if
, when the U value is very large. In other words, large values of U indicate that the treated group occupied the last positions in the combined sample; that is, the treatment led to larger values of Y than X. Considering the above, the expression proposed by Mann and Whitney in 1947 [
25] (Equation (17)) is used.
3. Results and Discussions
In the present study, the conductivity value (k) was experimentally determined in the built insulated containers; this was performed with a consideration of the theoretical thermal characteristics of the materials based on the container dimensions. Also, the methods proposed by Zugarramundi and Parin, 2018 [
26], were used. However, in practice, significant variations can be found according to the lid type, container size, drainage, and, to a lesser extent, ice type, fish volume, and the ice in the container [
20]. When the experimental data were obtained from the tests, the thermal conductivity values were calculated with the equations described previously (Equations (1)–(17)).
Table 4 summarizes the average thermal conductivity (k) values for each insulator material studied. Notice that the thermal conductivity of expanded polystyrene is 0.039, the lowest value of all the materials analyzed. The rice husk (0.044) presented values nearing those of the expanded polystyrene, followed by the banana stem (0.050) and the coffee husk (0.060). These were compared with others reported in the literature [
21]. It is important to mention that the k values for rice husk, banana stem, and coffee husk are not reported in the open literature; these values would be necessary to conduct statistical tests and thus evaluate differences in k values between materials. Thermal conductivity designates the ability of a material to conduct heat. Therefore, the value of each thermal insulation material must be less than 0.065 W/m K (0.058 W/m K). Also, it is important to consider the material density for practical fishing applications in containers [
27].
Materials with thermal conductivity less than or equal to 0.050 W/m K are considered thermal insulators, since a material with low conductance is a poor heat conductor. According to Pizarro, 2020 [
27], all the insulators evaluated in this study are considered thermal insulators; this was also confirmed by Pardo and Gualdrón, 2019 [
9]. The k values may change according to the author, methodology, variables/parameters, and the industrial application. However, Gutiérrez et al., 2014 [
6], considered that another important point to evaluate insulators is their ability to be degraded by the environment (biodegradability).
Table 5 shows the temperature, ultimate strength, and biodegradability of three natural insulators as a result of this research. It is important to mention that expanded polystyrene is has significant levels of environmental pollution; it takes around 500 years for expanded polystyrene to integrate with the environment, significantly affecting environmental biodiversity [
28]. On the other hand, using biodegradable insulating materials makes it possible to reduce pollution because materials such as cork and rice husk agglomerates integrate with the environment in less than a year (0.10–0.25 years).
3.1. Statistical Analysis Results
Statistical analysis was used to evaluate the normality assumption of the data which were used to carry out parametric tests; the Lilliefors test (Kolmogorov–Smirnov, K-S-L) and Shapiro–Wilk test were used [
29]. The results of the normality tests for 100, 70, and 50 filling percentages are shown in
Table 6. The null hypothesis of the tests suggests that the samples are normally distributed, but the results of the applied goodness-of-fit tests (p-value less than 0.05) indicate that they do not follow a normal distribution; that is, the null hypothesis is rejected because is not appropriate to use parametric methods such as the t-test or the analysis of variance (ANOVA) test. However, compliance with the normality assumption is necessary; this led to evaluating the data with non-parametric tests. Subsequently, a non-parametric test (Kruskal–Wallis) was applied, based on the ANOVA, which allowed to determine whether there were differences in the distributions of the variables under study [
30]. From
Table 6, it is possible to observe that, for the statistical analyses developed, both models for the insulating materials indicate that the variables are highly significant for the filling percentages, with a confidence level of 95%, which does not influence the thermal properties of the biodegradable insulators.
Table 7 shows the Kruskal–Wallis test results for the 100, 70, and 50 fill percentages. A p-value less than 0.05 indicates that at least one of the materials has a different thermal conductivity value than the others, but it does not specify exactly which treatments are different. Therefore, post hoc Mann–Whitney U tests were performed to enable to observe the differences. In the Kruskal–Wallis test, it was possible to observe that the type of filling does not influence the result of the thermal conductivity for the materials evaluated; this is because, when subjected to the different treatments, the results presented the same trends. Note that, following each filling with ice, expanded polystyrene had the best thermal conductivity values, followed by rice husks, banana stems, and coffee husks; this must be considered in relation to the influence of density in terms of the thermal conductivity of insulators.
Since the Kruskal–Wallis test does not allowed to determine which of the materials among the independent groups presents a statistically significant difference in its thermal conductivity in comparison with the others, it is appropriate to apply the Mann–Whitney U test.
Table 8 shows the Mann–Whitney U test results for the different filling percentages in which the sample pairs were compared. Note that, in all cases, the null hypothesis that the samples are equal (p-value less than 0.05) is rejected; that is, all the samples are different from each other. It was possible to confirm that the insulating materials evaluated in this study are statistically different because the expanded polystyrene had better results than the natural biodegradable materials (lower value of thermal conductivity); so with rice husk, good results were observed, so it can be considered a good insulator which can be appropriately applied in the construction of thermal containers for fish.
3.2. Economic Analysis
3.2.1. CAPEX and OPEX Calculations
Table 9 presents, in detail, the different variables that affect the cost of the construction of the containers and the obtention of the natural insulators, which were determined through the CAPEX (capital expenditure) and OPEX (operating expenditure) metrics.
It is important to mention that the specific CAPEX and OPEX items can differ depending on the scale and complexity of the experimental study setting. Also, it is important to accurately track and document all expenses related to the study to ensure complete CAPEX and OPEX calculations. Additionally, consult with the institution’s financial department or research grant guidelines for proper accounting and reporting of these expenditures.
3.2.2. Calculations of the Costs Related to Fish Cooling
The conservation costs of the different containers built have similar parameters, such as conservation time (1 day), location conditions, ice cost, and fish kind (in this study, we used red snapper—Lutjanus campechanus), as shown in
Table 10. Thermal conductivity affects the ice cost because insulating materials with a lower k value will allow a smaller amount of heat transfer (cold way), which will be directly reflected in the thaw amount. Given that the evaluations were performed in the same location, the cost of the ice per kg is consistent at around COP 150 = USD 0.038; this is a lower value than the cost per kilogram of frozen fish. Also, it was possible to calculate the costs associated with the fish conservation process using different thermal insulators (biomaterials), because the ice quantity required and the costs for each material were recorded. The results could be valuable in making decisions regarding the preservation material choice and strategy, when the aim is to preserve fish efficiently and economically. Note that, when using biomaterials as insulators, the values found are not similar due to their processing; each material has different advantages depending on the time of purchase; one must always consider the availability and cost of a given material at the time of purchase, whether the material is recycled or otherwise obtained.
CAPEX was utilized to assess the initial costs associated with acquiring or setting up the materials for fish cooling; these are presented here because, in some cases, it is difficult to determine economic values (see
Table 9). OPEX was utilized to assess the ongoing costs associated with using the materials for fish cooling. In this case, the primary components of OPEX are the ice cost and the conservation cost (the cost of using the insulation materials) per kilogram of fish [
31]. CAPEX and OPEX were estimated and summarized in
Table 11, where the costs associated with each material for fish cooling were calculated. Notice that the thermal conductivity values for the natural insulator were related to the maximum costs of the production process [
32].
Thermal conductivity affects the consumption of ice because insulating materials with a lower k value allow heat transfer to occur easily; this is directly reflected in the amount of thaw water. Since the cost evaluation was carried out in the same place, the ice cost is constant, translating into a lower value per kilogram than that of the cooling fish. Regarding the use of materials as insulators, we determined that they were not similar because each material has advantages depending on the time and place that it is obtained; this means that one must consider the availability and cost of the material when purchased, and whether it is recycled or otherwise obtained.
4. Limitations and Trends
There were some limitations in this study, which are described here. Limited applicability: Depending on the experimental conditions and parameters used, the findings of this study might only apply to specific contexts or conditions within the fishing industry. The limitations of this study may include a lack of generalizability to other industries or scenarios. Simplification of real-world conditions: Laboratory experiments might involve simplified conditions that do not accurately represent the complex and dynamic environments of real-world fishing industry applications. Real-world factors, such as moisture, temperature fluctuations, and mechanical stresses, could significantly impact the insulating properties of materials. Sample size and variation: When a study uses a small sample size or a limited range of materials, the results might not capture the full spectrum of natural insulators available for fishing applications. Greater material diversity and larger sample sizes could provide a more comprehensive understanding. Assumption of steady-state conditions: The study may assume steady-state conditions for its experiments. However, in real-world fishing scenarios, thermal dynamics might change over time due to various factors which have potential to impact the effectiveness of the insulating materials.
When conducting experiments or studies involving the use of thermal insulators for cooling fish or other perishable goods within containers, the results can be influenced by several potential parameters, sample size limitations, and other factors. These are detailed here:
- ➢
Container Design and Material: The type of container used can significantly impact cooling efficiency. Factors such as container material, size, shape, and insulation properties should be consistent to isolate the effects of the insulating material being tested.
- ➢
Ambient Conditions: As with experiments without containers, ambient temperatures and humidity levels can affect the cooling rates of the container. Controlling these conditions and maintaining a consistent environment is essential.
- ➢
Insulation Material Properties: The properties of the insulation material itself, such as thermal conductivity and thickness, can influence cooling performance. Variations in these properties can introduce confounding factors.
- ➢
Container Size: The size of the container relative to the fish number or perishable goods being cooled can impact the cooling rate. Smaller containers may cool faster due to a higher surface-area/volume ratio.
- ➢
Initial Temperature: The starting temperature of the fish or perishable goods inside the container can affect the cooling process. Starting with goods at different initial temperatures can lead to variability in results.
- ➢
Container Lid: The container’s presence and type of lid or cover can influence cooling. Properly sealing the container minimizes heat exchange with the external environment.
- ➢
Heat Transfer Modes: Understanding the predominant modes of heat transfer (conduction, convection, or radiation) within the container and between the contents and insulation is crucial.
- ➢
Insulation Placement: The placement and distribution of insulation material within the container should be standardized to ensure consistent results. Poorly placed insulation can lead to uneven cooling.
- ➢
Time: The duration of the cooling experiment can affect results. Longer durations may allow for more significant temperature reductions, but they may not be practical for generalization to real-world applications.
- ➢
Sample Size: The container number and tests conducted should be sufficient to draw statistically meaningful conclusions. Inadequate sample size can limit the reliability of the results.
- ➢
Insulation Degradation: Over time, insulation materials can degrade or lose their insulating properties, affecting long-term performance. Researchers should consider the durability of the selected materials.
- ➢
Experimental Design: A well-structured experimental design, including randomization and controls, is crucial for minimizing biases and confounding variables.
- ➢
Data Collection: Accurate temperature data collection and monitoring are essential. Using unreliable or inconsistent measurement methods can introduce errors.
- ➢
External Factors: External factors, such as exposure to sunlight or fluctuations in room temperature, can affect the container’s internal temperature and should be controlled or monitored.
- ➢
Cost and Practicality: Considerations related to the cost and practicality of using specific insulating materials in real-world scenarios should also be considered.
Addressing the aforementioned factors and developing controlled experiments with careful consideration of the experimental design can aid researchers in obtaining reliable and meaningful results when studying the use of thermal insulators for cooling fish or perishable goods within containers.
Finally, some trends are detailed here. Sustainable insulation solutions: One potential trend that could emerge from the present study is an emphasis on using natural insulators that are environmentally friendly and sustainable. Like many others, the fishing industry is increasingly focused on adopting sustainable practices. Efficiency and cost-effectiveness: Trends in the study might highlight the importance of selecting insulating materials that provide optimal thermal efficiency while being cost-effective. Balancing performance and affordability are a common concern in industrial applications. Multi-functional Materials: The present study might assist other researchers in identifying trends in using natural insulating materials that offer additional benefits beyond thermal conductivity, such as mechanical strength, resistance to moisture, or ease of handling. Interdisciplinary research: With present study uncovering complex challenges in insulating applications for fishing, a trend could emerge toward interdisciplinary research collaborations. Combining expertise from materials science, engineering, and the fishing industry could lead to more innovative solutions. Technology adoption: With this study suggesting improved natural insulators, there could be a trend towards adopting these materials in fishing practices, potentially leading to increased energy efficiency and reduced resource consumption.
5. Conclusions
The thermal conductivity coefficient was determined for each one of the natural insulators. From the results, it was concluded that the expanded polystyrene presented the lowest thermal conductivity, followed by the rice husk, the banana stem, and finally the coffee husk. This was determined through the ascending order of the average values of thermal conductivity; this was consistent regardless of the filling percentage of the container studied. The average thermal conductivity coefficients for each material studied, presented here in descending order, were: expanded polystyrene (0.026 at 0.039 W/m K), followed by rice husk (0.028 at 0.044 W/m K), banana stem (0.033 at 0.050 W/m K), and coffee husk (0.049 at 0.060 W/m K).
The comparison of the average thermal conductivity values for each of the different biomaterials with the expanded polystyrene indicate that at least one is statistically different from the others. The Kruskal-Walli test values corroborated this, with a 95% confidence. Subsequently, the Mann–Whitney U test allowed a statistical comparison of the materials in pairs, determining that they are all different, with a p-value less than 0.005.
The insulator container built from rice husk had results which were closest to those for the insulating characteristics of expanded polystyrene. This was used as a comparison material because of its low thermal conductivity; it also provides another similar characteristic, being light in weight, which makes products using these materials easy to handle. Given these characteristics, rice husk can be selected for use as thermal insulation in the construction of equipment for cold food preservation.
The conservation costs for each container developed were calculated, allowing to conclude that the resulting values per kilogram of fish follow a similar order to that of the thermal conductivity values; this behavior means that higher thermal conductivity values will also lead to higher ice costs, because containers with lower thermal conductivity values will allow a lower amount of heat transfer, which will directly correlate with the amount of thaw water; thus, less ice will be required to preserve the fish than containers made with materials with greater thermal conductivity. Therefore, the conservation value will depend on the type of material used for this purpose.
Author Contributions
L.L.L.-R. and Y.C.O.-O. contributed to investigation, methodology, and formal Analysis. A.E.-M., F.N.-M. and S.P.G.-N. contributed to conceptualization, methodology, supervision, formal analysis, funding acquisition, and made other contributions. L.A.M.-P. contributed to conceptualization, methodology, funding acquisition, and made other contributions. R.A.G.-L. contributed to formal analysis, funding acquisition, original draft writing, and writing—review and editing, and made other contributions. All authors have read and agreed to the published version of the manuscript.
Funding
This work was supported by the research grant of the Universidad del Magdalena.
Data Availability Statement
No data were used for the research described in the article.
Acknowledgments
Authors thanks to DIE of the UFPSO, UNIMAG and the IPN Mexico for his support.
Conflicts of Interest
The authors declare that they have no known competing financial interests or personal relationships that could have appeared to influence the work reported in this paper.
Nomenclature
| A | time area |
| ACI | American Concrete Institute |
| ANOVA | analysis of variance |
| CAPEX | capital expenditure |
| COP | Colombian pesos |
| Cp | specific heat of the fish |
| DF | degrees of freedom |
| GHP | guard hot plate |
| H | height |
| h1 | consumption |
| Hep | ice needed to cool the fish |
| Hf | ice required to compensate for thermal losses |
| hice | total ice consumption |
| HMF | heat meter flow |
| k | thermal conductivity |
| K-S-L | Kolmogorov–Smirnov–Lilliefors |
| L | length |
| mH | mass of the ice |
| mh | weight of the ice losses |
| N | amount of variables |
| OPEX | operating expenditure |
| P | statistical assumption |
| Q | heat |
| R2 | correlation coefficient |
| Rij-Xij | statistical expressions |
| Tp | fish temperature |
| U | heat transfer |
| USD | American dollars |
| W | width |
| x | different thickness |
| z | amount of time |
| ΔT | temperature differential |
| θ | statistical variable |
| λ | latent heat of fusion of the ice |
References
- Matera, J. Livelihood diversification and institutional (dis-)trust: Artisanal fishing communities under resource management programs in Providencia and Santa Catalina, Colombia. Mar. Policy 2016, 67, 22–29. [Google Scholar] [CrossRef]
- Torres-Guevara, L.E.; Lopez, M.C.; Schlüter, A. Understanding Artisanal Fishers’ Behaviors: The Case of Ciénaga Grande de Santa Marta, Colombia. Sustainability 2016, 8, 549. [Google Scholar] [CrossRef]
- Torres-Guevara, L.E.; Schlüter, A. External validity of artefactual field experiments: A study on cooperation, impatience and sustainability in an artisanal fishery in Colombia. Ecol. Econ. 2016, 128, 187–201. [Google Scholar] [CrossRef]
- Cuevas, T.C.; Ramírez, J.Z. Análisis de Ciclo de Vida del Poliestireno Expandido usado en Contenedores de Alimentos en Colombia. Ingeciencia 2020, 3, 53–65. Available online: https://editorial.ucentral.edu.co/ojs_uc/index.php/Ingeciencia/article/view/2874 (accessed on 20 July 2023).
- SN Aislantes Térmicos Ecológicos y Sostenibles. Arquitectura Sostenible. 2018. Available online: https://arquitectura-sostenible.es/aislantes-termicos-ecologicos-y-sostenibles/ (accessed on 10 February 2023).
- Gutiérrez, J.; Cadena, C.; Silvera, A.J.B. Thermal insulation produced from rice husk agglomerated using starch produced by saccharomyces cerevisiae. DYNA 2014, 81, 138–143. [Google Scholar] [CrossRef]
- Canto, A.; Batista, M.; Sanchez, J.; Moreno, M.; James, A. Aislante térmico a base de materiales orgánicos. Rev. Iniciación Cient. 2018, 4, 48–51. [Google Scholar] [CrossRef]
- Vásquez, J.R.A.C.; Regalado, E.B.T. Fibra del Vástago de Plátano en la Resistencia a Compresión y Absorción de Bloques de Concreto, Casa Grande-Trujillo 2018; Universidad César Vallejo: Los Olivos, Peru, 2019. [Google Scholar]
- Pardo-Camacho, G.A.; Villamizar, O.R.G. Estudio de Factibilidad de una Fibra Natural como Materia Prima para la Fabricación de un Bioaislante; Universidad Pontificia Bolivariana: Bucaramanga, Colombia, 2019. [Google Scholar]
- Campos, J.F.L. Análisis, Desarrollo y Evaluación de Aislantes Térmicos Fabricando Bloques de Hormigón Aislantes con Cascarilla de Café para su Aplicación en la Construcción de Edificaciones; Universidad de las Fuerzas Armadas: Sangolquí, Ecuador, 2015. [Google Scholar]
- Cano-Villalba, M.A. Conservación de los Alimentos en Frío. Available online: https://www.naturalcastello.com/es/conservacion-alimentos-frio/ (accessed on 20 July 2023).
- StudyLib 6-Propiedades Termicas de Algunos Materiales de Construccion y Aislantes. 2020. Available online: https://studylib.es/doc/5897957/6.--propiedades-termicas-de-algunos-materiales-de-constru (accessed on 22 July 2023).
- Quezada, F.S.C.; Peñaherrera, L.A.V. Desarrollo Experimental de un Aislante Térmico Utilizando Cascarilla de Arroz y Aglutinantes Naturales, en Planchas Rígidas. Ecuador. 2012. Available online: http://repositorio.espe.edu.ec/handle/21000/5504 (accessed on 22 July 2023).
- Villacis, C.P.S. Elementos Modulares: Una Propuesta en Base de Fibras Naturales de Trigo y Cascarilla de Café; Universidad Católica de Cuenca: Cuenca, Ecuador, 2020. [Google Scholar]
- Cruz, J.S. Estudio Comparativo de Materiales Sostenibles Aislantes en Arquitectura; Universitat Politècnica de València: Valencia, Spain, 2019. [Google Scholar]
- Gutiérrez, M.J.; Cadena, C.; Bula, A. Aislamiento Térmico Producido a Partir de Cascarilla de Arroz Aglomerada Utilizando Almidón Producido con Saccharomyces Cerevisiae. Dyna 2014, 81, 138–143. Available online: https://www.redalyc.org/articulo.oa?id=49630405019 (accessed on 28 July 2023).
- Pfundstein, M. Insulating Materials: Principles, Materials, Applications; Birkhäuser Architecture: Basel, Switzerland, 2008. [Google Scholar]
- ASTM-C518-21; Standard Test Method for Steady-State Thermal Transmission Properties by Means of the Heat Flow Meter Apparatus. ASTM: New York, NY, USA, 2021; pp. 1–34.
- ASTM-C177-19; Standard Test Method for Steady-State Heat Flux Measurements and Thermal Transmission Properties by Means of the Guarded-Hot-Plate Apparatus. ASTM: New York, NY, USA, 2019; pp. 1–45.
- Ghajar & Cengel. Transferencia de Calor y Masa; McGraw-Hill: Mexico City, Mexico, 2018. [Google Scholar]
- Cengel, Y.A.; Boles, M.E. Termodinamica—Cengel, 7th ed.; McGraw-Hill: New York, NY, USA, 2011. [Google Scholar]
- Matsui, M.; Takemura, A. Goodness-of-fit tests for symmetric stable distributions—Empirical characteristic function approach. TEST 2008, 17, 546–566. [Google Scholar] [CrossRef]
- Wilcoxon, F. Individual Comparisons by Ranking Methods. Biometrics Bull. 1945, 1, 80–83. [Google Scholar] [CrossRef]
- Mann, H.B.; Whitney, D.R. On a test of whether one of two random variables is stochastically larger than the other. Ann. Math. Stat. 1947, 18, 50–60. [Google Scholar] [CrossRef]
- Zugarramundi, A.; Parin, M. Ingenieria Economica Aplicada a La Industria Pesquera; FAO: Rome, Italy, 1998. [Google Scholar]
- Viegas, G.M.; Walsh, C.; Barros, M.V. Evaluación Cuali-Cuantitativa de Aislaciones Térmicas Alternativas para Viviendas. El caso de la Agricultura Familiar. Rev. INVI 2016, 31, 89–117. Available online: https://revistainvi.uchile.cl/index.php/INVI/article/view/62719 (accessed on 28 July 2023). [CrossRef]
- Pizarro-Cisternas, A.A. Estudio Tecnico para la Implementacion de Lana de Obeja como Aislante en Chile; Universidad Tecnica Federico Santa Maria: Valparaíso, Chile, 2020. [Google Scholar]
- Ho, B.T.; Roberts, T.K.; Lucas, S. An overview on biodegradation of polystyrene and modified polystyrene: The microbial approach. Crit. Rev. Biotechnol. 2018, 38, 308–320. [Google Scholar] [CrossRef] [PubMed]
- Pulido, H.G.; De La Vara Salazar, R. Análisis y Diseño de Experimentos; McGraw-Hill: Mexico City, Mexico, 2008. [Google Scholar]
- Gómez-Gómez, M.; Danglot-Banck, C.; Vega-Franco, L. Non Parametric Statistical Tests Synopsis. When Are They Used? Rev. Mex. Pediatr. 2003, 70, 91–99. Available online: https://www.medigraphic.com/cgi-bin/new/resumenI.cgi?IDARTICULO=8084 (accessed on 28 July 2023).
- Bieber, N.; Ker, J.H.; Wang, X.; Triantafyllidis, C.; van Dam, K.H.; Koppelaar, R.H.; Shah, N. Sustainable planning of the energy-water-food nexus using decision making tools. Energy Policy 2018, 113, 584–607. [Google Scholar] [CrossRef]
- García-León, R.A.; Flórez-Solano, E.; Rodríguez-Castilla, M. Application of the procedure of the iso 50001:2011 standard for energy planning in a company ceramic sector. DYNA 2019, 86, 113–119. [Google Scholar] [CrossRef]
| Disclaimer/Publisher’s Note: The statements, opinions and data contained in all publications are solely those of the individual author(s) and contributor(s) and not of MDPI and/or the editor(s). MDPI and/or the editor(s) disclaim responsibility for any injury to people or property resulting from any ideas, methods, instructions or products referred to in the content. |
© 2023 by the authors. Licensee MDPI, Basel, Switzerland. This article is an open access article distributed under the terms and conditions of the Creative Commons Attribution (CC BY) license (https://creativecommons.org/licenses/by/4.0/).


