1. Introduction
Plastics are a wide range of synthetic or semi-synthetic materials that use polymers as the main components with different chemical and technical characteristics. Plastic waste is any used synthetic or semi-synthetic material substances derived from ‘primary use’ such as plastic bottles and other items. Discarding these into the natural environment has adverse effects on wildlife, wildlife habitats, and humans [
1,
2]. Plastic production has increased rapidly since the 1950s, from 2.0 Mt to 380.0 Mt in 2018, with projections of 2000.0 Mt expected by 2050 [
3]. Global plastic waste generation has rapidly increased due to an increased population and consumption. This has more than doubled from 2000 to 2019 to 33 Mt. Two-thirds of the generated plastic waste comes from plastics, which have a life span of less than five years [
4].
The average generation of plastic has been reported to be 7 kg/person/day in developing countries, while the top 20 polluting nations exhibit an alarming average of 12.2 kg/person/day [
5]. This implies that individuals in these high-pollution countries contribute more than 12 kg of plastic waste daily. Based on origin, plastic waste can be classified as industrial, commercial, and household plastic waste. Industries use plastics for the following uses: packaging, building and construction, textiles, consumer and institutional products, transportation, electrical/electronic, industrial machinery, and other sectors [
6]. The packaging sector is the dominant user of primary plastics, where building and construction are the second largest and textiles are the third largest [
7]. Global plastic production does not directly replicate global plastic waste generation as the polymer type and lifetime of the product influence it. However, plastic in packaging becomes a dominant generator of plastic waste as it has a minimal ‘in-use’ lifetime, around six months or less, compared to the plastic waste generated in other sectors, as the mean lifetime of the plastics is high. Suppose the current plastic production and plastic waste management trends happen to continue. In that case, roughly 12,000 Mt of plastic waste will be dumped in landfills or the natural environment by 2050 [
3].
Globally, most plastic waste is managed either by burning or open dumping, which causes environmental pollution, including impacts on global warming. Plastic recycling is proving ineffective, with only a fraction of the generated plastic waste suitable for recycling into another applicable form. The barriers are its economic value and the technology. This results in plastic waste ending up either in landfills or in the ocean body. The destination for plastic waste is as follows: (i) 65% enters the landfill, (ii) 25% is burnt, and (iii) only 10% is recycled around the globe [
6,
8]. However, recycled plastic waste can be used in different types of manufacturing productions if the waste is recycled with a proper sorting process. As there are a lot of different types of plastic and hundreds of different variants, major types of plastics can be categorised into seven groupings according to the standard marking code developed by the American Society of Plastics Industry: (i) polyethylene terephthalate (PET), (ii) high-density polyethylene (HDPE), (iii) low-density polyethylene (LDPE), (iv) vinyl/polyvinyl chloride (PVC), (v) polypropylene (PP), (vi) polystyrene (PS), and (vii) other (other kinds of plastic products) [
9]. Out of the total plastic waste, polyethylene acts as a significant plastic waste component at 29.6%, followed by propylene at 18.9%, polyvinyl chloride at 10.4%, polystyrene at 7.1%, polyethylene terephthalate at 6.9%, and remaining plastic types represent 27.1% of the total plastic fraction [
10].
Under the world’s industrial development and population growth, plastic waste is rapidly produced and exposed at a high rate to the environment. Therefore, the disposal of plastic waste safely and efficiently is a must due to its negative environmental impact. Many animals ingest plastic waste due to poor waste management. Many of these have been highlighted in the media and include elephants, sea turtles, and fish. This results in digestion problems due to the accumulation of plastic waste (e.g., plastic bags, wrapping items). A secondary impact is the build-up of microplastics and other toxins in animal bodies. This passes through the upper food chains, transferring the toxic materials to other animals or humans. Therefore, sustainable plastic waste disposal methods need to be introduced.
In Sri Lanka, plastic waste is burned, recycled, or sent to municipal councils for landfilling. However, plastic waste burning significantly increased during the COVID-19 pandemic [
11,
12] due to the disrupted waste management processes. Since then, the behavioural patterns of the community have changed considerably. Therefore, proper waste management processes must be implemented to overcome the current issues.
This study addresses critical aspects of plastic waste management in Sri Lanka, acknowledging the collaborative efforts of inhabitants, municipalities, and private sector collectors in waste collection. Over the past 45 years, the plastic industry in Sri Lanka has expanded, encompassing approximately 400 businesses, with a substantial volume of plastic products imported annually. Noteworthy is the monthly disposal of significant quantities of specific plastic items revealing the scale of the plastic consumption challenge. This study cites a 2020 report indicating an average annual plastic consumption of around 6 kg per person. Urban areas contribute around 10% of plastic waste, posing distinct challenges compared to the 5% of rural plastic waste, complicating recycling methods.
Furthermore, the research aims to explore key questions related to plastic recycling and waste management in Sri Lanka. This study’s primary objectives include understanding existing plastic recycling methods, identifying challenges and opportunities associated with plastic recycling, and assessing the roles of tourism and government in plastic waste management. The investigation involves a comprehensive analysis of current plastic recycling practices, focusing on the significant challenges and opportunities affecting efficient recycling in the country. This study scrutinizes the specific roles played by both tourism and the government in managing plastic waste.
2. Current Plastic Recycling Methods in Sri Lanka
Local authorities (LA), which adhere to the rules and legislation issued by the Provincial Council and the Central Government, provide the fundamental legal framework for managing municipal solid waste (MSW). Depending on population density, urban infrastructure, and revenue status, LAs are divided into three categories: Municipal Councils (MC), of which there are 24; Urban Councils (UC), of which there are 41; and Pradeshiya Sabha (PS), of which there are 276. LAs must remove and dispose of waste without endangering the public [
13,
14].
In the early 2000s, a few LAs emphasised the importance of source segregation and collection to enhance plastic recycling. LAs and private recyclers have given considerable attention to the collection and processing of plastic waste for recycling over the past 20 years. Sri Lanka’s inhabitants, municipalities, and private sector collectors work together to collect plastic waste. The production of plastic goods, packaging, and industrial polymers has expanded over the past 45 years and now includes about 400 businesses in Sri Lanka. Additionally, a sizeable number of plastic products are imported; according to CEA statistics [
13], Sri Lanka imports about 500,000 Mt of virgin plastic each year to make plastic products. On the other hand, it was estimated that Sri Lanka disposed of 20 million yoghurt cups, 15 million lunch sheets, 20 million supermarket bags, and one million sachet packets of sauce, jam, and shampoo every month [
15]. According to Basnayake et al. (2020), the average annual plastic consumption per person is around 6 kg [
16]. Plastic garbage in urban areas, including hard and soft plastics (films), makes up about 10% of all waste. In contrast, a Sri Lankan state-wide Japan International Cooperation Agency (JICA) study in 2016 found that residual plastic waste makes up just 5% of the rural waste stream [
17]. This makes it challenging to recycle using simple mechanical shredding, pelletising, and extruding methods.
Historically, the conventional plastic recycling business in Sri Lanka, like many other developing nations, was primarily driven by entrepreneurs. Small and medium-sized enterprises have regularly collected plastic garbage from industrial and commercial sectors since the late 1980s.
Table 1 indicates the standard plastic processing technologies and types of plastic waste in Sri Lanka.
Individual collectors target certain recyclable items from homes and businesses, selling them to commercial collectors. The plastic waste items are cleaned and resold at these sites to regional companies or exported abroad. Due to the severe pollution caused by burning or burying these post-consumer products, the Ministry of Environment and Natural Resources (ME and NR) banned the production and distribution of polythene and any polythene products of 20 microns or less in its policy and regulations on the management of plastic waste in 2006. Soon after, the ME and NR implemented the National Post Consumer Plastic Recycling Project (NPCPRP). By 2018, NPCPRP had developed 12 plastic waste recycling facilities in Sri Lanka. LAs had collection trucks designed explicitly for collecting non-degradable garbage or tractor-trailers with partitions for collecting debris segregated at the source [
18].
The number of plastic waste collectors and recyclers in the recycling business sector has steadily increased by 82% from 2007 to 2015 [
13], matching the growth in plastic waste generation, particularly in urban areas in Sri Lanka, as well as the rise in population and changes in consumption patterns brought on by urbanisation and globalisation. Subsequently, between 2010 and 2019, a few large-scale recycling enterprises were founded concurrently with expanding small and medium-sized recycling businesses. Nearly 200–250 MT of PET waste is supplied to a factory each month, which has recently developed a nationwide network of 125 collection stations [
19].
Most large-scale enterprises were founded as Board of Investment (BOI) industries, which receive investment funds to meet the need for premium recycled plastic products from global markets, such as yarn and high-grade pellets [
20]. Because processing facilities have a greater capacity than the present supply of plastic garbage, demand for these recycled products is still increasing [
21].
Local authorities assist independent collectors, mediators, and private recycling companies by offering municipal tax breaks, encouraging the establishment of recycling firms, and granting direct access to garbage sources [
22]. The widespread adoption of biodegradable plastics that are challenging to recycle, coupled with fluctuating prices for virgin plastic materials and financial and technical limitations in acquiring and operating processing equipment, and the inconsistent availability and contamination of collected plastic waste, significantly impact the quality and quantity of final products. Many other factors make it uncertain that the plastic recycling industry will continue to grow [
18]. Individual LAs have taken the initiative, with help from the federal government, to incorporate the collection and processing of recyclable plastics into their waste management strategies.
Tourism and Plastic Waste Management in Sri Lanka
Tourism is an essential sector in Sri Lanka, making up 12% of the nation’s GDP and providing employment opportunities [
23]. The industry has faced challenges due to many incidents over the past few years, including the Easter Sunday bombings in 2019, the COVID-19 pandemic in 2020, and the shortage of essentials such as fuel and electricity due to a significant economic crisis in 2021–2022 [
24]. However, there is optimism that the sector can recover in 2022–2023, with an estimated tourist arrival number as of 2023. Sri Lanka offers a mix of attractions, including beaches, wildlife parks, rainforests, tea plantations, ancient ruins, Buddhist cultural sites, and festivals [
25].
Sri Lanka’s southern coast, a tourism hotspot, is increasingly contaminated with microplastic pollution [
26]. A survey found that 60% of sand samples and 70% of surface water samples from 10 survey sites contained an abundance of microplastics up to 4.5 mm (0.18 in) in size [
26]. The researchers have called for meticulous waste management initiatives, regulation of the use of plastics, and further studies to ascertain the magnitude of the pollution caused by plastic waste. Efforts are being made to reduce plastic use in the Sri Lankan tourism sector. For example, a pilot project on plastic waste management is being implemented in Galle City (Southern Coast of Sri Lanka) by the IGES Centre, Collaborating with UNEP on Environmental Technologies (CCET), the Ministry of Environment–Sri Lanka, the Secretariat of the Basel, Rotterdam, and Stockholm Conventions (BRS Secretariat) and HELP-O, a local non-governmental organisation (NGO).
This study aims to address several key questions related to plastic recycling and waste management in Sri Lanka. The primary research questions include: (a) What are the existing plastic recycling methods in Sri Lanka? (b) What are the challenges and opportunities associated with plastic recycling in the country? and (c) What roles do tourism and the government play in plastic waste management in Sri Lanka? To achieve these objectives, a thorough investigation was conducted to assess the current plastic recycling practices in Sri Lanka. Additionally, this study will focus on identifying the significant challenges and opportunities that affect the country’s efficient recycling of plastic materials. Furthermore, the roles of both tourism and the government in managing plastic waste will be closely examined. The following sections will describe the method adopted to address and fulfil these research questions and objectives.
3. Research Methods Adopted for This Study
A questionnaire survey was chosen as the most appropriate method for collecting data on plastic waste utilisation in Sri Lanka. This method allowed for the efficient collection of information from many participants within a relatively short period. Given the widespread presence of registered plastic recycling and managing centres under the Central Environmental Authority (CEA), a questionnaire survey enabled the researchers to include a broad sample of stakeholders involved in plastic waste management. It also provided a structured approach to gathering consistent and comparable data on the types of plastic waste received and recycled by recycling centres.
A comprehensive questionnaire was designed to capture relevant information on plastic waste types, recycling processes, sorting methods, end products, and market destinations (the questionnaire survey form is provided as
supplementary document S1). The questionnaire was distributed among registered plastic recycling and managing centres from January 2023 to April 2023. The centres were invited to participate voluntarily. It is important to note that due to various reasons, including limited resources and time constraints, not all recycling centres could participate. A total of 265 recycling centres were contacted, representing all the recycling centres in the country (
Figure 1). Of these, 79 centres refused participation, while 77 were permanently closed or could not be reached. Despite these limitations, 109 valid responses were collected (
Figure 1), representing a response rate of approximately 41%.
The data collected from the questionnaire survey were analysed using the Statistical Package for the Social Sciences (SPSS) software (version 23) to determine the most frequently received and recycled plastic waste types. Percentages were calculated to understand the distribution of different plastic types among the respondents. Correlation analysis explored the relationship between plastic waste collection and the average number of tourists arriving each month in Sri Lanka. Rainfall patterns were also examined to assess their potential influence on plastic waste distribution.
4. Results and Discussion
The questionnaire’s findings revealed that by volume, HDPE (23.9%), PVC (18.6%), LDPE (19.1%), and PP (19.1%) are the leading plastic waste types in recycling centres. PS (9.3%) and PET (9.2%) were the least common plastic waste types compared to other types. The results showed that the collected plastic waste is mainly sent to recycling centres (56%), while 35% and 19% of accumulated plastic waste is sent to intermediate collectors and manufacturers. A significant majority of plastic waste recycled at recycling centres consists of LDPE (38%), PP (26%), and HDPE (20%). In contrast, only a small percentage of PET (10%) and PVC (6%) waste is recycled. These findings provide crucial insights into the types of plastic waste generated and recycled in Sri Lanka. The high percentage of HDPE plastic waste is particularly concerning. Although HDPE is technically recyclable, it is challenging to recycle in Sri Lanka. This is primarily because HDPE, widely used for containers for food, beverages, and household chemicals, is easily contaminated. Such contamination often arises from residual content, making its recycling more complex. The essential processes of cleaning and preparing HDPE containers for recycling are often neglected or inadequately managed by consumers. Consequently, high contamination rates are observed. As a result, while HDPE remains recyclable in theory, its practical recycling efficiency is hindered by prevalent contaminants. This scenario suggests that a significant proportion of HDPE plastic waste might ultimately end up in landfills or negatively impact the environment [
27].
There are several reasons why HDPE plastic waste is so common in Sri Lanka. One reason is that HDPE is a versatile material used in various products, including plastic bottles, milk jugs, and detergent containers. Another reason is that HDPE is a relatively inexpensive material [
28]. Further, it was identified that PS is not recycled at any recycling centres in Sri Lanka (
Figure 2) due to its hydrophobic nature, high cost of recycling, and lack of infrastructure [
28]. In contrast, PS poses significant challenges for recycling. Its hydrophobic nature, high recycling costs, and scarcity of recycling infrastructure render it an impractical option for recycling centres in Sri Lanka. The recycling of PET and PS plastics is further hindered by contamination issues, their bulky nature, and the limited demand for recycled materials. PET, commonly used in beverage bottles, suffers from food residue contamination, while PS, typically found in foam containers, faces challenges due to its lightweight nature. Both plastics lack efficient separation methods and grapple with inadequate recycling infrastructure and low consumer awareness.
To address these challenges, a collaborative effort among policymakers, industry stakeholders, and the public is essential. Awareness campaigns can educate the public about proper waste disposal and recycling practices, while improved waste management systems can facilitate efficient collection and segregation of recyclable materials. Incentives for businesses to invest in recycling facilities can further bolster recycling efforts. In the case of PS, low market value discourages recycling centres from investing in the necessary infrastructure and processes.
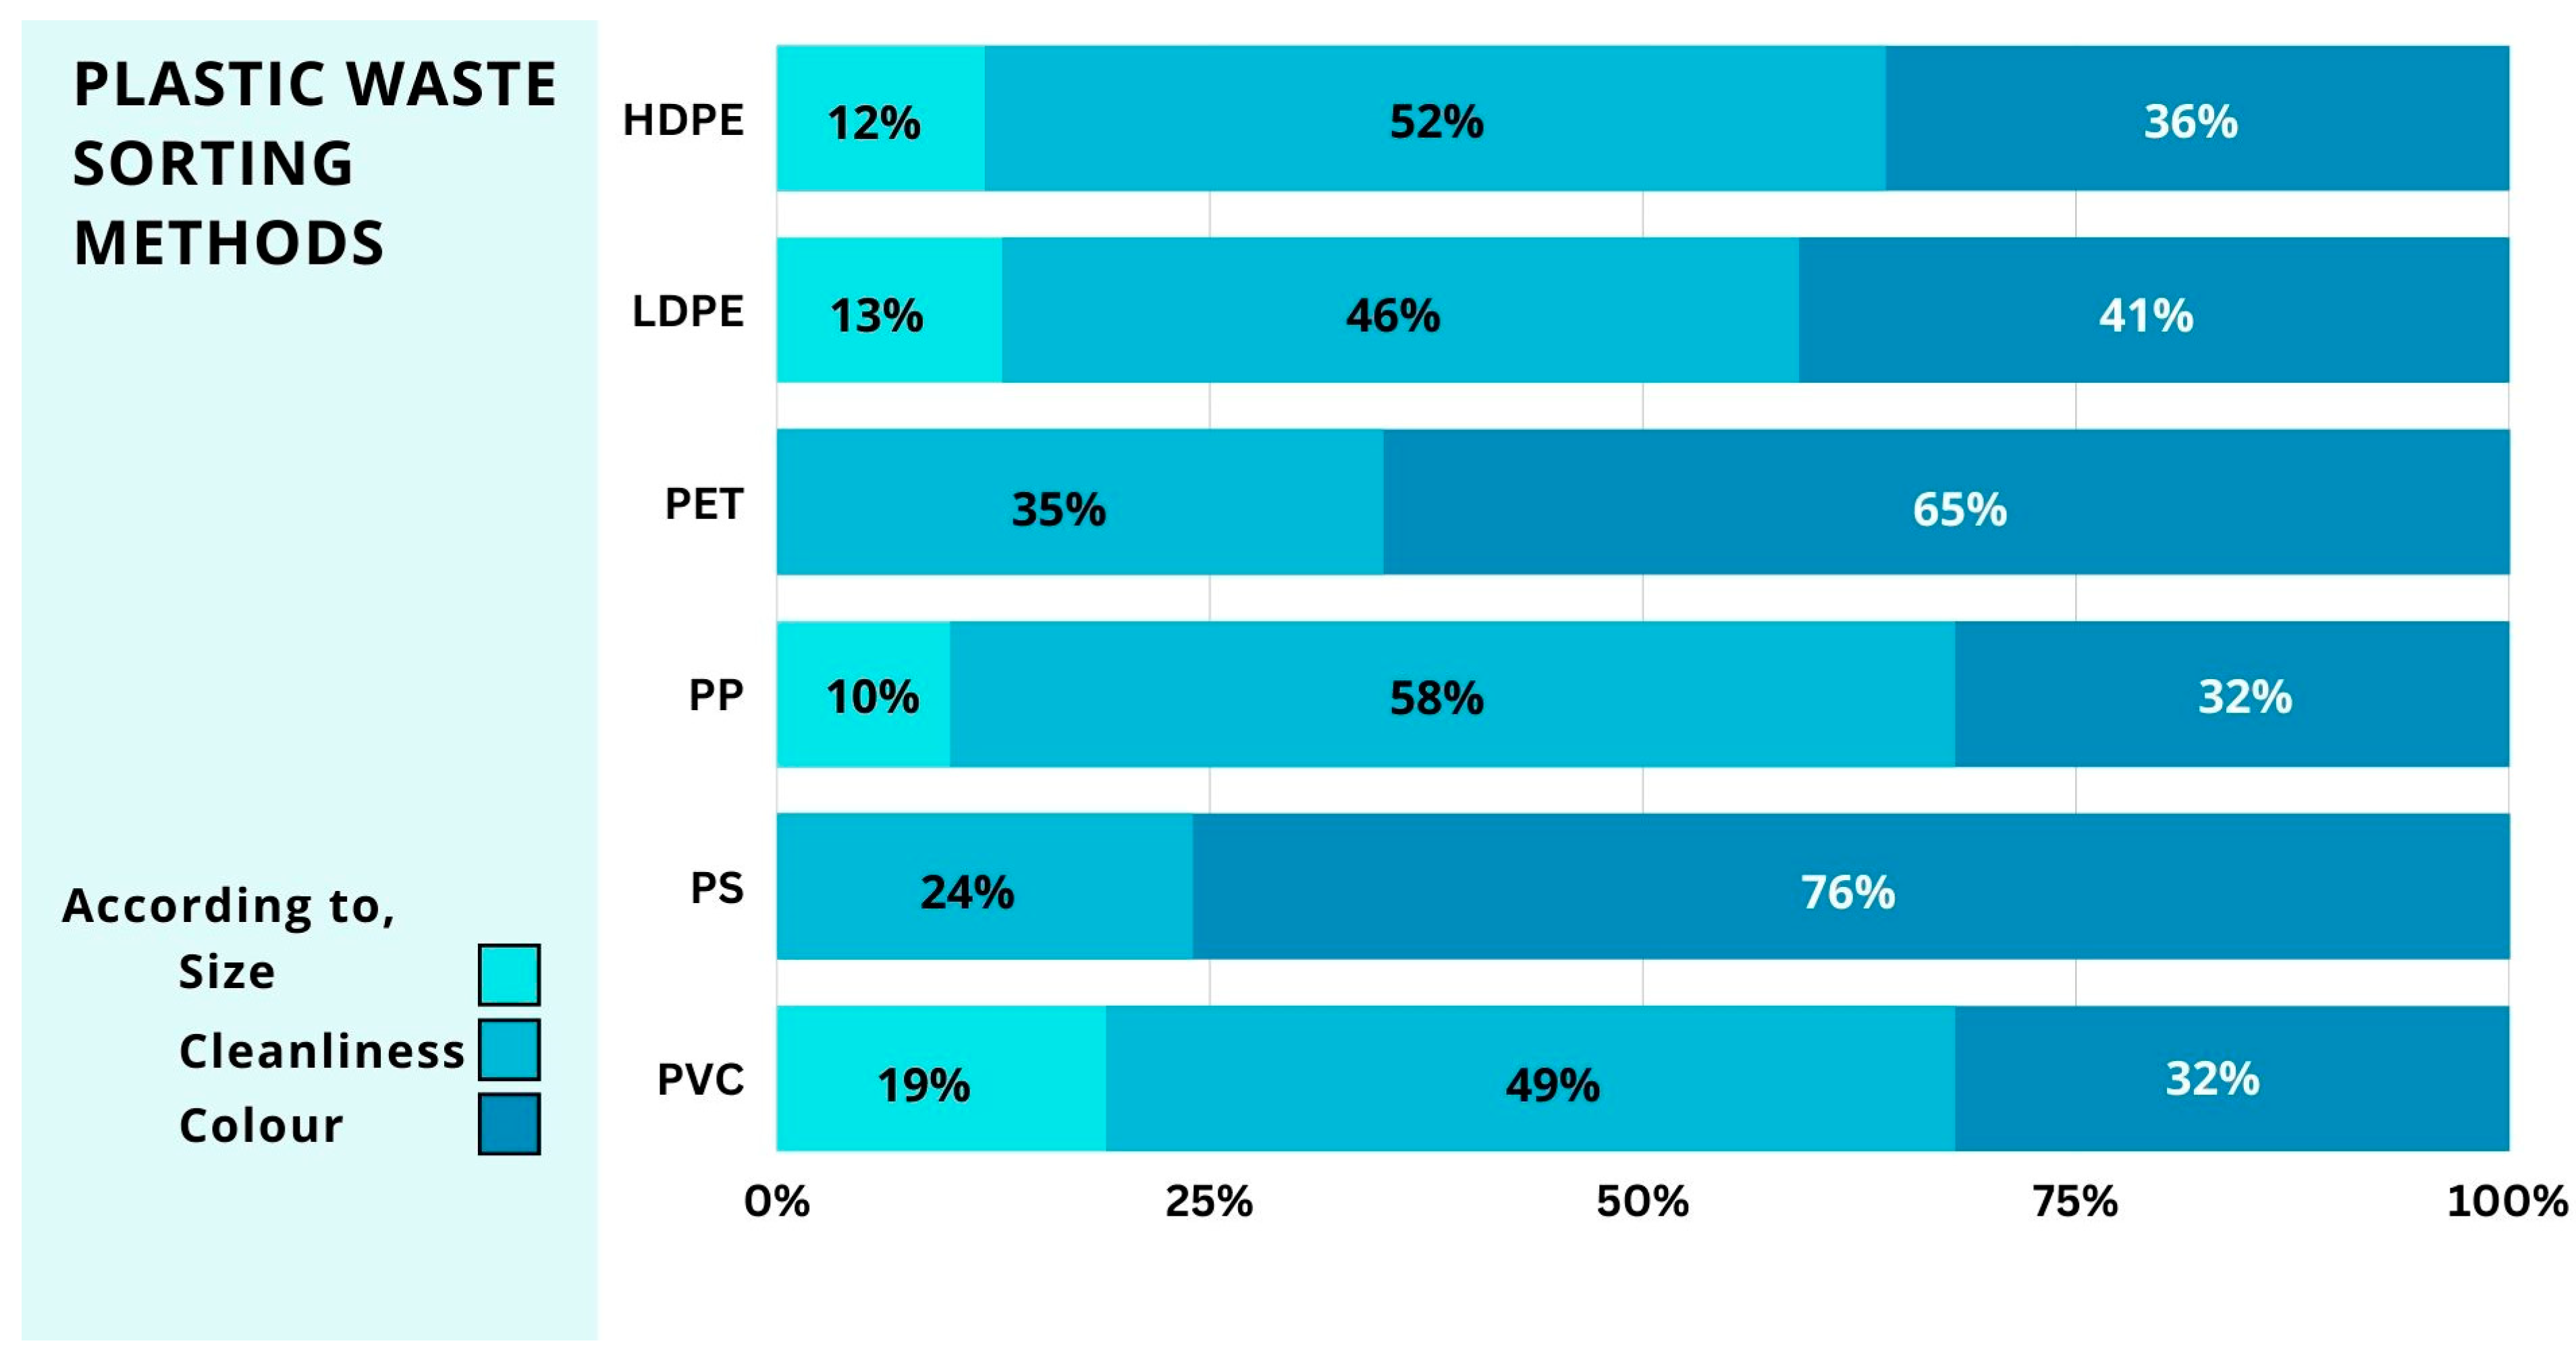
Plastic waste is sorted according to size, cleanliness (level of contamination or foreign materials present in the plastic waste), and colour. It was identified that HDPE, LDPE, and PVC show similar trends for plastic waste classifications. However, for PET and PS waste, it was determined that it was mainly by colour and cleanliness rather than size (
Figure 3).
Also, a few specific questions were asked of the respondents regarding PET plastics. About 95.8% of respondents stated that they receive adequate PET plastics for recycling and have a massive market for transparent PET waste plastics (91.7%) [
29,
30]. However, it was identified that the demand for multi-colour PET plastic waste is 12.5% and has a lower recycling potential of 17.0% (
Figure 4). There are a few reasons why there is no demand for multi-colour PET plastic waste. One reason is that multi-colour PET plastic waste is often not as aesthetically pleasing as transparent PET plastic waste. This makes it less desirable for use in new products. Another reason is that the different colours of multi-colour PET plastic waste can interfere with the manufacturing process of some products. For example, if multi-colour PET plastic waste is used to make bottles, the different colours can cause the bottles to become cloudy or discoloured.
Respondents were asked about the government’s involvement in the plastic waste management system in Sri Lanka. According to the survey results, nearly 93% of respondents were dissatisfied with the lack of support and guidance for plastic collectors and recyclers. When asked about government support and guidance for plastic collectors and recyclers, 83% of the respondents were also dissatisfied with the government’s involvement. This is likely due to several factors, including the lack of training programs for plastic collectors and recyclers, financial assistance for plastic collectors and recyclers, and the lack of recognition of plastic collectors and recyclers. There are several reasons for the lack of support and guidance for plastic collectors and recyclers. One reason is that there is no government mandate for businesses to recycle plastic waste, which means businesses are not required to provide support or guidance to their employees who collect and recycle plastic waste. Another reason is that there is no government funding for programs that support plastic collectors and recyclers, which means that limited resources are available to help them do their jobs. Dissatisfaction with the lack of support and guidance for plastic collectors and recyclers is a severe problem. Businesses and individuals need to take steps to address these issues. Businesses can provide training and financial assistance to employees who collect and recycle plastic waste. Individuals can support plastic collectors and recyclers by donating to organizations that provide them with training and financial aid. Businesses and individuals can help to reduce the amount of plastic waste that ends up in landfills and the environment by taking these steps.
4.1. Correlation between Tourism and Plastic Waste Generation
The recyclers were asked to look at the data they had collected on plastic collection over the past 9 years, either in their databases or in old records, and to find the average amount of plastic collected each month. The study team obtained data on plastic collection and tourist arrivals for only 9 years. This was the most extensive period of data that was available.
Figure 5 shows a similar pattern of tourist arrivals to Sri Lanka in the past 9 years.
The hypothesis for this study was that there is a correlation between the quantity of plastic received at the recycling centres each month and the average number of tourists arriving each month in Sri Lanka over the considered period. To test this hypothesis, the study team collected data on the quantity of plastic received at the recycling centres monthly and the average number of tourists arriving each month in Sri Lanka over 9 years, from 2014 to 2022 (
Table 2). Statistical methods (SPSS software v23) were used to analyse the data and to determine whether there was a correlation between the two variables.
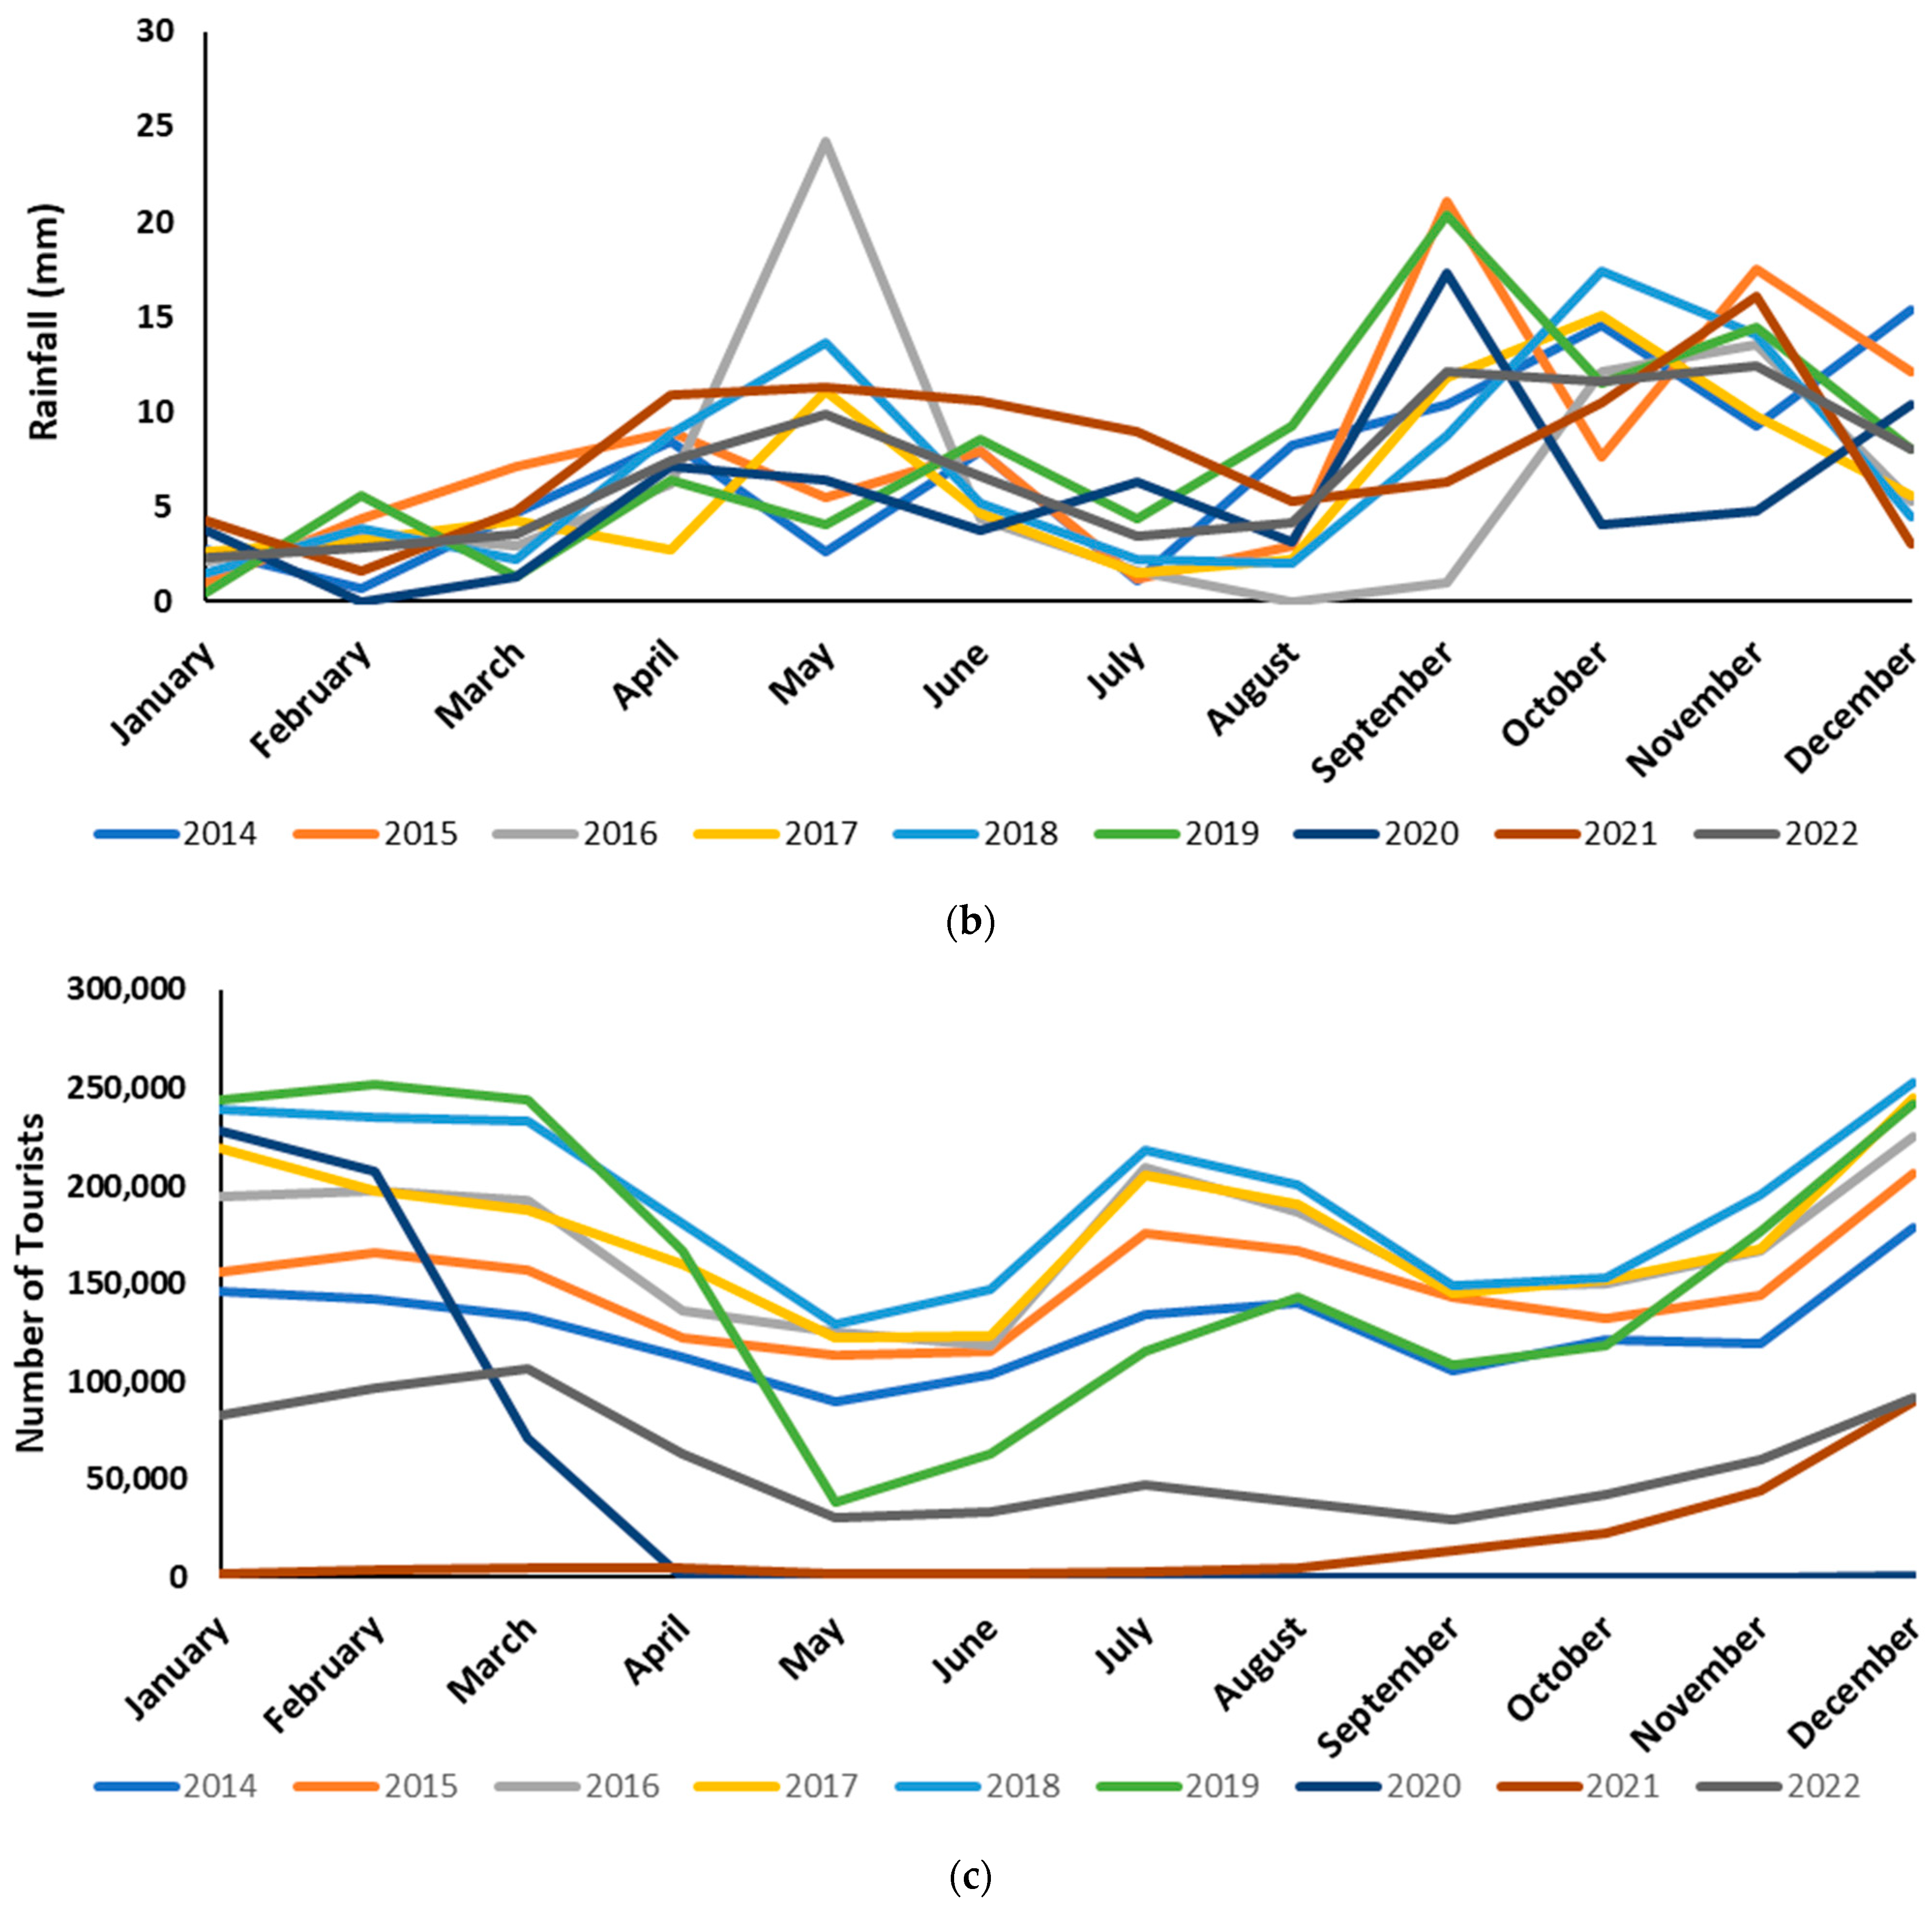
The analysis shows a positive correlation between the plastic waste received by the collection centres island-wide and the tourist arrivals each month during the past 9 years, as shown in
Figure 6a,c. This means there is a tendency for the quantity of the plastic waste that the collection centres receive to increase when the number of tourist arrivals increases. However, no significant correlation exists between 2019, 2020, and 2021. This could be caused by several factors, including the Easter Sunday bomb attacks in Sri Lanka on 21 April 2019, the COVID-19 pandemic, and the economic crisis in Sri Lanka. The Easter Sunday bomb attacks significantly impacted tourism in Sri Lanka. The attacks killed 269 people and injured 500 more, leading to a sharp decline in tourist arrivals. In the months following the attacks, tourist arrivals fell by 70%. The COVID-19 pandemic also had a significant impact on tourism in Sri Lanka. The pandemic led to a global travel ban, severely restricting tourist arrivals. In 2020, tourist arrivals to Sri Lanka fell by 93% (
Figure 6c).
4.2. Correlation between Precipitation and Plastic Waste Generation
The Monsoon winds largely influence the rainfall patterns in Sri Lanka in the Indian Ocean. The southwest monsoon season brings rain to the southwest parts of Sri Lanka from May to September, while the northeast monsoon season brings rain to the north and the eastern parts of Sri Lanka from December to February [
31]. A recent study investigated trends in annual and seasonal rainfall across Sri Lanka using an innovative trend analysis (ITA) [
32] and the Mann–Kendall (MK) test with Sen’s slope estimator. Sen’s slope estimator is a non-parametric method for estimating the slope of a trend line in a time series. It is a robust method, meaning that it is not sensitive to outliers in the data. The data is sorted from least to greatest to calculate Sen’s slope, and the median of the differences between consecutive observations is calculated. This process is repeated for all possible pairs of observations, and the median of all the slopes is then taken as the final estimate.
This study used data from 37 rainfall stations across Sri Lanka. The stations were selected to represent a range of climatic conditions across the country. The MK test showed increasing trends in annual rainfall at 24 stations (65%), with five stations showing a significant increasing trend. Annual precipitation at 13 locations (35%) showed a decreasing trend, but none were significant. Seasonal analysis of rainfall trends using the ITA method showed an increase of 81, 70, 32, and 65% in stations during the first inter-monsoon (FIM), second inter-monsoon (SIM), south-west monsoon (SWM), and north-east monsoon (NEM), respectively [
28]. In general, the eastern, south-eastern, north, and north-central regions of the country showed an increasing rainfall trend over the last 31 years (1987–2017) while western, part of the north-western and central part of the country indicated a decreasing rainfall trend during the same period (
Figure 6b).
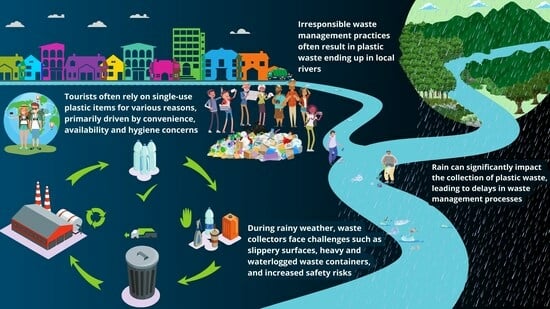
Based on the above, this study developed a hypothesis to identify whether rainfall patterns could affect the distribution of plastic waste in the environment. For example, heavy rainfall could wash plastic waste into rivers and other waterways, exacerbating the problem of plastic pollution. An analysis was carried out to understand whether there is any relationship between plastic collection in the recycling centre and the rainfall pattern in Sri Lanka.
Figure 7 highlights the rainfall pattern of the past 9 years. As per the figure, plastic recycling and collection have a trend with monthly precipitation levels. It is visible that the plastic collection increases in the months when the precipitation levels are lower and vice versa. This has been further analysed with a correlation matrix. According to the analysis, there is a negative correlation between the rainfall pattern and the plastic waste received by the collection centres island-wide in each month of the past 9 years (
Table 3).
The findings from this study provide strong support for the hypothesis that rainfall patterns can significantly affect the distribution of plastic waste in the environment. The analysis revealed a clear trend between plastic collection and monthly precipitation levels in Sri Lanka over the past 9 years. Specifically, it was observed that plastic collection increases during months with lower precipitation levels and decreases during months with higher precipitation levels.
The negative correlation between the rainfall pattern and the plastic waste received by the collection centres each month further solidifies the relationship between heavy rainfall and reduced plastic waste collection. This suggests that heavy rain is washing plastic waste away from collection centres and into rivers and other waterways, exacerbating the problem of plastic pollution in the environment. The implications of this finding are significant for plastic waste management strategies in Sri Lanka. It underscores the importance of accounting for weather patterns, particularly rainfall when designing and implementing waste collection systems. To effectively address the issue of plastic pollution, measures should be taken to improve waste collection and management during periods of heavy rainfall, when plastic waste is more likely to be washed away.
Furthermore, the results of this study could have broader implications beyond Sri Lanka, as regions with similar rainfall patterns might also experience comparable challenges with plastic waste distribution. By recognizing the impact of rainfall on plastic waste management, policymakers and environmental organizations worldwide can develop more targeted and practical strategies to combat plastic pollution and protect natural ecosystems.
5. Conclusions
The significant key finding of this study is the dominance of certain plastic waste types, such as HDPE, PVC, LDPE, and PP. This information can guide targeted efforts toward the recycling and proper disposal of these specific plastic types. This study also reveals that PS and PET are less commonly recycled, indicating the need for improved recycling infrastructure and processes for these materials. By identifying the most received and recycled plastic waste types, this study offers a foundation for developing targeted recycling initiatives and improving waste management practices.
The correlation analysis of this study reveals a significant relationship between plastic waste generation, tourism, and precipitation. The positive correlation between plastic waste generation and tourist arrivals suggests that higher tourism activities lead to increased plastic consumption and plastic waste accumulation. This emphasizes the importance of implementing sustainable practices in the tourism sector, such as promoting plastic-free alternatives, encouraging responsible tourism, and improving waste management infrastructure in tourist hotspots.
The negative correlation between plastic waste generation and precipitation levels indicates that higher rainfall reduces the amount of plastic waste collected by recycling centres. This correlation may be attributed to the increased likelihood of heavy rainfall washing away plastic waste, reducing collection rates. This highlights the need for comprehensive waste management strategies that consider seasonal variations in plastic waste generation and the impact of weather patterns on waste distribution.
Although overall findings indicate the importance of addressing plastic pollution in the country, this is becoming increasingly challenging. Limited resources, price fluctuations of virgin plastic materials, and technical constraints surrounding processing machines are some factors that hinder the growth of the recycling industry [
33]. These challenges highlight the importance of investment in recycling infrastructure, research, and development of innovative recycling technologies, and fostering collaboration between stakeholders to overcome these obstacles.
Based on this study’s findings, several recommendations can be made to improve plastic waste management in Sri Lanka. First, there is a need for increased government support and involvement in plastic waste management initiatives. For example, local authorities (LAs) are crucial in implementing waste management regulations and providing the legal framework for waste disposal. The findings suggest room for improvement in government involvement and support for plastic waste management initiatives. Addressing the concerns of the stakeholders involved in plastic waste collection and recycling, as well as aid and guidance from the government, can contribute to more efficient waste management practices. This can be achieved through policy reforms, financial incentives, and establishing regulatory frameworks that promote sustainable waste management practices. Second, efforts should be made to enhance public awareness and education on plastic waste management. Public campaigns, school programs, and community engagement initiatives can help promote responsible plastic use, source segregation, and recycling practices. Empowering individuals and communities to act against plastic pollution can create a cleaner and healthier environment. Third, this study highlights the potential of the tourism sector in driving plastic waste generation. Sustainable tourism practices should be encouraged, including using eco-friendly alternatives to single-use plastics, promoting recycling facilities in tourist areas, and raising awareness among tourists about the importance of responsible waste disposal. Fourth, establishing material recovery facilities (MRFs) for sorting mixed plastic waste and its subsequent recycling, as exemplified by successful practices in the European context, can significantly enhance recycling rates. Implementing efficient sorting mechanisms for mixed plastic waste followed by comprehensive recycling processes can substantially improve recycling rates. These facilities would play a pivotal role in efficiently segregating and processing plastic waste, thus contributing to the circular economy and mitigating the environmental impact of plastic pollution. By adopting such an advanced waste management infrastructure, Sri Lanka can effectively address the challenges related to plastic waste, align with international best practices, and foster a sustainable approach to waste management. This initiative should be accompanied by the necessary support from government bodies, ensuring the seamless integration of these facilities into the overall waste management strategy outlined in this study. Lastly, further research and monitoring are recommended to understand the factors influencing plastic waste generation and collection in Sri Lanka. Long-term data collection, analysis of waste management practices in different regions, and evaluation of the effectiveness of interventions can provide valuable insights for policymaking and the development of targeted waste management strategies.
In conclusion, this study provides valuable information on plastic waste management practices in Sri Lanka, highlighting the challenges and opportunities for improving waste management in the country. The findings emphasize the need for collaborative efforts between government, stakeholders, and the public to address plastic pollution effectively. Sri Lanka can move towards a cleaner and more sustainable future by implementing sustainable waste management practices, raising awareness, and investing in recycling infrastructure. However, a recent article by Samarasinghe (2021) states that Sri Lanka recycles only 3% of the plastic products it consumes [
34], which is less than half the world average of 7.2%. This is a concerning statistic highlighting the need for more effective plastic waste management in Sri Lanka. In comparison, the United States recycles only 5–6% of the 40 million tons of plastic waste generated in the country in 2021 [
35]. Conversely, Germany is the most efficient country in terms of recycling [
36], with a recycling rate of 67.1%. South Korea, Singapore, and Hong Kong are other leading countries in recycling, with recycling rates of 49%, 47%, and 45%, respectively [
37].
This global comparison underscores the urgency for Sri Lanka to enhance its recycling efforts. Learning from the successful recycling models of countries like Germany and adopting best practices from leading nations could serve as a benchmark for improvement. By leveraging international experiences, Sri Lanka can develop tailored strategies to boost its recycling rates and move closer to global standards. This study’s recommendations, including increased government support, public awareness campaigns, and the establishment of material recovery facilities, align with the proven approaches adopted by high-performing countries. Through concerted efforts and international collaboration, Sri Lanka has the potential not only to address its plastic waste management challenges but also to emerge as a leader in sustainable waste practices on the global stage.


 ,
, 


