Article

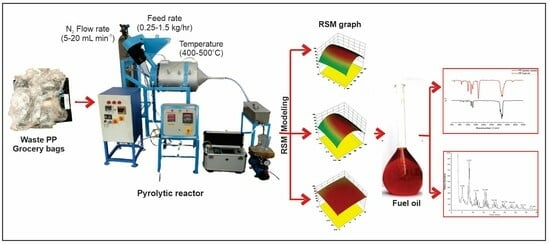
Optimization of Pyrolysis Process Parameters for Fuel Oil Production from the Thermal Recycling of Waste Polypropylene Grocery Bags Using the Box–Behnken Design

by
Balasubramaniam Prabha
1,
Desikan Ramesh
1,*,
Srinivasan Sriramajayam
1 and
Doraiswamy Uma
2
1
Department of Renewable Energy Engineering, Agricultural Engineering College and Research Institute, Tamil Nadu Agricultural University, Coimbatore 641003, India
2
Department of Biochemistry, Centre for Plant Molecular Biology and Biotechnology, Tamil Nadu Agricultural University, Coimbatore 641003, India
*
Author to whom correspondence should be addressed.
Recycling 2024, 9(1), 15; https://doi.org/10.3390/recycling9010015
Submission received: 16 September 2023 / Revised: 6 November 2023 / Accepted: 11 November 2023 / Published: 6 February 2024
(This article belongs to the Special Issue Feature Papers in Recycling 2023)

Abstract

:
The impact of dumping plastic waste is realized in different ecosystems of the planet. Several methods have been adopted to dispose of these wastes for energy recovery. This study, for the first time, proposed the Box–Behnken design technique to optimize the pyrolysis process parameters for fuel oil production from waste polypropylene (PP) grocery bags using a semibatch-type pyrolytic reactor. The semibatch-type pyrolytic reactor was developed and employed to produce fuel oil from waste PP grocery bags. The effect of different process parameters on fuel oil production was comprehensively analyzed using the response surface methodology (RSM) with the conjunction of the Box–Behnken design (BBD). The BBD facilitates the prediction of the response variables with respect to changes in the input variables by developing a response model. The BBD was used to optimize the process parameters, such as the reaction temperature (400–550 °C), nitrogen flow rate (5–20 mL min−1), and substrate feed rate (0.25–1.5 kg h−1), and their effect on the responses were observed. The optimum response yields of the fuel oil (89.34 %), solid residue (2.74%), and gas yield (7.92%) were obtained with an optimized temperature (481 °C), a nitrogen flow rate (13 mL min−1), and a feed rate (0.61 kg h−1). The quadratic model obtained for the fuel oil response denotes the greater R2 value (0.99). The specific gravity and calorific value of the fuel oil were found to be 0.787 and 45.42 MJ kg−1, respectively. The fuel oil had higher research octane number (RON) (100.0 min) and motor octane number (MON) (85.1 min) values. These characteristics of the fuel oil were matched with conventional petroleum fuels. Further, Fourier transform infrared spectroscopy (FT-IR) and gas chromatography–mass spectroscopy (GC-MS) were used to analyze the fuel oil, and the results revealed that the fuel oil was enriched with different hydrocarbons, namely, alkane (paraffins) and alkene (olefins), in the carbon range of C4–C20. These results, and also the fractional distillation of the fuel oil, show the presence of petroleum-range hydrocarbons in the waste PP fuel oil.

Graphical Abstract

1. Introduction

Consistent advancement in terms of agricultural reformation, urbanization, industrialization, and transportation networks results in an increased dependency on conventional fuels. Due to the higher utilization of fossil fuels, petroleum reserves are rapidly diminishing, resulting in excessive environmental degradation [1]. As a result, the current scenario encourages the use of alternative fuel resources, which can significantly reduce fuel shortages and be counted on for fuel security, future productivity, and environmental pollution [2]. On the other hand, plastics have been extensively used in various anthropogenic activities, possibly due to their light weight, durability, flexibility, corrosion resistance, and low cost. This consumption leads to a higher consumption of polymers. However, most polymers are single-use and thrown into the environment as waste. The annual consumption of single-use plastics per person in India, China, France, the United Kingdom, the United States, and Australia is around 4, 18, 36, 44, 53, and 59 kg, respectively [3]. This will increase plastic waste nearly twofold by 2030 [4]. In addition, the global plastic production rate also reached around 359 million metric tons in 2018 [5]. According to CPCB data in India, 3.3 million metric tons of various waste plastics was generated from 2018 to 2019 [6]. The land degradation of waste plastics is difficult in natural environmental conditions, so improper disposal leads to severe environmental issues [7]. Disposing of plastics in landfills can be a viable solution; however, it would waste precious land resources. Moreover, it also poses a significant risk to the natural ecosystem and its various biological species.
Unfortunately, statistics demonstrate that only 9% of plastic waste is recycled, and 12% is burnt. The remaining 79% is sent to land and marine ecosystems [7]. Therefore, it has become absolutely important to dispose of and appropriately recycle waste plastics. Between 1990 and 2014, the plastic recycling rate rose by 7%, and if the current growth trend continues, it will reach 44% by 2050. This significant milestone must be taken seriously, as it could positively impact future generations [7]. Therefore, researchers have extensively researched the use of recycled waste plastics to mitigate the alarming plastic waste generation. Generally, most waste plastics are disposed of through landfills, and a fraction of them may be used for plastic recycling, which can be used for the production of new products/components. Primarily, plastic wastes are dumped in landfills without considering the other valuable recycling process [8,9]. Depositing these wastes into landfilling reflects major environmental issues, which cause health hazards, ground and seawater contamination, and increased greenhouse gas emissions [10,11].
Meanwhile, people can recycle plastics through four processes, such as primary (re-extrusion), secondary (reprocessing/mechanical recycling), tertiary (feedstock or chemical recycling), and quaternary recycling (energy recovery) [12]. These approaches are becoming more popular, as they help us reduce our carbon footprint and reuse valuable resources. Primary recycling is known as a preconsumer plastic waste management technique (e.g., fall-out products/components, trimmings, cuttings); it is only used for this purpose due to the necessity of high-level homogeneity. The remaining recycling methods are usually employed for the management of postconsumer plastic wastes [13]. The most popular method for recycling used plastics is mechanical recycling. It can turn discarded polymers directly into products without significantly sacrificing their qualities through screening, impurity removal, crushing, and melting regeneration [14,15,16]. Furthermore, plastic wastes can be effectively utilized in many other applications, such as concrete, tiles, paver blocks, perfumes, sanitizers, graphene, carbon nanotubes, electrode materials, etc. [17].
Whereas, in chemical recycling, plastic wastes can be used as the raw material for the production of petrochemical fuels [18], in quaternary recycling, plastic waste can be recycled through the incineration process. Incineration is one of the standard methods for discarding waste material [19,20]. Obviously, burning as a waste-disposal strategy can lead to the release of hazardous elements, like dioxins and nitrogen oxides, which can then contaminate the environment [21,22,23]. However, the rate of plastic waste recycled through mechanical recycling is assumed to be around 14 to 18% [24]. The rest of the wastes are managed by being disposed of (58–62%) or energy recovery (24%) [25].
Promoting mechanical and chemical recycling is a better solution to avoid dumping plastic waste in landfills [26]. When compared to mechanical recycling, chemical recycling via pyrolysis has the advantage of recovering energy and materials from all types of plastic wastes (mostly thermosets or thermoplastic) without selection and separation [27]; also, it is an efficient process to reduce the toxic components. In addition, the cost associated with the preprocessing of plastic wastes in mechanical recycling was negligible in pyrolysis [28]. Pyrolysis is a thermochemical process used to convert long-chain hydrocarbons into smaller monomers in the absence of oxygen [29] at 300–900 °C [30], and produces solid (char), liquid (fuel oils), and gaseous (syngas) fuels [27,31]. In the case of pyrolysis technology, the liquid fuel yields are around 45–50%, while gas and char yields are 35–40 and 10–20%, respectively [32]. These yields may vary with their composition, and pyrolytic reaction conditions use inert gas and the presence or absence of a catalyst [33]. Today, pyrolysis is highly focused on recovering energy, because the fuel oil derived from plastic waste pyrolysis is considered a viable fuel source [34].
Recent research has sought to find a more effective way to recycle plastic waste. Many plastic materials found in municipal plastic waste, such as high-density polyethylene (HDPE), low-density polyethylene (LDPE), polystyrene (PS), polyvinyl chloride (PVC), and polypropylene (PP), can be used for energy-recovery processes. By turning waste plastics into fuel oil and chemical raw materials, we can effectively tackle two of the most pressing issues we face today—white pollution and potential carbon source shortage. It is a great way to manage our resources in an ecofriendly manner. Many researchers have investigated the pyrolysis characteristics of various plastic solid wastes for safe disposal and also for energy recovery [29,35,36,37], and only a few authors have performed a specific study on PP pyrolysis. Ahmad et al. [38] studied the pyrolysis of PP at a varied temperature range from 250 to 400 °C. A total of 98.66% conversion was achieved at 300 °C. The percentage yields of liquid, solid, and gas were 69.82, 1.34, and 28.84, respectively. Fakhr et al. [39] reported a higher fuel oil yield of 82.12 wt.% achieved at 500 °C from PP wastes via the pyrolysis process. Uthpalani et al. [40] obtained yields around 79.57 ± 1.66 wt.% of fuel oil, 14.64 ± 0.36 wt.% of char, and 5.79 ± 0.84 wt.% of gas at 330 °C from PP waste using a lab-scale batch reactor. Thahir et al. [41] reported a fuel oil yield of 88 wt.%, 7 wt.% of char, and 5 wt.% of gas obtained at 580 °C from PP wastes using a fixed bed pyrolytic reactor under vacuum conditions. Martynis et al. [42] studied the pyrolysis of PP plastic waste at different reaction-temperature ranges (250–400 °C) and stated that the maximum recovery of fuel oil (88.86%) and char (5.2%) was produced at 400 and 250 °C, respectively.
From the studies mentioned above, and the literature studies, it can be deduced that the majority of earlier studies only examined the typical operating parametric impacts of pyrolytic reactors on pyrolysis performance. However, finding the ideal range of operating parameters for pyrolysis is better for generating its highest efficiency and best outcome. To counter this issue, the RSM combines mathematical and statistical techniques [43,44]. It also incorporates experimental design, mathematical statistics, and parameter optimization. This study employed the Box–Behnken design (BBD) model of the RSM. The BBD is one of the most popular designs of the RSM, since it is a very efficient and economical mathematical modeling tool for the optimization of process parameters [45] compared to other designs [46]. This technique could save time and cost, as it requires fewer experiments [47]. The main aim of using the BBD is to find out the input variables for optimizing the output response and to develop the mathematical models [48]. The BBD technique has been employed for the optimization of the catalytic upgrading of oxygenated pyrolysis vapor into C6–C8 hydrocarbons [49], groundnut shell biochar [50], biochar from date-stone pyrolysis [51], pellet production from corn stalk rinds [52], carbon nanotube production from mixed plastic waste [53], biochar yields [54], and waste motor oil pyrolysis [55].
To the best of our knowledge, there is no research related to the BBD statistical approach for the optimization of fuel oil yield from the pyrolysis of single-use waste polypropylene grocery bags. Therefore, the main objective of the study was to optimize the ideal process parameters, such as the pyrolysis reaction temperature, nitrogen flow rate, and substrate feed rate, for higher fuel oil recovery using the BBD technique. Also, a new lab-scale semibatch pyrolytic reactor was developed exclusively for fuel oil production from these plastic wastes. Furthermore, the fuel oil content was determined using Fourier transform infrared spectroscopy (FT-IR) and gas chromatography–mass spectrometry (GC-MS) analyses. In addition, the fractional distillation of fuel oil was performed, and findings are briefly discussed.

2. Results and Discussion

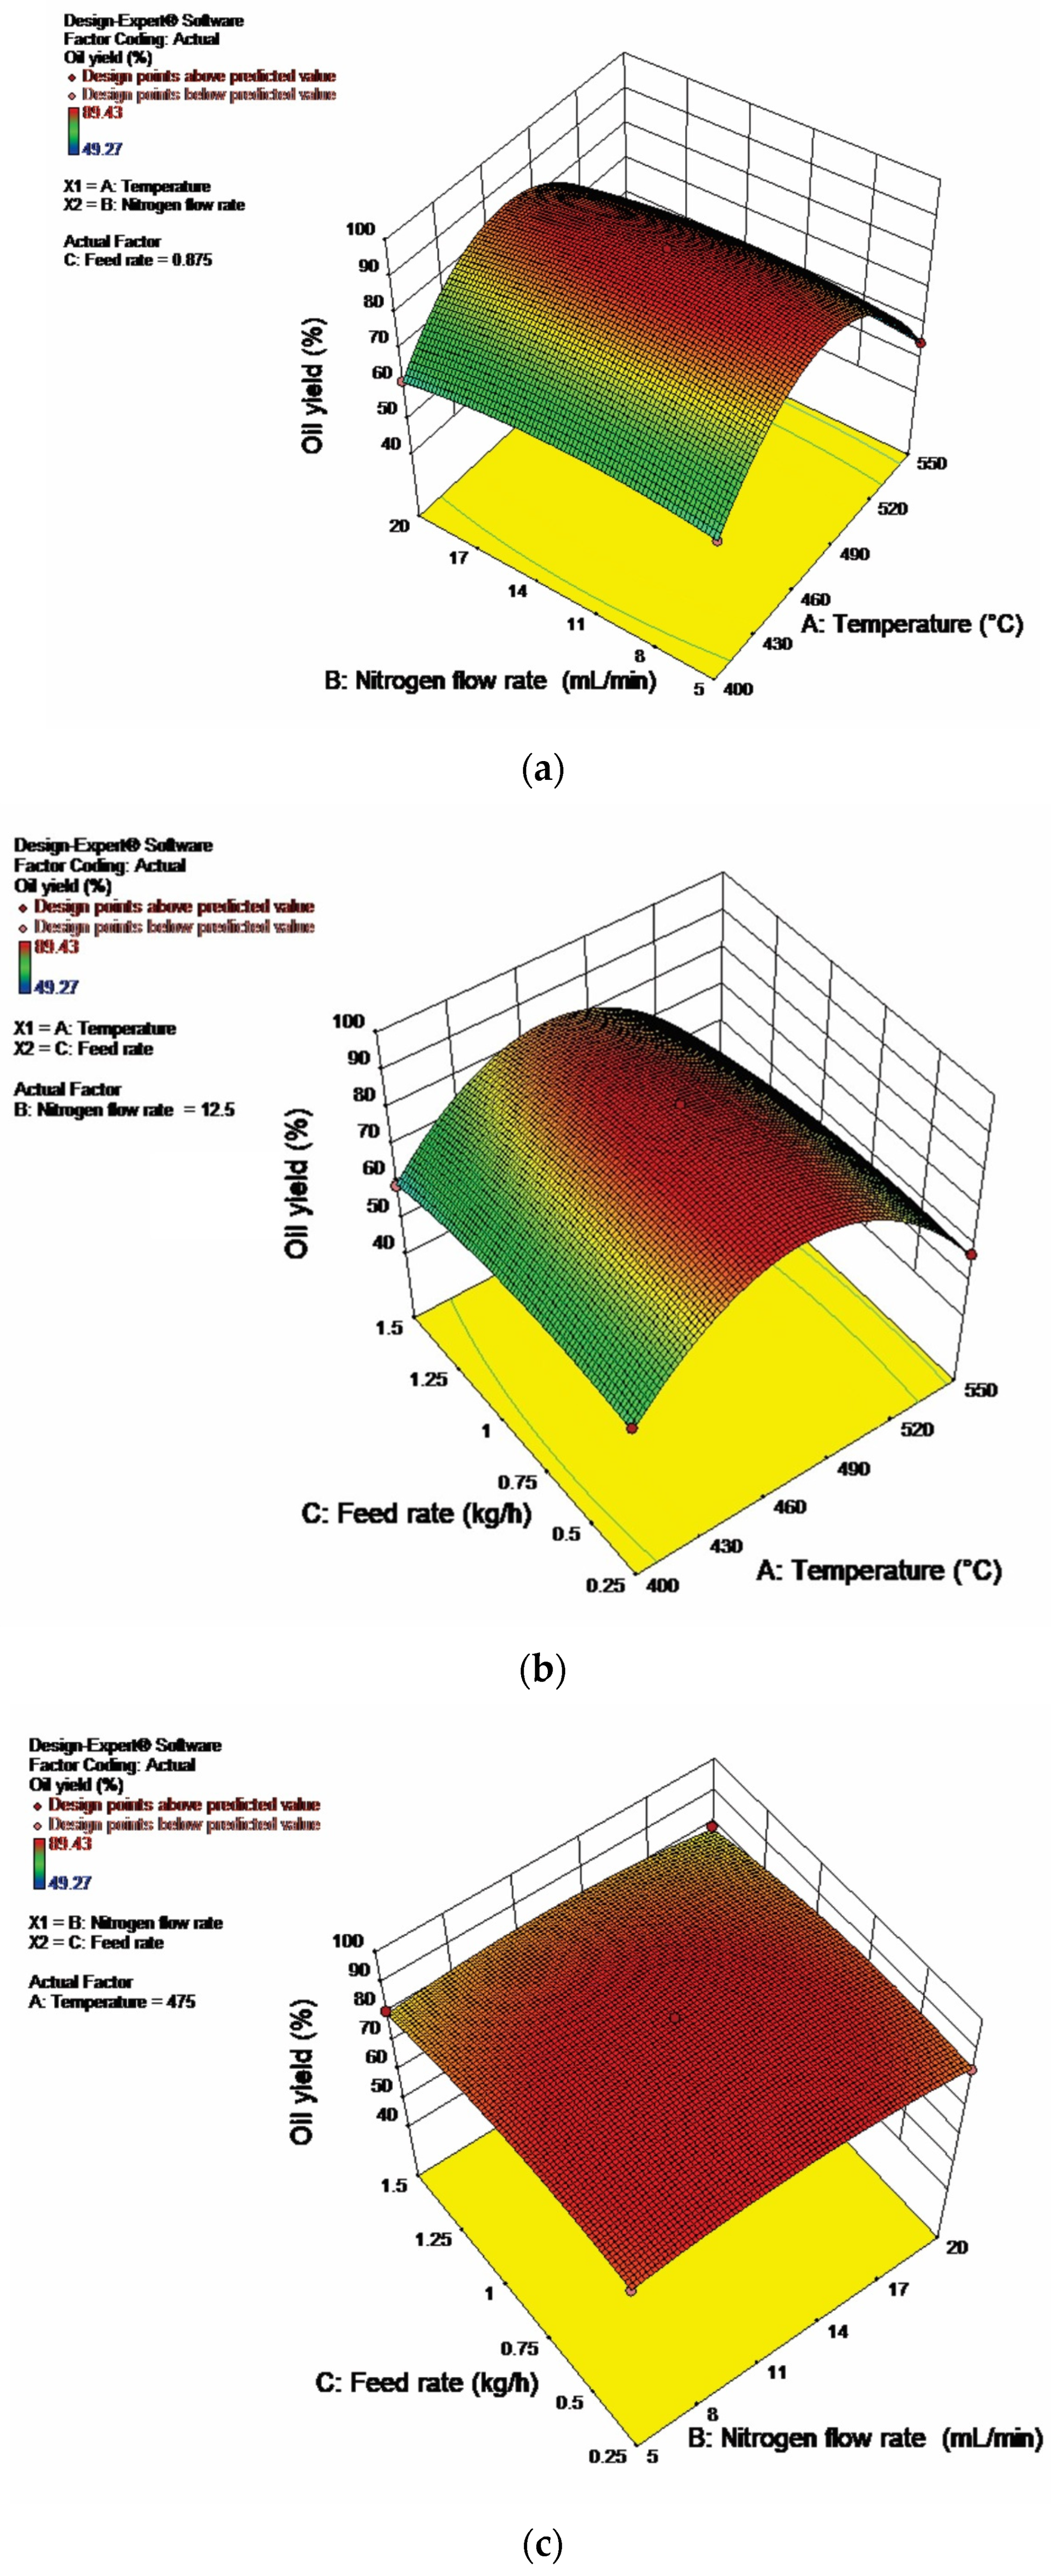
2.1. Process Optimization Using the RSM

In process optimization, the three best process parameters for fuel oil synthesis from PP wastes (temperature (A), nitrogen flow rate (B), and feed rate (C)) have been evaluated for three responses, such as maximum oil yield (%), solid residue yield (%), and gas yield (%), which were statistically optimized using a BBD-based 33-factor design in the RSM approach. All the experimental runs were conducted in the lab-scale pyrolytic reactor for fuel oil synthesis. The variable effects and their mutual interactions in the process can be assessed by statistical analysis [56]. The optimal conditions (best response) can be calculated by the saddle point of its X and Y coordinates [57]. The experiments include 17 runs with high (+1), center (0), and low (−1) values of each variable. The complete BBD matrix with actual and predicted values is presented in Table 1. The results suggested by the software, that the optimum response of fuel oil yield of 89.34 percent, solid residue of 2.74 percent, and gas yield of 7.92 percent, was achieved under the best pyrolysis-process conditions (481 °C, a nitrogen flow rate of 13.21 mL min−1, and a feed rate of 0.61 kg h−1 for wastes).
The quadratic model obtained for the percentage of the oil yield response was reliable, with better predicted (0.98) and adjusted R-squared (R2 = 0.99) values, indicating a reasonable agreement between the experimental and predicted values. Generally, a higher R2 value for the equation mostly represents higher accuracy for estimating the output response [58]. Furthermore, adequate precision indicates the errors associated with the predicted response values, which may be ˃4 for the desired model. The significance of the developed model can arrive from the p- and F-values. In other words, smaller p- and larger F-values are noted for the statistically highly significant model developed based on the data. Based on the p-values (p < 0.05), it appears that the linear terms (A and C) and quadratic terms (A2, B2, and C2) have a statistically significant impact, with a 95% confidence level (Table 2). In this case, the p-values for the temperature, nitrogen flow rate, and feed rate were <0.0001, 0.0112, and <0.0001, whereas the F-values were 299.24, 11.68, and 137.01. The CV value of the oil yield is 0.94 percent, which indicates the model has excellent experimental reliability.
Furthermore, the lower CV value indicates the good reliability and accuracy of the data for the regression model as suggested by the RSM approach. In this case, the acceptable precision of the oil yield reaction was a ratio of 75.33, which indicates a suitable signal. Figure 1a–c showcases the 3D response surface plots. These optimization charts are advantageous, since they can help predict responses with a higher desirability score [59]. Additionally, they come with an empirical equation for quadratic model fitting.
F u e l   o i l   y i e l d   ( % ) = 1025.88 + 4.684533 × A + 1.5744 × B + 20.06773 × C 0.00021 × A B 0.0176 × A C + 0.011733 × B C 0.00497 × A 2 0.06373 × B 2 9.3568 × C 2
The response of the oil yield concerning the temperature, nitrogen flow rate, and feed rate, respectively, is described for the tested plastic wastes. The influence of the selected variables on the fuel oil yield was evident. The temperature is the most influential parameter, significantly influencing the polymer chain’s thermal cracking reactions. For instance, higher temperature results in the speedy cracking of chemical bonds. Thus, the results enhanced the reaction rate and lessened the reaction time in the pyrolysis. Under low temperatures, secondary cracking of the pyrolysis reactions occurred and helped release more noncondensable pyrolytic gases. If the reaction temperature increased (400 °C to 475 °C), the oil yield response increased gradually. Then, the fuel oil yield decreased to a certain point and remained stable after the temperature reached 475 °C.
In contrast, the solid yield response decreased gradually, rising from 400 °C to 550 °C. Furthermore, the gas yield response was increased from 400 °C to 550 °C. Sharuddin et al. [29] reported that a temperature up to 500 °C promotes a higher yield of liquid products, and more than 500 °C helps in higher gaseous production in pyrolysis for all types of plastics.
In plastic pyrolysis, nitrogen (N2) is one of the most common inert gases utilized in much of the research, because it is safer than other types of inert gas. In addition to the type, the flow rate of inert gas also influences the product distribution [60]. According to [61], a higher inert gas flow rate may increase the evaporation of oil products in a condenser. This leads to an effect on the fuel oil yield. In this study, the variables fixed for the nitrogen flow rate were 5, 12.5, and 20 mL min−1, and the inert gas supply had shown its influence on the product yield. For example, the nitrogen flow rate was increased (5–12.5 mL min−1), and the oil yield was increased; after that, the oil yield decreased above the 12.5 mL min−1 flow rate. The solid residue yields gradually decreased if the nitrogen flow rate increased from 5 to 20 mL min−1. The gas yield response was increased for the case of the nitrogen flow rate raised from 5 to 12.5 mL min−1, and then gradually decreased for the case from 12.5 to 20 mL min−1.
The feed rate is one of the critical process parameters considered in the semibatch pyrolysis reactor. The variables selected for the feed rate for the study were 0.25, 0.875, and 1.25 kg h−1. If the feed rate was increased from 0.25 to 0.875 kg h−1, the oil yield increased; after the flow rate of 0.875 kg h−1, the oil yield decreased gradually and remained constant. For the feed rate increased from 0.25 to 0.875 kg h−1, the solid residue yields gradually decreased. The gas yield response followed an increasing trend with an increase in the feed rate from 0.25 to 0.875 kg h−1, and then gradually decreased above the feed rate from 0.875 to 1.25 kg h−1.
In this case, the variables, like temperature, nitrogen supply, and feed rate, increased, and the oil yield response gradually increased and then decreased. As the variable range increased, the gas yield response increased, and the solid response decreased gradually.
The interactions between AB, BC, and CA were found to be insignificant. The fuel oil as the output response to the reaction temperature and the nitrogen flow rate was represented in the 3D response surface plots. In the case of temperature, heating was increased at a particular nitrogen flow rate and showed an enhanced fuel oil yield. However, when the temperature increased beyond 520 °C, it harmed the fuel oil yield, i.e., the oil yield started to decline. In contrast, the nitrogen flow rate increased at any temperature and showed almost nil improvement in the oil yield.

2.2. Properties of the Fuel Oil

The carbon and hydrogen content in the fuel oil (85.36 and 14.60 percent) was slightly higher than the waste PP grocery bags (84.6 and 14.4 percent), which indicates a higher potential for fuel oil to be a fuel. Low-nitrogen content (0.14%) and no sulfur were found in the fuel oil, since the waste PP grocery bags had lower nitrogen and sulfur contents (<0.30%). Also, the waste PP grocery bags had higher volatile (98.73%) and lower ash contents 1.08%). This could encourage the fuel oil from plastic wastes [62]. This property favored that the products are not responsible for higher SOx and NOx emissions, both undesirable in the combustion process. The calorific value was significantly increased by converting the waste PP grocery bags (40.95 MJ kg−1) into fuel oil (45.42 MJ kg−1). Interestingly, the specific gravity of the fuel oil decreases with an increase in the operating temperature, similar to vegetable oils. Fuel oil’s specific gravity and kinematic viscosity were 0.787 and 2.27 cSt., respectively. Similar results were reported by [63,64]. The flashpoint of the fuel oil was found at 31 °C.
Furthermore, the fuel oil had a lower ash content (0.001%) due to no metal contaminations in the fuel oil. The carbon residue of the tested fuel oil was 0.3 percent. The waste PP fuel oil had higher research octane number (RON) (100.0 min) and motor octane number (MON) (85.1 min) values. The authors of [25] represented the highest RON and MON present in the PP fuel oil at 97.8 and 87.6 min, and also reported that conventional gasoline had an RON and MON in the range from 91 to 95 and 81 to 85, respectively, which are on par with the results of the present study. Generally, the RON and MON of the fuels can indicate their antiknock quality. The fuel with higher octane numbers represented better antiknock properties, and vice versa.
Moreover, a poor knocking property indicates explosive noises and results in the deteriorated performance of the engine [65]. Therefore, the antiknock quality of the fuel was crucial to avoid engine damage. The RON and MON of the fuel oil were found at 100 and 85.1 min., respectively, which indicated that fuel oil had a good antiknock quality and could be used as fuel.

2.2.1. FT-IR Analysis

The results of the FT-IR analysis of the plastic wastes and fuel oil produced at different temperatures (400, 475, and 550 °C) are presented in Table 3. For the waste PP grocery bags, alcohol and phenols were detected by O-H stretching and H-bonded vibrations at a wavenumber of 3394.1 cm−1 (Figure 2). The presence of carboxylic acids was detected at 3188.72 cm−1 for O-H stretching vibrations. C-H and CC stretching vibrations indicated the presence of alkanes and alkynes at wavenumbers of 2952.48, 2915.84, 2873.42, and 2194.60 cm−1, respectively. Also, the C-H bending vibration indicated the appearance of alkanes at 1455.90 cm−1, and alkenes were determined at wavenumbers of 972.912 and 839.85 cm−1 with =C-H bending vibrations. Similar functional groups were observed in the PP fuel oil. Also, the presence of esters and saturated aliphatic were determined by a C=O stretching vibration at a wavenumber of 1741.41 cm−1. The C-N stretching vibration indicated the presence of aliphatic amines at wavenumbers of 1221.68 and 1158.04 cm−1. Higher wavenumbers were found in the spectrum’s initial phase and middle index in the FT-IR spectra, representing the small and bulky functional groups. At the same time, low wavenumbers represented double- and single-bond functional groups (alkanes, alkenes, alkynes, etc.). These results show that plastic waste and derived fuel oil had different hydrocarbons, mostly alkanes, alkenes, and alkynes, and were coincident with the results reported by [66]. The FT-IR data obtained in this study are in better agreement with some of the literature. The FT-IR spectra of the PP fuel oil obtained at 300 °C exhibited the major peak of aliphatic C-H stretching at the wavenumbers of 2960–2840 cm−1. The olefin C=C stretching was indicated at the peak of 1520–1540 cm−1 and C-H bending vibration (CH2) was shown at 1460–1350 cm−1 [38]. Meanwhile, [64] analyzed the functional group of PP oil obtained through kaolin clay at 400–550 °C. The peaks at 2956 and 2879 cm−1 related to the C-H stretching, and the peak at 1377 cm−1 indicated the bending of alkane. Additionally, the peaks at 1456 and 970 cm−1 were attributed to the C-H stretching and C-H bending of alkene. Similarly, [67] studied the functional group of PP oil produced at 410 °C using a florisil catalyst, and they found several distinct peaks. The symmetric and asymmetric stretching (CH3) was obtained at the wavenumbers of 2954 cm−1 and 2870 cm−1. The asymmetric stretching (CH2) and symmetrical bending (CH3) were shown by the peaks at 2914 cm−1, 1460, and 1377 cm−1, respectively. Also, the peak at 970 cm−1 was attributed to the C-H bending vibration of alkenes, and the peak at 887 cm−1 corresponded to the C-H bending.

2.2.2. GC-MS Analysis of Fuel Oil

GC-MS was used to quantify the individual compounds of the fuel oil derived from the PP waste plastic bags (Table 4). Around 30 compounds were found in the fuel oil. The highest area percentage was found in 1-Undecene and 7-methyl (C12H24—24.26%), followed by 1-Propene, 2-methyl- (C4H8—10.95%), Decane, 2,3,5,8-tetramethyl (C14H30—6.37%), 1-Octadecene (C18H36—5.82%), 1,6-Octadiene, 2,5 dimethyl- (E)-(C10H18—5.46%), Naphthalene (C10H8–4.24%), and 1-Hexadecanol, 3,7,11,15-tetramethyl-(C20H42O–3.28%). Many other compounds were found in fuel oil; most had lower areas (<3%), such as Pentane, 3,3-dimethyl-(C7H16), Cyclopropane (C3H6), 1-Propyn (C3H4), (E)-6-Dodecene (C12H24), 3-Undecene (C11H22), 2-Undecanethiol, 2-methyl-(C12H26), 9-Octadecene (C18H36), 7-Octadecyne, 2-methyl-(C19H36), 2-Methyl-octadecyne (C19H36), 1-Dodecanol, 2-hexyl-(C19H38O), Cyclopentane (C5H10), Cyclododecanemethanol (C12H24), Cyclotetracosane (C24H48), Oxirane, tetradecyl- (C16H32O), 2,6,10,14-Tetramethyl-7-pentadecane (C25H52), 1-Eicosene (C20H40), 1-Dodecanol, 2-octyl-(C20H42O), Dodecane (C12H26), 1-Heptacosanol (C27H56O), 11-Dodecen-1-ol, 2,4,6-trimethyl-(C15H30O), 11-Dodecen-1-ol difluoroacetate (C12H24O), 11,13-Dimethyl-12-tetradecen-1-ol acetate (C18H34O2), and 9-Hexacosene (C26H52). Results indicated that the fuel oil produced from the waste PP grocery bags was enriched with hydrocarbons in the range of C3–C27, and more than 50 percent of the hydrocarbons were produced in the carbon range of C4–C12, followed by C14–C20, which represents that the fuel oil contained major amounts of olefins and kinds of paraffin, and it was comparable with petroleum hydrocarbons. These results were matched with some of the literature. The analysis of liquid fuel synthesis from mixed plastic wastes (PP, LDPE, and PS) showed that most of the fuel compounds emerged in the range of C3–C27 [66]. Similarly, the liquid fuel produced from the thermal pyrolysis of PP waste consisted of C4–C35 carbon-range hydrocarbons [68]. The noncatalytic pyrolysis of PP yielded a liquid fuel that comprised C7–C30 hydrocarbons, and the maximum peak was obtained in C9 [69]. The liquid fuel is obtained from thermal and catalytic (zeolite) pyrolysis of PP waste, which includes petroleum hydrocarbons (C4–C20) and some high-molecular-weight hydrocarbons (C20–C30) [70].

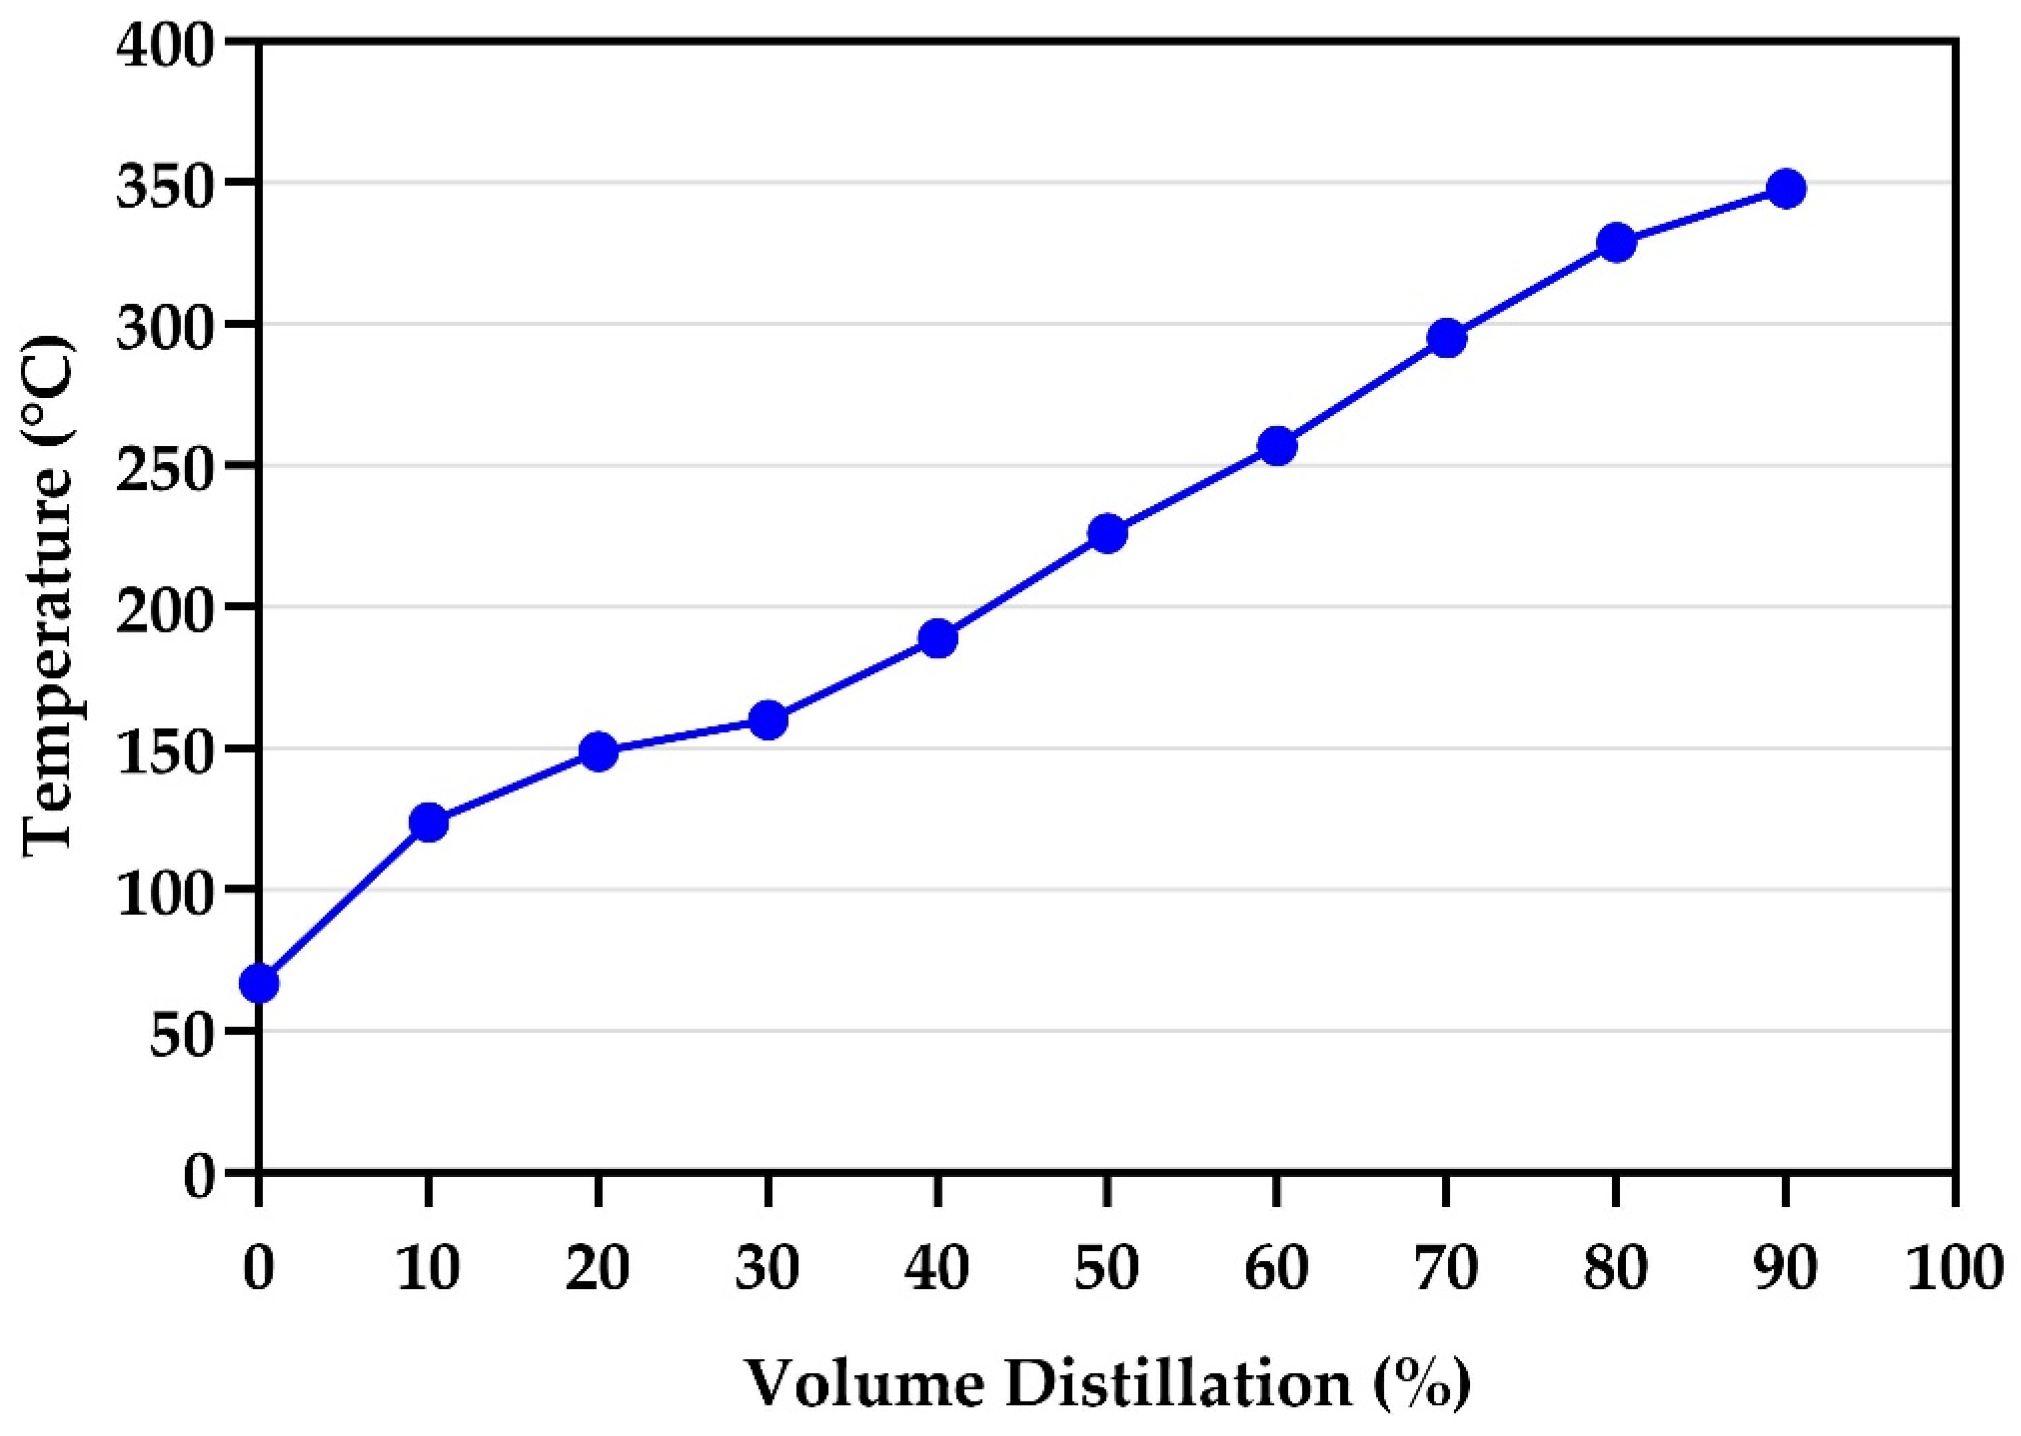
2.3. Fractional Distillation of the Waste PP Fuel Oil

The waste plastic fuel oil comprises a mixture of various hydrocarbons with different carbon ranges. For the fuel application, it is necessary to fractionate the hydrocarbons through distillation. The distillation curve provides information about the distillation of crude oil. Hence, the distribution of the boiling point is representative of the chemical composition of the petroleum crude fraction. Therefore, the ASTM distillation (D86) test was carried out for the fractional distillation of the PP fuel oil. The percentage of volume fractions of different compositions in the PP fuel oil with respect to its boiling temperature range (67–348 °C) is presented in Figure 3. The boiling temperature of the PP fuel oil represents the presence of gasoline, kerosene, and diesel in the fuel oil. The results were coincident with the results reported by [40], which stated that the boiling point of waste PP oil varied from 63–350 °C. Whereas, [41] studied the pyrolysis of PP waste for liquid fuel production with a refinery distillation bubble-plate column and observed the presence of kerosene in tray I, and gasoline in trays II and III. The liquid fuel produced from the waste PP using kaolin and acid-treated kaolin had a boiling temperature range of 68–346 °C and 42–312 °C, respectively [71].

3. Materials and Methods

3.1. Sample Preparation and Characterization

The waste polypropylene grocery bags were collected from different locations in the Coimbatore region of Tamil Nadu, India. The separation and water-washing steps were followed for these wastes to remove the inert materials (sand, paper, and other plastics). Further, wastes were sun-dried for moisture removal. Then, they were cut into smaller square pieces (1 × 1 cm) for the experiments. The important properties, such as the moisture content (ASTM D3173) and proximate composition (ASTM D 3172-89, D 3174-89, and D 3175-89), density (ASTM D 2015-77), and calorific value (ASTM D 2015-77) were adopted to characterize the waste PP grocery bags. Elemental compositions were estimated using a Thermo Scientific (FLASH 2000) elemental analyzer (M/s; Thermo Fisher Scientific, Waltham, MA, USA) coupled with an autosampler (AS-200) and data processor (DP 200-PRC) following the procedure of ASTM D 3176.

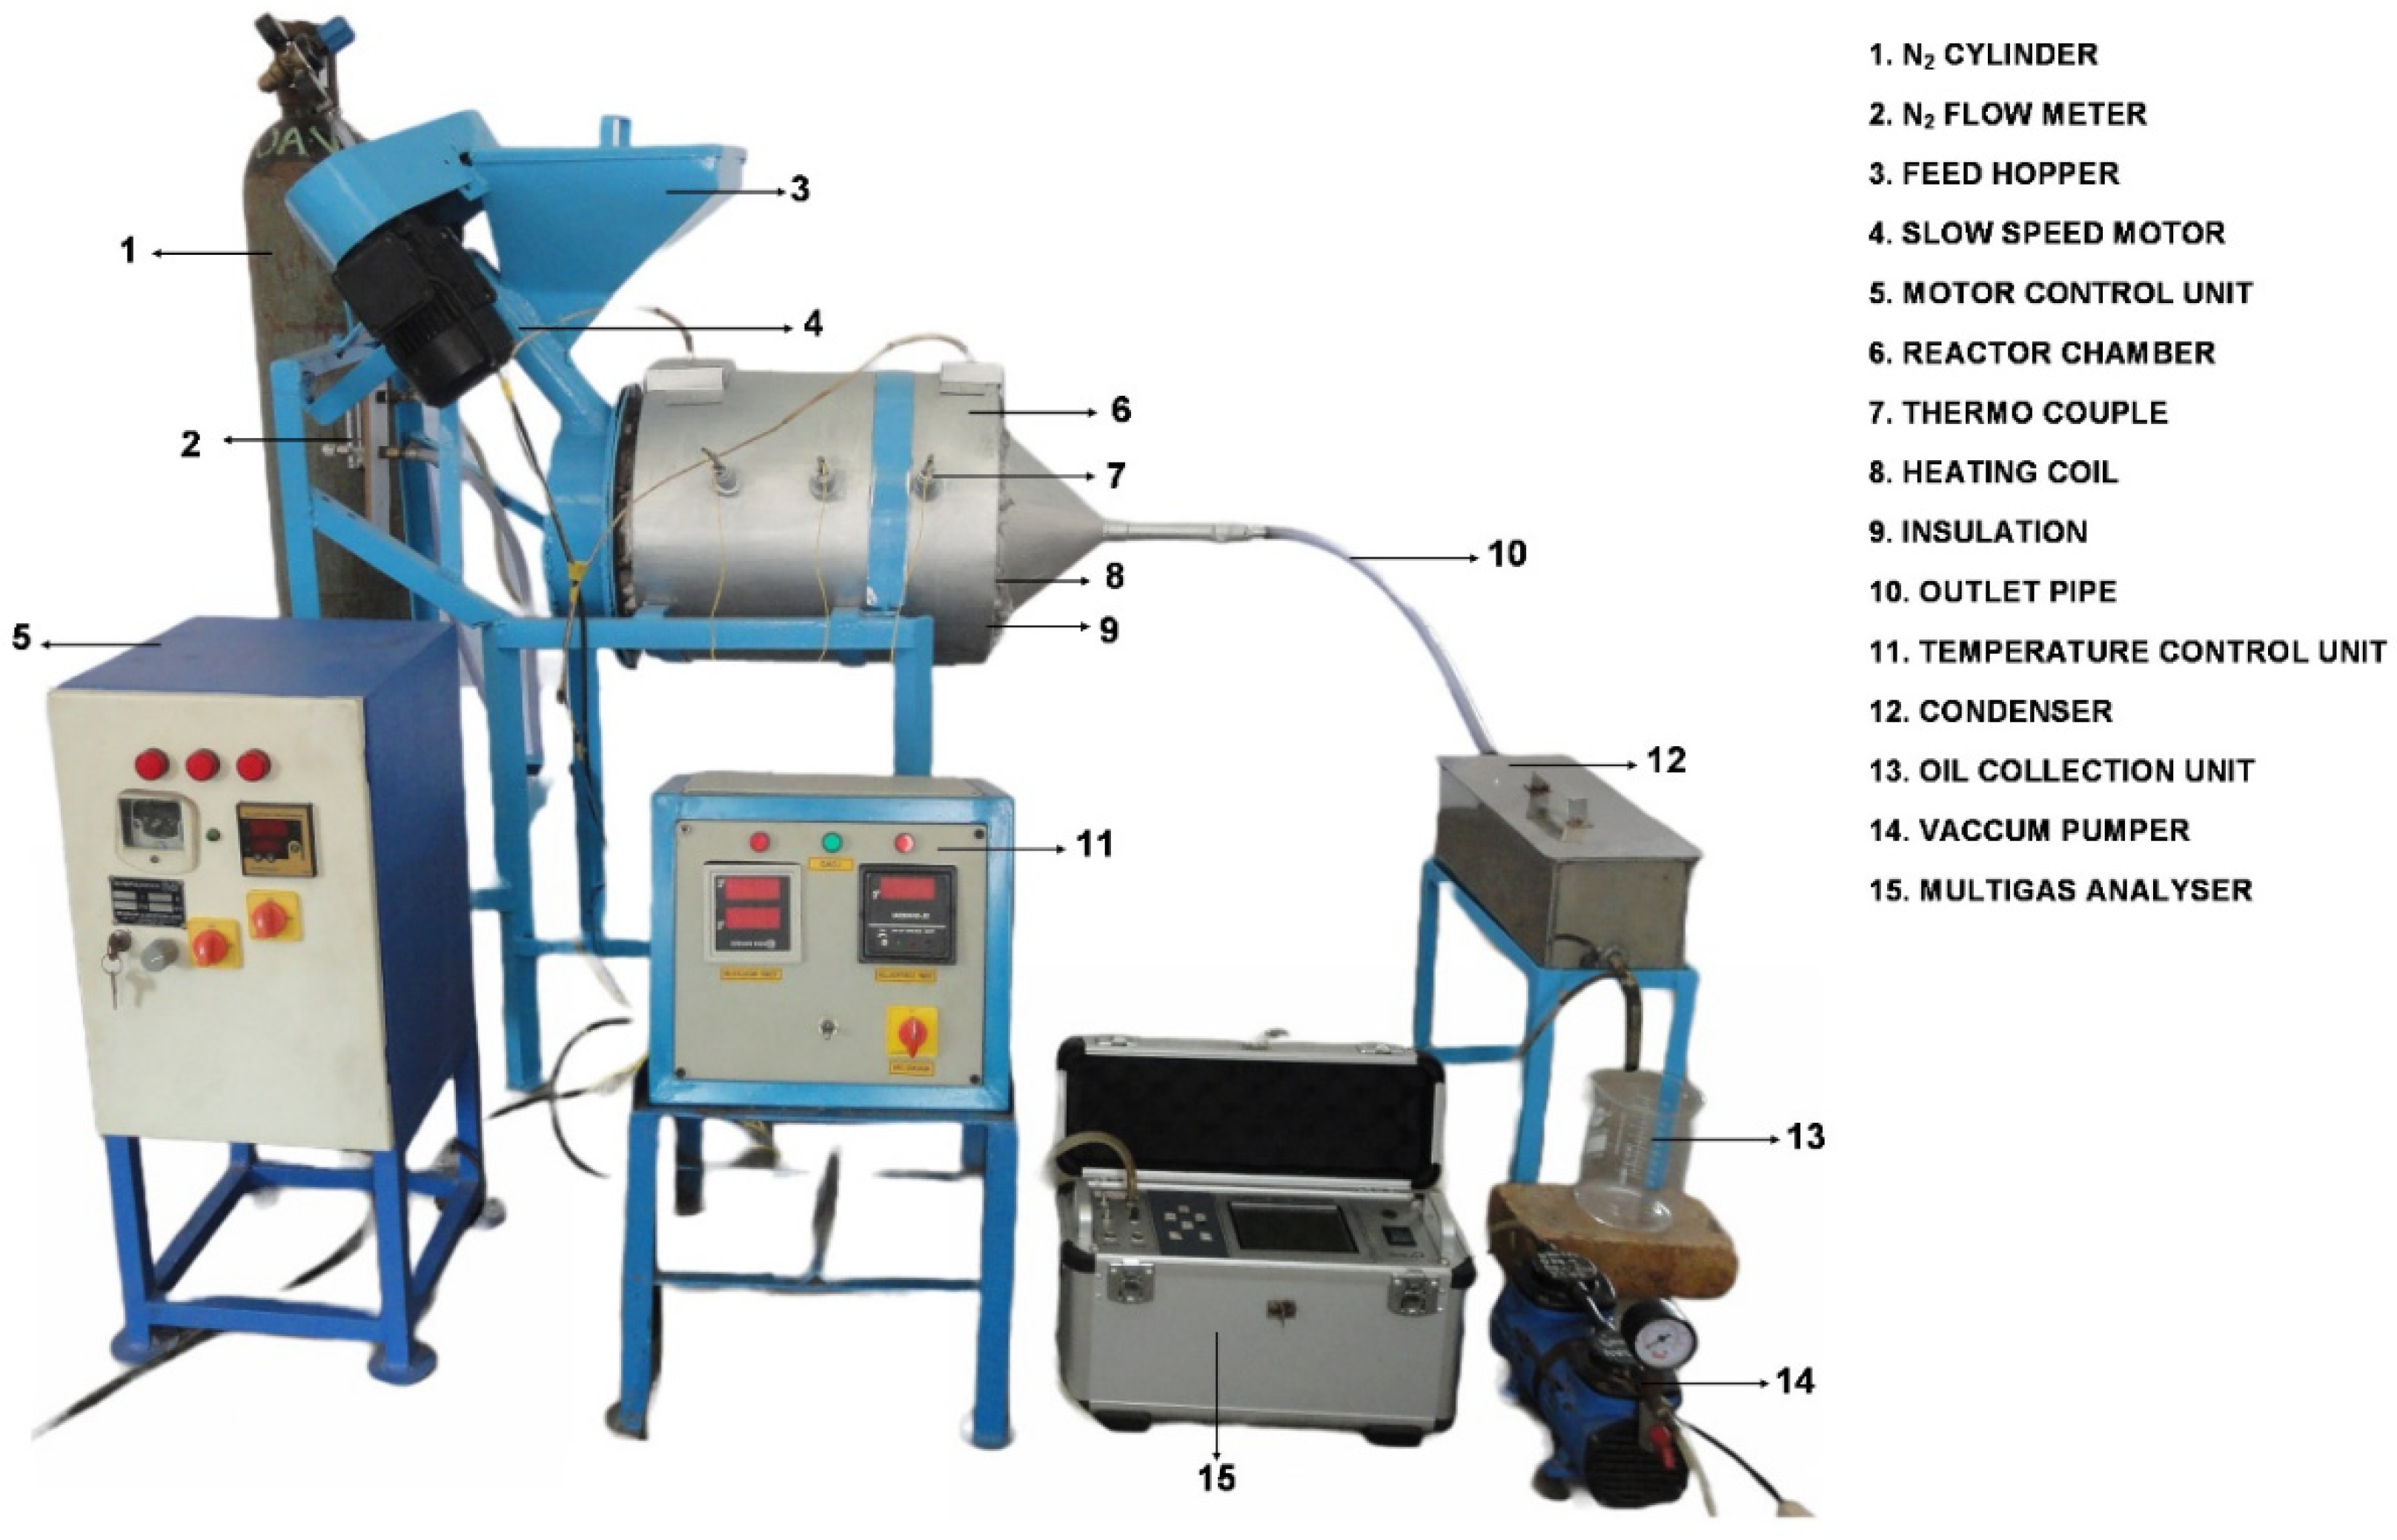
3.2. Description of the Pyrolytic Reactor

The laboratory-scale pyrolytic reactor (one kg processing capacity) was designed and developed for fuel oil production from waste PP grocery bags, which fall under semibatch and fixed-bed types. The unit consists of a pyrolytic chamber with an external heating arrangement, feeding system, and condenser (Figure 4). The pyrolytic chamber consists of a double-walled cylindrical chamber. A 3 kW heating coil with a heating rate of 25 °C min−1 was rolled over the inner cylinder, which was used to provide and maintain the reaction temperature. A ceramic fiber wool insulation was provided to prevent heat losses. On one side of the reactor was a feeding system for feeding the plastic wastes, and on another side, a hole (2.5 cm ϕ) was provided as a pathway for expelling the condensable and noncondensable gases evolved in the process. A small opening was fitted below the feeding system for collecting the solid residue at the end of the experimental trials. A cover plate was used to close the small opening during the trials to ensure the pyrolysis conditions and avoid air entry into the reactor. The thermocouples (K type) were used to measure the temperatures at three locations in the reactor. In addition, a pipe for nitrogen gas supply at another side of the reactor created an inert atmosphere in the chamber.
A screw auger was used to feed plastic waste with a throughput of 1 kg h−1 by operating at 25 rpm for the feeder. A variable-speed motor operated the screw auger to achieve the different feeding rates of the selected plastic wastes. A condenser was provided to condense volatile gases to collect fuel oil. The condenser was made of stainless steel and filled with dry ice as a cooling medium. Two control panels were used to control the process parameters, such as the reaction temperature and feed rate. In this setup, the motor speed to regulate the reactor’s feed rate of plastic wastes varied from 0.25 to 1.5 kg h−1. The rotameter measured the flow rate of inert gas (nitrogen) to the reactor. A range from 5 to 20 mL min−1 of gas was selected and supplied to the reactor for the experiments. A multigas analyzer was used to measure the composition of pyrolytic gas. Gas board—3100 P based on nondispersive infrared sensor (NDIR) technology and a thermal conductivity detector (TCD) in the instrument were used to analyze the pyrolytic gas compositions (CO, CO2, CnHn, and CH4) and other gases (H2 and O2), respectively.

3.3. Operating Procedure

Initially, the operating reaction temperature was set in the control system. The power was supplied to an external heating arrangement to produce the heat for the pyrolysis process. During the trials, a screw auger was operated to supply the raw materials to the reactor after the reaction temperature was reached. The specified inert gas flow rate was continuously supplied to the pyrolytic reactor. The vapor generated from the thermal degradation of plastic wastes was passed through the outlet pipe. The outlet pipe was connected to an ice-cooled condenser to collect the condensed liquid product (i.e., fuel oil) in a container, and noncondensable gasses were allowed to enter the atmosphere. Further, the fuel oil and noncondensable gas were analyzed using the multigas analyzer. The solid residue produced from the pyrolysis of plastic wastes was settled in the reactor and collected after the experimental trials. The yields of three different pyrolytic products, such as fuel oil, solid residue, and pyrolytic gas, were measured.

3.4. Process Optimization Using the Box–Behnken Design

Recently, the response surface methodology (RSM) has been more helpful in optimizing the responses of influential process variables in the chemical process [72]. Also, the RSM can be used to build empirical models based on output responses influenced by several independent process variables. This study used the Box–Behnken (BBD)-type response-surface-design-based experiments. Three-level designs of the proposed work were formulated by combining 2k factorials with incomplete block designs for fitting the response surfaces [73]. Furthermore, Design-Expert software (Version 10, 2016; Stat-Ease, Minneapolis, MN, USA) was also employed to design and randomize the runs. Three independent variables or factors, namely, the reaction temperature (A) (°C), nitrogen flow rate (B) (mL min−1), and feed rate (C) (kg h−1), were used, and the three responses (output variables) were the yields of fuel oil, solid residue, and gas. The ranges and levels of independent variables were chosen based on the preliminary experiment trials. The ranges and levels used in the experimental work are given in Table 5.
The optimal number of experimental runs for the BBD has been calculated using the following Equation (1) [74].
N = 2K (K − 1) + C0
where N is the overall count of variables, K is the number of independent variables, and C0 is representative of the number of center points that were taken as 5 [52].
In this study, seventeen runs of experiments were used for the data acquisition and modeling of the response surface. A suitable model, such as a polynomial quadratic model, was proposed to predict the output responses based on the results. The equation is furnished below (2).
Y = β 0 + i = 1 n β i x i + i = 1 n β ii x i 2 + i = 0 n j > 1 n β ij x i x j
where Y is the measured responses, β0, βi, βii, and βij are the regression coefficient (intercept, linear, quadratic, and interaction), and xi and xj are independent variables.

3.5. Mathematical Modeling

The experimental data of the pyrolysis of waste grocery bags were analyzed using the Design-Expert (Version 10, 2016; Stat-Ease) statistical software package to develop suitable mathematical models with higher R2 values. Coefficients of the models derived from multiple regression analysis and use of variance (ANOVA) combined with the Fisher F-test determined the model adequacy.

3.6. Fuel Oil Properties

The following properties were measured using standard test methods: specific gravity (IS: 1448-1972), kinematic viscosity (ASTM 445-72), flash point (ASTM D93), carbon residue (ASTM D524-IP14/65), and ash content (ASTM D 482). The octane number of the fuel oil was determined using an octane number analyzer (Zeltex, Hagerstown, MD, USA).

3.7. Fourier Transform Infrared Spectroscopy (FT-IR) Analysis

The FT-IR spectra were recorded by applying an attenuated total reflectance (ATR) crystal. An FT-IR spectrophotometer (M/s. Bio-Rad, Jasco-6800, Tokyo, Japan) was used to find the FT-IR spectra of the waste and produced fuel oil. The resolution and scan number were 4 cm−1 and 3, respectively. The FT-IR spectrum in the significant ranges of 4000 to 400 cm−1 was measured and recorded. Bruker software was used for data analysis.

3.8. Gas Chromatography–Mass Spectrophotometry (GC-MS)

The GC-MS (Agilent Technologies, model 7890B) was used to find the fuel oil composition by injecting a test sample (1 µL) in the DB 35 capillary column (30 m × 0.25 mm, film thickness: 0.25 µm) with a helium flow rate of 1 mL min−1, which was operated from 70 to 260 °C at a heating rate of 6 °C min−1.

4. Conclusions

The study investigated the thermal degradation of single-use waste plastic bags for liquid fuel production using pyrolysis as a treatment technology. Thermal degradation of waste PP grocery bags was performed through the laboratory-scale semibatch pyrolytic reactor for fuel oil recovery. The Box–Behnken design of the response surface methodology was used to optimize the pyrolysis process parameters, including the reaction temperature, nitrogen flow rate, and substrate feed rate. The maximum fuel oil yield of 89.34 percent was obtained at a temperature of 481 °C, a nitrogen flow rate of 13 mL min−1, and a feed rate of 0.61 kg h−1. The highest carbon content (85.36%) was found in the PP fuel oil. The specific gravity of the fuel oil was closer to petrol, and in terms of the calorific value, the value seemed to be comparable with the standard value of both gasoline and diesel. Moreover, the motor octane number (85 min) of the fuel oil is in accordance with petroleum fuels. The FT-IR analysis of the fuel oil showed that it primarily contained aliphatic hydrocarbons (alkenes and alkanes), and also indicated the presence of alcohols, esters, and aliphatic amines. The results of the GC-MS analysis revealed that the fuel oil had hydrocarbons in the carbon range of C3–C27, and the maximum peak was obtained in C12. Furthermore, more than 50 percent of the hydrocarbons emerged in the carbon range of C4–C12, followed by C14–C20. These results showed the presence of olefins and paraffin in the fuel oil, in accordance with petroleum hydrocarbons. From the study, it was observed that the fuel properties of the fuel oil produced from waste PP fuel oil were comparable with gasoline and diesel fuels. Also, the results of the fractional distillation of the fuel oil indicate the presence of gasoline, kerosene, and diesel in the fuel oil. The study’s findings are encouraging, demonstrating that the fuel oil obtained from waste PP bags may substitute conventional fuels.

Author Contributions

Conceptualization, B.P. and D.R.; methodology, B.P. and D.R.; software, B.P. and D.R.; validation, B.P., D.R., S.S. and D.U.; formal analysis, B.P. and D.R.; investigation, B.P. and D.R.; resources, B.P., D.R., S.S. and D.U.; data curation, B.P., D.R., S.S. and D.U.; writing—original draft preparation, B.P. and D.R.; review and editing, B.P., D.R., S.S. and D.U.; visualization, B.P., D.R., S.S. and D.U.; supervision, D.R., S.S. and D.U. All authors have read and agreed to the published version of the manuscript.

Funding

The authors would like to thank the Department of Renewable Energy Engineering, Agricultural Engineering College and Research Institute, Tamil Nadu Agricultural University, Coimbatore, for providing the technical support and facilities established under the ICAR-All India Coordinated Research Project on Energy in Agriculture and Alied Industries scheme.

Data Availability Statement

The corresponding author can provide the data used in this work upon request.

Conflicts of Interest

The authors declare no conflict of interest.

References

  1. Basha, S.A.; Gopal, K.R.; Jebaraj, S. A review on biodiesel production, combustion, emissions and performance. Renew. Sustain. Energy Rev. 2009, 13, 628–1634. [Google Scholar] [CrossRef]
  2. Arbab, M.I.; Masjuki, H.H.; Varman, M.; Kalam, M.A.; Imtenan, S.; Sajjad, H. Fuel properties, engine performance and emission characteristic of common biodiesels as a renewable and sustainable source of fuel. Renew. Sustain. Energy Rev. 2013, 22, 133–147. [Google Scholar] [CrossRef]
  3. Callegari, B. Changes in the Global Flow of Plastic Waste and Their Effects on Sustainable Development. In Proceedings of the World Human Rights Cities Forum, Gwangju, Republic of Korea, 7–10 October 2021; p. 69. [Google Scholar]
  4. Noorimotlagh, Z.; Mirzaee, S.A.; Kalantar, M.; Barati, B.; Fard, M.E.; Fard, N.K. The SARS-CoV-2 (COVID-19) pandemic in hospital: An insight into environmental surfaces contamination, disinfectants’ efficiency, and estimation of plastic waste production. Environ. Res. 2021, 202, 111809. [Google Scholar]
  5. Plastics Europe. Plastics—The Facts. An analysis of European Plastics Production, Demand and Waste Data; Plastics Europe: Brussels, Belgium, 2019. [Google Scholar]
  6. CPCB. Annual Report for the Year 2018-19 on Implementation of Plastic Waste Management Rules; Ministry of Environment, Forest and Climate Change, Govt. of India: New Delhi, India, 2019; Available online: https://cpcb.nic.in/uploads/plasticwaste/Annual_Report_2018-19_PWM.pdf (accessed on 26 May 2023).
  7. Geyer, R.; Jambeck, J.R.; Law, K.L. Producción, uso y destino de todos los plásticos jamás fabricados. Sci. Adv. 2017, 3, 1207–1221. [Google Scholar]
  8. Al-Jarallah, R.; Aleisa, E. A baseline study characterizing the municipal solid waste in the State of Kuwait. Waste Manag. 2014, 34, 952–960. [Google Scholar] [CrossRef]
  9. Al-Salem, S.M.; Lettieri, P.; Baeyens, J. Recycling and recovery routes of plastic solid waste (PSW): A review. Waste Manag. 2009, 29, 2625–2643. [Google Scholar] [CrossRef]
  10. Kumar, A.; Sharma, M.P. GHG emission and carbon sequestration potential from MSW of Indian metro cities. Urban Clim. 2014, 8, 30–41. [Google Scholar] [CrossRef]
  11. CIWM; Wasteaid UK. From the Land to the Sea. Available online: https://wasteaid.org/wp-content/uploads/2018/08/From-the-Land-to-the-Sea-1.pdf (accessed on 15 October 2023).
  12. Grigore, M.E. Methods of recycling, properties and applications of recycled thermoplastic polymers. Recycling 2017, 2, 24. [Google Scholar] [CrossRef]
  13. Hahladakis, J.N.; Iacovidou, E. An overview of the challenges and trade-offs in closing the loop of post-consumer plastic waste (PCPW): Focus on recycling. J. Hazard. Mater. 2019, 380, 120887. [Google Scholar] [CrossRef]
  14. Delva, L.; Hubo, S.; Cardon, L.; Ragaert, K. On the role of flame retardants inmechanical recycling of solid plastic waste. Waste Manag. 2018, 82, 198–206. [Google Scholar] [CrossRef]
  15. Kratish, Y.; Li, J.; Liu, S.; Gao, Y.; Marks, T.J. Polyethylene Terephthalate Deconstruction Catalyzed by a Carbon-Supported Single-Site Molybdenum-Dioxo Complex. Angew. Chem. Int. Ed. 2020, 59, 19857–19861. [Google Scholar] [CrossRef] [PubMed]
  16. Schyns, Z.O.; Shaver, M.P. Mechanical recycling of packaging plastics: A review. Macromol. Rapid Commun. 2021, 42, 2000415. [Google Scholar] [CrossRef] [PubMed]
  17. Maitlo, G.; Ali, I.; Maitlo, H.A.; Ali, S.; Unar, I.N.; Ahmad, M.B.; Bhutto, D.K.; Karmani, R.K.; Naich, S.U.R.; Sajjad, R.U.; et al. Plastic Waste Recycling, Applications, and Future Prospects for a Sustainable Environment. Sustainability 2022, 14, 11637. [Google Scholar] [CrossRef]
  18. Rahimi, A.; Garcia, J.M. Chemical recycling of waste plastics for new materials production. Nat. Rev. Chem. 2017, 1, 0046. [Google Scholar] [CrossRef]
  19. Nyashina, G.S.; Vershinina, K.Y.; Shlegel, N.E.; Strizhak, P.A. Effective incineration of fuel-waste slurries from several related industries. Environ. Res. 2019, 176, 108559. [Google Scholar] [CrossRef] [PubMed]
  20. Xiu, M.; Stevanovic, S.; Rahman, M.M.; Pourkhesalian, A.M.; Morawska, L.; Thai, P.K. Emissions of particulate matter, carbon monoxide and nitrogen oxides from the residential burning of waste paper briquettes and other fuels. Environ. Res. 2018, 167, 536–543. [Google Scholar] [CrossRef]
  21. Reyna-Bensusan, N.; Wilson, D.C.; Smithb, S.R. Uncontrolled burning of solid waste by households in Mexico is a significant contributor to climate change in the country. Environ. Res. 2018, 163, 280–288. [Google Scholar] [CrossRef]
  22. Verma, R.; Vinoda, K.S.; Papireddy, M.; Gowda, A.N.S. Toxic pollutants from plastic waste-a review. Procedia Environ. Sci. 2016, 35, 701–708. [Google Scholar] [CrossRef]
  23. Vollmer, I.; Jenks, M.J.F.; Roelands, M.C.P.; White, R.J.; van Harmelen, T.; de Wild, P.; van Der Laan, G.P.; Meirer, F.; Keurentjes, J.T.F.; Weckhuysen, B.M. Beyond mechanical recycling: Giving new life to plastic waste. Angew. Chem. Int. Ed. 2020, 59, 15402–15423. [Google Scholar] [CrossRef]
  24. Organisation for Economic Co-operation and Development. Improving Plastics Management: Trends, Policy Responses, and the Role of International Co-Operation and Trade; OECD Publishing: Paris, France, 2018. [Google Scholar]
  25. Geyer, R.; Jambeck, J.R.; Law, K.L. Production, use, and fate of all plastics ever made. Sci. Adv. 2017, 3, e1700782. [Google Scholar] [CrossRef]
  26. Aboulkas, A.; El Bouadili, A. Thermal degradation behaviors of polyethylene and polypropylene. Part I: Pyrolysis kinetics and mechanisms. Energy Convers. Manag. 2010, 51, 1363–1369. [Google Scholar] [CrossRef]
  27. Eze, W.U.; Umunakwe, R.; Obasi, H.C.; Ugbaja, M.I.; Uche, C.C.; Madufor, I.C. Plastics waste management: A review of pyrolysis technology. Clean Technol. Recycl. 2021, 1, 50–69. [Google Scholar] [CrossRef]
  28. Eze, W.U.; Madufor, I.C.; Onyeagoro, G.N. Study on the effect of Kankara zeolite-Y-based catalyst on the chemical properties of liquid fuel from mixed waste plastics (MWPs) pyrolysis. Polym. Bull. 2021, 78, 377–398. [Google Scholar] [CrossRef]
  29. Sharuddin, S.D.A.; Abnisa, F.; Daud, W.M.A.W.; Aroua, M.K. A review on pyrolysis of plastic wastes. Energy Convers. Manag. 2016, 115, 308–326. [Google Scholar] [CrossRef]
  30. Papari, S.; Bamdad, H.; Berruti, F. Pyrolytic Conversion of Plastic Waste to Value-Added Products and Fuels: A Review. Materials 2021, 14, 2586. [Google Scholar] [CrossRef] [PubMed]
  31. Eze, W.U.; Madufor, I.C.; Onyeagoro, G.N.; Obasi, H.C. The effect of Kankara zeolite-Y-based catalyst on some physical properties of liquid fuel from mixed waste plastics (MWPs) pyrolysis. Polym. Bull. 2020, 77, 1399–1415. [Google Scholar] [CrossRef]
  32. Wong, S.L.; Ngadi, N.; Abdullah, T.A.T.; Inuwa, I.M. Current state and future prospects of plastic waste as source of fuel: A review. Renew. Sustain. Energy Rev. 2015, 50, 1167–1180. [Google Scholar] [CrossRef]
  33. Igalavithana, A.D.; Yuan, X.; Attanayake, C.P.; Wang, S.; You, S.; Tsang, D.C.; Nzihou, A.; Ok, Y.S. Sustainable management of plastic wastes in COVID-19 pandemic: The biochar solution. Environ. Res. 2022, 212, 113495. [Google Scholar] [CrossRef]
  34. Kumar, S.; Prakash, R.; Murugan, S.; Singh, R.K. Performance and emission analysis of blends of waste plastic oil obtained by catalytic pyrolysis of waste HDPE with diesel in a CI engine. Energy Convers. Manag. 2013, 74, 323–331. [Google Scholar] [CrossRef]
  35. Al-Salem, S.M.; Antelava, A.; Constantinou, A.; Manos, G.; Dutta, A. A review on thermal and catalytic pyrolysis of plastic solid waste (PSW). J. Environ. Manag. 2017, 197, 177–198. [Google Scholar] [CrossRef]
  36. Sharma, B.K.; Moser, B.R.; Vermillion, K.E.; Doll, K.M.; Rajagopalan, N. Production, characterization and fuel properties of alternative diesel fuel from pyrolysis of waste plastic grocery bags. Fuel Process. Technol. 2014, 122, 79–90. [Google Scholar] [CrossRef]
  37. Yin, F.; Zhuang, Q.; Chang, T.; Zhang, C.; Sun, H.; Sun, Q.; Wang, C.; Li, L. Study on pyrolysis characteristics and kinetics of mixed plastic waste. J. Mater. Cycles Waste Manag. 2021, 23, 1984–1994. [Google Scholar] [CrossRef]
  38. Ahmad, I.; Khan, M.I.; Khan, H.; Ishaq, M.; Tariq, R.; Gul, K.; Ahmad, W. Pyrolysis study of polypropylene and polyethylene into premium oil products. Int. J. Green Energy 2015, 12, 663–671. [Google Scholar] [CrossRef]
  39. Fakhr, H.S.M.; Dastanian, M. Predicting pyrolysis products of PE, PP, and PET using NRTL activity coefficient model. J. Chem. 2013, 2013, 487676. [Google Scholar]
  40. Uthpalani, P.G.I.; De Silva, D.S.M.; Weerasinghe, V.P.A.; Premachandra, J.K.; Sarathchandra, T.V. Pyrolysis of waste LDPE and waste PP plastics into fuel oil in a low-cost, lab-scale pyrolyzing unit. J. Sci. Univ. Kelaniya 2023, 16, 47–55. [Google Scholar] [CrossRef]
  41. Thahir, R.; Altway, A.; Juliastuti, S.R. Production of liquid fuel from plastic waste using integrated pyrolysis method with refinery distillation bubble cap plate column. Energy Rep. 2019, 5, 70–77. [Google Scholar] [CrossRef]
  42. Martynis, M.; Winanda, E.; Harahap, A.N. Thermal pyrolysis of polypropylene plastic waste into liquid fuel: Reactor performance evaluation. In IOP Conference Series: Materials Science and Engineering; IOP Publishing: Bristol, UK, 2019; Volume 543, p. 012047. [Google Scholar]
  43. Bezerra, M.A.; Santelli, R.E.; Oliveira, E.P.; Villar, L.S.; Escaleira, L.A. Response surface methodology (RSM) as a tool for optimization in analytical chemistry. Talanta 2008, 76, 965–977. [Google Scholar] [CrossRef]
  44. Laouge, Z.B.; Cığgın, A.S.; Merdun, H. Optimization and characterization of bio-oil from fast pyrolysis of Pearl Millet and Sida cordifolia L. by using response surface methodology. Fuel 2020, 274, 117842. [Google Scholar] [CrossRef]
  45. Jung, K.A.; Nam, C.W.; Woo, S.H.; Park, J.M. Response surface method for optimization of phenolic compounds production by lignin pyrolysis. J. Anal. Appl. Pyrolysis 2016, 120, 409–415. [Google Scholar] [CrossRef]
  46. Yiga, V.A.; Lubwama, M.; Pagel, S. Optimization of tensile strength of PLA/clay/rice husk composites using Box-Behnken design. Biomass Convers. Biorefinery 2021, 13, 11727–11753. [Google Scholar] [CrossRef]
  47. Raheem, A.; Ding, L.; He, Q. Effective pretreatment of corn straw biomass using hydrothermal carbonization for co-gasification with coal: Response surface methodology–Box Behnken design. Fuel 2022, 324, 124544. [Google Scholar] [CrossRef]
  48. Fan, Y.; Cai, Y.; Li, X.; Yu, N.; Yin, H. Catalytic upgrading ofpyrolyticvapors from the vacuum pyrolysis of rape straw over nanocrystalline HZSM-5 zeolite in a two-stage fixed-bed reactor. J. Anal. Appl. Pyrolysis 2014, 108, 185–195. [Google Scholar] [CrossRef]
  49. Balasundram, V.; Zaman, K.K.; Ibrahim, N.; Kasmani, R.M.; Isha, R.; Hamid, M.K.A.; Hasbullah, H. Optimizing the catalytic performance of Ni-Ce/HZSM-5 catalyst for enriched C 6–C 8 hydrocarbons in pyrolysis oil via response surface methodology. Biomass Convers. Biorefinery 2020, 13, 8603–8613. [Google Scholar] [CrossRef]
  50. Jegan, J.; Praveen, S.; Kumar, B.M.; Pushpa, T.B.; Gokulan, R. Box-Behnken experimental design for the optimization of Basic Violet 03 dye removal by groundnut shell derived biochar. Desalin. Water Treat. 2021, 209, 379–391. [Google Scholar] [CrossRef]
  51. Hammani, H.; El Achaby, M.; El Harfi, K.; El Mhammedi, M.A.; Aboulkas, A. Optimization and characterization of bio-oil and biochar production from date stone pyrolysis using Box–Behnken experimental design. Comptes Rendus Chim. 2020, 23, 589–606. [Google Scholar] [CrossRef]
  52. Liu, D.; Teng, D.; Zhu, Y.; Wang, X.; Wang, H. Optimization of Process Parameters for Pellet Production from Corn Stalk Rinds Using Box–Behnken Design. Energies 2023, 16, 4796. [Google Scholar] [CrossRef]
  53. Bajad, G.; Vijayakumar, R.P.; Rakhunde, P.; Hete, A.; Bhade, M. Processing of mixed-plastic waste to fuel oil, carbon nanotubes and hydrogen using multi–core reactor. Chem. Eng. Process. Process Intensif. 2017, 121, 205–214. [Google Scholar] [CrossRef]
  54. Mariyam, S.; Alherbawi, M.; Pradhan, S.; Al-Ansari, T.; McKay, G. Biochar yield prediction using response surface methodology: Effect of fixed carbon and pyrolysis operating conditions. Biomass Convers. Biorefinery 2023, 1–14. [Google Scholar] [CrossRef]
  55. Mishra, A.; Meikap, B.C. Optimization of process parameters for waste motor oil pyrolysis towards sustainable waste-to-energy utilizing a combinatorial approach of response surface methodology and desirability criteria. Fuel 2023, 353, 129226. [Google Scholar] [CrossRef]
  56. Ekren, O.; Ekren, B.Y. Size optimization of a PV/wind hybrid energy conversion system with battery storage using response surface methodology. Appl. Energy 2008, 85, 1086–1101. [Google Scholar] [CrossRef]
  57. Sharma, P.; Singh, L.; Dilbaghi, N. Optimization of process variables for decolorization of Disperse Yellow 211 by Bacillus subtilis using Box–Behnken design. J. Hazard. Mater. 2009, 164, 1024–1029. [Google Scholar] [CrossRef]
  58. Gopal, L.C.; Govindarajan, M.; Kavipriya, M.R.; Mahboob, S.; Al-Ghanim, K.A.; Virik, P.; Ahmed, Z.; Al-Mulhm, N.; Senthilkumaran, V.; Shankar, V. Optimization strategies for improved biogas production by recycling of waste through response surface methodology and artificial neural network: Sustainable energy perspective research. J. King Saud Univ. Sci. 2021, 33, 101241. [Google Scholar] [CrossRef]
  59. Hasan, S.H.; Ranjan, D.; Talat, M. “Rice Polish” for the removal of arsenic from aqueous solution: Optimization of process variables. Ind. Eng. Chem. Res. 2009, 48, 4194–4201. [Google Scholar] [CrossRef]
  60. Duong, T.L.; Nguyen, D.T.; Nguyen, H.H.M.; Phan, B.M.Q.; Nguyen, H.L.; Huynh, T.M. Fast pyrolysis of Vietnamese waste biomass: Relationship between biomass composition, reaction conditions, and pyrolysis products, and a strategy to use a biomass mixture as feedstock for bio-oil production. J. Mater. Cycles Waste Manag. 2019, 21, 624–632. [Google Scholar] [CrossRef]
  61. Gulab, H.; Jan, M.R.; Shah, J.; Manos, G. Plastic catalytic pyrolysis to fuels as tertiary polymer recycling method: Effect of process conditions. J. Environ. Sci. Health Part A 2010, 45, 908–915. [Google Scholar] [CrossRef] [PubMed]
  62. Diebold, J.P.; Milne, T.A.; Czernik, S.; Oasmaa, A.; Bridgwater, A.V.; Cuevas, A.; Gust, S.; Huffman, D.; Piskorz, J. Proposed specifications for various grades of pyrolysis oils. In Developments in Thermochemical Biomass Conversion; Springer: Dordrecht, The Netherlands, 1997; pp. 433–447. [Google Scholar]
  63. Sarker, M.; Rashid, M.M.; Rahman, M.S.; Molla, M. Conversion of low density polyethylene (LDPE) and polypropylene (PP) waste plastics into liquid fuel using thermal cracking process. Br. J. Environ. Clim. Chang. 2012, 2, 1–11. [Google Scholar] [CrossRef]
  64. Panda, A.K.; Singh, R.K. Experimental optimization of process for the thermo-catalytic degradation of waste polypropylene to liquid fuel. Adv. Energy Eng. 2013, 1, 74–84. [Google Scholar]
  65. Kalghatgi, G.T. Fuel anti-knock quality-Part II. Vehicle Studies-how relevant is Motor Octane Number (MON) in modern engines? SAE Trans. 2001, 110, 2005–2015. [Google Scholar]
  66. Sarker, M.; Rashid, M.M. Mixture of LDPE, PP and PS waste plastics into fuel by thermolysis process. Int. J. Eng. Technol. Res. 2013, 1, 1–16. [Google Scholar]
  67. Nisar, J.; Aziz, M.; Shah, A.; Shah, I.; Iqbal, M. Conversion of Polypropylene Waste into Value-Added Products: A Greener Approach. Molecules 2022, 27, 3015. [Google Scholar] [CrossRef]
  68. Sarker, M.; Rashid, M.M. Polypropylene waste plastic conversion into fuel oil by using thermal degradation with fractional process. Am. J. Environ. Energy Power Res. 2014, 2, 1–10. [Google Scholar]
  69. Kassargy, C.; Awad, S.; Burnens, G.; Kahine, K.; Tazerout, M. Experimental study of catalytic pyrolysis of polyethylene and polypropylene over USY zeolite and separation to gasoline and diesel-like fuels. J. Anal. Appl. Pyrolysis 2017, 127, 31–37. [Google Scholar] [CrossRef]
  70. Sonawane, Y.B.; Shindikar, M.R.; Khaladkar, M.Y. Use of catalyst in pyrolysis of polypropylene waste into liquid fuel. Int. Res. J. Environ. Sci. 2015, 4, 24–28. [Google Scholar]
  71. Panda, A.K.; Singh, R.K. Conversion of waste polypropylene to liquid fuel using acid-activated kaolin. Waste Manag. Res. 2014, 32, 997–1004. [Google Scholar] [CrossRef] [PubMed]
  72. Nguyen, N.K.; Borkowski, J.J. New 3-level response surface designs constructed from incomplete block designs. J. Stat. Plan. Inference 2008, 138, 294–305. [Google Scholar] [CrossRef]
  73. Manohar, M.; Joseph, J.; Selvaraj, T.; Sivakumar, D. Application of Box Behnken design to optimize the parameters for turning Inconel 718 using coated carbide tools. Int. J. Sci. Eng. Res. 2013, 4, 620–644. [Google Scholar]
  74. Rakhmania; Kamyab, H.; Yuzir, M.A.; AI-Qaim, F.F.; Purba, L.D.A.; Riyadi, F.A. Application of Box-Behnken design to mineralization and color removal of palm oil mill effluent by electrocoagulation process. Environ. Sci. Pollut. Res. 2021, 30, 71741–71753. [Google Scholar] [CrossRef]
Figure 1. 3D Response surface plot for the interactive effect of all factors and their mutual interaction on the oil yield (PP): (a) effect of temperature and nitrogen flow rate; (b) effect of temperature and feed rate; (c) effect of nitrogen flow rate and feed rate.
Recycling 09 00015 g001
Figure 2. FT-IR spectrum for PP wastes and its fuel oil.
Recycling 09 00015 g002
Figure 3. ASTM distillation curve of the fuel oil from waste PP using pyrolysis process.
Recycling 09 00015 g003
Figure 4. Laboratory-scale pyrolytic reactor for fuel oil production.
Recycling 09 00015 g004
Table 1. BBD matrix and experimental results.
Run OrderFactorResponse
Temperature, °CN2 Flow Rate, mL min−1Feed Rate,
kg/h
Oil Yield, %Solid Residue, %Gas Yield, %
ActualPredictedActualPredictedActualPredicted
140012.50.25064.7163.994.494.6630.831.36
247512.50.87589.4389.432.942.947.637.63
34005.00.87562.5862.7655.735.6331.6931.60
455012.50.25057.8257.291.801.8440.3840.88
54755.00.25085.3685.8953.923.8510.7210.26
655020.00.87552.9552.771.972.0745.0845.17
747512.50.87589.4389.432.942.947.637.63
847512.50.87589.4389.432.942.947.637.63
95505.00.87554.6654.662.632.6642.7142.68
1040020.00.87561.3561.3554.864.8333.7933.82
114755.01.50080.8580.144.184.3214.9715.56
1255012.51.50049.2749.992.482.3148.2547.70
1347512.50.87589.4389.432.942.947.637.63
1447520.00.25083.4284.143.263.1213.3812.79
1547520.01.50079.1378.603.593.6617.2817.74
1640012.51.50059.4659.995.255.2135.2934.79
1747512.50.87589.4389.432.942.947.637.63
Table 2. ANOVA analysis for the PP fuel oil yield response.
ResponseSourceSum of
Squares
Degrees of FreedomMean
Square
F
Value
p-Value
Prob > F
Significance
Fuel oil yield (%)Model3734.969415.00890.55<0.0001Significant at a 5% level
A—Temperature139.451139.45299.24<0.0001
B—Nitrogen flow rate5.4515.4511.680.0112
C—Feed rate63.85163.85137.01<0.0001
AB0.0610.060.120.7355
AC2.7212.725.840.0463
BC0.0110.010.030.8765
A23291.6313291.637063.58<0.0001
B254.11154.11116.13<0.0001
C256.25156.25120.71<0.0001
Residual3.2670.47
Lack of Fit3.2631.09
Pure Error0.0040.00
Cor Total3738.2216
Std. Dev.0.68R-Squared0.99
Mean72.87Adj R-Squared0.99
C.V. %0.94Pred R-Squared0.98
PRESS52.19Adeq Precision75.33
Table 3. Results of FT-IR spectra of functional groups of waste PP and its fuel oil.
S. NoWaste PPFuel Oil
Wavenumber
(cm−1)
BondFunctional GroupWave
Number,
(cm−1)
BondFunctional Group
13394.10O-H stretch,
H-bonded
Alcohols,
Phenols
3457.74O-H stretch,
H-bonded
Alcohols, Phenols
23188.72O-H stretchCarboxylic acids3071.08=C-H stretchAlkenes
32952.48C-H stretchAlkanes2955.38C-H stretchAlkanes
42915.84C-H stretchAlkanes2956.34C-H stretchAlkanes
52873.42C-H stretchAlkanes2918.73C-H stretchAlkanes
62194.60-C- stretchAlkynes2913.91C-H stretchAlkanes
71455.90C-H bendAlkanes2873.42C-H stretchAlkanes
8972.91=C-H bendAlkenes2203.27-C C- stretchAlkynes
9839.85=C-H bendAlkenes1741.41C=O stretchEsters,
Saturated aliphatics
10---1648.84-C=C- stretchAlkenes
11---1456.96C-H bendAlkanes
12---1371.14C-H bendAlkanes
13---1221.68C-N stretchAliphatic amines
14---1158.04C-N stretchAliphatic amines
15---970.019=C-H bendAlkenes
16---886.131=C-H bendAlkenes
17---887.095=C-H bendAlkenes
18---738.603=C-H bendAlkenes
19---695.212-C C-H:C-H bendAlkynes
Table 4. GC-MS analysis of fuel oil produced from waste PP.
Retention Time (min.)Name of the CompoundArea (%)
3.93Pentane, 3,3-dimethyl-1.90
5.081-Propene, 2-methyl-10.95
5.77Cyclopropane1.31
6.271-Propyne1.43
7.22(E)-6-Dodecene1.84
7.771,6-Octadiene, 2,5 dimethyl-, (E)-5.46
8.251-Undecene, 7-methyl24.26
8.873-Undecene2.57
9.342-Undecanethiol, 2-methyl-1.30
10.779-Octadecene1.94
11.431-Octadecene5.82
12.347-Octadecyne, 2-methyl-2.85
13.052-Methyl-octadecyne1.62
14.931-Dodecanol, 2-hexyl-2.53
15.69Decane, 2,3,5,8-tetramethyl6.37
16.28Naphthalene4.24
16.66Cyclopentane1.61
17.40Cyclododecanemethanol1.24
19.20Cyclotetracosane1.42
19.941-Hexadecanol, 3,7,11,15-tetramethyl-3.28
20.87Oxirane, tetradecyl-2.23
21.582,6,10,14-Tetramethyl-7-pentadecane1.36
23.181-Eicosene1.27
23.891-Dodecanol, 2-octyl-2.37
24.74Dodecane1.83
25.421-Heptacosanol1.74
27.7411-Dodecen-1-ol, 2,4,6-trimethyl-1.56
28.3311-Dodecen-1-ol difluoroacetate1.46
30.3911,13-Dimethyl-12-tetradecen-1-ol acetate1.33
30.869-Hexacosene1.30
Table 5. Box–Behnken design for the optimization of the process conditions in a pyrolytic reactor for fuel oil production from waste PP.
FactorsRange and Levels
−101
Reaction temperature (A) (°C)400475550
Nitrogen flow rate (B) (mL min−1)512.520
Feed rate (C) (kg h−1)0.250.8751.5
Disclaimer/Publisher’s Note: The statements, opinions and data contained in all publications are solely those of the individual author(s) and contributor(s) and not of MDPI and/or the editor(s). MDPI and/or the editor(s) disclaim responsibility for any injury to people or property resulting from any ideas, methods, instructions or products referred to in the content.

