Article

Effect of Soil Use and Coverage on the Spectral Response of an Oxisol in the VIS-NIR-MIR Region

by
Javier M. Martín-López
* and
Giovanna Quintero-Arias
Faculty of Engineering, National University of Colombia, Carrera 45#26-85, 111321 Bogota, Colombia
*
Author to whom correspondence should be addressed.
J. Imaging 2017, 3(1), 10; https://doi.org/10.3390/jimaging3010010
Submission received: 1 January 2017 / Revised: 27 January 2017 / Accepted: 8 February 2017 / Published: 16 February 2017

Abstract

:
In this study, the spectral responses obtained from a Typic Red Hapludox (oxisol) were analyzed under different uses and occupations: Ficus elastica cultivation, Citrus + Arachis association cultivation, transitional crops, forest, Mangifera indica, Anacardium occidentale, Elaeis guineensis (18 years), Brachiaria decumbens, Brachiaria brizantha, and Musa × paradisiaca + Zea mays at the La Libertad Research Center in the department of Meta in Colombia (4°04′ North latitude, 73°30′ West longitude, 330 MAMSL). Sampling was performed with four random replicates of the horizon A and B to determine the contents of organic carbon (CO), pH, exchangeable acidity (Ac. I), cation exchange capacity (Cc), P, Ca, Mg, K, Na, sand, lime, and clay and spectral responses were obtained in the visible band (VIS), near infrared (NIR), and infrared (MIR) for each sample under laboratory conditions. A comparison was made between the obtained spectra, determining the main changes in soil properties due to their use and coverage. Variation of soil characteristics such as color, organic carbon content, presence of ferrous compounds, sand, silt, and clay content and mineralogy allow the identification of the main spectral changes of soils, demonstrating the importance of the use of reflectance spectroscopy as a tool of comparison and estimation between physical-chemical properties of the soils.

1. Introduction

Agricultural research is often based on the study of yield of crop production, which is directly influenced by the physical, chemical and biological properties of soil, so a detailed and meticulous study of the properties of soil is considered the more effective way of establishing the necessary solutions for the agricultural development of a region. In order to be able to carry out a control and later solution to problems of crop management, the main analyses carried out in the agricultural environment are made from the study of the chemical elements found in soils. However, conventional laboratory methods prove to be slow and costly, making it difficult to obtain appropriate information from soil analyses. This justifies the need to implement alternative techniques to improve efficiency and obtain reliable data for planning and land use decision making.
A new technique based on the interaction of electromagnetic spectrum and matter with absorbance property of all materials has been developed for four decades [1]. This technology is called reflectance spectroscopy. Reflectance spectroscopy is an alternative method that can be used to reinforce conventional laboratory methods in determining the physicochemical properties of soils. Spectroscopy is known for its speed, precision, reliability, and low costs in many scientific areas, being more efficient when the analysis of a large number of samples and a representative volume of information is required. Moreover, spectroscopic techniques do not require expensive sampling procedures and are less time-consuming in pre-processing or use of chemicals that are often harmful to the environment [2]. This technique represents a fairly marked separation of conventional analytical methods because a single spectrum allows simultaneous characterization of various soil properties without the need to have several samples treated with various chemicals to isolate their specific components.
Reflectance spectroscopy employs the electromagnetic spectrum mostly between visible and infrared regions, mainly between wavelengths ranging from 400 to 50,000 nm [3,4]. For this reason, the reflectance spectroscopy can be conducted with different types of radiation depending on the study to be performed: Visible reflectance spectroscopy (VIS) when using wavelengths 400–750 nm and Near Infrared Reflectance Spectroscopy (NIRS) at 750–2500 nm [5,6]. It is also possible to use the medium infrared (MIR) at 2500–50,000 nm, and finally far infrared (FIR) with wavelengths 50,000–100,000 nm [2]. The main difference between visible, near infrared (NIR) and average (MIR) is the type of absorption, which corresponds to the fundamental bands of molecular vibrations for the medium infrared spectroscopy, whereas the absorptions in the NIR region correspond to overtones and combinations of these fundamental bands [7] and electronic excitations determine the absorption of radiation in the visible part [8].
In particular for soils, the spectroscopic technique allows the evaluation of properties such as organic matter or moisture content, including carbon content, nitrogen, clay, carbonates, cation exchange capacity [9], among others both physical and chemical properties. Several authors have demonstrated the effectiveness of NIR reflectance spectroscopy in the estimation of macro and micronutrients in soils, physical characteristics [10], and biochemical properties [11], as well as to predict maximum temperatures reached in burnt soils [12].
It is possible to analyze the vibrations of the Si–O, O–Al, Fe–O, O–H, C–H and H–N bonds, which have been related to the presence of silicates, iron oxides (Fe), aluminum (Al), calcium carbonate, and organic matter [13,14] and the overlapping of weak bands in the visible (VIS) indicate the presence of iron oxides [15]. On the other hand, [16] demonstrated that soil physical properties based on soil solid composition and surfaces such as clay content and contraction-swelling potential can be reasonably predicted using MIR spectroscopy; [17] calibrated MIR reflectance spectra to estimate soil water content to several matrix pressure heads. Viscarra [2] performed a very complete review of the different soil attributes measured by NIR and MIR spectroscopy.
The use of spectroscopy in the determination of soil properties makes it an appropriate option for the study of crop development, spatial variability and management of land use on a larger scale, complementing soil studies at the national level. In Colombia, most regions present soil maps with a scale of 1:100,000, which are insufficient for precise planning of agriculture, soil conservation, or possible land-use change, which is the main problem of degradation of soils worldwide. In Latin American countries, about 50% of the land is used inappropriately and in Colombia, the total land overutilized to a severe and moderate degree exceeds 60%, especially in agricultural activities, in areas recommended for forest protection, and production of water resources making it necessary to obtain better planning models [18]. The objective of this study is to describe the influence of different soil uses on the spectral response of an oxisol in order to infer the main changes in soil properties caused by different types of management and agricultural use.

2. Materials and Methods

2.1. Characterization of the Study Area

Soils are located in the region of the Colombian altillanura in the research center of Corpoica La Libertad (4°04′ North latitude, 73°30′ West longitude and 330 MAMSL). Ten areas were classified according to their use and coverage in which the following were identified: Ficus elastica cultivation, Citrus + Arachis association cultivation, transitional crops, forest, Mangifera indica, Anacardium occidentale, Elaeis guineensis (18 years), Brachiaria decumbens, Brachiaria brizantha, and Musa × paradisiaca + Zea mays. The climate of the region is tropical, the average relative humidity is 85%, the average minimum temperature is 21.8 °C, the average maximum is 30.7 °C, and the annual average is 26.3 °C, the average precipitation corresponds to 2700 mm, with January being the month of least precipitation with 30.1 mm, and May the highest with 422.7 mm [19]. The soils of the area come from sediments of the recent Pleistocene to the old Holocene with presence of high quartz content in the sand fraction and in the clay fraction considerable levels of kaolinite and iron oxides. Soils are located in alluvial terraces with slightly flat topography and they belong to class IV 8 according to the regional classification of use by [20]. These soils present low natural fertility due to their low levels of organic matter, they are very acidic (pH < 4.5), with a high aluminum saturation (>70%) and a low base saturation (<25%), Phosphorus (1 ppm), calcium, magnesium, and potassium, have good drainage (groundwater levels of 3.5 m in each winter) and a deficiency of minor elements with the exception of iron [21].

2.2. Characterization of Samples

The collection of soil samples is composed of four sampling points randomly selected in each study area in which soil pits of 60 cm long by 100 cm wide and 125 cm deep were made, which were georeferenced using a global positioning system (maximum error of 1 m). A total of 80 sampling points were taken, of which 50% of the points correspond to the horizon A between 0 and 0.30 m depth and the remaining 50% to the horizon B between 0.30 and 0.60 m. In Table 1 it can be observed that the geographical location of sampling soil points.
For the laboratory analyses, altered and unaltered samples were taken in rings of 5.00 cm in diameter and 3.00 cm in height and blocks of 10 cm × 10 cm × 10 cm in order to determine the physical and chemical properties of soil. Soil characterization was performed by conventional laboratory analysis where all properties were determined according to methodology described by [22]. The sand, silt, and clay (Pipette); organic carbon (Walkley Black); exchangeable acidity (Extraction with KCl 1 N); pH (potentiometer); available P (Bray II); (Atomic absorption-emission); cation exchange capacity, Na, K, Ca, and Mg (1 N ammonium acetate neutral pH); the color of the soils was also determined by means of the Munsell table.
In order to analyze the behavior between the determined properties and their relation, the data were submitted for correlation analysis by means of the Pearson coefficient for each of the two horizons of the studied soils. The classified was performed according to the ranges determined by [23], who indicates that an R = 1 means a perfect correlation; 0.8 < R <1 is a very high correlation; 0.6 < R <0.8 is a high correlation; 0.4 < R <0.6 is a moderate correlation; 0.2 < R <0.4 is a low correlation; 0 < R < 0.2 is a very low correlation and R = 0 is a null correlation. This statistical analysis was performed using the statistical program SPSS v.11 (SPSS Inc., Chicago, IL, USA) [24].

2.3. Acquisition of Spectra

The soil samples were dried at 75 °C for 24 h and subsequently screened by the 2 mm sieve. An infrared spectrometer (Field Spec 3) was used in the laboratory with a resolution of 1 nm between 400 and 2500 nm (VIS-NIR Region). The soil samples were placed on a Petri dish with a diameter of 9 cm and a thickness of 1 cm, which was placed on the infrared reading sensor. A Mug-Light was used as an active sensor, which was arranged vertically in contact with the Petri dish with its own light source. Two spectral measurements per sample were taken with a 90 degree difference in the sample base and a total of 48 scans were performed for each measurement, taking the mean of the scans as the spectrum.
For the middle infrared region, a Shimatzu FT-IR infrared laboratory spectrometer was used. Samples received the same treatment as those used in VIS-NIR, but were additionally macerated and disposed in the sample holder (1/2 cm3). The resolution used was 4 nm and a total of 48 scans were performed for each measurement. The calibration of the equipment was performed with a sample of KBR and its reflectance was measured in the same number of scans per sample.

3. Results and Discussion

3.1. Soil Properties

The studied soils are located in a high terrace of the piedmont of the Eastern Plains, their parental material comes from pliopleistocenocous alluvial sediments of the eastern mountain range [25]. In Table 2 and Table 3, it can be observed that the textural class of the analyzed soils is Franco-Argillose and the thickness of the horizon A varies approximately between 250 and 410 mm of depth, being 40% greater than the horizon B where its thickness varies between 160 and 290 mm. The pH of the studied zones varies between extremely acid (3.5–4.4) and very strongly acid (5.1–5.5), with more acid soil being present in the horizon A of the culture of Mangifera indica and less the soil present in horizon A of Brachiaria brizantha. However, the horizons A and B of the forest area present some of the lowest pH values (4.0 and 4.3), while the Citricos + Arachis association presents one of the highest pH values (4.7 and 4.8) while the Musa × paradisiaca + Zea mays association in its two horizons presents the mean value (4.5 and 4.6). These levels of acidity in soils directly affect plant growth; decrease the availability of some nutrients such as Ca, Mg, K, and P; and favor the solubilization of toxic elements for plants such as Al and Mn.
The content of organic carbon (CO) in the nine zones was low for both horizons, however the CO value was higher in the A horizon, due to the contributions of residues of vegetal material from the surface [26]. The CO decreases with depth, being lower for the B horizon except for the Elaeis guineensis crop that presents the highest CO value of all the zones. These contents are attributed to the rapid mineralization of the organic matter, as well as to the transport of fine particles by surface runoff, caused by the high precipitations of the zone.
The content of P for all soils is mainly caused by poor soil materials, soil organic matter dynamics and crop management [27]. The highest values are recorded in horizon A and mainly in the soil covered by Brachiaria brizantha and the Citrus + Arachis association, caused by the application of fertilizers in these zones, while the forest area in horizon A presents the lower values when fertililized to a lesser extent. In the B horizon of all the zones, the lower values of phosphorus are presented being this caused by the use of this compound by the plants, not allowing it to descend to the B horizon generating nutritional limitations in the crops with this depth of roots. This fact shows the necessity of the use of fertilizers rich in phosphorus and the application of amendments to avoid the fixation of the phosphorus by the aluminum.
Likewise, the high degree of acidity and the low Ca, Mg, and K content are a limiting factor for crop development. High levels of quartz, kaolinite, gibsite, ferrous compounds, and aluminum affect a decrease in nutrients for plants such as N, P, K, Ca, Mg, and some minor elements, which produce low fertility for all soils of the Colombian plain [24]. In this study, the exchangeable acidity is lower in the A horizon with the exception of the cultivation of Ficus elastica and Mangifera indica, which present the highest values of acidity in the area. According to [28], the exchangeable acidity increases as the profile is deepened, in this case being 2.9 cmol/kg the maximum value found in the B horizon, which belongs to the forest area. As for the values of Ca and Mg, these decrease with the depth of the soil being more remarkable in the calcium. The cultivation of Ficus elastica and forest both in the horizon A and B have the minimum values of calcium, which can be attributed to its little intervention. It is reported in [29] that in highly evolved and washed tropical soils as in oxisols and Ultisols, very low Ca and Mg values are found.
The ICC below 20 cmol/kg in all areas confirms that these soils have a low amount of interchangeable bases, mainly due to leaching and their base poor material. The cations that mainly influence the cation exchange processes are Ca, Mg, K, and Na (the soil bases), NH4 and Al, however in Table 4, there is no evidence of a high correlation with these variables except of CO, with which it shares a significance of 0.05. According to [30], the values obtained for CIC are characteristic of sandy soils with high quartz content, which means that if there are no charges on the particles, the cations will be removed from the profile. However, for this case these values are attributed to the low organic matter content in the horizons.
Table 4 shows the correlation analysis between the properties measured for both the A horizon and the B horizon, with highly significant positive correlations (0.01) being found between magnesium and available phosphorus, calcium, and potassium; While the available phosphorus and calcium, CO, and ICC have a positive significance at the 0.05 level. In the case of sand, it presents a negative correlation with a significance of 0.05 with clay and silt, showing that the texture of the soil is directly influenced by the sand content throughout the area, contrary to what is reported by [31] for this type of soil, where it was found that the sand and silt contents were similar and exceeded the clay content, which presented values between 21.89% and 22.09%.

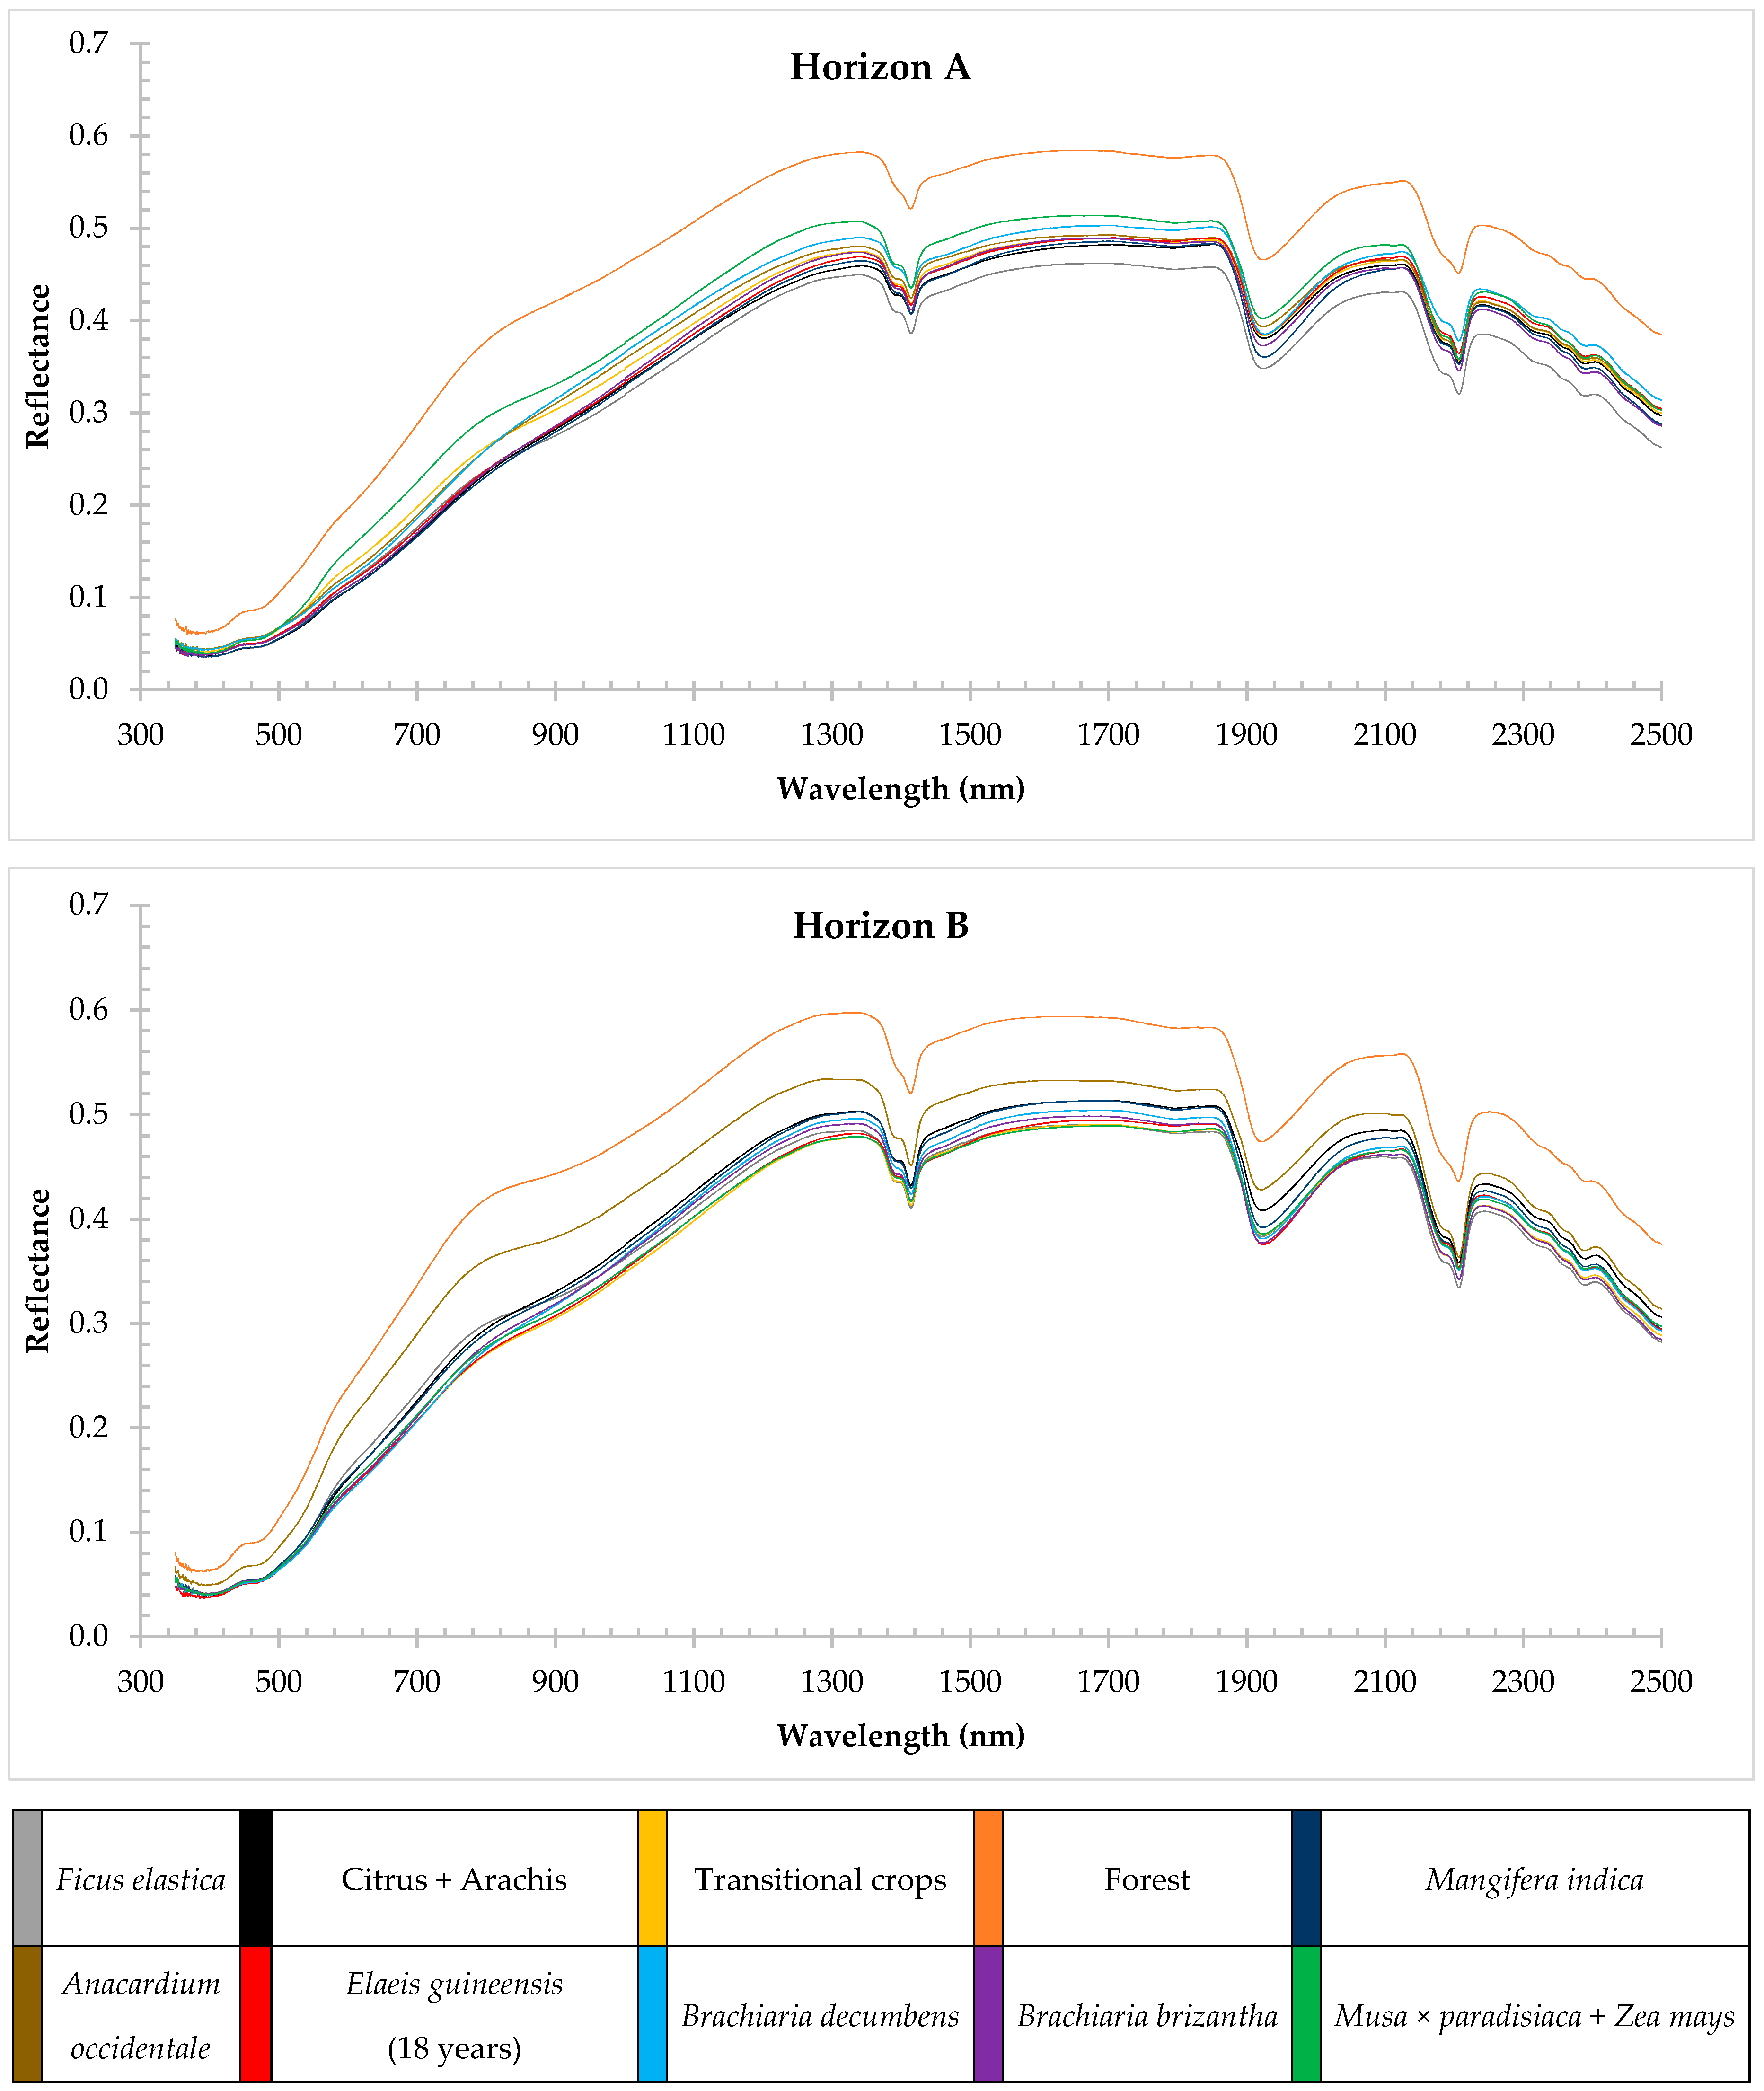
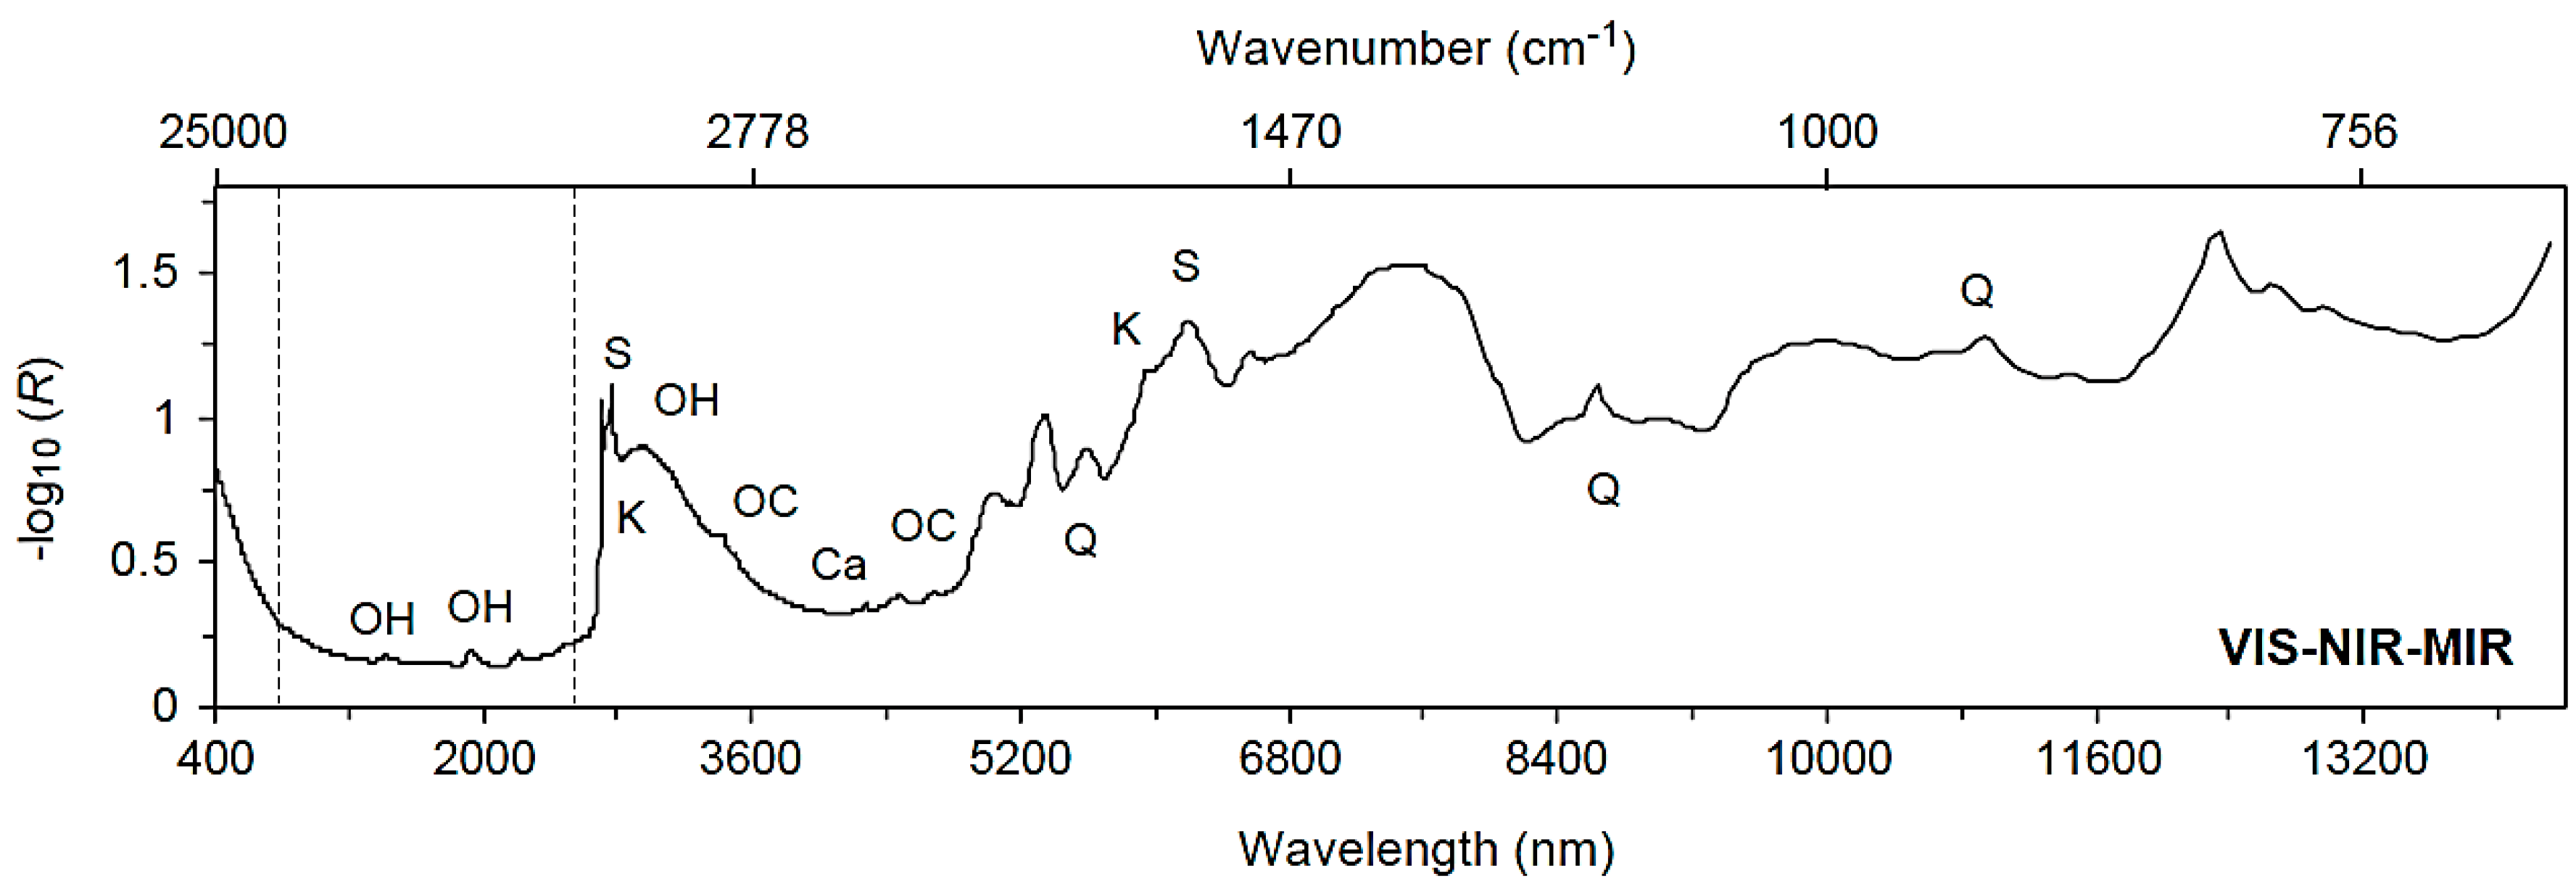
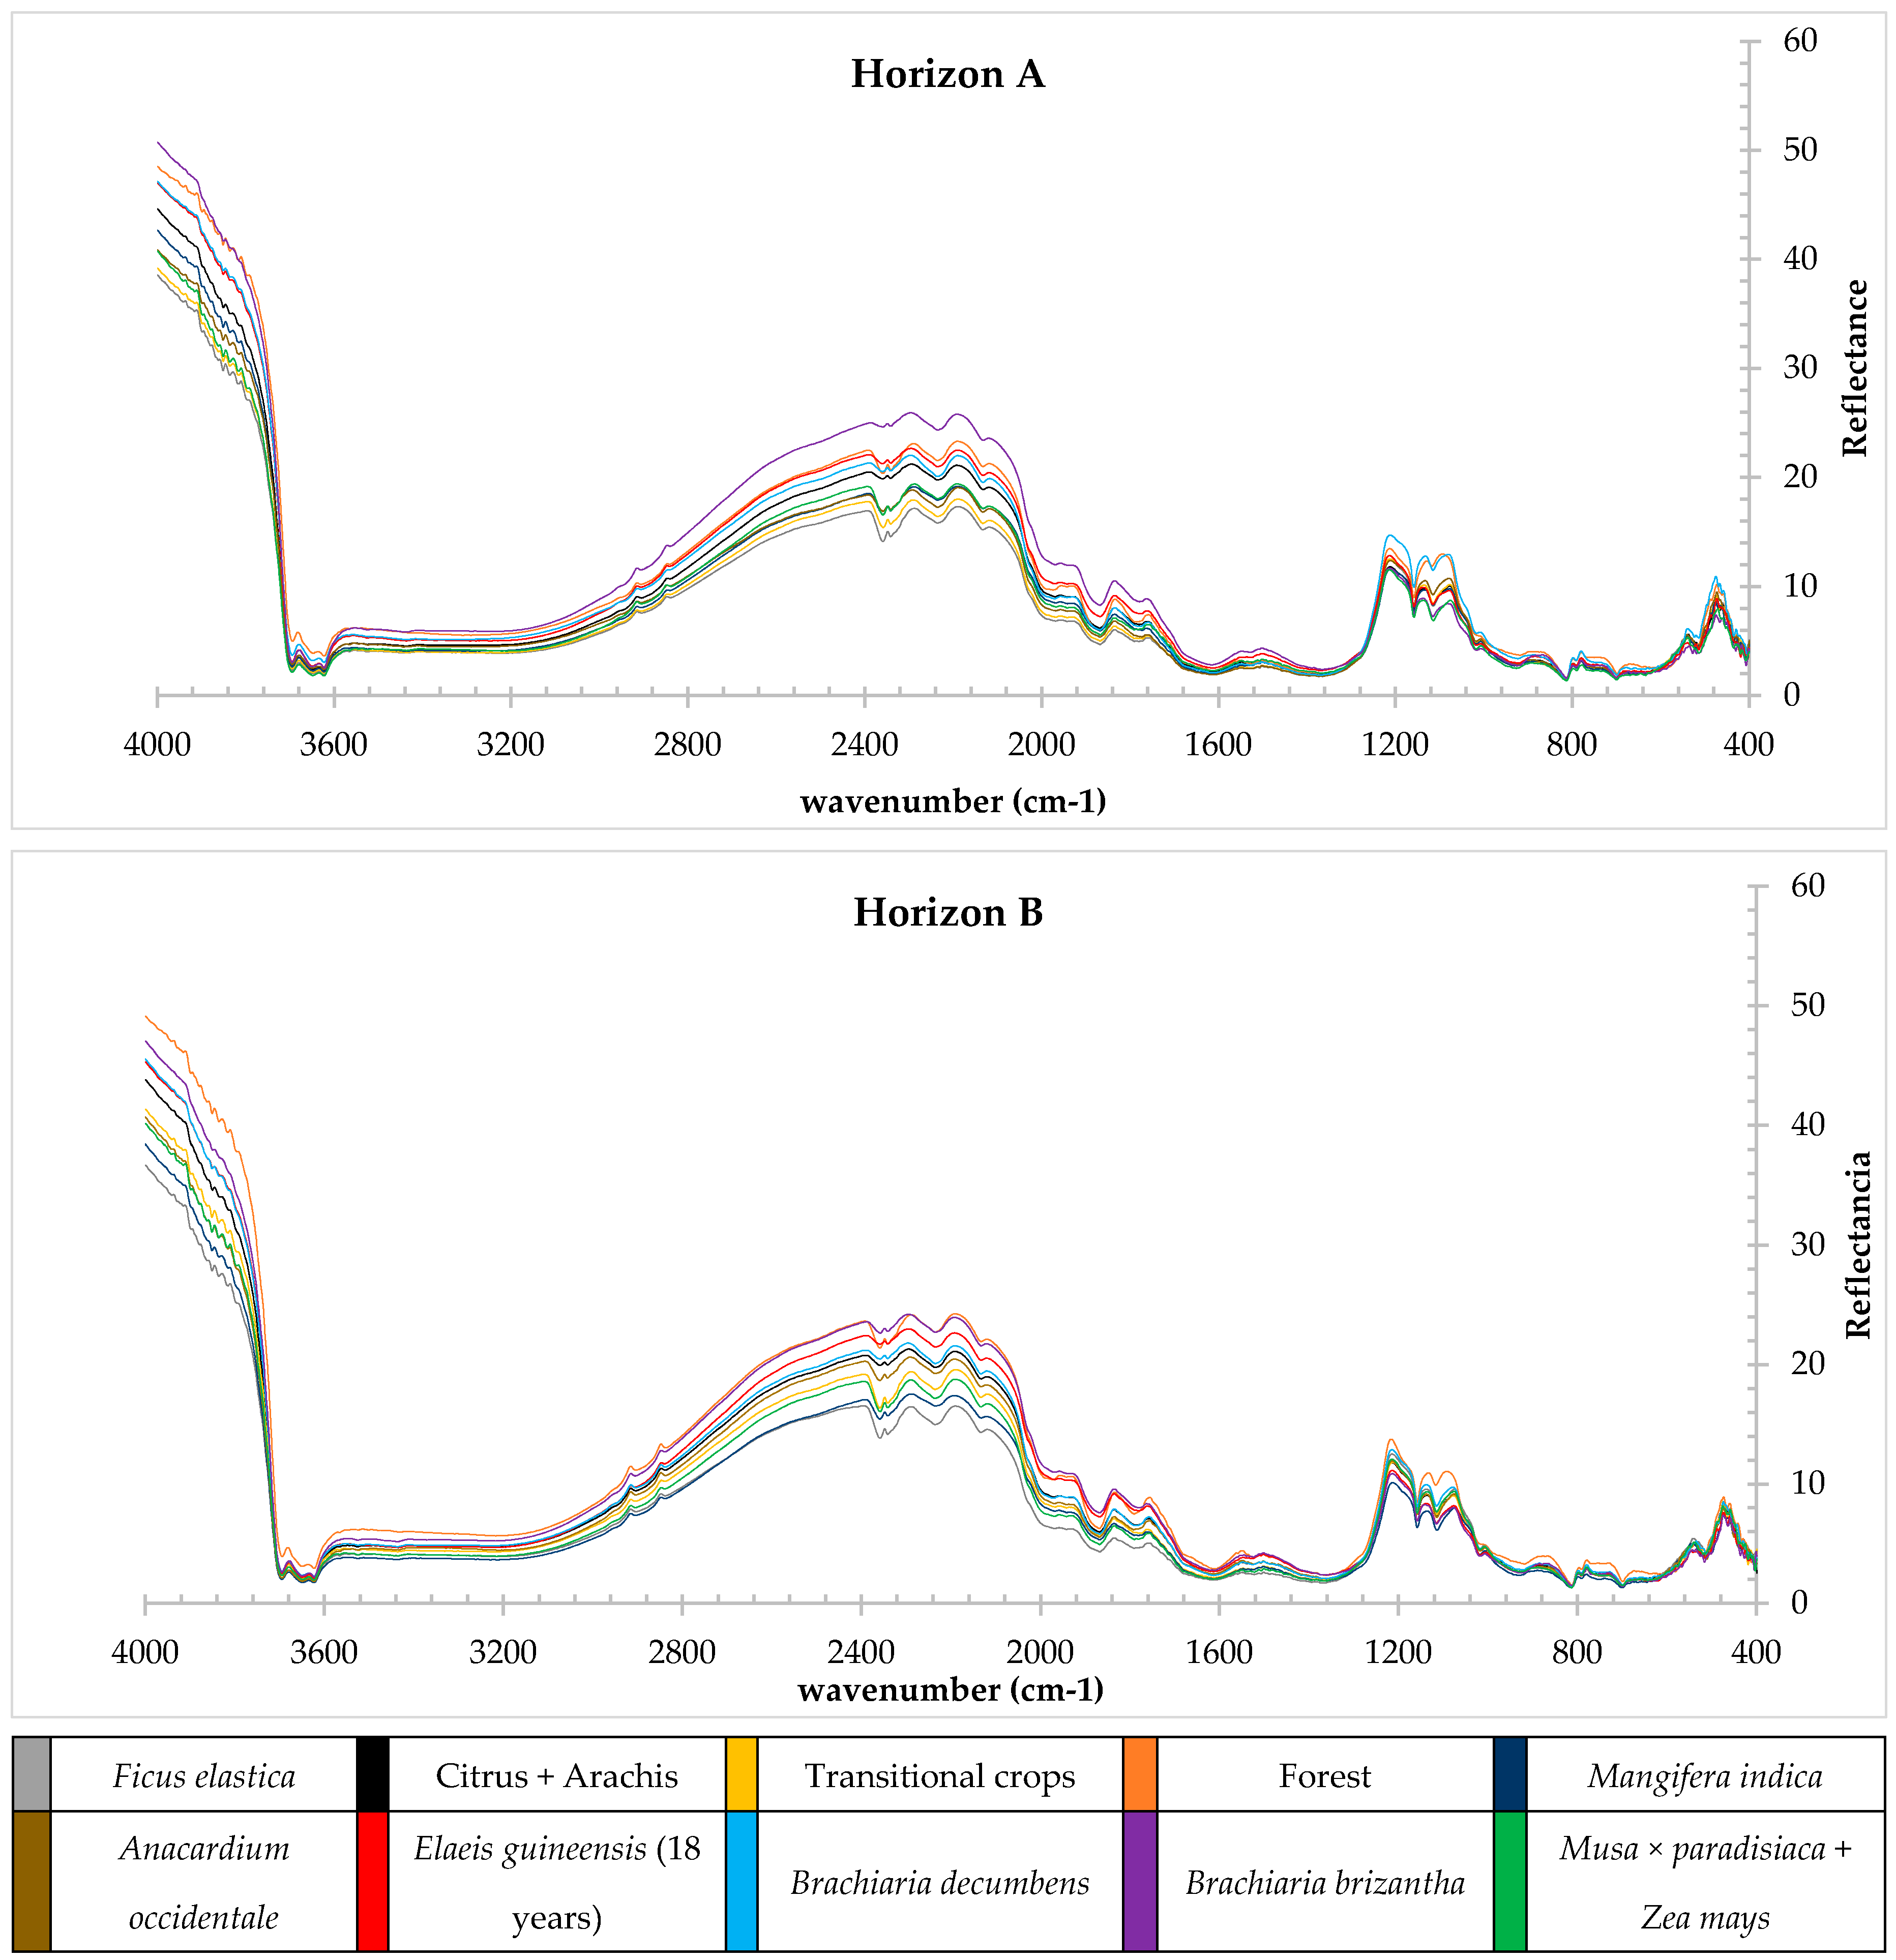
3.2. Spectral Characteristics of Soils

The spectral response of soils studied in the VIS-NIR region represents a typical curve of oxisol soils, as reported by [32,33]. Figure 1 shows the spectral curves for the different types of use in the first and second horizon. There it can be evidenced that its level of reflectance is conditioned to the use and occupation to which the soil has been subjected. In these curves, there are five regions with fairly marked absorption characteristics (400, 490, 1400, 1900, and 2200 nm), where some soil properties are easily identifiable. The absorption of energy between 400 and 1000 nm is attributed to the soil carbon content and to the presence of iron oxides, especially by minerals such as hematite and goethite present in a lesser proportion in the forest area in both the first and the second horizon. The absorption characteristics in the regions around 670 and 900 nm indicate the presence of iron oxides, which can be identified due to the slight concavity present in this region. The absorption bands of 1400 and 1900 nm are attributed to the content of hygroscopic water and 2:1 minerals as vermiculite and in the bands of 2200 and 2300 nm the kaolinite content can be clearly identified, with its absorbance being lower in the area, which confirms the information obtained in the mineralogical analysis of the clay fraction, where quantities higher than 50% of kaolinite were observed for the soils, less for the forest (30%–50%). The samples showed a positive tendency, which is characteristic in soils with high sand content [34].
As suggested by [35], there are three characteristics that must be observed in a spectral curve to detect qualitative variations: reflectance intensity (albedo), absorption characteristics (depth and amplitude), and spectral shape. In these soils the similarity between the 10 curves can be identified, both in shape and position of absorption peaks, but they differ in their value of reflectance and peak depth. As the soil properties are variable according to their use and coverage, the reflectance curves and the absorption characteristics change, especially their hue, depending on the soil use.
The spectral behavior of soils varied throughout the zones with respect to modifications in the physical behavior of soil, chemical, and mineralogical properties induced by management processes. It was evidenced how the reflectance of the samples is reduced as the dark tonality of the soil increases, attributing it to the vegetal material of its surface, observing greater the reflectance of the forest zone and the smaller zone of Ficus elastica culture for the horizon A, while according to the curve of the forest area it remained the one with the highest reflectance. For curves of lower reflectance, we can distinguish three different ones. Between 350 and 1400 nm is attributed to transitional crops, between 1400 and 1900 nm to Musa × paradisiaca + Zea mays and between 1900 and 2500 nm to Ficus elastica. The changes in reflectance intensity were caused by soil texture, mainly where soils with lower sand content showed a greater amount of energy reflected in whole spectrum, caused by the higher silt contents [36]; This was verified by [37] who found that in soils with more silt, the presence of degraded material in this fraction was responsible for the increase in reflectance intensity. Likewise, the reduction of reflectance by decreasing the content of sand in acid soils is directly attributed to the faint red coloration of the chromophores such as Fe- and Al, which causes the sand to be stained by reddish particles due to precipitation of iron in the surrounding quartz grains, diminishing its black hue to dark brown.
Soils have a low reflectance in the visible and infrared regions, coinciding with those found by [38]. This fact is due to the strong absorption due to the effect of the presence of Fe3+ in lengths of less than 540 nm. While in the region of 700–1100 nm, a tenuous peak of absorbance is observed where the content of Fe oxides is evidenced, being the most pronounced curve for the Musa × paradisiaca + Zea mays and lower for the Brachiaria decumbens in the first horizon. The cultivation of Ficus elastica, transients, and forest have a very dim concavity in this region, which is why they are attributed contents of smaller ferrous compounds, while Citrus + Arachis, Elaeis guineensis and Elaeis guineensis do not present a marked concavity, attributing scarce content of iron. On the contrary, in horizon B a concave curvature in the region between 750 and 1100 nm is evidenced for all the soils, being for the forest zone and the culture of Anacardium occidentale more marked, thus determining the greater proportion of ferrous compounds. These ferrous compounds are higher due to the high precipitation of the zone, which generates a downward movement of these compounds towards the second horizon.
In Figure 1 it can be observed that, despite having a higher percentage of organic carbon, the forest zone presents a higher reflectance than that of rubber when it was expected to happen otherwise. However, this is explained mainly because the texture and the cations play a very important role in the tonality of soils and to have high correlation with the absorption peaks is the most important property for the estimation of soil parameters. Different authors claim that cations play a decisive role in increasing reflectance [39,40]. Similarly, the 2:1 mineralogy of the clays contributes to the retention of cations at interchangeable sites, thus providing greater reflectance. When comparing the curves of the first and second horizon, it can be noted that the second horizon has a higher reflectance than the first horizon and this is attributed to the greater amount of minerals present in this horizon, as well as to the minimum amount of organic matter.
In soils with low organic matter content, the main changes that occur in the spectral curves can be identified from the comparison curves between attributes. These curves allow us to observe how one characteristic varies according to another when there is sufficient positive correlation (Ca and Ac. I) between samples, based on the analysis of the main changes that occur between the most heterogeneous zones. Some chemical characteristics of soils confer greater radiation absorption properties than others. Soils with high surface cover of plants and high levels of total carbon, as well as the lower treatment with fertilizers and low values of Ca and sand allow the spectral curves to diminish their value of reflectance giving the soils dark tonalities that have repercussions in the capacity of absorption, however the soil texture plays a very important role in determining the absorption of a soil, as high levels of minerals and carbonates with clear tones increase soil albedo. In [39] a positive correlation between K and reflectance was observed, whereas [41] found that the salts increase the reflectance of the spectra, so that the contents of K increase the reflectance of the soils with higher content of this component. It can also be observed how the variation of the soil use promotes a chemical reaction, not physical, which can be observed by the differences in the visible portion of the spectrum that increases as the content of organic material and content of calcite in the surface soils increases, giving them a clearer hue.
In the studied soils, can be observed how the spectral responses in the VIS-NIR region are governed mainly by the amount and tonality of certain compounds present in the soil. The content of organic matter, sands with high content of hematite and 10 uímicas and ferrous compounds generate dark tonalities in the soils and therefore less reflectance, whereas sands and clays with high levels of quartz or kaolinite, with high levels of calcium, magnesium, and potassium generate clear colorations in the soils and therefore increase their reflectance. The above can facilitate the identification and relation of the spectra with the properties of soils, however, the soils are very heterogeneous and the result of each one is a mixture of several components that determine its tone for physical-chemical configuration of each soil.
According to [42], the MIR region of the soil spectrum possesses a number of features greater and better defined than the spectra taken in the VNIR region. The main characteristic that can be observed in all soils is the sudden fall that occurs between the 4000 and 3600 cm−1. This drop is related to the voltage vibration of O\H [13,43,44]. Many of the characteristics in the infrared medium region, especially between 3400 and 1500 cm−1, can be attributed to organic molecules, such as aliphatic hydrocarbons, aromatic compounds, carboxylic acids, amines, amides, and some phosphorus compounds and sulfur. Several authors report that each type of bond has characteristics throughout the region of the spectrum. However, the specific location within that region may depend on the other elements and the structure of the compounds it forms. In Figure 2 can observe soil dominant components and absorption peaks for the VIS-NIR-MIR region.
Some spectra have characteristics at 3530, 3450, and 3385 cm−1 possibly linked to the N–H bond or 10 uímicas [44,45]. The minimum at 2925 and 2850 cm−1 are characteristic of C–H bonds in alkyl groups [44,45]. The area between 2000 and 1500 cm−1 may be ambiguous and include both the organic components, such as amide, carboxyl, and others with C HH, COO, CO, quartz, and kaolinite common silicate minerals [45]. The region of 1500 to 600 cm−1 is where the characteristics of the fundamental vibrations of silicate minerals are found. While the following bands characterized by low reflectance (1300, 1120, 1162 and 1074 to 1048, 1100, 1150 and 1110, 1020, 950–915, 815–800, 730–673, 500–480, and 430 cm−1) are possibly related to clay minerals such as ilite, smectite, kaolinite, and minimal amounts of silica [13,46,47,48].
The adsorption bands between 1740–1698 cm−1 and 1640–1600 cm−1 indicate the presence of C\O groups which are related to soil organic matter content [49,50]. It is of great importance to know the intensity of these bands, because with these can be estimated the hydrophilic organic components. It was found in [51] that these band lengths correlate significantly with OC groups and also with soil N.
Several bands allow estimation of soil properties in the MIR region, so it is vital to analyze the absorption peaks of the spectral curves for the soils. According to [2,49,50], apart from the bands named above, some specific bands of identification can be defined for some properties can be seen in the following image.
The above image shows the absorbance values of a typical spectral curve of soil. However, the curves shown in this research shows in their vertical axis the reflectance values for each type of soil. However, these curves can be compared thanks to the absorbance points defined in the previous image correspond to the points of lower reflectance in the curves of the soils studied.
In Figure 3 the smectite (k) can be recognized in the spectral bands near 3650 and 1600 cm−1, which represent a concave curvature upwards not very pronounced for the 3650 cm−1, but for the 1600 cm−1. For the two horizons, it can be noticed that the curves with the lowest reflectance in these regions are the association Musa × paradisiaca + Zea mays, but those crops that present the highest reflectance in these bands are the Forest in the 3650 cm−1 and the Pasto Toledo to the 1600 cm−1. At approximately 1550 cm−1, the characteristic absorption valley of kaolinite can be identified. The kaolinite is found in greater proportion in all soils except for forest soils, which is why the absorption valley for this curve is more tenuous. In the other soils, it is possible to observe how there is a similarity in the shape of the curve in the two horizons, thus demonstrating that the parental material of the soil is maintained to a great extent in both horizon A and B.
Regarding the quartz, its visual is very important in the spectral curves, because it is synonymous of presence of sand. In the previous curves, it is possible to observe how the depth of the peaks in the bands near the 1800, 1100, and 950 cm−1, are smaller for the horizon B, besides being closer together, for which it is possible to verify the information recorded in Table 1 and Table 2 where it is observed that the sand values are smaller in horizon B. In the graph of horizon B one can see that the reflectance is smaller than in the one of horizon A.
Calcium-related compounds can be identified in the range of 2200 to 2500 cm−1. In this range, a downward concave curvature can be seen, that having a higher reflectance value means that it does not have a large number of these components and therefore the radiation is not very absorbed in this range. In the graphs, it is observed that rubber is the crop that has the least amount of calcium in both horizons.

4. Conclusions

The different physical-chemical interactions of the crops with soil generate several changes in soil that are reflected in their spectral behavior, increasing or decreasing the albedo of their spectra. Soils increase the amount of reflected light as a result of the aluminum and iron compounds as well as the level of calcium and quartz they possess, while soils with high levels of organic matter in their structure tend to have lower reflectance.
The soils of the forest region in both horizons represent the highest reflectance spectral response in the VIS-NIR region, due to its lighter hue, which is due to its high content of silt and potassium.
The cultivation of Ficus elástica, despite having the lowest content of organic carbon and the highest sand content, does not represent the area with the highest reflectance, since the color of the soil is modified by the interaction of the organic matter with the other chemical properties of soil, especially clays.

Acknowledgments

We thank engineers Jesús Camacho and Janeth Gonzalez, the Agustín Codazzi Geographical Institute, and the Agronomy and Engineering Faculties of the National University of Colombia for allowing us to acquire soil samples, conduct physicochemical analyses, and use the soil laboratory to obtain the spectral images, as well as for their comments and contributions to the research.

Author Contributions

The writing was made by Javier M. Martín-López and discussed and corrected with Giovanna Quintero-Arias. The experiments were conducted, analyzed, and processed by Javier M. Martín-López and the translation was done by Giovanna Quintero-Arias.

Conflicts of Interest

The authors declare no conflict of interest.

References

  1. Yong, H.M.H.; García, A.; Hernandez, A.; Songa, H. Prediction of soil macronutrients content using near-infrared spectroscopy. Comput. Electron. Agric. 2007, 58, 144–153. [Google Scholar]
  2. Viscarra, R.R. Visible, near infrared, mid infrared or combined diffuse reflectance spectroscopy for simultaneous assessment of various soil properties. Geoderma 2006, 131, 59–75. [Google Scholar] [CrossRef]
  3. Deaville, E.; Flinn, P. Near-Infrared (NIR) Spectroscopy: An Alternative Approach for the Estimation of Forage Quality and Voluntary Intake; The Centre for Agriculture and Bioscience International (CABI) Publishing: Wallingford, UK, 2000; pp. 301–320. [Google Scholar]
  4. Reeves III, J.B. Use of Near-Infrared Reflectance Spectroscopy. Farm Animal Metabolism and Nutrition; The Centre for Agriculture and Bioscience International (CABI) Publishing: Wallingford, UK, 2000; Volume 9, pp. 184–209. [Google Scholar]
  5. Norris, K.; Barnes, R.; Moore, J.; Shenk, J. Predicting forage quality by infrared reflectance spectroscopy. J. Anim. Sci. 1976, 43, 889–897. [Google Scholar] [CrossRef]
  6. Fahey, G.C.; Hussein, H. Forage quality symposium. Forty years of forage quality research: Accomplishments and impact from an animal nutrition perspective. Crop Sci. 1999, 39, 4–12. [Google Scholar] [CrossRef]
  7. Williams, P.C.; Norris, K.H. Qualitative applications of near infrared reflectance spectroscopy. In Near-Infrared Technology in the Agricultural and Food Industries; Williams, P., Norris, K., Eds.; American Association of Cereal Chemists: St. Paul, MN, USA, 2009; pp. 241–246. [Google Scholar]
  8. Viscarra Rossel, R.A.; Lark, R.M. Improved analysis and modelling of soil diffuse reflectance spectra using wavelets. Eur. J. Soil Sci. 2009, 60, 453–464. [Google Scholar] [CrossRef]
  9. Chodak, M.; Khanna, P.; Horvarth, B.; Beese, F. Near infrared spectroscopy for determination of total and exchangeable cations in geologically heterogeneous forest soils. J. Near Infrared Spectrosc. 2004, 12, 315–324. [Google Scholar] [CrossRef]
  10. Sorensen, L.; Dalsgaard, S. Determination of clay and other soil properties by near infrared spectroscopy. Soil Sci. Soc. Am. J. 2005, 69, 159–167. [Google Scholar] [CrossRef]
  11. Cohen, M.; Prenger, J.; DeBusk, W. Visible-Near infrared reflectance spectroscopy for rapid, non-destructive assessment of wetland soil quality. J. Environ. Qual. 2005, 34, 1422–1434. [Google Scholar] [CrossRef] [PubMed]
  12. Guerrero, C. Near-infrared spectroscopy to estimate the maximum temperatures reached on burned soils. Soil Sci. Soc. Am. J. 2007, 71, 1029–1037. [Google Scholar] [CrossRef]
  13. Nguyen, T.; Janik, L.; Raupach, M. Diffuse reflectance infrared Fourier transform (DRIFT) spectroscopy in soil studies. Aust. J. Soil Res. 1991, 29, 49–67. [Google Scholar] [CrossRef]
  14. Ben-Dor, E.; Banin, A. Near infrared analysis (NIRA) as a method to simultaneously evaluate spectral featureless constituents in soils. Soil Sci. 1995, 4, 259–270. [Google Scholar] [CrossRef]
  15. Scheinost, A.; Chavernas, A.; Barrón, V.; Torrent, J. Use and limitations of second-derivative diffuse reflectance spectroscopy in the visible to near-infrared range to identify and quantify Fe oxides in soils. Clays Clay Miner. 1998, 46, 528–536. [Google Scholar] [CrossRef]
  16. Minasny, B.; McBratney, A.B. Regression rules as a tool for predicting soil properties from infrared reflectance spectroscopy. Chemom. Intell. Lab. Syst. 2008, 94, 72–79. [Google Scholar] [CrossRef]
  17. Janik, L. Rapid prediction of soil water retention using mid infrared spectroscopy. Soil Sci. Soc. Am. 2007, 71, 507–514. [Google Scholar] [CrossRef]
  18. Rodríguez, M.A. Indicadores Ambientales Para el uso del Suelo. 2005. Available online: www.dama.gov.co (accessed on 9 February 2017). [Google Scholar]
  19. Orlando, O.J.; Sandra, M.J.B.; Gustavo, N.V.L. Caracterización morfo-agronómica y molecular de mandarina ‘Arrayana’ en el piedemonte del Meta (Colombia). Rev. Corpoica Cienc. Tecnol. Agropec. 2012, 13, 5–12. (In Spanish) [Google Scholar]
  20. Orduz, J.O.; Baquero, J. Aspectos basicos para el cultivo de los cítricos en el piedemonte llanero. Rev. Achagua. 2003, 7, 7–20. (In Spanish) [Google Scholar]
  21. Rincón, C.A.; Caicedo, G.S. Monitoreo de las condiciones de los suelos establecidos con la asociación maíz/pastos para la recuperación praderas degradadas en el piedemonte llanero. In Proceedings of the En: Memorias del XV Congreso colombiano de la ciencia del suelo, “El suelo: Soporte de la biodiversidad y la producción en los agroecosistemas tropicales”, Pereira, Colombia, 27–29 Octubre 2010. (In Spanish)
  22. Janeth, G.N. Efecto del Uso y Ocupación en las Propiedades Físicas y Químicas en un Suelo del Piedemonte Llanero. Master’s Thesis, Universidad Nacional de Colombia, Bogota, Colombia, 2014. [Google Scholar]
  23. Bisquerra, R. Metodología de la Investigación Educativa; La Muralla: Madrid, Spain, 2004; p. 59. (In Spanish) [Google Scholar]
  24. Norusis, M.J. SPSS 11.0 Guide to Data Analysis; Prentice Hall: Upper Saddle River, NJ, USA, 2002. [Google Scholar]
  25. Gaviria, S.; Faivre, P. Génesis y evolución mineralógica de oxisoles de los. Anal. Geogr. 2005, 1, 50–64. (In Spanish) [Google Scholar]
  26. Instituto Geografico Agustín Codazzi (IGAC). Estudio Semidetallado de los Suelos del Centro de Investigaciones Agropecuairas de Carimagua ICA—CIAT; Departamento del Meta. Instituto Geografico Agustín Codazzi, Subdirección de Agrología: Bogota, Colombia, 1983; p. 291. (In Spanish)
  27. Malagon, C.D. Ensayo sobre tipología de suelos colombianos—Énfasis en génesis y aspectos ambientales. Rev. Acad. Colomb. Cienc. 2003, 27, 319–341. (In Spanish) [Google Scholar]
  28. Zenaida, L.P.; Alvaro, M.; Mary, H.R.; Carlos, B.; Adriana, O.; Alexis, T.; Carmen, R.; Marcia, T. Cambios en las propiedades quimicas de un suelo de sabana luego de la introducción de pasturas mejoradas. Bioagro 2010, 22, 135–144. (In Spanish) [Google Scholar]
  29. Garavito, N.F. Introducción a Los Suelos; Instituto Geografico Agustín Codazzi (IGAC): Bogota, Colombia, 2012. (In Spanish)
  30. Elizabeth, H.; del Carmen, G.M.; Enrique, R.J.; Jorge, A. Caracterización del Suelo y Plantas de un Sitio Contaminado Con Hidrocarburos. Available online: http://www.redalyc.org/articulo.oa?id=57324403 (accessed on 25 September 2014). (In Spanish)
  31. Rubiano, Y. Sistema Georreferenciado de Indicadores de Calidad del Suelo. Herramienta SIG Para Apoyo a la Planificación, uso y Manejo del Suelo. Ph.D. Thesis, Universidad Nacional de Colombia, Palmira, Colombia, 2005. [Google Scholar]
  32. GenúI, A.M.; Demattê, J.A.M. Prediction of soil chemical attributes using optical remote sensing. Acta Sci. Agron. 2004, 33, 4. [Google Scholar] [CrossRef] [Green Version]
  33. Camacho-Tamayo, J.H.; Rubiano, S.Y.; Hurtado, S.M.P. Near-infrared (NIR) diffuse reflectance spectroscopy for the prediction of carbon and nitrogen in an Oxisol. Agron. Colomb. 2014, 32, 86–94. [Google Scholar] [CrossRef]
  34. Dematte, J.A.M.; Huete, A.R.; Ferreira, L.G., Jr.; Alves, M.C.; Nanni, M.R.; Cerri, C.E. Evaluation of tropical soils through ground and orbital sensors. In Proceedings of the 2nd International Conference Geospatial Information in Agriculture and Forestry Veridian, Lake Buena Vista, FL, USA, 2000.
  35. Demattê, J.A.M. Characterization and discrimination of soils by their reflected electromagnetic energy. Pesqui. Agropecu. Bras. 2002, 37, 1445–1458. [Google Scholar] [CrossRef]
  36. Giron-Rios, Y.; Oleschko-Lutkova, K.; Parrot, J.; Hernandez-Alcantara, J.M.; García, E.C.; Velazquez-García, J.J. Analisis fractal de la reflectancia de los suelos salinos. Agrociencia 2009, 43, 403–416. (In Spanish) [Google Scholar]
  37. Dematteê, J.A.M.; Garcia, G.J. Alteration of soil properties through a weathering sequence as evaluated by spectral reflectance. Soil Sci. Soc. Am. J. 1999, 63, 327–342. [Google Scholar] [CrossRef]
  38. Formaggio, A.R.; Epiphanio, J.C.N.; Valeriano, M.M.; Oliveira, J.B. Comportamento espectral (450–2450 nm) de solos tropicais de Sao Paulo (Spectral behavior (450–2450 nm) of tropical soils from Sao Paulo State, Brazil). Braz. J. Soil Sci. 1996, 20, 467–474. (In Spanish) [Google Scholar]
  39. Schreirer, H. Quantitative prediction of chemical soil conditions from multiespectral airbone, ground and laboratory measurements. In Proceedings of the 4th Canadian Symposium on Remote Sensing, Ottawa, QC, Canada, 17–18 May 1977; pp. 107–112.
  40. Janik, L.J.; Merry, R.H.; Skjemstad, J.O. Can mid infrared diffuse reflectance analysis replace soil extractions? Aust. J. Exp. Agric. 1998, 38, 681–696. [Google Scholar] [CrossRef]
  41. Singh, A.N.; Dwivedi, R.S. The utility of Landsat imagery as an integral part of the data base for small-scale soil mapping. Int. J. Remote Sens. 1986, 7, 1099–1108. [Google Scholar] [CrossRef]
  42. McDowell, M.L.; Bruland, G.L.; Deenik, J.L.; Grunwald, S.; Knox, N.M. Soil total carbon analysis in Hawaiian soils with visible, near-infrared and mid-infrared diffuse reflectance spectroscopy. Geoderma 2012, 189–190, 312–320. [Google Scholar] [CrossRef]
  43. Clark, R.N.; King, T.V.V.; Klejwa, M.; Swayze, G.A. High spectral resolution reflectance spectroscopy of minerals. J. Geophys. Res. 1990, 95, 12653–12680. [Google Scholar] [CrossRef]
  44. Gaffey, S.J.; McFadden, L.A.; Nash, D.; Pieters, C.M. Ultraviolet, visible, and nearinfrared reflectance spectroscopy: Laboratory spectra of geologic materials. In Remote Geochemical Analysis: Elemental and Mineralogical Composition; Pieters, C.M., Englert, P.A., Eds.; Cambridge University Press: Cambridge, UK, 1993; pp. 43–77. [Google Scholar]
  45. Stuart, B. Infrared Spectroscopy: Fundamentals and Applications; John Wiley & Sons Ltd.: West Sussex, UK, 2004. [Google Scholar]
  46. Farmer, V.C. The layer silicates. In The Infrared Spectra of Minerals; Farmer, V.C., Ed.; Bartholomew Press: Surrey, UK, 1974; pp. 331–363. [Google Scholar]
  47. Moenke, H.H.W. Silica, the three-dimensional silicates, borosilicates, and beryllium silicates. In The Infrared Spectra of Minerals; Farmer, V.C., Ed.; Bartholomew Press: Surrey, UK, 1974; pp. 365–382. [Google Scholar]
  48. Van der Marel, H.W.; Beutelspacher, H. Atlas of Infrared Spectroscopy of Clay Minerals and Their Admixtures; Elsevier Scientific Publishing Company: Amsterdam, The Netherlands, 1976. [Google Scholar]
  49. Celi, L.; Schnitzer, M.; Nègre, M. Analysis of carboxyl groups in soil humic acids by wet chemical method, Fourier-transform infrared spectrophotometry and solution-state carbon-13 nuclear magnetic resonance. A comparative study. Soil Sci. 1997, 162, 189–197. [Google Scholar] [CrossRef]
  50. Ellerbrock, R.H.; Kaiser, M. Stability and composition of different soluble soil organic matter fraction evidence from δ13C and FTIR signatures. Geoderma 2005, 128, 28–37. [Google Scholar] [CrossRef]
  51. Matějkova, Š.; Šimon, T. Application of FTIR spectroscopy for evaluation of hydrophobic/hydrophilic organic components in arable soils. Plant Soil Environ. 2012, 58, 192–195. [Google Scholar]
Figure 1. Spectral responses of the soils studied in the VIS-NIR region horizon A and horizon B.
Jimaging 03 00010 g001
Figure 2. Vischarra Rossel (2006). Soil dominant components and absorption peaks for the VIS-NIR-MIR region: quartz (Q) as sand, organic compounds (OC), calcite (Ca), kaolinite (K), smectite (S), and (OH) characteristics of mineral water, and lattice.
Jimaging 03 00010 g002
Figure 3. Spectral responses of soils studied in the MIR region horizon A and horizon B.
Jimaging 03 00010 g003
Table 1. Geographical location of sampling soil pits.
Use/OccupationLocationUse/OccupationLocation
LatitudeLongitudeLatitudeLongitude
Transitory crops4°03,445′73°28,074′Brachiaria decumbens4°03,445′73°28,196′
4°03,998′73°26,674′4°03,397′73°28,189′
4°03,949′73°26,726′4°03,401′73°28,227′
4°03,944′73°26,793′4°03,400′73°28,161′
Ficus elastica4°03,845′73°26,874′Citrus + Arachis4°03,649′73°27,446′
4°03,888′73°26,960′4°03,641′73°27,485′
4°03,868′73°26,960′4°03,626′73°27,568′
4°03,836′73°26,939′4°03,617′73°27,605′
Musa × paradisiaca + Zea mays4°03,617′73°27,693′Mangifera indica4°03,423′73°28,036′
4°03,615′73°27,702′4°03,444′73°28,034′
4°03,613′73°27,717′4°03,448′73°28,001′
4°03,606′73°27,719′4°03,423′73°27,998′
Elaeis guineensis (18 years)4°03,613′73°27,755′Forest cultivation4°05,532′73°26,580′
4°03,568′73°27,757′4°05,532′73°26,592′
4°03,529′73°27,750′4°05,680′73°26,587′
4°03,493′73°27,727′4°05,676′73°26,579′
Brachiaria brizantha4°03,439′73°28,430′Anacardium occidentale4°03,385′73°28,461′
4°03,474′73°28,440′4°03,382′73°28,451′
4°03,480′73°28,398′4°03,395′73°28,445′
4°03,439′73°28,387′4°03,393′73°28,452′
Table 2. Thickness, pH, exchangeable acidity, available phosphorus calcium, magnesium, potassium, sodium, organic carbon, sand, lime, and clay of horizon A.
CropsThicknesspHAc. IP Disp.CICCaMgKNaCOSandMudClay
(mm)(cmol/kg)(%)
Ficus elastica407.54.02.402.608.70.2750.080.130.0751.15053.0816.4031.79
Musa × paradisiaca + Zea mays332.54.51.3013.407.90.6480.300.170.0551.17547.4616.5536.20
Elaeis guineensis (18 years)322.54.51.900.1410.80.8300.100.120.0401.16347.0715.5537.50
Brachiaria brizantha255.05.11.4045.808.61.2480.720.210.0781.25046.2117.8236.07
Brachiaria decumbens345.04.61.309.408.90.8730.070.240.1081.08854.4118.6817.92
Citrus + Arachis412.54.71.6018.309.30.6100.170.260.1231.19343.2321.0723.58
Mangifera indica367.53.93.806.4013.00.7100.160.280.1131.50046.8414.7238.30
Forest cultivation252.54.00.311.1011.10.2900.080.180.1181.42540.0624.3929.02
Anacardium occidentale277.54.61.7011.2013.40.9350.570.330.1051.35043.6518.6941.90
Table 3. Thickness values, pH, exchangeable acidity, available phosphate cation exchange capacity, calcium, magnesium, potassium, sodium, organic carbon, sand, lime, and clay of horizon B.
CropsThicknesspHAc. IP Disp.CICCaMgKNaCOSandMudClay
(mm)(cmol/kg)(%)
Ficus elastica240.04.51.600.148.40.2200.030.080.0330.80351.1315.4337.74
Musa × paradisiaca + Zea mays160.04.61.500.006.70.2950.040.120.0550.79550.3516.1733.37
Elaeis guineensis (18 years)215.04.52.100.7910.91.2150.110.140.0601.62554.5516.3031.30
Brachiaria brizantha232.54.62.700.7910.40.3700.140.110.0700.79849.5418.5033.29
Brachiaria decumbens292.54.91.600.008.20.5500.030.200.1250.47549.5717.0431.22
Citrus + Arachis192.54.80.990.0011.10.7630.570.590.1030.86839.7516.9043.74
Mangifera indica237.54.72.100.148.50.3280.030.180.0830.79540.0417.0638.89
Forest cultivation182.54.32.900.008.90.2400.050.130.1030.67533.3923.5837.87
Anacardium occidentale217.54.52.700.5711.10.4050.120.260.0880.85558.1818.3715.91
Table 4. Pearson correlation for the physicochemical properties of soils with different uses and coverages. * The correlation is significant at the 0.05 level (bilateral); ** The correlation is significant at the 0.01 level (bilateral).
CropsThicknesspHAc. IP Disp.CICCaMgKNaCOSandMudClay
(mm)(cmol/kg)(%)
Thickness1−0.2780.1010.2680.0850.138−0.055−0.0220.2300.3810.175−0.126−0.237
pH 1−0.3650.432−0.3330.4050.4450.227−0.052−0.3880.013−0.1380.038
Ac. I 1−0.1900.273−0.128−0.256−0.188−0.026−0.0340.139−0.2520.038
P Disp. 1−0.0970.577 *0.685 **0.1050.0960.336−0.0500.054−0.016
CIC 10.3370.3090.4600.3130.539 *−0.0880.0610.135
Ca 10.625 **0.3310.0310.576 *0.152−0.2510.070
Mg 10.611 **0.1100.289−0.228−0.0490.389
K 10.518 *0.074−0.2560.0000.154
Na 10.020−0.3580.548 *−0.246
CO 10.088−0.016−0.005
Sand 1−0.531 *−0.566 *
Mud 1−0.276
Clay 1

