Terahertz Application for Non-Destructive Inspection of Coated Al Electrical Conductive Wires

Department Materials Science and Engineering, Graduate School of Engineering, Tohoku University, Sendai 980-8576, Japan
*
Author to whom correspondence should be addressed.
J. Imaging 2017, 3(3), 27; https://doi.org/10.3390/jimaging3030027
Submission received: 30 April 2017
/
Revised: 10 July 2017
/
Accepted: 11 July 2017
/
Published: 14 July 2017
(This article belongs to the Special Issue THz and MMW Imaging)
Abstract
:At present, one of the main inspection methods of electric wires is visual inspection. The development of a novel non-destructive inspection technology is required because of various problems, such as water invasion by the removal of insulators. Since terahertz (THz) waves have high transparency to nonpolar substances such as coatings of conductive wire, electric conductive wires are extremely suitable for THz non-destructive inspection. In this research, in order to investigate the quantitative possibility of detecting the defects on aluminum electric wire, THz wave reflection imaging measurement was performed for artificially disconnected wires. It is shown that quantitative detection is possible for the disconnect status of the aluminum electric wire by using THz waves.
1. Introduction
1.1. THz Wave and Applications
Terahertz (THz) waves are electromagnetic waves in the frequency range between approximately 0.1 and 10 THz, which is at the middle of radio waves and light waves. Therefore, THz wave has characteristics of both, as represented by high transparency to nonpolar substances and good reflectivity to metal surfaces.
Previous work on THz wave generation based on the excitation of phonon-polaritons in GaP was done by Nishizawa and Suto [1], and various kinds of THz light sources have been developed for practical applications. In our research group, we reported a frequency-tunable light source based on difference frequency generation using GaP and GaSe crystals [2,3].
The frequency 1 THz corresponds to a quantum energy of about 4.1 meV, which is relatively low—about one hundred thousandth of X-ray. Hence, it is safe for the human body. In addition, since the energy of the THz wave corresponds to various vibrations, such as intermolecular vibration, phonon vibration, and hydrogen bonding, it is possible to identify substances with its use. Because of such properties, THz waves are expected to be applied in various fields. But among them, application as a new non-destructive inspection technology in place of conventional infrared/visible light and X-rays is expected. Examples of the application of THz waves in industrial fields include internal defect inspection and structural analysis of polymer materials [4] and applications of non-destructive imaging inspection to space-shuttle ceramic style bonded state [5], as well as tablet surface defect analysis [6]; in the medical field, the non-destructive inspection of cancer cells [7] has been reported. For imaging measurement, high spatial resolution measurements have been studied by using near-field techniques [8,9,10,11].
1.2. Cable Covered by Insulator
Stable power supply networks are indispensable from everyday life to industrial operation, and as importance increases, the deterioration of electric wires becomes a serious problem. Polyethylene insulation-covered electric wires are mainly used as electric power cables, but polyethylene is invisible and the wire cannot be inspected inside by visual inspection. The traditional electric wire inspection method is visual inspection, which has some drawbacks. For example, the need of skillful inspectors, removal of insulators, and danger. Since THz waves pass through a covering material of nonpolar substance, we can detect the wave reflected from the internal wire surface. Therefore, it is expected to be a non-destructive inspection method for invisible insulated wires.
Although copper is mainly used for electric wire, aluminum is a metal that has been replacing copper in recent years. The reason is that the electric wire can be thick because the electric resistance of aluminum is about 60% compared to copper, but aluminum is very light. It is said that if the same electric resistance wires were made of copper and aluminum, the total cost of the aluminum wire would be one-third that of copper. Conversely, several problems (e.g., connection between aluminum wires) remain, but problems have been overcome by connection after removing surface oxide film. Additionally, the wire disconnection process is different for copper and aluminum wires. In the case of copper wire, pitting corrosion causes disconnection due to stress corrosion cracking, whereas in the case of aluminum wire, after the pitting corrosion progresses, the current path becomes narrower and then the wire is heat fused. In this paper, we reproduced the disconnection process of aluminum wires and performed imaging measurement.
2. Materials and Methods
2.1. Measurement Sample
As mentioned above, aluminum disconnection occurs via the process of gradually thinning the strand at the pitting generation point. Therefore, trying to reproduce the disconnection process with an actual wire becomes an irreversible change because of the requirement of cutting the strand. Since the aluminum wire has been pulled with a large force in use, the cross-section view is oblong with four straight sides. Hence, as a preliminary experiment, assuming an uncoated electric wire, we reproduced the disconnection process of aluminum sample by using 0.2 mm-thick aluminum tape and Zeonex plate (refractive index: 1.53). It is desirable that the substrate be highly transparent for the THz wave. We have selected Zeonex, as it is a highly transparent substrate material [14]. Figure 1 shows photographs of the aluminum sample duplicating disconnection process. This sample reproduces strands of 2.5 mm aluminum electric wire by affixing 0.2 mm-thick aluminum tape to the Zeonex plate with high THz wave permeability. For disconnection process imaging, the strand width decrement corresponding to the defects is applied to each sample. In this study, the measurement sample is prepared including the defect parts of 0 mm, 0.5 mm, 1.0 mm, 1.5 mm, 2.0 mm, 2.5 mm width and 1 mm length, respectively. Sub-THz wave reflection imaging measurement was carried out.
2.2. Terahertz Reflection Imaging Measurement
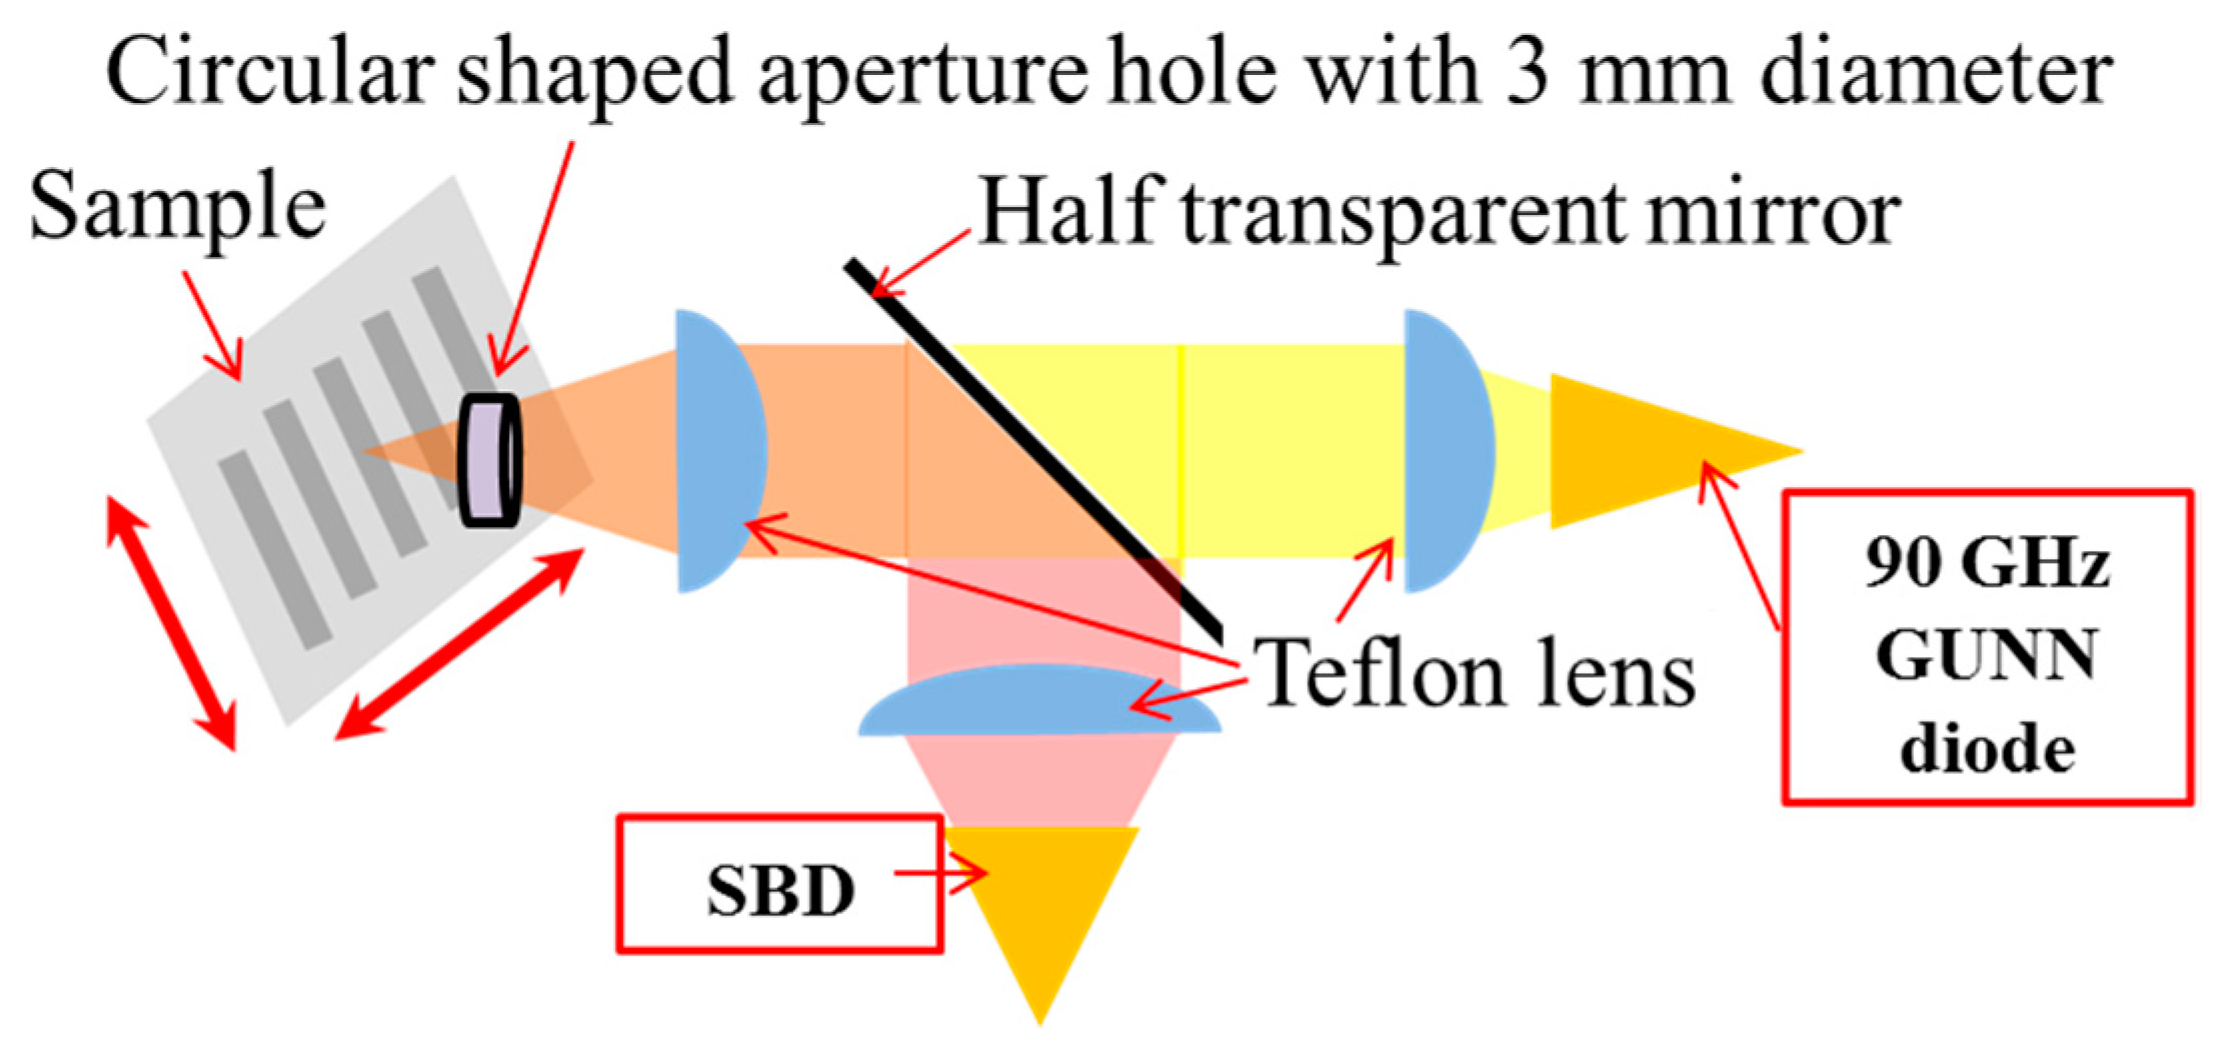
A schematic diagram of the reflection imaging system is shown in Figure 2. A 90 GHz GUNN diode (Millitech, Northampton, MA, USA) was used for the THz light source. Since the light source is a continuous wave, it has sufficient and steady intensity. Hence, we did not use a lock-in amplifier. The generated THz waves were collimated by a Teflon lens and then focused on the sample surface by a Teflon lens. The beam diameter of the light source was an ellipse with a width of 10 mm and a length of 7 mm, and it was squeezed by placing a circular aperture hole with 3 mm diameter in front of the sample. The reflected and scattered THz waves from the surfaces were collected by Teflon lens, and the reflected waves were detected by a Schottky barrier diode (SBD). An image corresponding to the position of the sample surface was obtained by measuring the reflection intensity in shifting the sample with surface normal to incident direction. Scan time was about an hour in the present experimental setup. The sample was scanned in the vertical direction and the horizontal direction with respect to the optical axis, and the interval was 0.25 mm. Measurement was conducted an average number of three times at room temperature in air atmosphere.
3. Results and Discussion
The experimental results are shown in Figure 3. We can see the clear increase of reflection intensity at the aluminum surface, and the reflection intensity decreased greatly in the defect region surrounded by the dotted line as the defect became larger. The reason is expected to be that the reflection intensity of THz wave is smaller when the aluminum width at the defect point is smaller. From this result, the detectivity for the disconnection state of aluminum wire by using THz wave is confirmed.
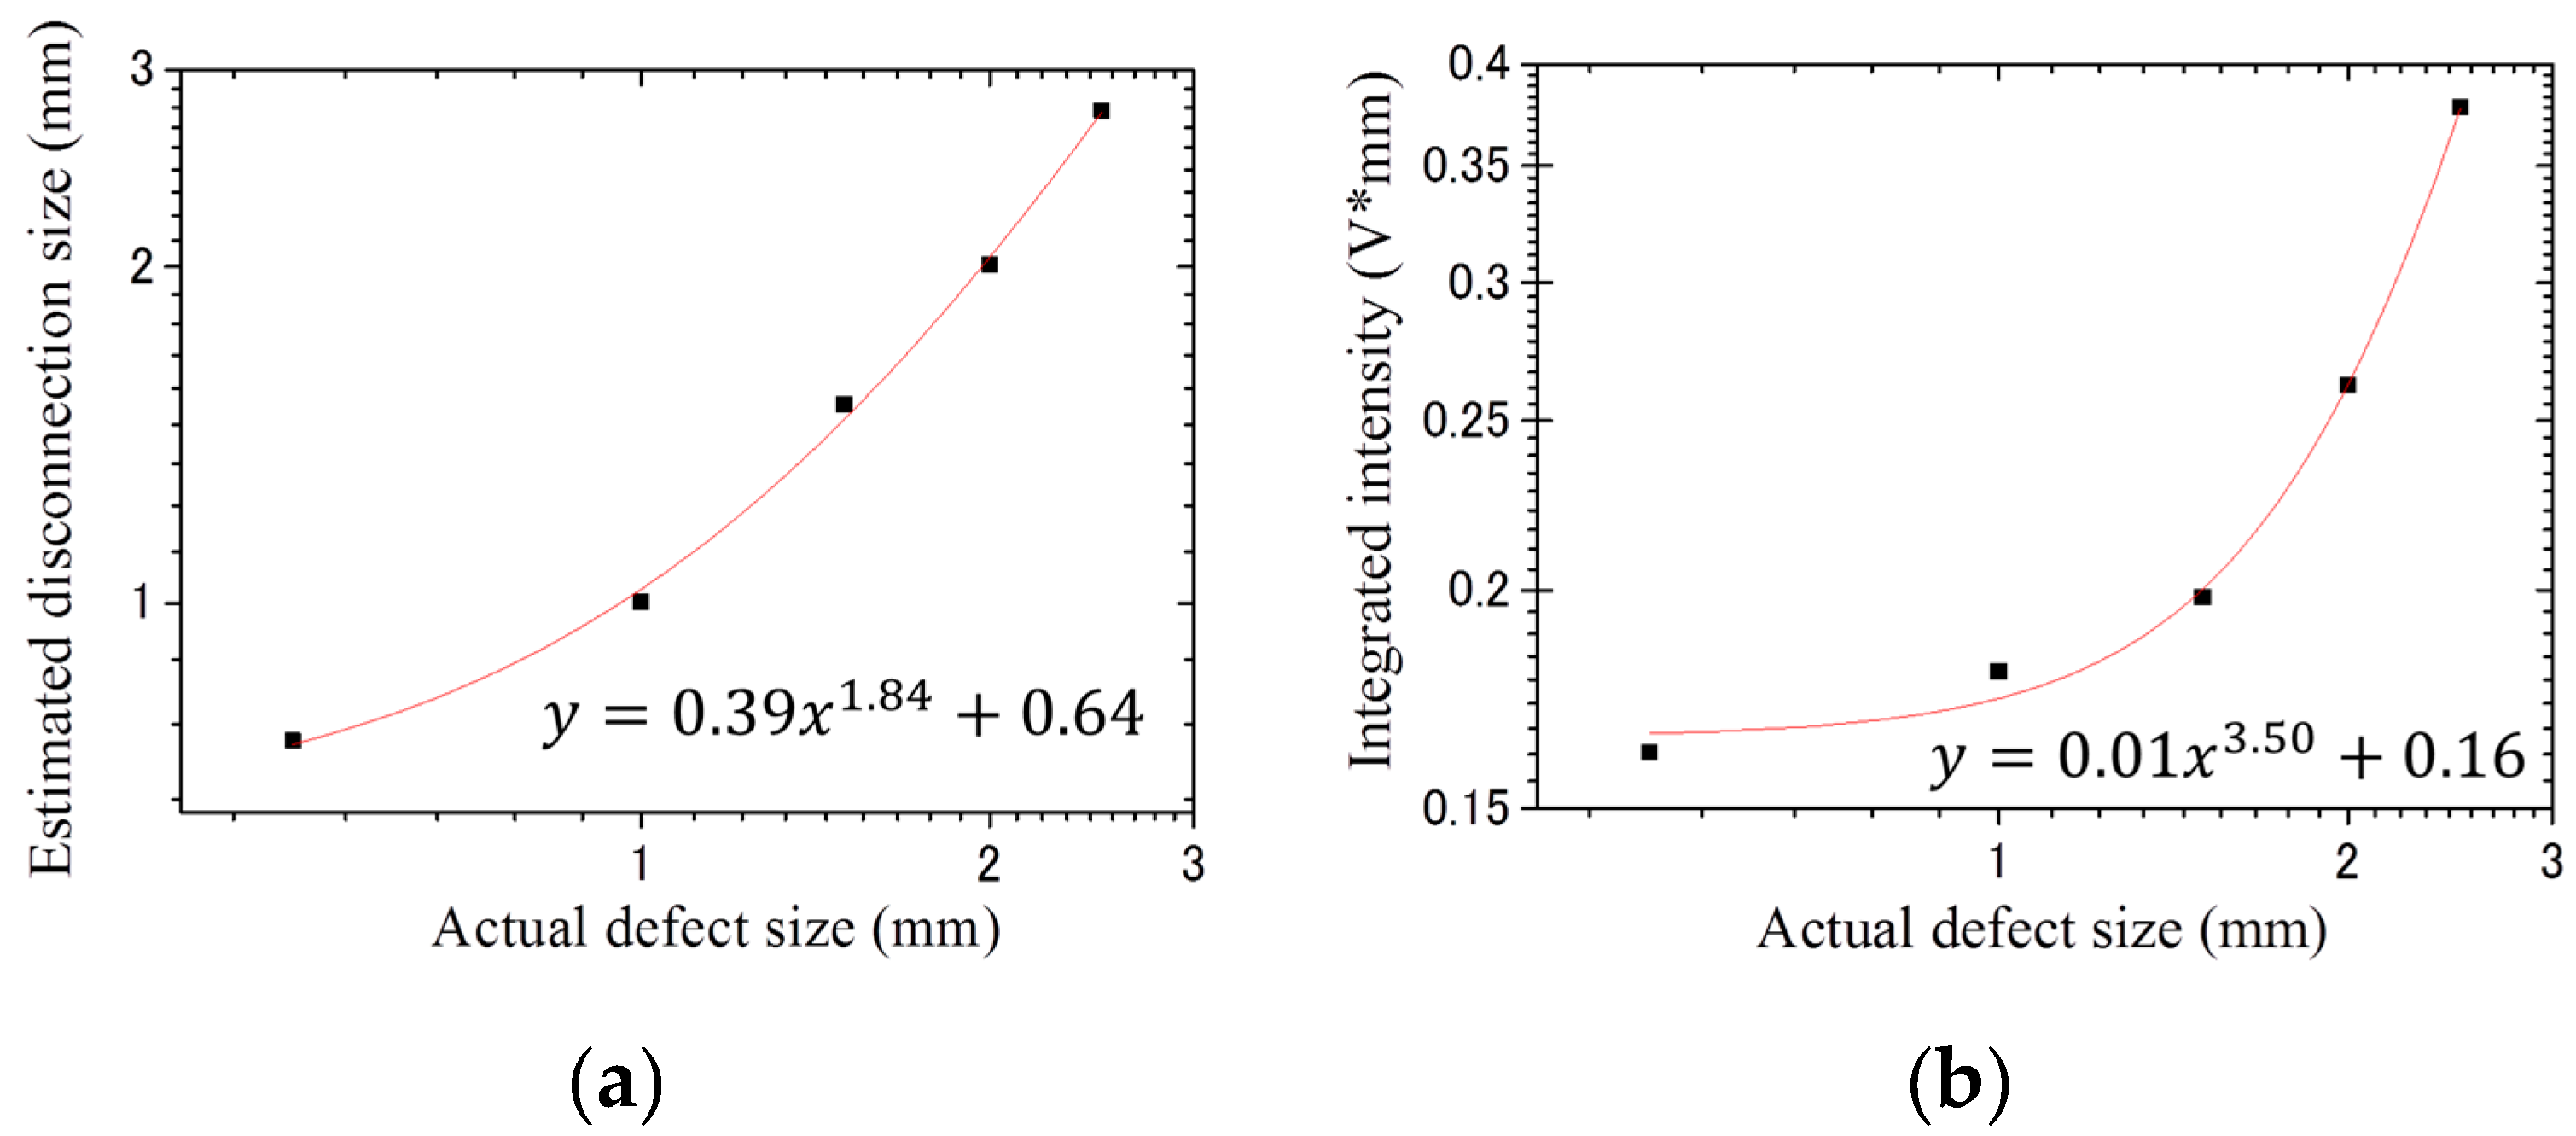
As a quantitative evaluation method, we defined the difference between the positive and negative maximum values obtained by differentiating the reflection intensity in the horizontal direction at the defect part (Figure 3b) as the estimated defect width (Figure 3c). Comparison with the actual defect width is shown in Figure 4a. By using nonlinear approximation of the estimated defect wire width, it was possible to obtain a good approximation of the actual defect width. The integrated intensity of the reflection at each defect position is plotted to the actual defect width, as shown in Figure 4b. As a result, similar to Figure 4a, good approximation results were obtained by nonlinear approximation.
The wavelength of 90 GHz is about 3 mm in free space, but the spatial resolution in this experiment obtained was determined to be 0.5 mm. The present confocal optical configuration may be attributed to the effect of overcoming the THz wave length limit and excluding back-scattered light due to a circular aperture hole with 3 mm diameter. When the length at the defect part is larger than the measurement wavelength, we should consider only the horizontal direction. However, in this measurement, a spatial resolution of 0.5 mm beyond the diffraction limit was obtained, even though the measurement was carried out with the length of 1 mm at the defect part. From this result, the influence of aperture was considered to be effective. This inspection method can be applied to other metals with a high refractive index similar to aluminum. These results show the possibility of detecting disconnected aluminum wires by using THz waves.
4. Conclusions
We fabricated a disconnection model of aluminum wire by using 0.2 mm-thick aluminum tape and Zeonex plate, and measured its reflection intensity by using 90 GHz wave. In the defect region, as the defect became larger, the reflection intensity decreased greatly. The quantitative detectivity for the disconnection state of aluminum wire by using THz wave was confirmed. Then, as an evaluation method, we defined the difference between the positive and negative maximum values obtained by differentiating the reflection intensity in the horizontal direction at the defect part as the estimated defect width, and compared it with the actual defect width. From the correlation of the actual defect size and the estimated defect size, spatial resolution was smaller than the measurement wavelength of 90 GHz wave due to the aperture arrangement in front of the sample. It was shown that quantitative disconnection detection of aluminum wires by using THz wave is confirmed.
Acknowledgments
A part of this study is financially supported by the “Fundamental Research and Human Resources Development Program for Nuclear Decommissioning related to Integrity Management of Critical Structures including Primary Containment Vessel and Reactor Building, and Fuel Debris Processing and Radioactive Waste Disposal” carried out under the Center of World Intelligence Project for Nuclear S&T and Human Resource Development by the Ministry of Education, Culture, Sports, Science and Technology of Japan.
Author Contributions
Yutaka Oyama conceived and designed the experiments, Kenta Kuroo mainly preformed the experiments, Kenta Kuroo, Tadao Tanabe and Yutaka Oyama analyzed the data; Ryo Hasegawa contributed materials/analysis tools; Kenta Kuroo, Tadao Tanabe and Yutaka Oyama wrote the paper.
Conflicts of Interest
The authors declare no conflict of interest.
References
- Nishizawa, J.; Suto, K. Semiconductor Raman laser. J. Appl. Phys. 1980, 51, 2429–2431. [Google Scholar] [CrossRef]
- Tanabe, T.; Suto, K.; Nishizawa, J.; Kimura, T.; Saito, K. Frequency-tunable high-power terahertz wave generation from GaP. J. Appl. Phys. 2003, 93, 4610–4615. [Google Scholar] [CrossRef]
- Tanabe, T.; Suto, K.; Nishizawa, J.; Sasaki, T. Characteristics of terahertz-wave generation from GaSe crystals. J. Phys. D 2004, 37, 155–158. [Google Scholar] [CrossRef]
- Palka, N.; Miedzinska, D. Detailed non-destructive evaluation of UHMWPE composites in the terahertz range. Opt. Quant. Electron. 2014, 46, 515–525. [Google Scholar] [CrossRef]
- Zimdars, D.; Valdmanis, J.A.; White, J.S.; Stuk, G.; Williamson, S.; Winfree, W.P.; Nadaras, E.I. Technology and applications of terahertz imaging non-destructive examination: Inspection of space shuttle sprayed on foam insulation. AIP Conf. Proc. 2005, 760, 570–577. [Google Scholar]
- Niwa, M.; Hiraishi, Y. Quantitative analysis of visible surface defect risk in tablets during film coating using terahertz pulsed imaging. Int. J. Pharm. 2014, 461, 342–350. [Google Scholar] [CrossRef] [PubMed]
- Wahaia, F.; Kasalynas, I.; Seliutra, D.; Molis, G.; Urbanowicz, A.; Silva, C.D.C.; Carneiroe, F.; Valusisb, G.; Granja, P.L. Study of paraffin-embedded colon cancer tissue using terahertz spectroscopy. J. Mol. Struct. 2015, 1079, 448–453. [Google Scholar] [CrossRef]
- Chen, H.-T.; Kersting, R.; Cho, G.C. Terahertz imaging with nanometer resolution. Appl. Phys. Lett. 2003, 83, 3009–3011. [Google Scholar] [CrossRef]
- Serita, K.; Mizuno, S.; Murakami, H.; Kawayama, I.; Takahashi, Y.; Yoshimura, M.; Mori, Y.; Darmo, J.; Tonouchi, M. Scanning laser terahertz near-field imaging system. Opt. Express 2012, 20, 12959–12965. [Google Scholar] [CrossRef] [PubMed]
- Zhao, J.; Chu, W.; Guo, L.; Wang, Z.; Yang, J.; Liu, W.; Cheng, Y.; Xu, Z. Terahertz imaging with sub-wavelength resolution by femtosecond laser filament in air. Sci. Rep. 2014, 4, 1–7. [Google Scholar] [CrossRef] [PubMed]
- Pham, H.H.N.; Hisatake, S.; Minin, O.V.; Nagatsuma, T.; Minin, I.V. Enhancement of spatial resolution of terahertz imaging systems based on terajet generation by dielectric cube. APL Photonics 2017, 2, 056106. [Google Scholar] [CrossRef]
- Oyama, Y.; Zhen, L.; Tanabe, T.; Kagaya, M. Sub-Terahertz Imaging of Defects in Building Blocks. NDT E Int. 2009, 42, 28–33. [Google Scholar] [CrossRef]
- Takahashi, S.; Hamano, T.; Nakajima, K.; Tanabe, T.; Oyama, Y. Observation of damage in insulated copper cables by THz imaging. NDT E Int. 2014, 61, 75–79. [Google Scholar] [CrossRef]
- Sengupta, A.; Bandyopadhyay, A.; Bowden, B.F.; Harrington, J.A.; Federici, J.F. Characterisation of olefin copolymers using terahertz spectroscopy. Electron. Lett. 2006, 42, 1477–1479. [Google Scholar] [CrossRef]
Figure 1.
The optical photo of aluminum wire disconnection process reproduced sample (tilt is only for illustration).
Figure 1.
The optical photo of aluminum wire disconnection process reproduced sample (tilt is only for illustration).
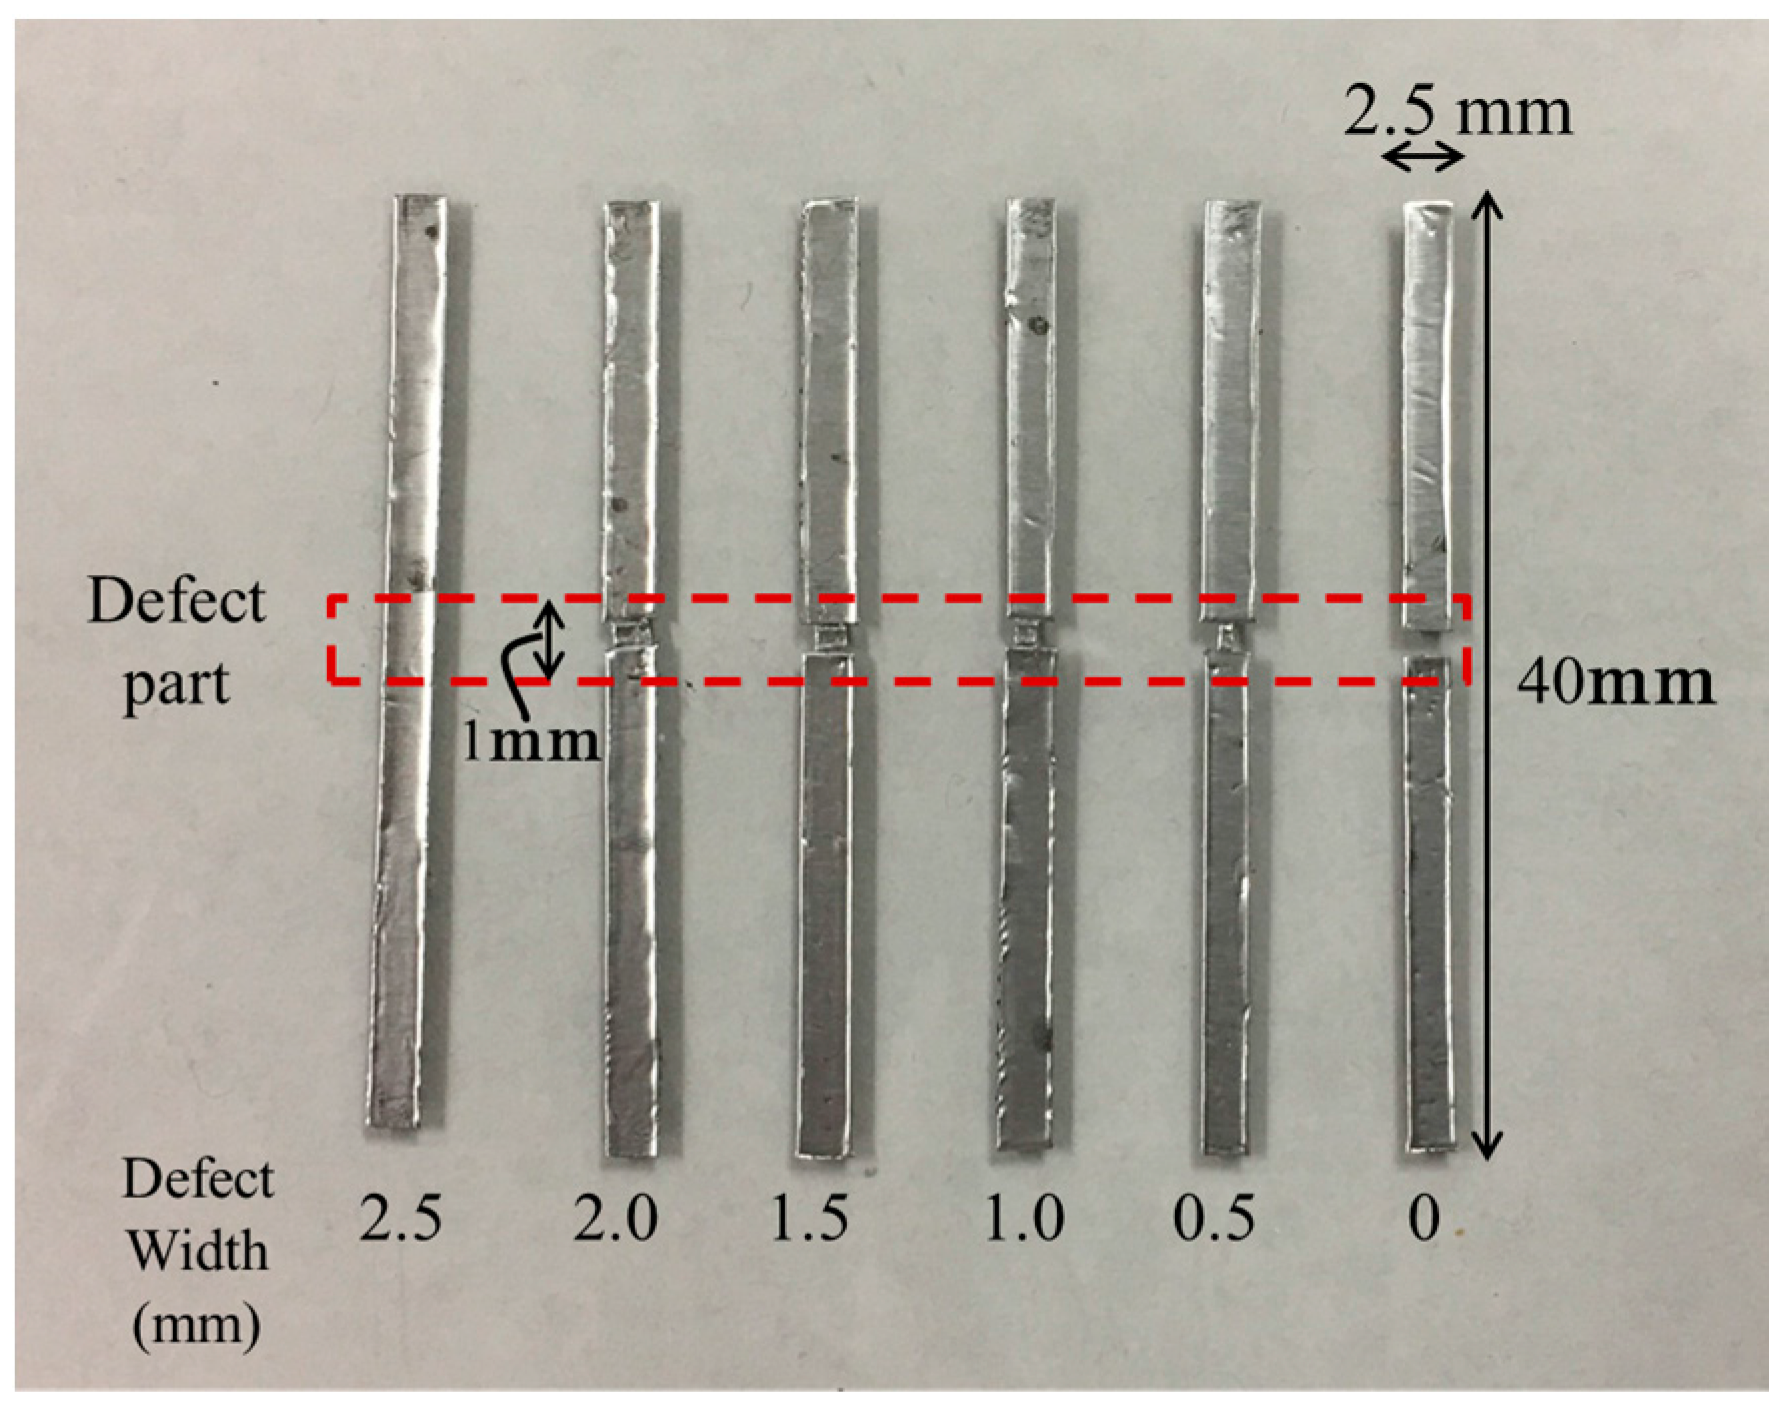
Figure 2.
The optical schematic system of THz reflection imaging measurement. SBD: Schottky barrier diode.
Figure 2.
The optical schematic system of THz reflection imaging measurement. SBD: Schottky barrier diode.

Figure 3.
Quantitative analysis of imaging results: (a) THz imaging measurement result (the dotted line shows the defect part); (b) Reflection intensity in horizontal movement at the defect part; (c) Reflection intensity change in horizontal movement at the defect part.
Figure 3.
Quantitative analysis of imaging results: (a) THz imaging measurement result (the dotted line shows the defect part); (b) Reflection intensity in horizontal movement at the defect part; (c) Reflection intensity change in horizontal movement at the defect part.
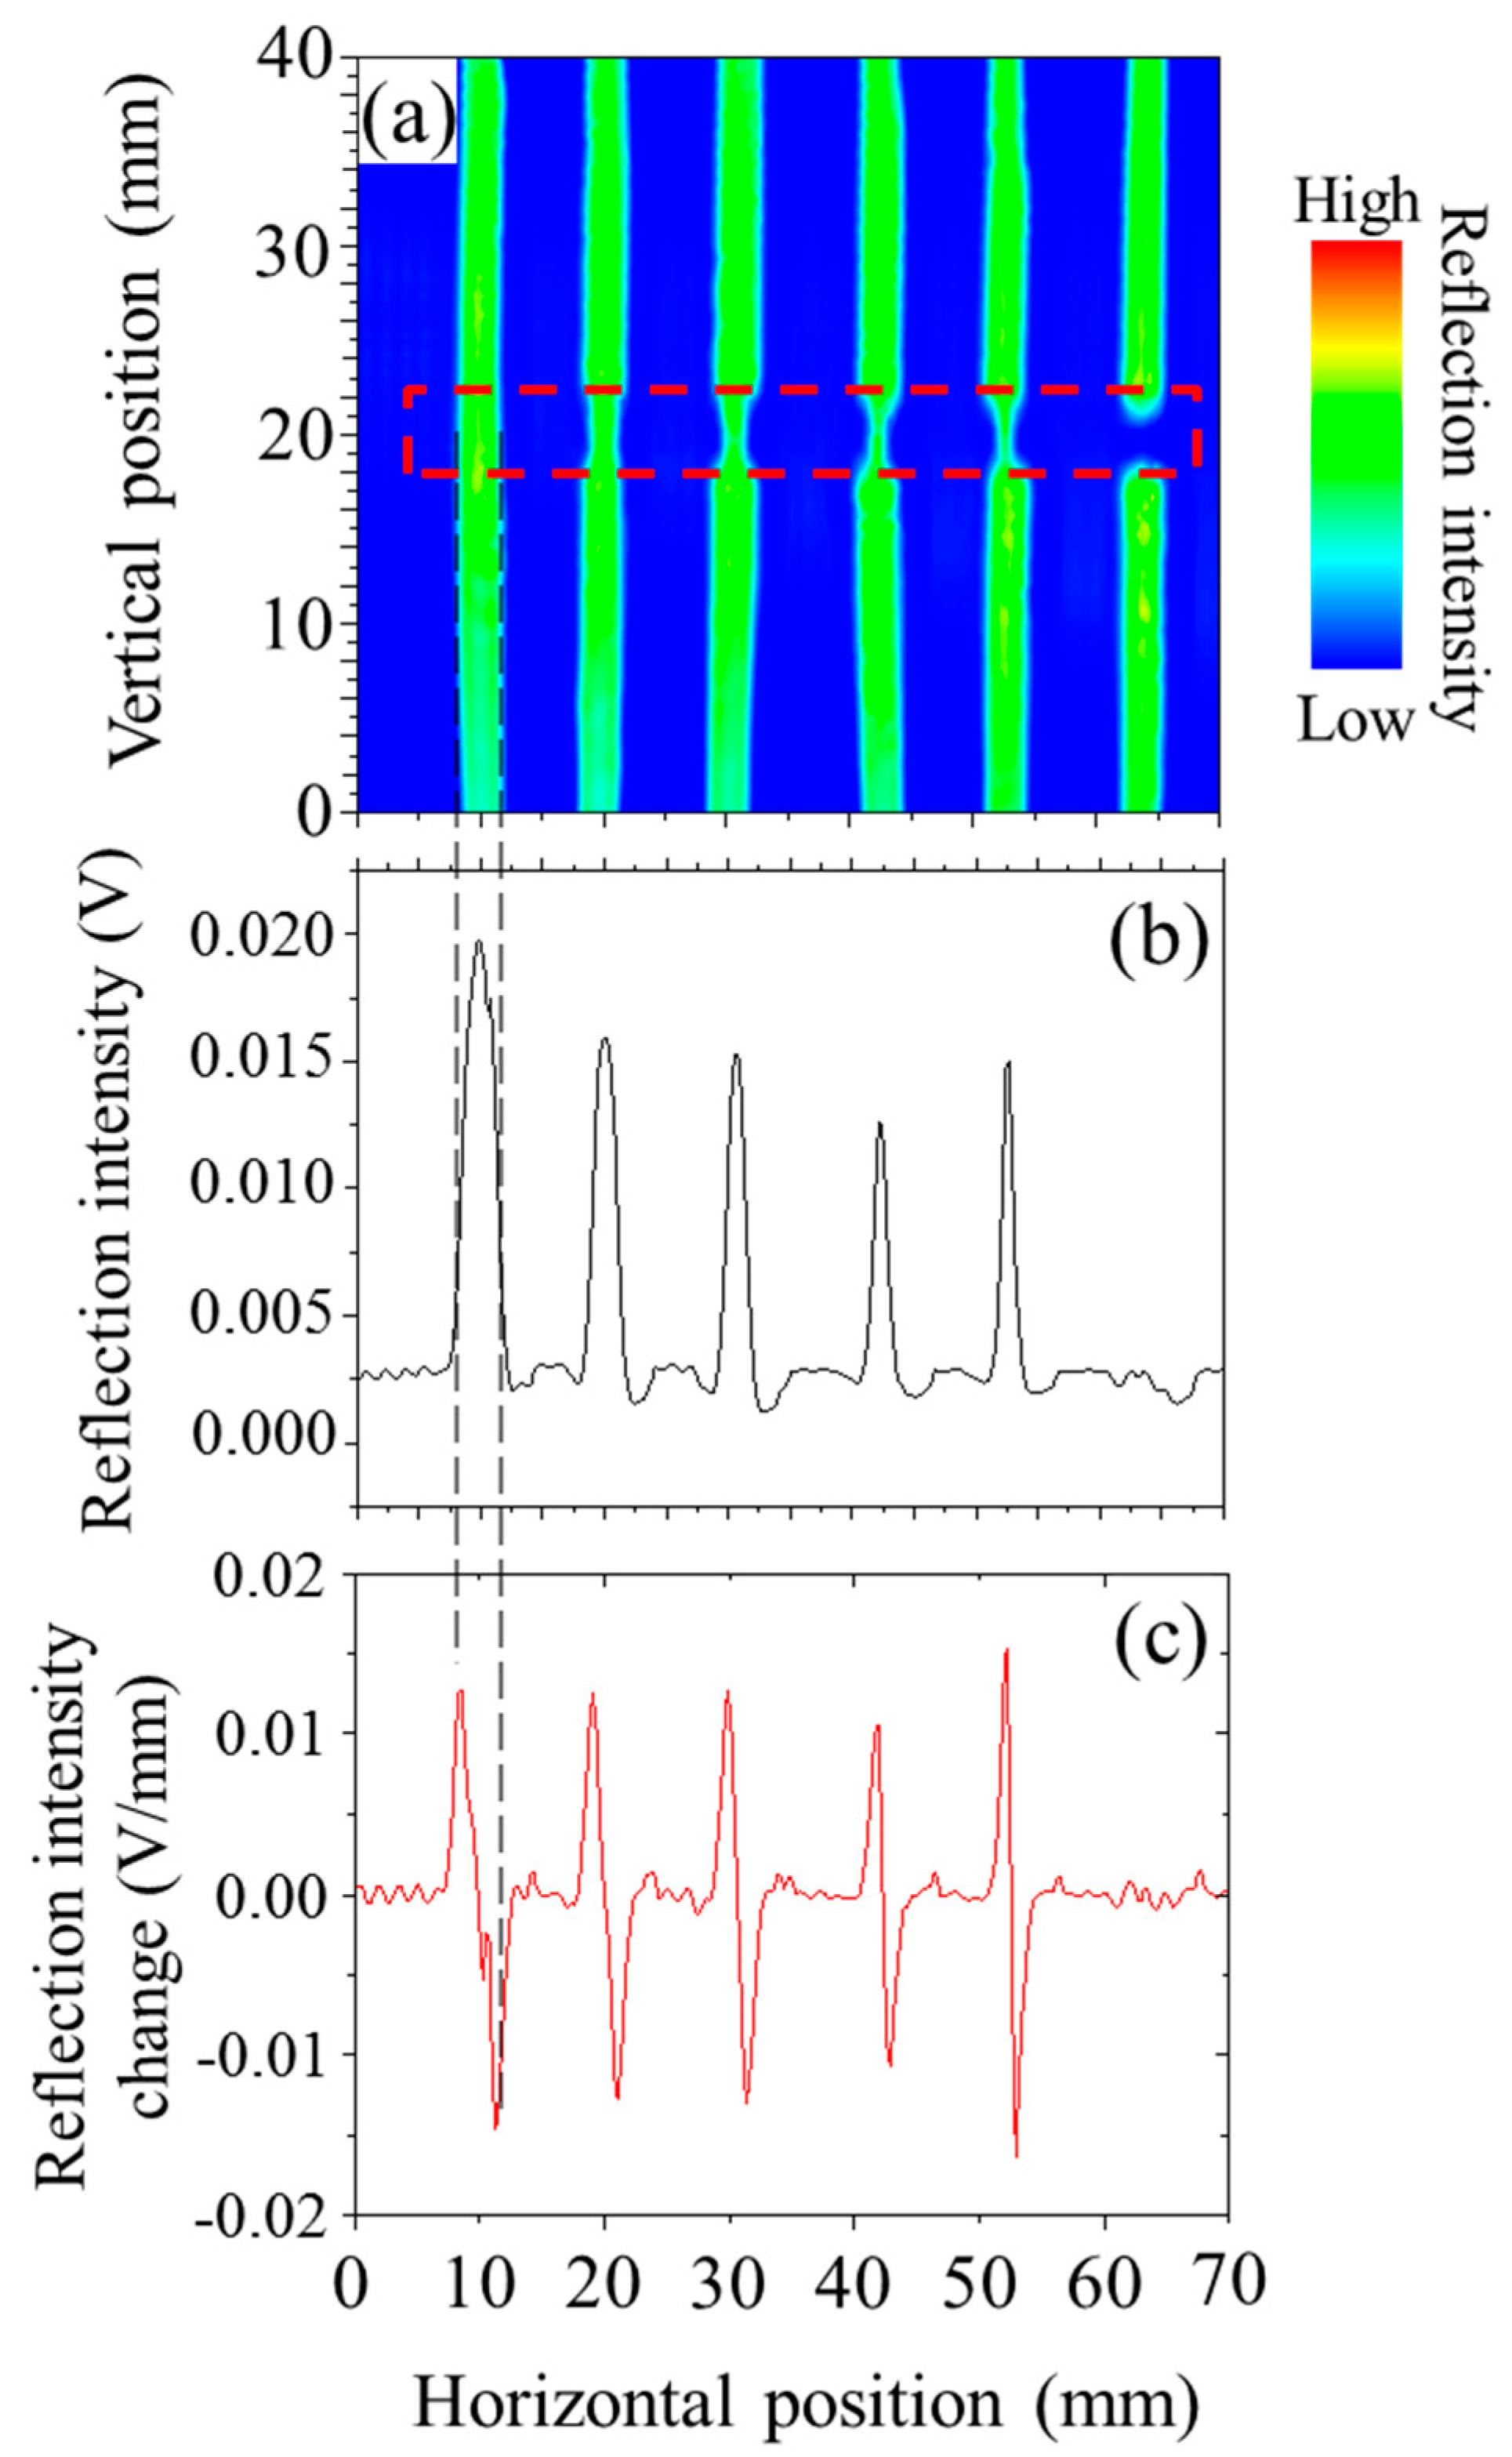
Figure 4.
(a) Relationship between actual defect width and estimated defect width; (b) Relationship between actual defect width and integrated intensity.
Figure 4.
(a) Relationship between actual defect width and estimated defect width; (b) Relationship between actual defect width and integrated intensity.
© 2017 by the authors. Licensee MDPI, Basel, Switzerland. This article is an open access article distributed under the terms and conditions of the Creative Commons Attribution (CC BY) license (http://creativecommons.org/licenses/by/4.0/).
Share and Cite
MDPI and ACS Style
Kuroo, K.; Hasegawa, R.; Tanabe, T.; Oyama, Y. Terahertz Application for Non-Destructive Inspection of Coated Al Electrical Conductive Wires. J. Imaging 2017, 3, 27. https://doi.org/10.3390/jimaging3030027
AMA Style
Kuroo K, Hasegawa R, Tanabe T, Oyama Y. Terahertz Application for Non-Destructive Inspection of Coated Al Electrical Conductive Wires. Journal of Imaging. 2017; 3(3):27. https://doi.org/10.3390/jimaging3030027
Chicago/Turabian StyleKuroo, Kenta, Ryo Hasegawa, Tadao Tanabe, and Yutaka Oyama. 2017. "Terahertz Application for Non-Destructive Inspection of Coated Al Electrical Conductive Wires" Journal of Imaging 3, no. 3: 27. https://doi.org/10.3390/jimaging3030027
Note that from the first issue of 2016, this journal uses article numbers instead of page numbers. See further details here.