Article

A Tomograph Prototype for Quantitative Microwave Imaging: Preliminary Experimental Results

1
Department of Electrical, Electronic, Telecommunications Engineering, and Naval Architecture, University of Genoa, 16145 Genoa, Italy
2
Department of Technology and Innovation, University of Applied Sciences of Southern Switzerland, 6928 Manno, Switzerland
*
Author to whom correspondence should be addressed.
J. Imaging 2018, 4(12), 139; https://doi.org/10.3390/jimaging4120139
Submission received: 1 October 2018 / Revised: 16 November 2018 / Accepted: 22 November 2018 / Published: 26 November 2018
(This article belongs to the Special Issue Microwave Imaging and Electromagnetic Inverse Scattering Problems)

Abstract

:
A new prototype of a tomographic system for microwave imaging is presented in this paper. The target being tested is surrounded by an ad-hoc 3D-printed structure, which supports sixteen custom antenna elements. The transmission measurements between each pair of antennas are acquired through a vector network analyzer connected to a modular switching matrix. The collected data are inverted by a hybrid nonlinear procedure combining qualitative and quantitative reconstruction algorithms. Preliminary experimental results, showing the capabilities of the developed system, are reported.

1. Introduction

In the last years, there has been growing interest in the development of microwave imaging systems in various applicative fields, such as for civil, industrial, and biomedical applications [1,2,3,4]. In fact, microwaves have the potential ability to penetrate into dielectric materials, allowing for directly obtaining information about the internal dielectric properties of the samples under test (SUT). Despite the potential advantages, there are still some problems to be faced, which motivate the ever-expanding research activities on this topic. First, in many cases, the targets are composed of inhomogeneous, lossy, and dispersive media (e.g., when dealing with biological materials). The electromagnetic waves are thus typically subject to high attenuations during the propagation through the target, and the information about the material properties are contained in a complex way in the scattered field. Moreover, the dielectric contrast with respect to the external embedding may be high, requiring the adoption of matching layers. Consequently, it is necessary to properly design the antennas, the embedding structures, and the transmission/measurement hardware. Several experimental apparatuses have been proposed, based on both radar concepts and inverse scattering methods (see, for example, [5,6,7]). A recent overview containing several examples of experimental set ups has been reported in the literature [8], and the reader is referred to that book for a rather detailed description of these configurations.
Furthermore, appropriate inversion procedures, able to exploit the available a-priori information about the target, should be used in order to process the measurements made available by the hardware. In this framework, several interesting approaches have been recently introduced [9,10,11,12,13,14,15,16,17,18]. On the one hand, they have been designed in order to improve the capabilities of the so-called qualitative methods, which are aimed at retrieving only the presence/shape of targets, as well as some particular features of interest. For example, in non-destructive evaluations, the knowledge of the position and dimension of a defect or a crack could in fact represent sufficient information. On the other hand, much more sophisticated approaches have been devised for inspecting strong scatterers and producing images of the dielectric properties of the scene under test. This is of fundamental importance in biomedical applications, where microwave imaging techniques have been proposed for breast cancer [19,20,21,22] and brain stroke detection [23,24,25,26], as well as in several other diagnostic processes, such as the monitoring of microwave ablation [27], guiding endo-capsules [28], and so on.
In this paper, a new prototype of the microwave imaging system is presented. It allows for collecting frequency-stepped scattered-field data in a tomographic configuration by using a multi-static setup. The antennas have been specifically designed in order to minimize the reflections from the external surface, and to optimize the propagation inside the target. An ad-hoc 3D printed holding structure is used to keep the radiating elements in contact with the target. The measured data are inverted using a hybrid inverse-scattering procedure [29], which combines a delay-and-sum (DAS) qualitative algorithm [30] (providing a qualitative image of the dielectric discontinuities) with a quantitative method based on an inexact-Newton/Landweber (INLW) scheme [31] (providing a reconstruction of the distribution of the dielectric properties of the target). In particular, the obtained qualitative image allows for focusing the INLW method on the regions of the target in which the discontinuities with respect to the background are found. The capabilities of the developed system are assessed by means of preliminary experimental results.
The paper is organized as follows. The developed measurement hardware and the related inversion procedure are described in Section 2. Section 3 reports some of the experimental results aimed at validating both the system and the reconstruction algorithm. Finally, conclusions are drawn in Section 4.

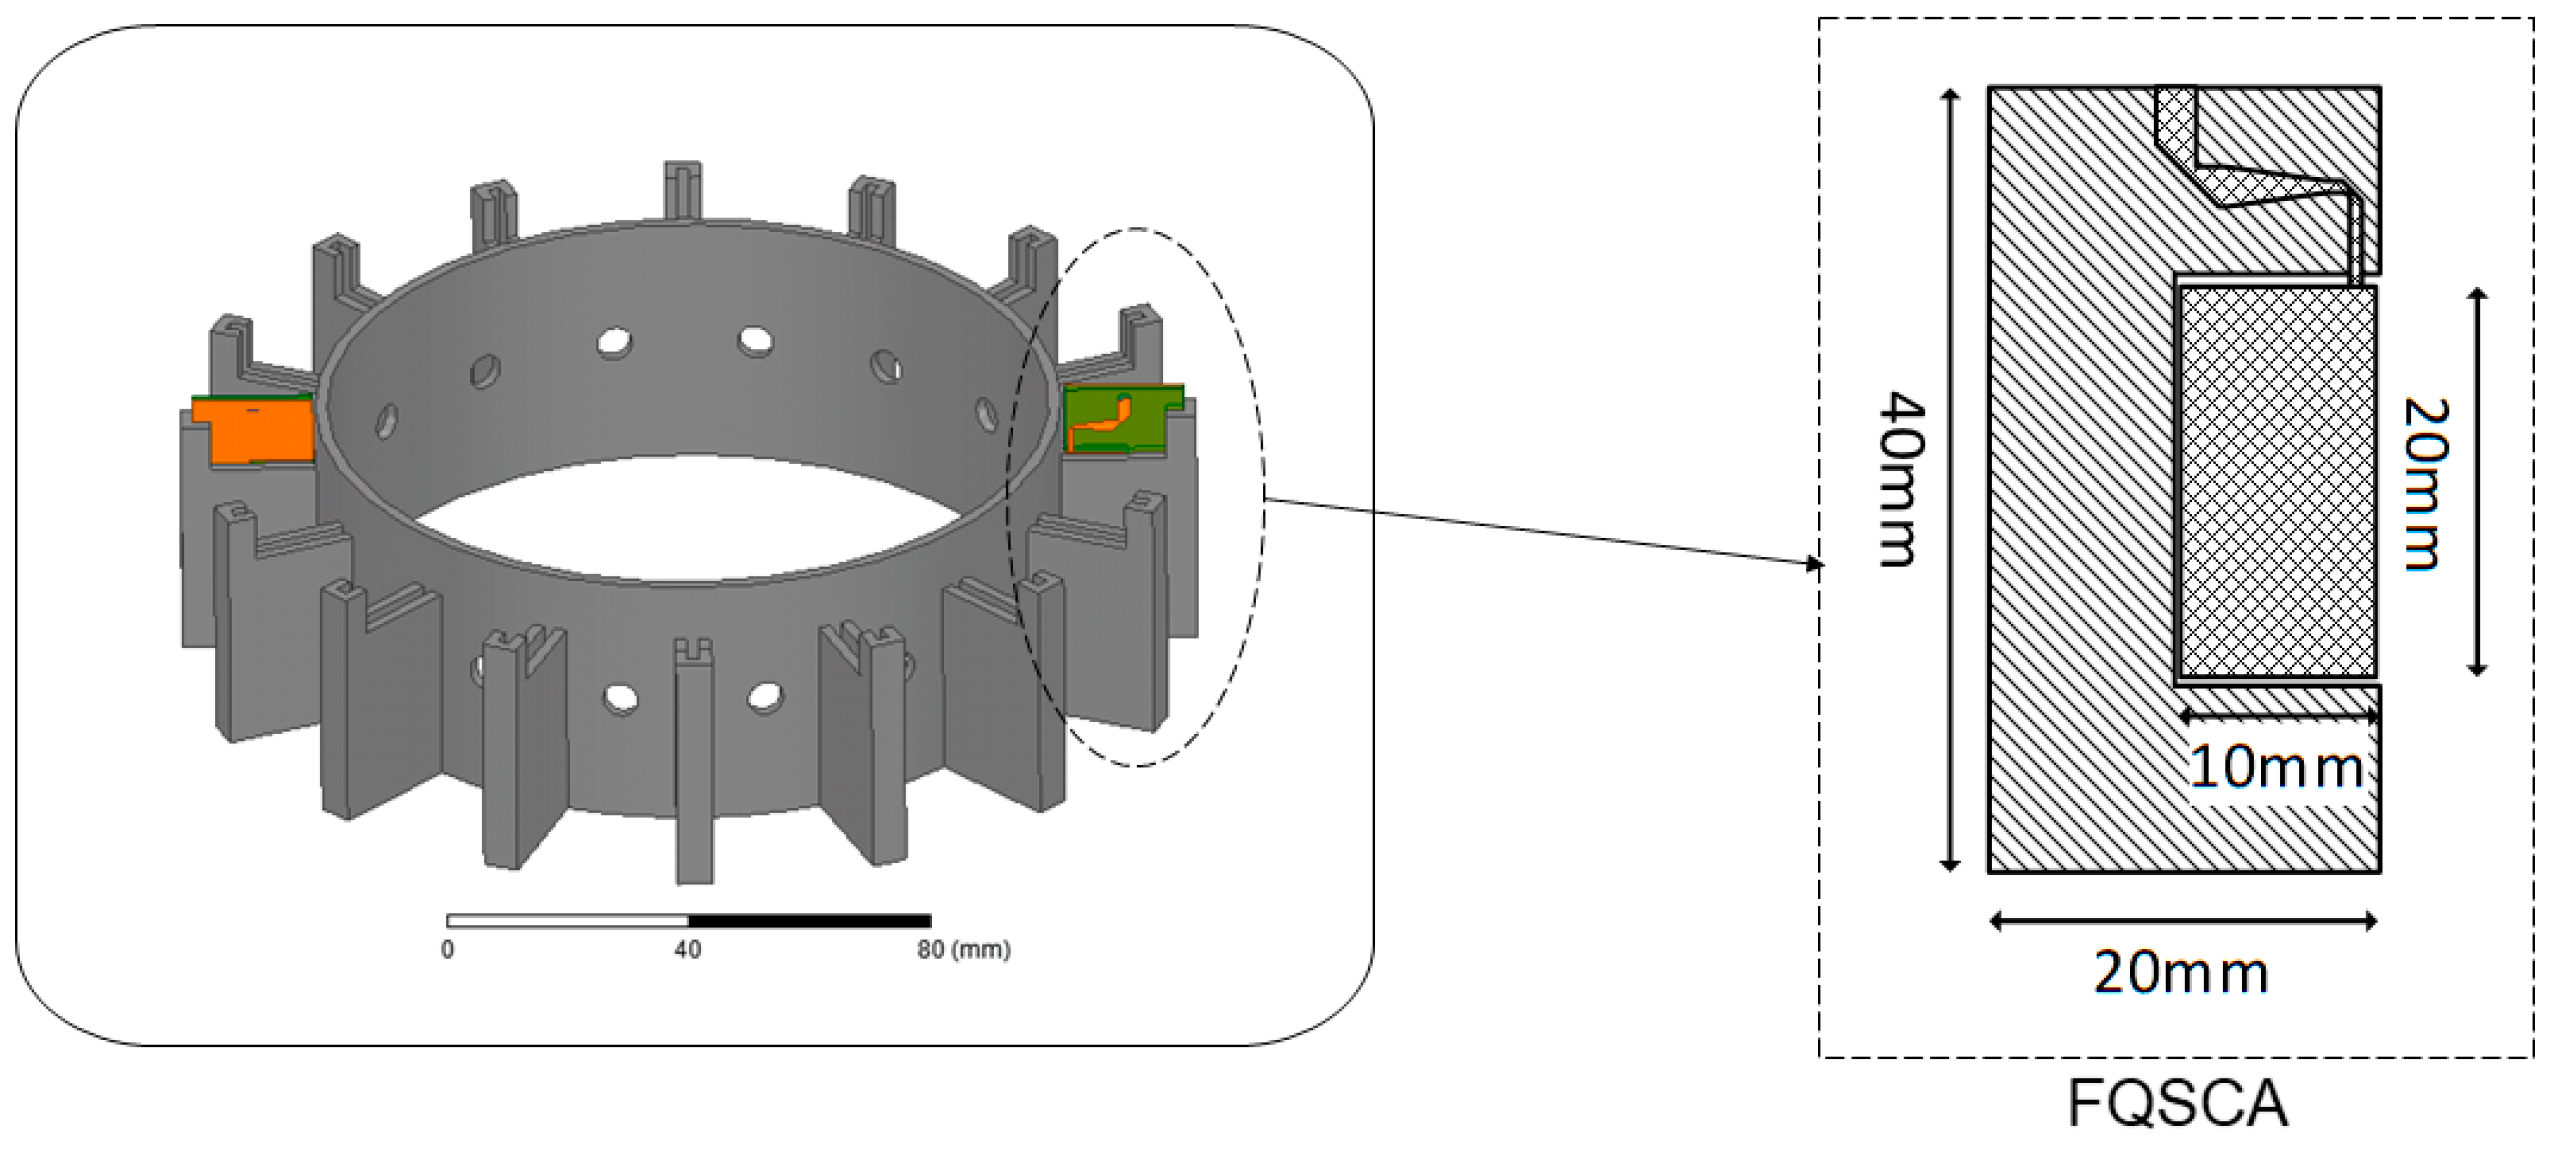
2. Measurement Setup and Inversion Procedure

A block diagram of the developed prototype is shown in Figure 1. It is composed of a vector network analyzer (VNA), a radio frequency (RF) switch matrix connected to a set of ad-hoc antennas ( M = 16 antennas are adopted in the current prototype), and a control board used to drive the switches. The whole system is managed by a personal computer (PC), which is used to select the active antenna pair (via universal serial bus (USB) connection), control the VNA, collect the measurements (via an Ethernet connection), and execute the reconstruction algorithms. The PC also takes care of the synchronization between the various components of the system.
The RF switch matrix is composed of two levels, as shown in Figure 2. The first one, which is directly connected to the transmit and receive ports of the VNA, is composed of two 1:4 switch boards, whereas the second one is composed of four 2:4 switch boards, whose outputs are connected to the 16 antennas. For both of the levels, Peregrine Semiconductor’s PE42441 SP4T absorptive RF switches have been used in the switch boards. The working frequency band of such components ranges from 10 MHz up to 8 GHz. Each board has been manufactured using a Rogers RO4350B substrate (characterized by complex relative dielectric permittivity ϵ r = 3.66 j 0.011 at 2.5 GHz) in order to reduce the RF signal attenuation and the changes in the electrical parameters. The switching subsystem allows for independently selecting a pair of antennas among the possible 240 combinations. One antenna at a time is used in transmit mode (i.e., it is connected to the transmitting (TX) port of the VNA), whereas the remaining ones are sequentially connected to the receiving port of the VNA for measuring the field scattered by the target. In order to reduce the interferences in the measurement, all of the inactive antennas are terminated using absorptive RF switch components, ensuring an isolation between the adjacent channels at the board connectors of about 90 dB at 3 GHz. The switch control board is equipped with an ATmega328 microcontroller programmed to transparently pass the USB data to an I2C bus, which is connected to four 16-bit PCF8575CDBE4 input/output (I/O) expanders used to drive the RF switches.
Folded quasi self-complementary antennas (FQSCA) [32] have been used in the prototype (whose layout is represented in Figure 3). Such antennas have been specifically developed in order to work in direct contact with the SUT, by reducing the reflections due to the mismatch with the target interface and optimizing the radiation inside the inspected structure. The operating bandwidth of the antennas ranges from 1.5 GHz up to 6 GHz. The radiating elements are kept in contact with the SUT using a custom 3D printed circular holding structure (shown in Figure 3) made of plastic (VeroWhite), with relative dielectric permittivity ϵ r = 2.98 and loss tangent tan δ = 0.029 at 2.4 GHz [33]. The holding structure has been produced using a stereolithographical process. The separation between the two adjacent antennas is 22.5° and the radius is 60 mm. In order to compensate for the different paths of the signal in the function of the selected antenna pairs, a calibration is performed. In particular, the calibration procedure is aimed at compensating the influence (i.e., phase shift and attenuation) of the switching electronics and cables for each pair of transmitting/receiving (TX/RX) antennas, thus resulting in measurements referenced to the antenna connectors. Actually, such a calibration is performed by subtracting from the amplitude (in decibel) and phase of the measured data (with and without inclusions) of each TX/RX pair the corresponding through measurements obtained by connecting together the RX and TX antenna connectors.
The scattered-field data (i.e., the difference between the measurements with and without the inclusions) collected by the system are processed using a hybrid qualitative–quantitative inversion scheme [29]. A flow chart of the developed inversion procedure is shown in Figure 4. Starting from the measured stepped-frequency data, an initial qualitative reconstruction Λ ( r ) ,   r D ( D being the inspected area), is obtained using a multistatic DAS method [30]. The time-domain response is synthesized by applying an inverse fast Fourier transform to the data. Such an image provides a rough indication of the eventually present inclusions.
Subsequently, a frequency-hopping (FH) inexact-Newton/Landweber method is used to obtain the quantitative distribution of the dielectric properties. In particular, for each considered frequency (hereafter, the superscript f denotes the frequency index), a hybrid INLW method is used to invert the non-linear and ill-posed scattering equation relating the unknown contrast function χ f = ϵ r f / ϵ r , b f 1 ( ϵ r f and ϵ r , b f being the complex relative dielectric permittivity of SUT and background, respectively) with the z -component of the scattered electric field e s f , as follows:
e s f ( r ) = G d f χ f ( I G s f χ f ) 1 e b f ( r ) = F f ( χ f ) ( r ) ,
where e b f is the z -component of the electric field due to the background and G d / s f are linear integral operators whose kernel is the Green’s function for the background. In such an inversion procedure, the antennas have been modeled as ideal z-directed line-current sources. Consequently, the acquired data have been further pre-processed by properly scaling the measured values by a complex scaling factor, obtained by matching the data measured with the empty imaging chamber (filled by the background medium only) with the corresponding simulated electric field.
The INLW technique, outlined in the right side of Figure 4, is an iterative nonlinear inversion method formed by two nested loops. The outer one is based on a Newton scheme, which performs an iterative linearization of Equation (1) around the currently reconstructed value of the contrast function χ i f ( i being the outer iteration index). The resulting linearized equation F i f h i ( r ) = e s f ( r ) F f ( χ i f ) ( r ) , F i f being the Fréchet derivative of the scattering operator F f in Equation (1), is solved in a regularized sense, using a truncated Landweber algorithm [31,34]. In particular, the regularized solution h i ( r ) is obtained by means of the following update formula (initialized with h i , 0 = 0 ):
h i , l + 1 ( r ) = h i , l ( r ) β i F i f ( F i f h i , l e s f ( r ) + F f ( χ i f ) ( r ) ) ,   l = 0 , 1 , ,   N L W
where F i f is the adjoint of the operator F i f , β i = F i f 2 is a fixed relaxation coefficient, and N L W is the maximum number of allowed iterations. In order to exploit the information obtained in the qualitative step, the Newton update has been modified by multiplying the solution of the linearized problem by the value of the normalized qualitative map Λ in the same point of the investigation domain (i.e., χ i + 1 f ( r ) = χ i f ( r ) + Λ ( r ) h i ( r ) ). This is the key aspect of the combination between the qualitative DAS method and the INLW algorithm. In fact, since Λ ( r ) [ 0 , 1 ] ,   r D , the contrast function χ is updated “faster” in the regions, in which the qualitative method found relevant discontinuities with respect to the background (i.e., when Λ is close to 1), and “slower” when Λ assumes low values, which means in the points outside the qualitatively-detected targets. Newton iterations (i.e., linearization, regularized solution, and update) then continue until a convergence criterion is met or a maximum number of iterations, N I N , is reached. After that, the FH procedure requires that the obtained contrast function is used as the starting guess for the inversion at the subsequent frequency, until all of the available frequencies have been processed.

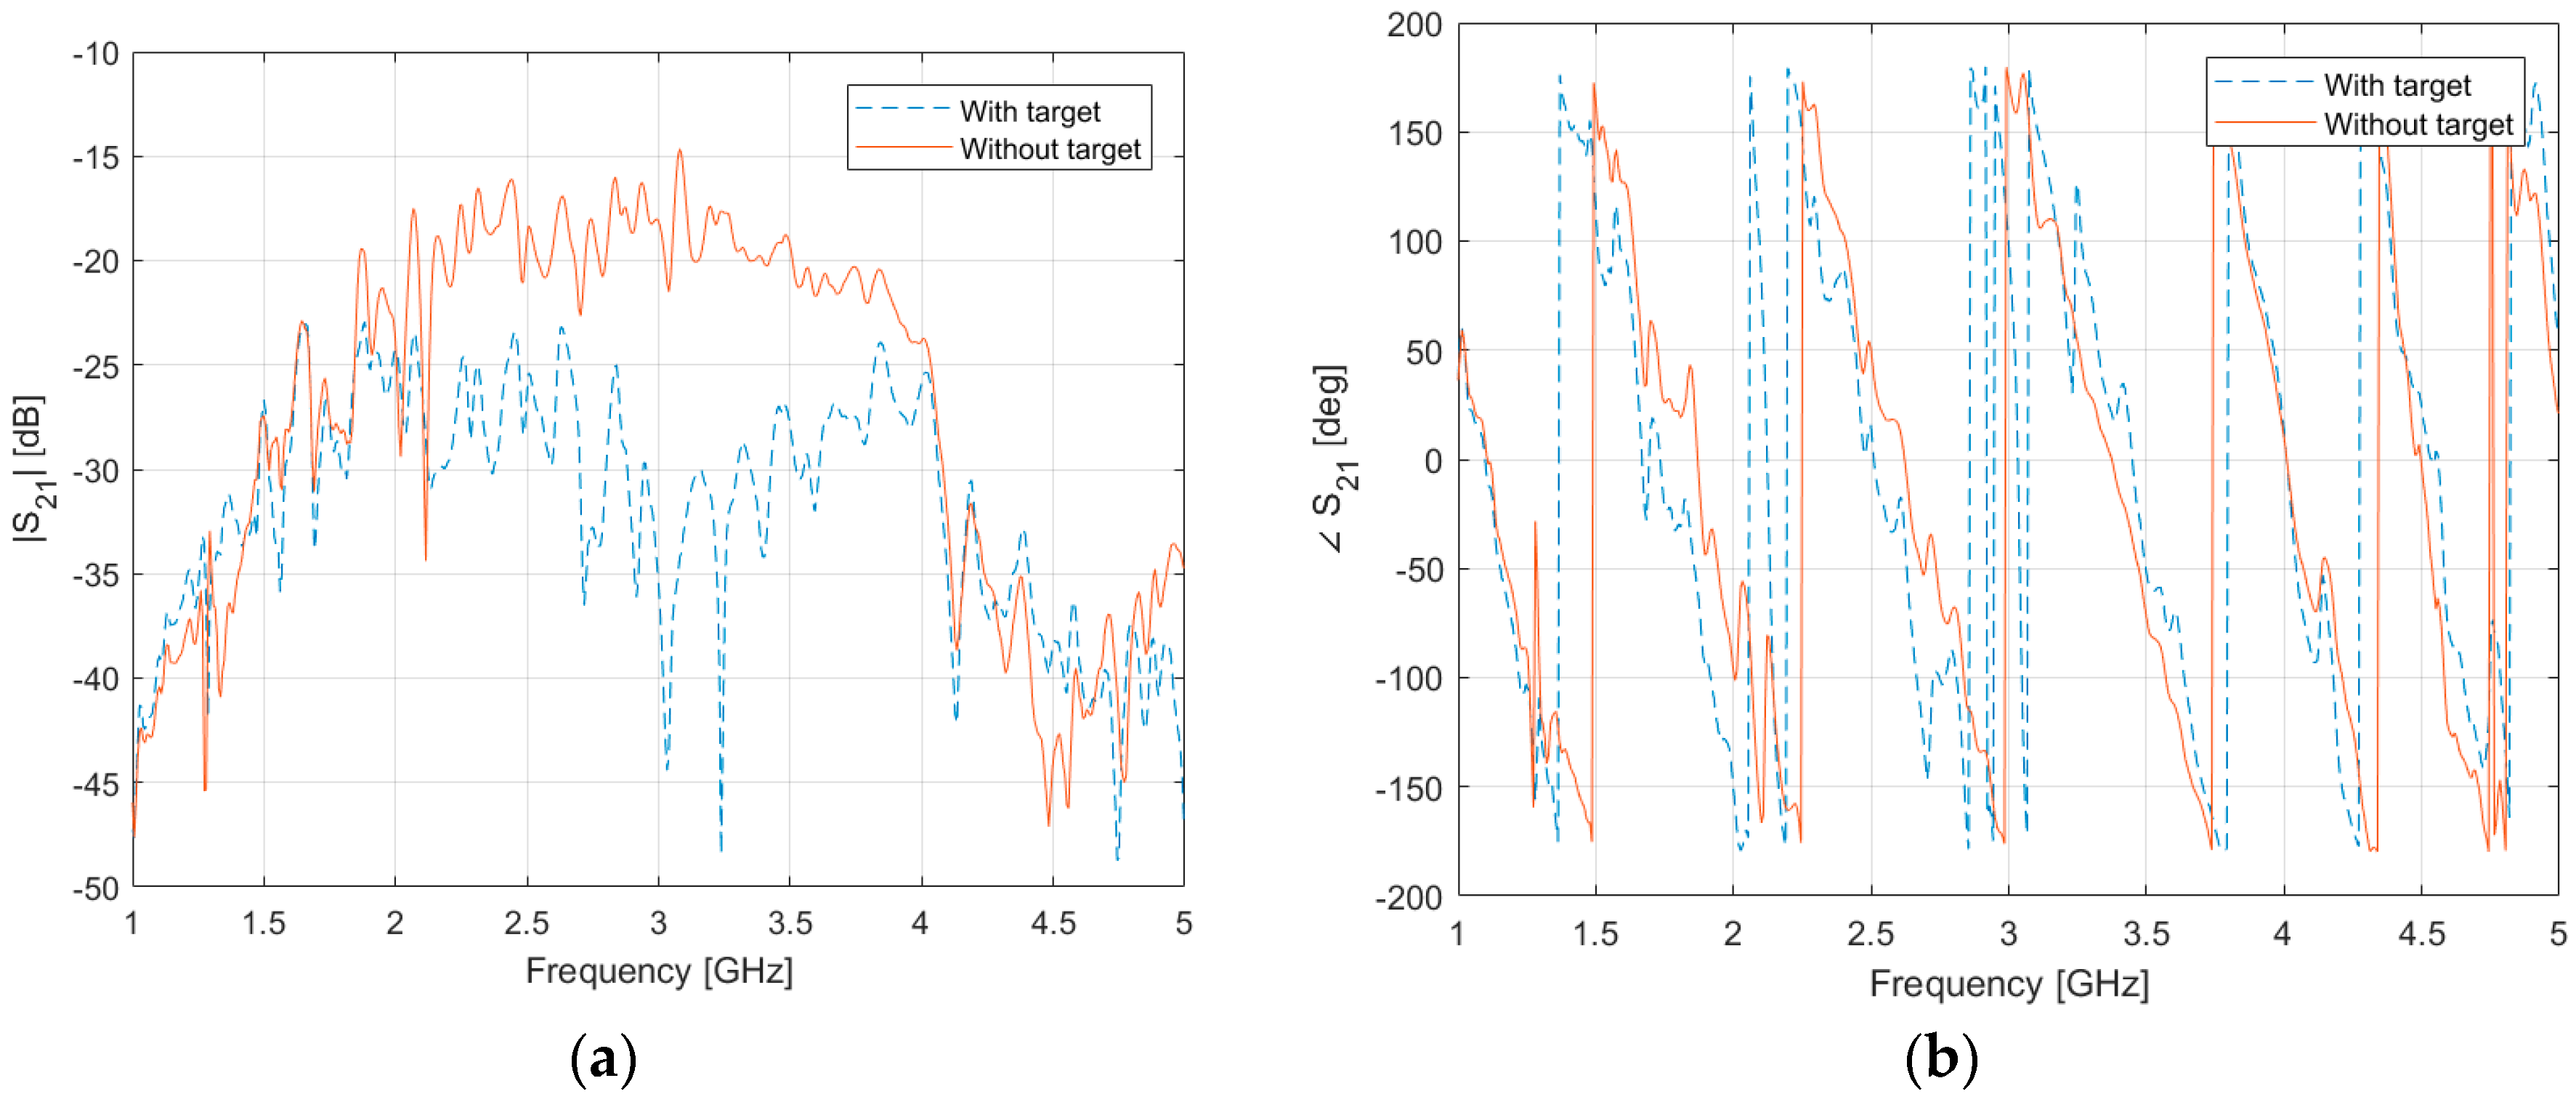
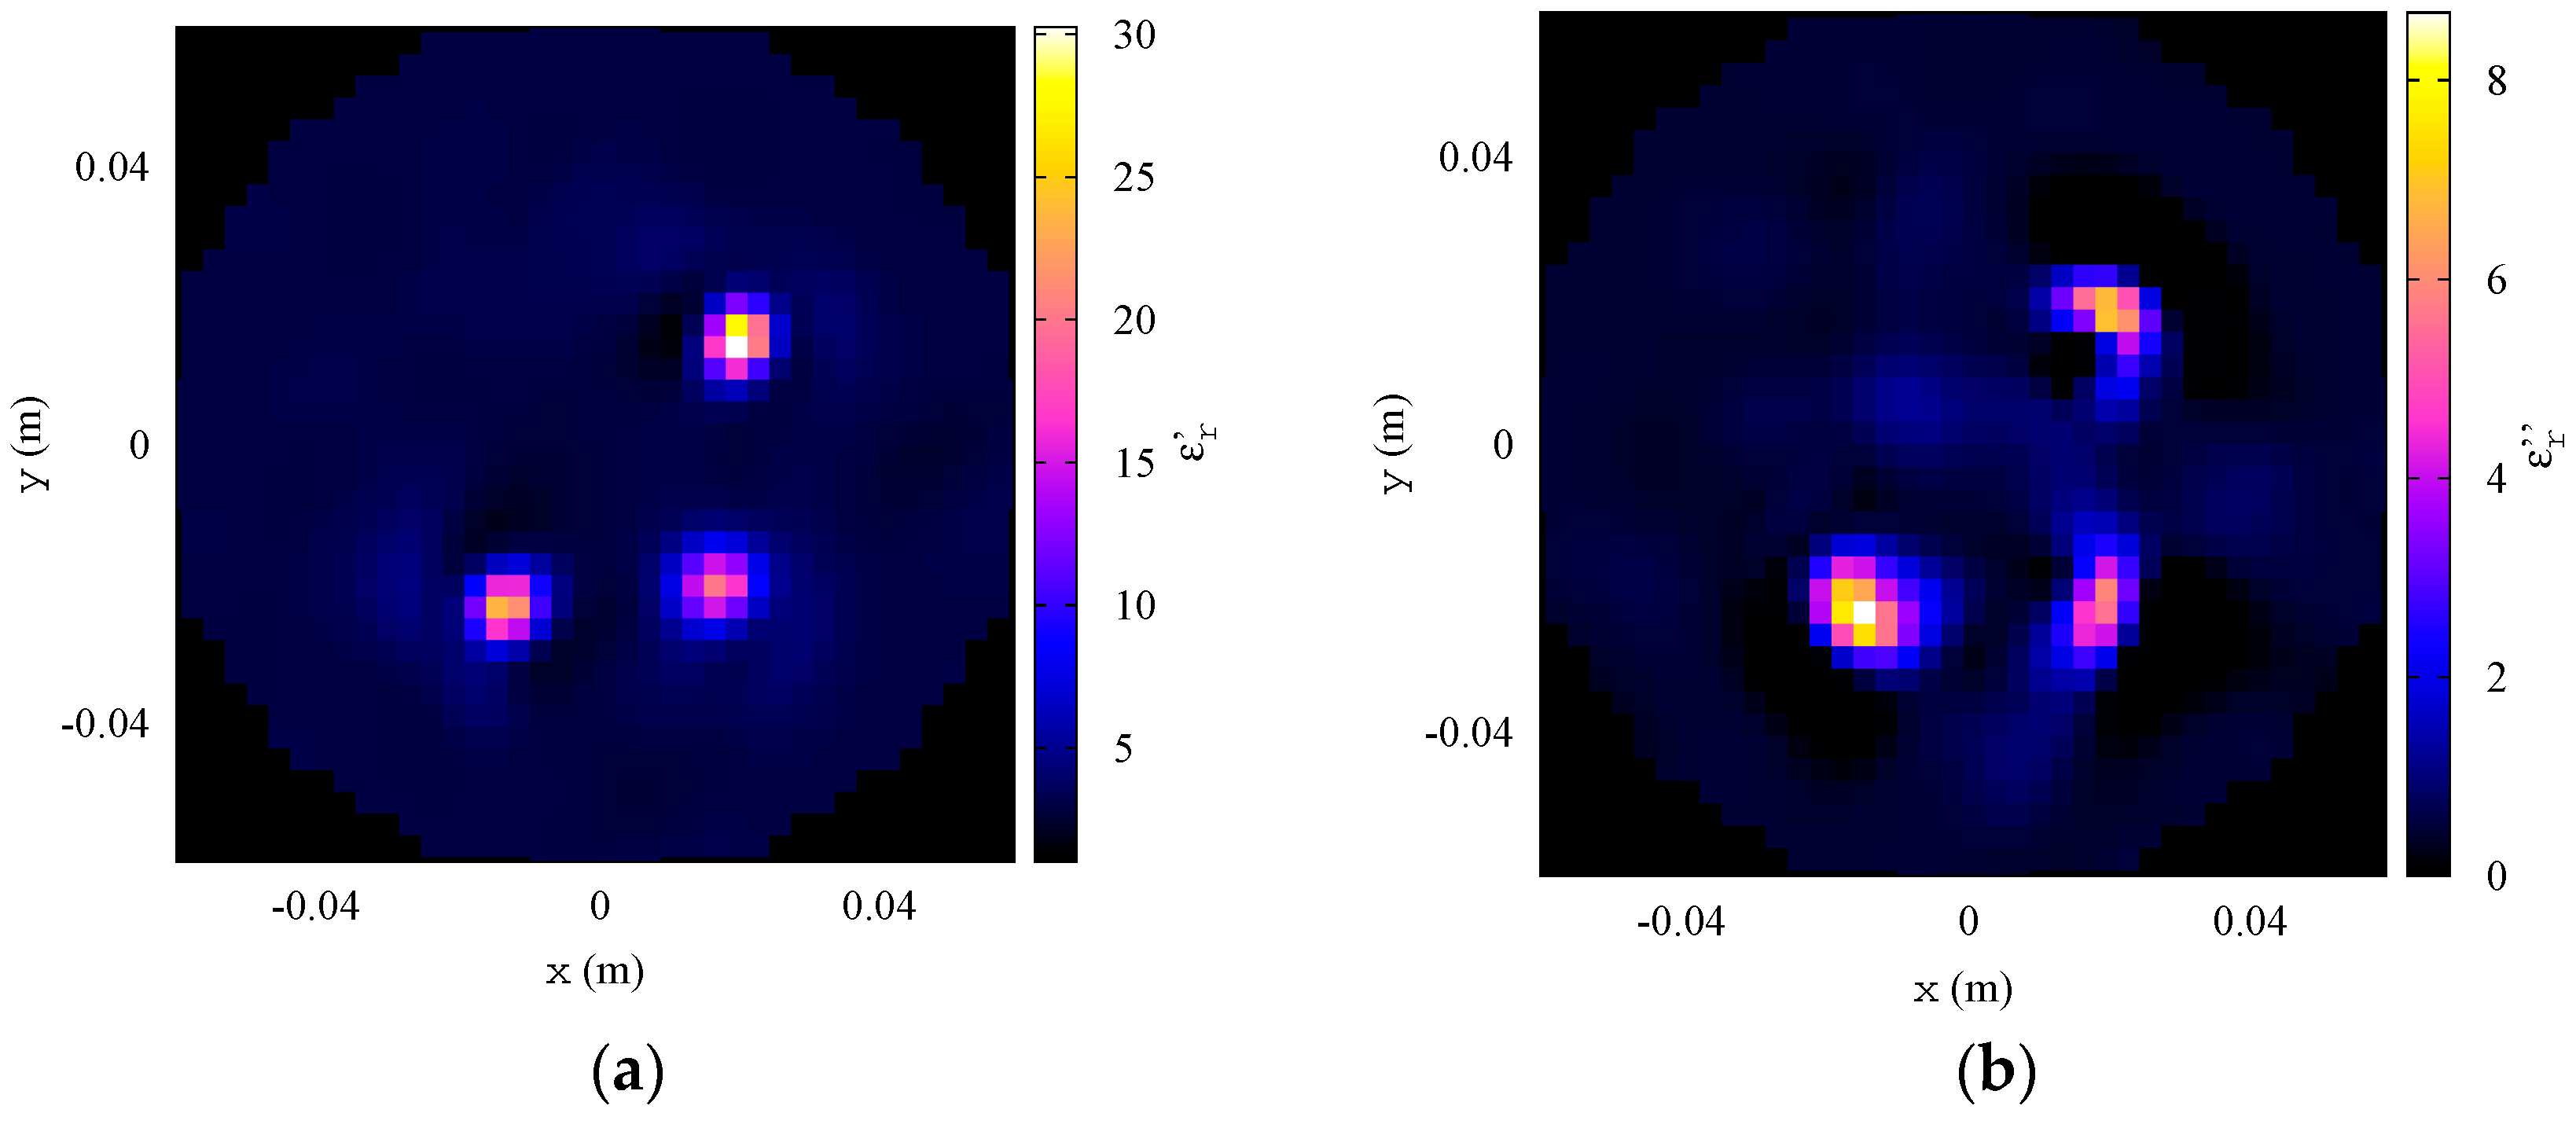
3. Preliminary Experimental Results

The proposed system has been preliminarily tested with a SUT composed of a Plexiglas circular cylinder, with a diameter of d = 120   mm (Figure 5) filled with a mixture of oil, water, salt, and soy lecithin (relative dielectric permittivity ϵ r , b 3 j 0.73 at 2.45 GHz). The liquid mixture, which occupies a vertical depth of 90 mm, has been prepared by adding small quantities of the single components to the mixture step-by-step, and checking the actual properties with a VNA dielectric probe (Keysight N1501A). In particular, a strong percentage of vegetable oil has been used, whereas other components, in smaller quantities, have been added to adjust the values to the desired ones. Salt has also been added in order to achieve the correct conductivity. Moreover, soy lecithin has been used as a surfactant for obtaining a stable mixture. The investigation domain, D , is a circular region of the diameter, d , discretized into 1240 square subdomains with a 3.12 mm side. Three plastic tubes with a diameter of d i = 5   mm , filled with a different liquid mixture (relative dielectric permittivity ϵ r 35 j 10 in the considered frequency band), are approximately located at positions r 1 = ( 20 ,   25 )   mm , r 2 = ( 20 ,   20 )   mm , and r 3 = ( 25 ,   20 )   mm . In particular, a 50%/50% mixture of vegetable oil and tap water with 2 g of soy lecithin has been used. A negligible dispersive behavior of the measured dielectric properties of both of the liquid mixtures has been observed in the considered frequency range. Therefore, dispersion has not been considered in the inversion procedure.
The transmission scattering parameters have been acquired for all of the possible antenna pairs by considering 585 frequency steps in the range between 1 and 5 GHz. The acquisition time is mainly affected by the VNA measurement sweep time; the switch setting and I/O expander latency can be neglected. For the presented results, a sweep time of 1 s has been set for each of the antennas’ combinations, resulting in a total measurement time of 240 s.
The measured values of S 21 with and without the considered inclusions are shown in Figure 6 for a pair of opposite antennas (antennas #6 and #14). It is worth noting that most of the scattering contributions are located between 2 and 4 GHz. Consequently, the FH-INLW method has been applied, by considering the F = 13 equally-spaced frequencies in this range. The maximum number of inner and outer iterations in each INLW inversion step are N L W = 100 and N I N = 100 , and the loops are stopped when the variation in the residual falls below 1%. The values of such parameters have been empirically selected on the basis of previous analyses. The results provided by the developed procedure are shown in Figure 7 and Figure 8. In particular, the obtained qualitative map, showing the presence of the three inclusions, is reported in Figure 7. The quantitative reconstructions of the relative dielectric permittivity at the final frequency step are shown in Figure 8a (real part) and Figure 8b (imaginary part). As can be seen, the targets are accurately localized and the dielectric properties are quite correctly estimated. The root mean squared error (RMSE) on the reconstruction of the complex dielectric permittivity is equal to 0.48 in this case. The proposed hybrid inversion algorithm has also been compared with a bare INLW technique, in which the update of the solution in the Newton iterations is not weighted by the qualitative map [31]. The reconstructed distributions of the dielectric properties of the target are shown in Figure 9, and the corresponding RMSE is 0.52. This comparison evidences the effectiveness of the hybridization with the qualitative scheme, which allows for a significant improvement in both the estimation of the complex dielectric permittivity (especially, the real part) and the size of the target, as well as the reconstruction of the background medium.

4. Conclusions

A microwave system prototype for quantitative tomographic imaging has been presented in this paper. The system is composed of a set of ad-hoc antennas held in contact with the SUT by a custom 3D-printed structure, a modular switch matrix, a VNA, and a computer-based control and processing section. A hybrid qualitative/quantitative inversion method has been developed for processing the measured scattered-field data. The effectiveness of the imaging setup has been assessed by means of preliminary experimental results. Future developments will be aimed at performing a wider experimental validation campaign with more complex targets.

Author Contributions

Conceptualization, A.F., M.M., R.M., C.P., M.P., S.P., A.R., and A.S.; formal analysis, A.F., M.R., and A.R.; investigation, M.M., R.M., C.P., S.P., and A.S.; resources, M.M., R.M., C.P., S.P., and A.S.; software, A.F., M.R., and A.R.

Funding

This research received no external funding.

Conflicts of Interest

The authors declare no conflict of interest.

References

  1. Meaney, P.M.; Goodwin, D.; Golnabi, A.H.; Zhou, T.; Pallone, M.; Geimer, S.D.; Burke, G.; Paulsen, K.D. Clinical Microwave Tomographic Imaging of the Calcaneus: A First-in-Human Case Study of Two Subjects. IEEE Trans. Biomed. Eng. 2012, 59, 3304–3313. [Google Scholar] [CrossRef] [PubMed] [Green Version]
  2. Ghasr, M.T.; Horst, M.J.; Dvorsky, M.R.; Zoughi, R. Wideband microwave camera for real-time 3-D imaging. IEEE Trans. Antennas Propag. 2017, 65, 258–268. [Google Scholar] [CrossRef]
  3. Gilmore, C.; Zakaria, A.; Pistorius, S.; LoVetri, J. Microwave Imaging of Human Forearms: Pilot Study and Image Enhancement. Int. J. Biomed. Imaging 2013, 2013, 673027. [Google Scholar] [CrossRef] [PubMed]
  4. Benedetto, A.; Pajewski, L. Civil Engineering Applications of Ground Penetrating Radar; Springer: Cham, Switzerland, 2015; ISBN 978-3-319-04813-0. [Google Scholar]
  5. Castorina, G.; Di Donato, L.; Morabito, A.F.; Isernia, T.; Sorbello, G. Analysis and design of a concrete embedded antenna for wireless monitoring applications. IEEE Antennas Propag. Mag. 2016, 58, 76–93. [Google Scholar] [CrossRef]
  6. Monleone, R.D.; Pastorino, M.; Fortuny-Guasch, J.; Salvade, A.; Bartesaghi, T.; Bozza, G.; Maffongelli, M.; Massimini, A.; Carbonetti, A.; Randazzo, A. Impact of background noise on dielectric reconstructions obtained by a prototype of microwave axial tomograph. IEEE Trans. Instrum. Meas. 2012, 61, 140–148. [Google Scholar] [CrossRef]
  7. Fear, E.C.; Bourqui, J.; Curtis, C.; Mew, D.; Docktor, B.; Romano, C. Microwave breast imaging with a monostatic radar-based system: A study of application to patients. IEEE Trans. Microw. Theory Tech. 2013, 61, 2119–2128. [Google Scholar] [CrossRef]
  8. Pastorino, M.; Randazzo, A. Microwave Imaging Methods and Applications; Artech House: Boston, MA, USA, 2018; ISBN 978-1-63081-348-2. [Google Scholar]
  9. Palmeri, R.; Bevacqua, M.T.; Crocco, L.; Isernia, T.; Di Donato, L. Microwave imaging via distorted iterated virtual experiments. IEEE Trans. Antennas Propag. 2017, 65, 829–838. [Google Scholar] [CrossRef]
  10. Solimene, R.; Buonanno, A.; Pierri, R. Imaging small PEC spheres by a linear δ approach. IEEE Trans. Geosci. Remote Sens. 2008, 46, 3010–3018. [Google Scholar] [CrossRef]
  11. Gennarelli, G.; Vivone, G.; Braca, P.; Soldovieri, F.; Amin, M.G. Multiple extended target tracking for through-wall radars. IEEE Trans. Geosci. Remote Sens. 2015, 53, 6482–6494. [Google Scholar] [CrossRef]
  12. Brancaccio, A.; Leone, G. Multimonostatic shape reconstruction of two-dimensional dielectric cylinders by a Kirchhoff-based approach. IEEE Trans. Geosci. Remote Sens. 2010, 48, 3152–3161. [Google Scholar] [CrossRef]
  13. Anselmi, N.; Salucci, M.; Oliveri, G.; Massa, A. Wavelet-Based Compressive Imaging of Sparse Targets. IEEE Trans. Antennas Propag. 2015, 63, 4889–4900. [Google Scholar] [CrossRef]
  14. Oliveri, G.; Randazzo, A.; Pastorino, M.; Massa, A. Electromagnetic imaging within the contrast-source formulation by means of the multiscaling inexact Newton method. J. Opt. Soc. Am. A 2012, 29, 945–958. [Google Scholar] [CrossRef] [PubMed]
  15. D’Urso, M.; Isernia, T.; Morabito, A.F. On the solution of 2-D inverse scattering problems via source-type integral equations. IEEE Trans. Geosci. Remote Sens. 2010, 48, 1186–1198. [Google Scholar] [CrossRef]
  16. Shumakov, D.S.; Nikolova, N.K. Fast quantitative microwave imaging with scattered-power maps. IEEE Trans. Microw. Theory Tech. 2018, 66, 439–449. [Google Scholar] [CrossRef]
  17. Desmal, A.; Bağcı, H. Shrinkage-thresholding enhanced Born iterative method for solving 2D inverse electromagnetic scattering problem. IEEE Trans. Antennas Propag. 2014, 62, 3878–3884. [Google Scholar] [CrossRef]
  18. Maaref, N.; Millot, P.; Ferrières, X.; Pichot, C.; Picon, O. Electromagnetic Imaging Method Based on Time Reversal Processing Applied to Through-the-Wall Target Localization. Prog. Electromagn. Res. 2008, 1, 59–67. [Google Scholar] [CrossRef]
  19. Bellizzi, G.; Bucci, O.M.; Catapano, I. Microwave cancer imaging exploiting magnetic nanoparticles as contrast agent. IEEE Trans. Biomed. Eng. 2011, 58, 2528–2536. [Google Scholar] [CrossRef] [PubMed]
  20. Catapano, I.; Di Donato, L.; Crocco, L.; Bucci, O.M.; Morabito, A.F.; Isernia, T.; Massa, R. On quantitative microwave tomography of female breast. Prog. Electromagn. Res. 2009, 97, 75–93. [Google Scholar] [CrossRef]
  21. Miao, Z.; Kosmas, P. Multiple-frequency DBIM-TwIST algorithm for microwave breast imaging. IEEE Trans. Antennas Propag. 2017, 65, 2507–2516. [Google Scholar] [CrossRef]
  22. Scapaticci, R.; Kosmas, P.; Crocco, L. Wavelet-based regularization for robust microwave imaging in medical applications. IEEE Trans. Biomed. Eng. 2015, 62, 1195–1202. [Google Scholar] [CrossRef] [PubMed]
  23. Hopfer, M.; Planas, R.; Hamidipour, A.; Henriksson, T.; Semenov, S. Electromagnetic tomography for detection, differentiation, and monitoring of brain stroke: A virtual data and human head phantom study. IEEE Antennas Propag. Mag. 2017, 59, 86–97. [Google Scholar] [CrossRef]
  24. Tournier, P.-H.; Bonazzoli, M.; Dolean, V.; Rapetti, F.; Hecht, F.; Nataf, F.; Aliferis, I.; El Kanfoud, I.; Migliaccio, C.; de Buhan, M.; et al. Numerical modeling and high-speed parallel computing: New perspectives on tomographic microwave imaging for brain stroke detection and monitoring. IEEE Antennas Propag. Mag. 2017, 59, 98–110. [Google Scholar] [CrossRef]
  25. Bisio, I.; Estatico, C.; Fedeli, A.; Lavagetto, F.; Pastorino, M.; Randazzo, A.; Sciarrone, A. Brain stroke microwave imaging by means of a Newton-conjugate-gradient method in Lp Banach spaces. IEEE Trans. Microw. Theory Tech. 2018, 66, 3668–3682. [Google Scholar] [CrossRef]
  26. Ireland, D.; Bialkowski, K.; Abbosh, A. Microwave imaging for brain stroke detection using Born iterative method. Antennas Propag. IET Microw. 2013, 7, 909–915. [Google Scholar] [CrossRef]
  27. Bellizzi, G.G.; Crocco, L.; Cavagnaro, M.; Farina, L.; Lopresto, V.; Scapaticci, R. A full-wave numerical assessment of microwave tomography for monitoring cancer ablation. In Proceedings of the 11th European Conference on Antennas and Propagation (EUCAP), Paris, France, 19–24 March 2017; pp. 3722–3725. [Google Scholar]
  28. Chandra, R.; Johansson, A.J.; Gustafsson, M.; Tufvesson, F. A microwave imaging-based technique to localize an in-body RF source for biomedical applications. IEEE Trans. Biomed. Eng. 2015, 62, 1231–1241. [Google Scholar] [CrossRef] [PubMed]
  29. Boero, F.; Fedeli, A.; Lanini, M.; Maffongelli, M.; Monleone, R.; Pastorino, M.; Randazzo, A.; Salvadè, A.; Sansalone, A. Microwave tomography for the inspection of wood materials: Imaging system and experimental results. IEEE Trans. Microw. Theory Tech. 2018, 66, 3497–3510. [Google Scholar] [CrossRef]
  30. Li, X.; Hagness, S.C. A confocal microwave imaging algorithm for breast cancer detection. IEEE Microw. Compon. Lett. 2001, 11, 130–132. [Google Scholar] [CrossRef] [Green Version]
  31. Bozza, G.; Estatico, C.; Pastorino, M.; Randazzo, A. An inexact Newton method for microwave reconstruction of strong scatterers. IEEE Antennas Wirel. Propag. Lett. 2006, 5, 61–64. [Google Scholar] [CrossRef]
  32. Lanini, M.; Poretti, S.; Salvade, A.; Monleone, R. Design of a slim wideband-antenna to overcome the strong reflection of the air-to-sample interface in microwave imaging. In Proceedings of the 2015 International Conference on Electromagnetics in Advanced Applications, Turin, Italy, 7–11 September 2015; pp. 1020–1023. [Google Scholar]
  33. Whittow, W.G. 3D printing, inkjet printing and embroidery techniques for wearable antennas. In Proceedings of the 10th European Conference on Antennas and Propagation (EuCAP2016), Davos, Switzerland, 10–15 April 2016; pp. 1–4. [Google Scholar]
  34. Bertero, M.; Boccacci, P. Introduction to Inverse Problems in Imaging; Institute of Physics Pub: Bristol, UK; Philadelphia, PA, USA, 1998; ISBN 978-0-7503-0439-9. [Google Scholar]
Figure 1. Block diagram of the microwave tomographic system architecture. USB—universal serial bus; μC—microcontroller; VNA—vector network analyzer; PC—personal computer; TX—transmission; RX—reception.
Jimaging 04 00139 g001
Figure 2. Block scheme of the switching board and photograph of the 2:4 switch module.
Jimaging 04 00139 g002
Figure 3. Schematic representation of the holding structure and layout of the folded quasi self-complementary antennas (FQSCA) antenna.
Jimaging 04 00139 g003
Figure 4. Flow chart of the inversion algorithm. DAS—delay-and-sum; FH-INLW—frequency-hopping inexact-Newton/Landweber.
Jimaging 04 00139 g004
Figure 5. Photograph of the experimental set up.
Jimaging 04 00139 g005
Figure 6. (a) Magnitude and (b) phase of the measured S 21 for a couple of facing antennas with and without the targets.
Jimaging 04 00139 g006
Figure 7. Experimental results. Qualitative indicator map.
Jimaging 04 00139 g007
Figure 8. Experimental results. Reconstructed distributions of the (a) real part and (b) imaginary part of the complex relative dielectric permittivity at 3.8 GHz obtained with the proposed hybrid algorithm.
Jimaging 04 00139 g008
Figure 9. Experimental results. Reconstructed distributions of the (a) real part and (b) imaginary part of the complex relative dielectric permittivity at 3.8 GHz obtained with a bare quantitative inversion procedure.
Jimaging 04 00139 g009

