Article

CT-Based Micro-Mechanical Approach to Predict Response of Closed-Cell Porous Biomaterials to Low-Velocity Impact

by
Mehrdad Koloushani
,
Reza Hedayati
,
Mojtaba Sadighi
* and
Mohammad Mohammadi-Aghdam
Mechanical Engineering department, Amirkabir University of Technology (Tehran Polytechnic), Hafez Ave., Tehran 15875-4413, Iran
*
Author to whom correspondence should be addressed.
J. Imaging 2018, 4(3), 49; https://doi.org/10.3390/jimaging4030049
Submission received: 23 January 2018 / Revised: 1 March 2018 / Accepted: 1 March 2018 / Published: 4 March 2018

Abstract

:
In this study, a new numerical approach based on CT-scan images and finite element (FE) method has been used to predict the mechanical behavior of closed-cell foams under impact loading. Micro-structural FE models based on CT-scan images of foam specimens (elastic-plastic material model with material constants of bulk aluminum) and macro-mechanical FE models (with crushable foam material model with material constants of foams) were constructed. Several experimental tests were also conducted to see which of the two noted (micro- or macro-) mechanical FE models can better predict the deformation and force-displacement curves of foams. Compared to the macro-structural models, the results of the micro-structural models were much closer to the corresponding experimental results. This can be explained by the fact that the micro-structural models are able to take into account the interaction of stress waves with cell walls and the complex pathways the stress waves have to go through, while the macro-structural models do not have such capabilities. Despite their high demand for computational resources, using micro-scale FE models is very beneficial when one needs to understand the failure mechanisms acting in the micro-structure of a foam in order to modify or diminish them.

Graphical Abstract

1. Introduction

Since the 1990s, different methodologies have been developed for numerical modeling of mechanical behavior of foams. These methods include macro-structural modeling of foam structures using volumetric elements and with reduced mechanical properties, using Voronoi diagrams to create the micro-structure of irregular foams, creation of a specific regular unit cell (such as cube [1], truncated cube [2], truncated octahedron [3], Weaire–Phelan [4,5], etc.) and tessellating it in space to have a lattice structure representing a foam structure, micro-structural modeling of the micro-geometry of the foams based on computed tomography (CT) images, etc. In all the above-mentioned modeling methodologies except the last one, in order to have reliable numerical predictions, the studied foam specimens must have a relatively regular micro-structure. The CT-based micro-structural finite element (FE) modeling is, however, capable of considering the complexities and irregularities inside the micro-structure of foam specimens.
Implementing CT images for creation of micro-structures of foams has been carried out in a number of studies. For example, Vehyl et al. [6] used CT data of M-Pore sponge and closed-cell Alporas foams to create FE models of foam. Miedzin´ska et al. [7] used μ-CT data for modeling open-cell aluminum foams and observed good correlation between the numerical results obtained from their model and the experimental compressive tests. Bock and Jacobi [8] employed X-ray μ-CT to acquire the geometric data for open-cell aluminum foams. Using FoamView software, they were able to extract strut lengths and pore shape of the struts. Their results supported the ideal geometry for foams suggested by Weaire and Phelan [5].
One of the main applications of metal foams can be the manufacturing of bone substitute implants [2,9,10]. It is usually preferred to use highly porous metal foams to manufacture orthopedic load-bearing implants instead of stiff metal ones. The main reason for such preference is the much larger stiffness of biocompatible metals such as titanium, aluminum, and stainless steel compared to natural bone. This large difference in the stiffness of metal implant and natural bone around it decreases the load transferred through the bone (known as a phenomenon called stress shielding [11]) and leads to gradual resorption of the bone after implantation. The other reason is that the metal foams made of biocompatible materials also preserve the excellent physiological properties (such as being biocompatible and corrosion-resistant when faced to body fluids) of the metal they are made of. Moreover, the presence of semi-open pores in the external surface of an implant made of closed-cell foams are good sites for bone regeneration and, therefore, subsequent implant-bone attachment.
One of the main advantages of closed-cell foams compared to open-cell foams is their higher toughness when faced to impact loading. An implant can be the subject of many impact loads such as car accident, slipping and falling of a person, foot impacts during running, etc. Closed-cell foams have traditionally shown better energy absorption capacity and impact resistance [12,13]. Therefore, in this study, it is attempted to use a new approach to predict the mechanical behavior of closed-cell foams under impact loading.
There are several studies on the numerical modeling of closed-cell foams under impact loading. Using a crushable foam material model, Rajendran et al. [14] simulated the low-velocity impact on closed-cell foams with different densities. Li et al. [15] imposed quasi-static and low-velocity impact loadings on closed-cell aluminum foams and compared analytical, numerical, and experimental results. Zhang et al. [16] used Voronoi structures to investigate collapse and fracture behaviors of closed-cell metallic foams with different pore sizes. The influences of porous structure density and strain-rate on the dynamic responses of aluminum foam using micro-mechanical models was carried out by Liu et al. [17] using two-dimensional models. Fang et al. [18] used a mesoscopic method to model closed-cell aluminum foams with variable pore and wall thickness dimensions.
In this study, micro-structural models of closed-cell foams are extracted from CT-scan images of foam specimens and are used to create 3-dimensional (3D) foam models. To model the mechanical behavior of the micro-structure of such structures, elastic-plastic material models with material properties of the bulk material (aluminum) is used. For comparison purposes, in addition to micro-mechanical models, macro-mechanical finite element models of the foam specimens are also created using volumetric elements, and crushable foam material model is assigned to them. Several experimental tests are also carried out and their results will be used to find out which of the two (micro- or macro-structural) models can better predict the mechanical response of the foam specimens.

2. Experimental Tests
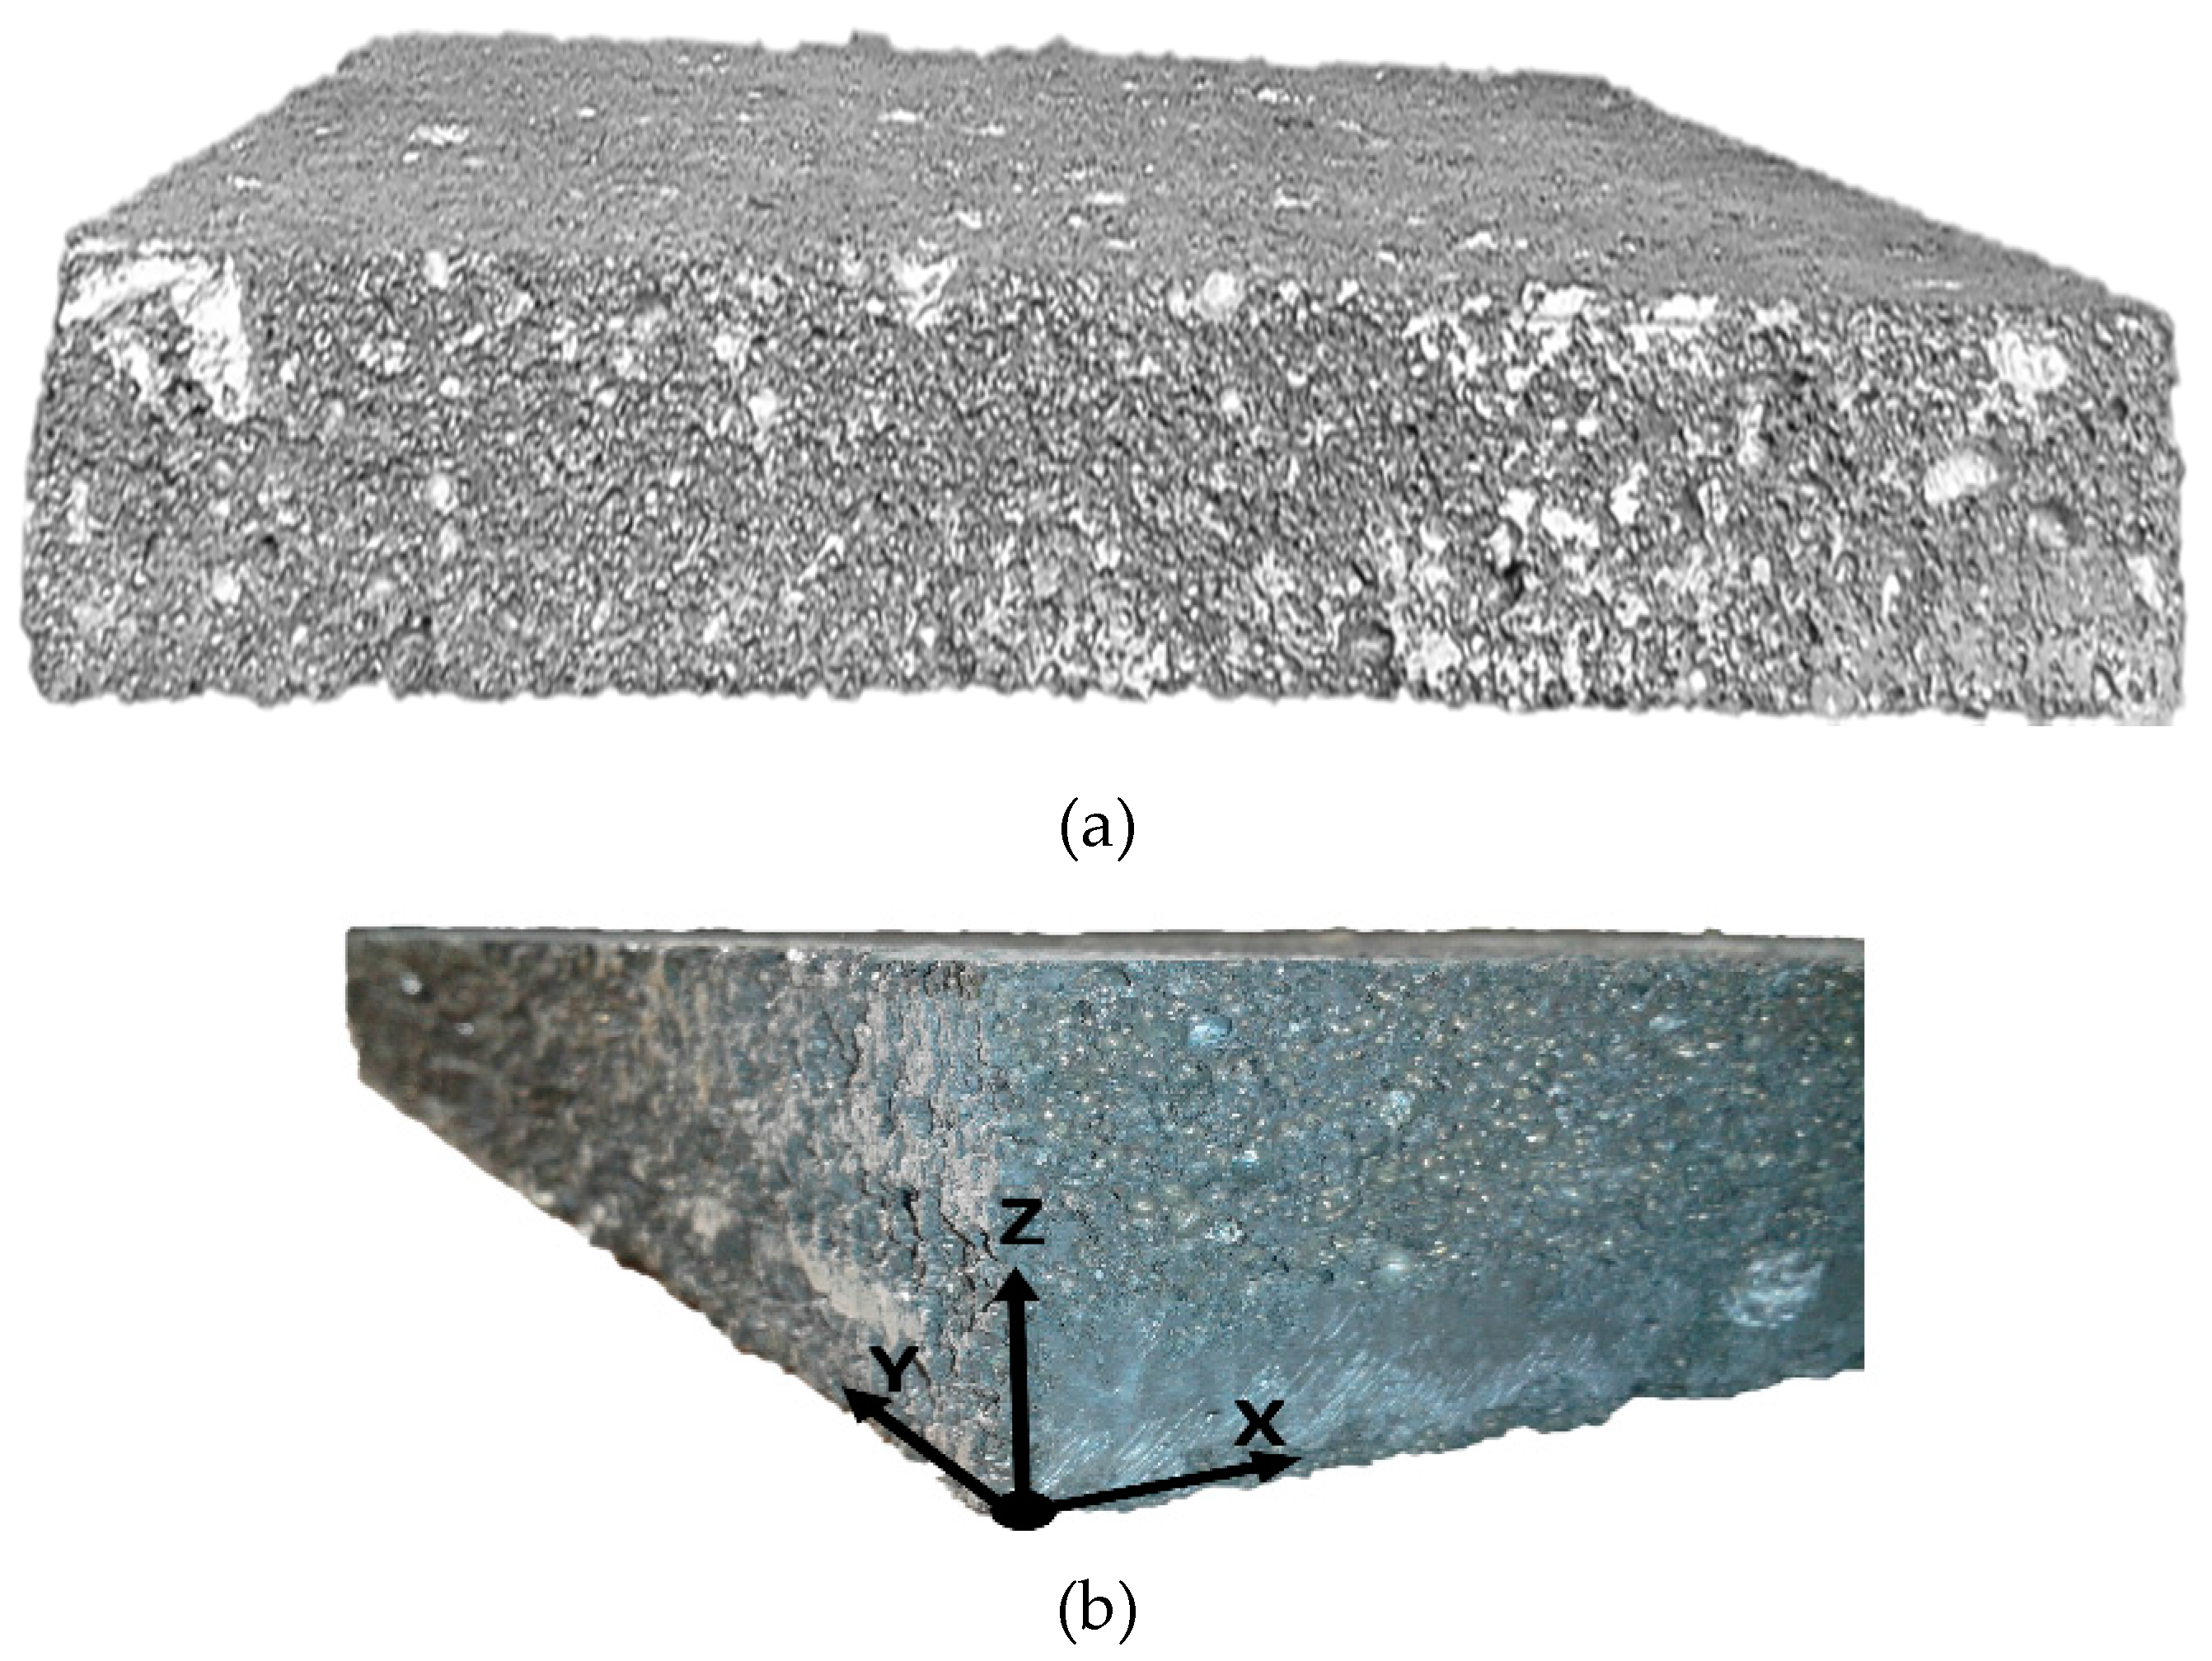
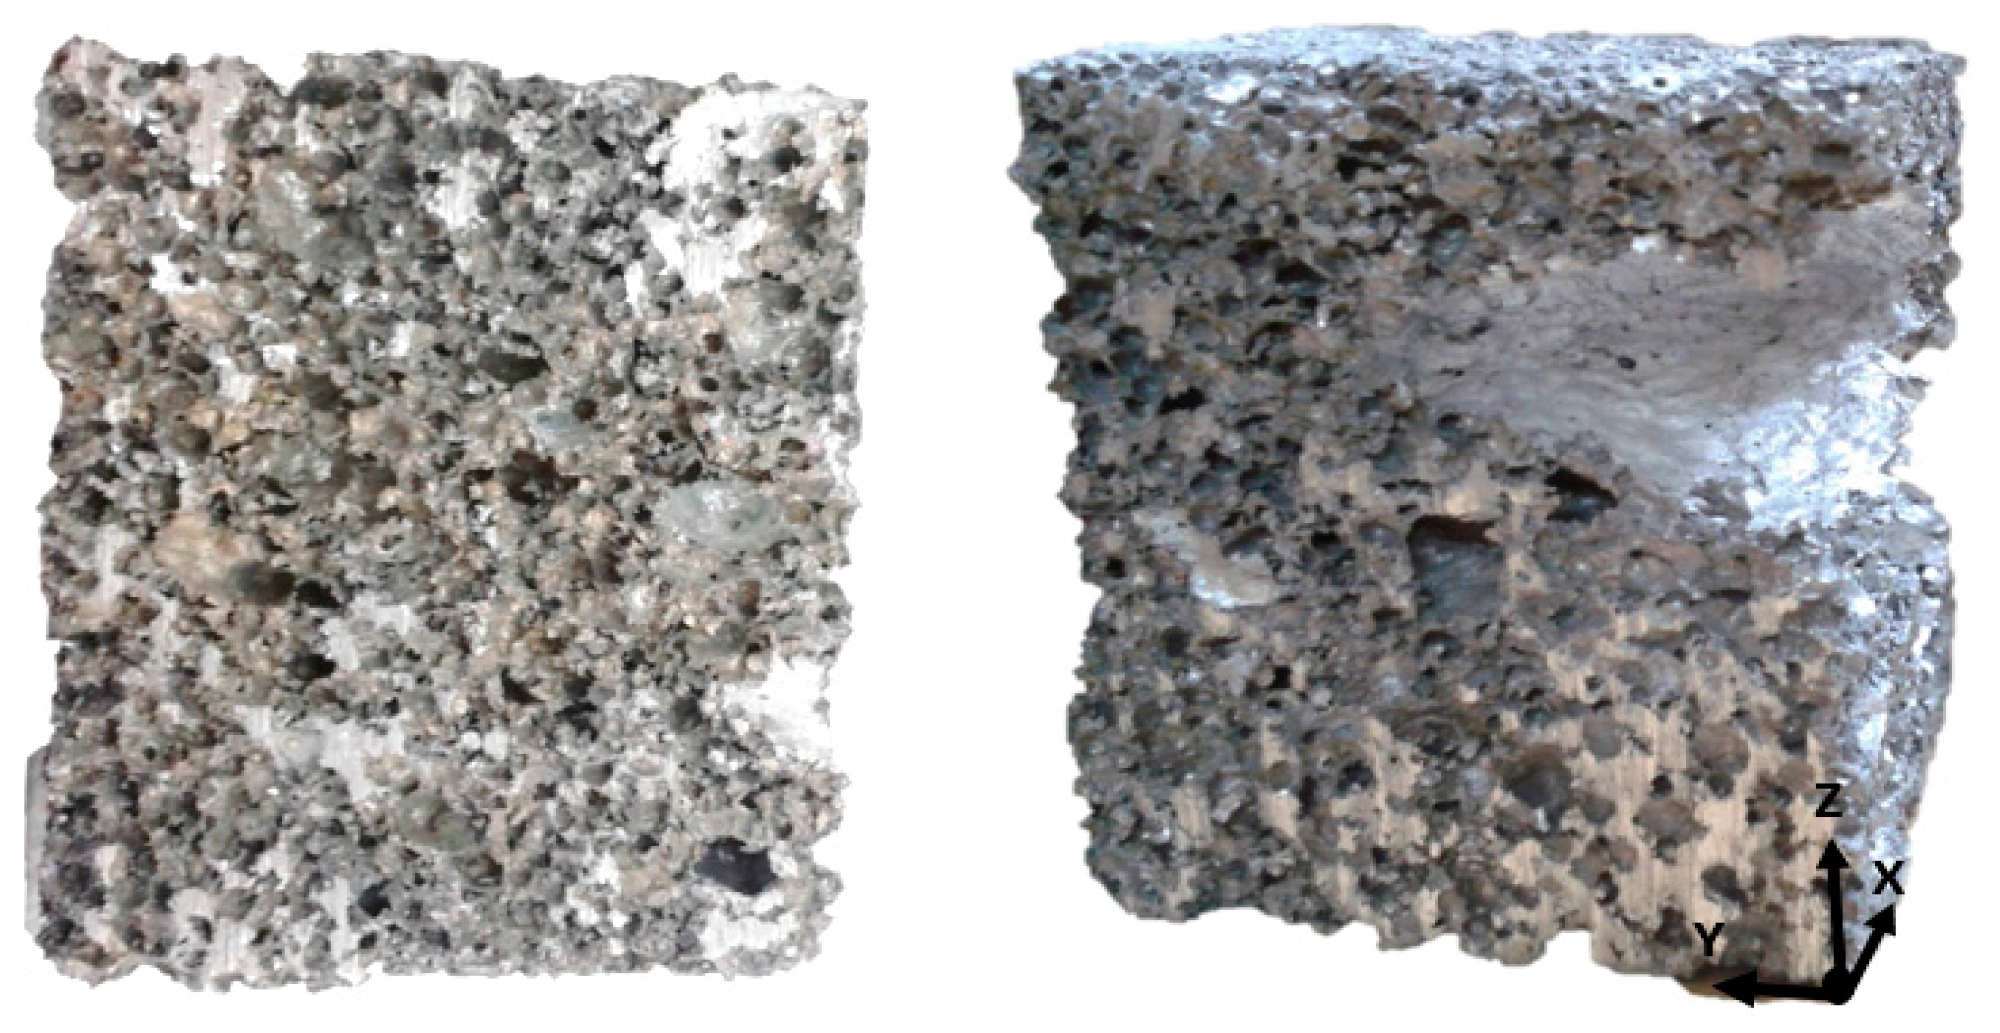
2.1. Material

Aluminum alloy A356 (Table 1) was used to manufacture a foam plate by the melting method (Figure 1). The foam plate had the dimensions of 20 × 20 × 4 cm3. The diameter of the pores was measured from the CT-scan images. The average pore size in the specimens was 1.5 mm. The foam plate was cut into several specimens with dimensions around 3 × 3 × 4 cm3. (Figure 2). In each specimen, coordinate z represents the longer direction of the specimen. The mean density of the prepared specimens was in the range of 600–800 kg/m3. The relative large range of densities was due to the presence of very large cavities in some specimens with sizes dozens of times larger than the pore size (For example see Figure 2 right).
It must be noted that the dimension of the cut specimen must be at least seven times the cell size [13,16] (it has be noted in [15,19,20] that the specimen dimensions must be at least 5 times the cell size) to avoid cell size and free boundary effects. The cells located in the exterior parts of the specimen are less constrained than the cells located in the central part of the specimen, and, therefore, they have less contribution in the stiffness of the specimen. The dimensions of the specimens in this study were at least 20 times larger than the pore size. Table 2 lists the dimensions, the test type (static or impact) carried out on each specimen, and other test conditions.

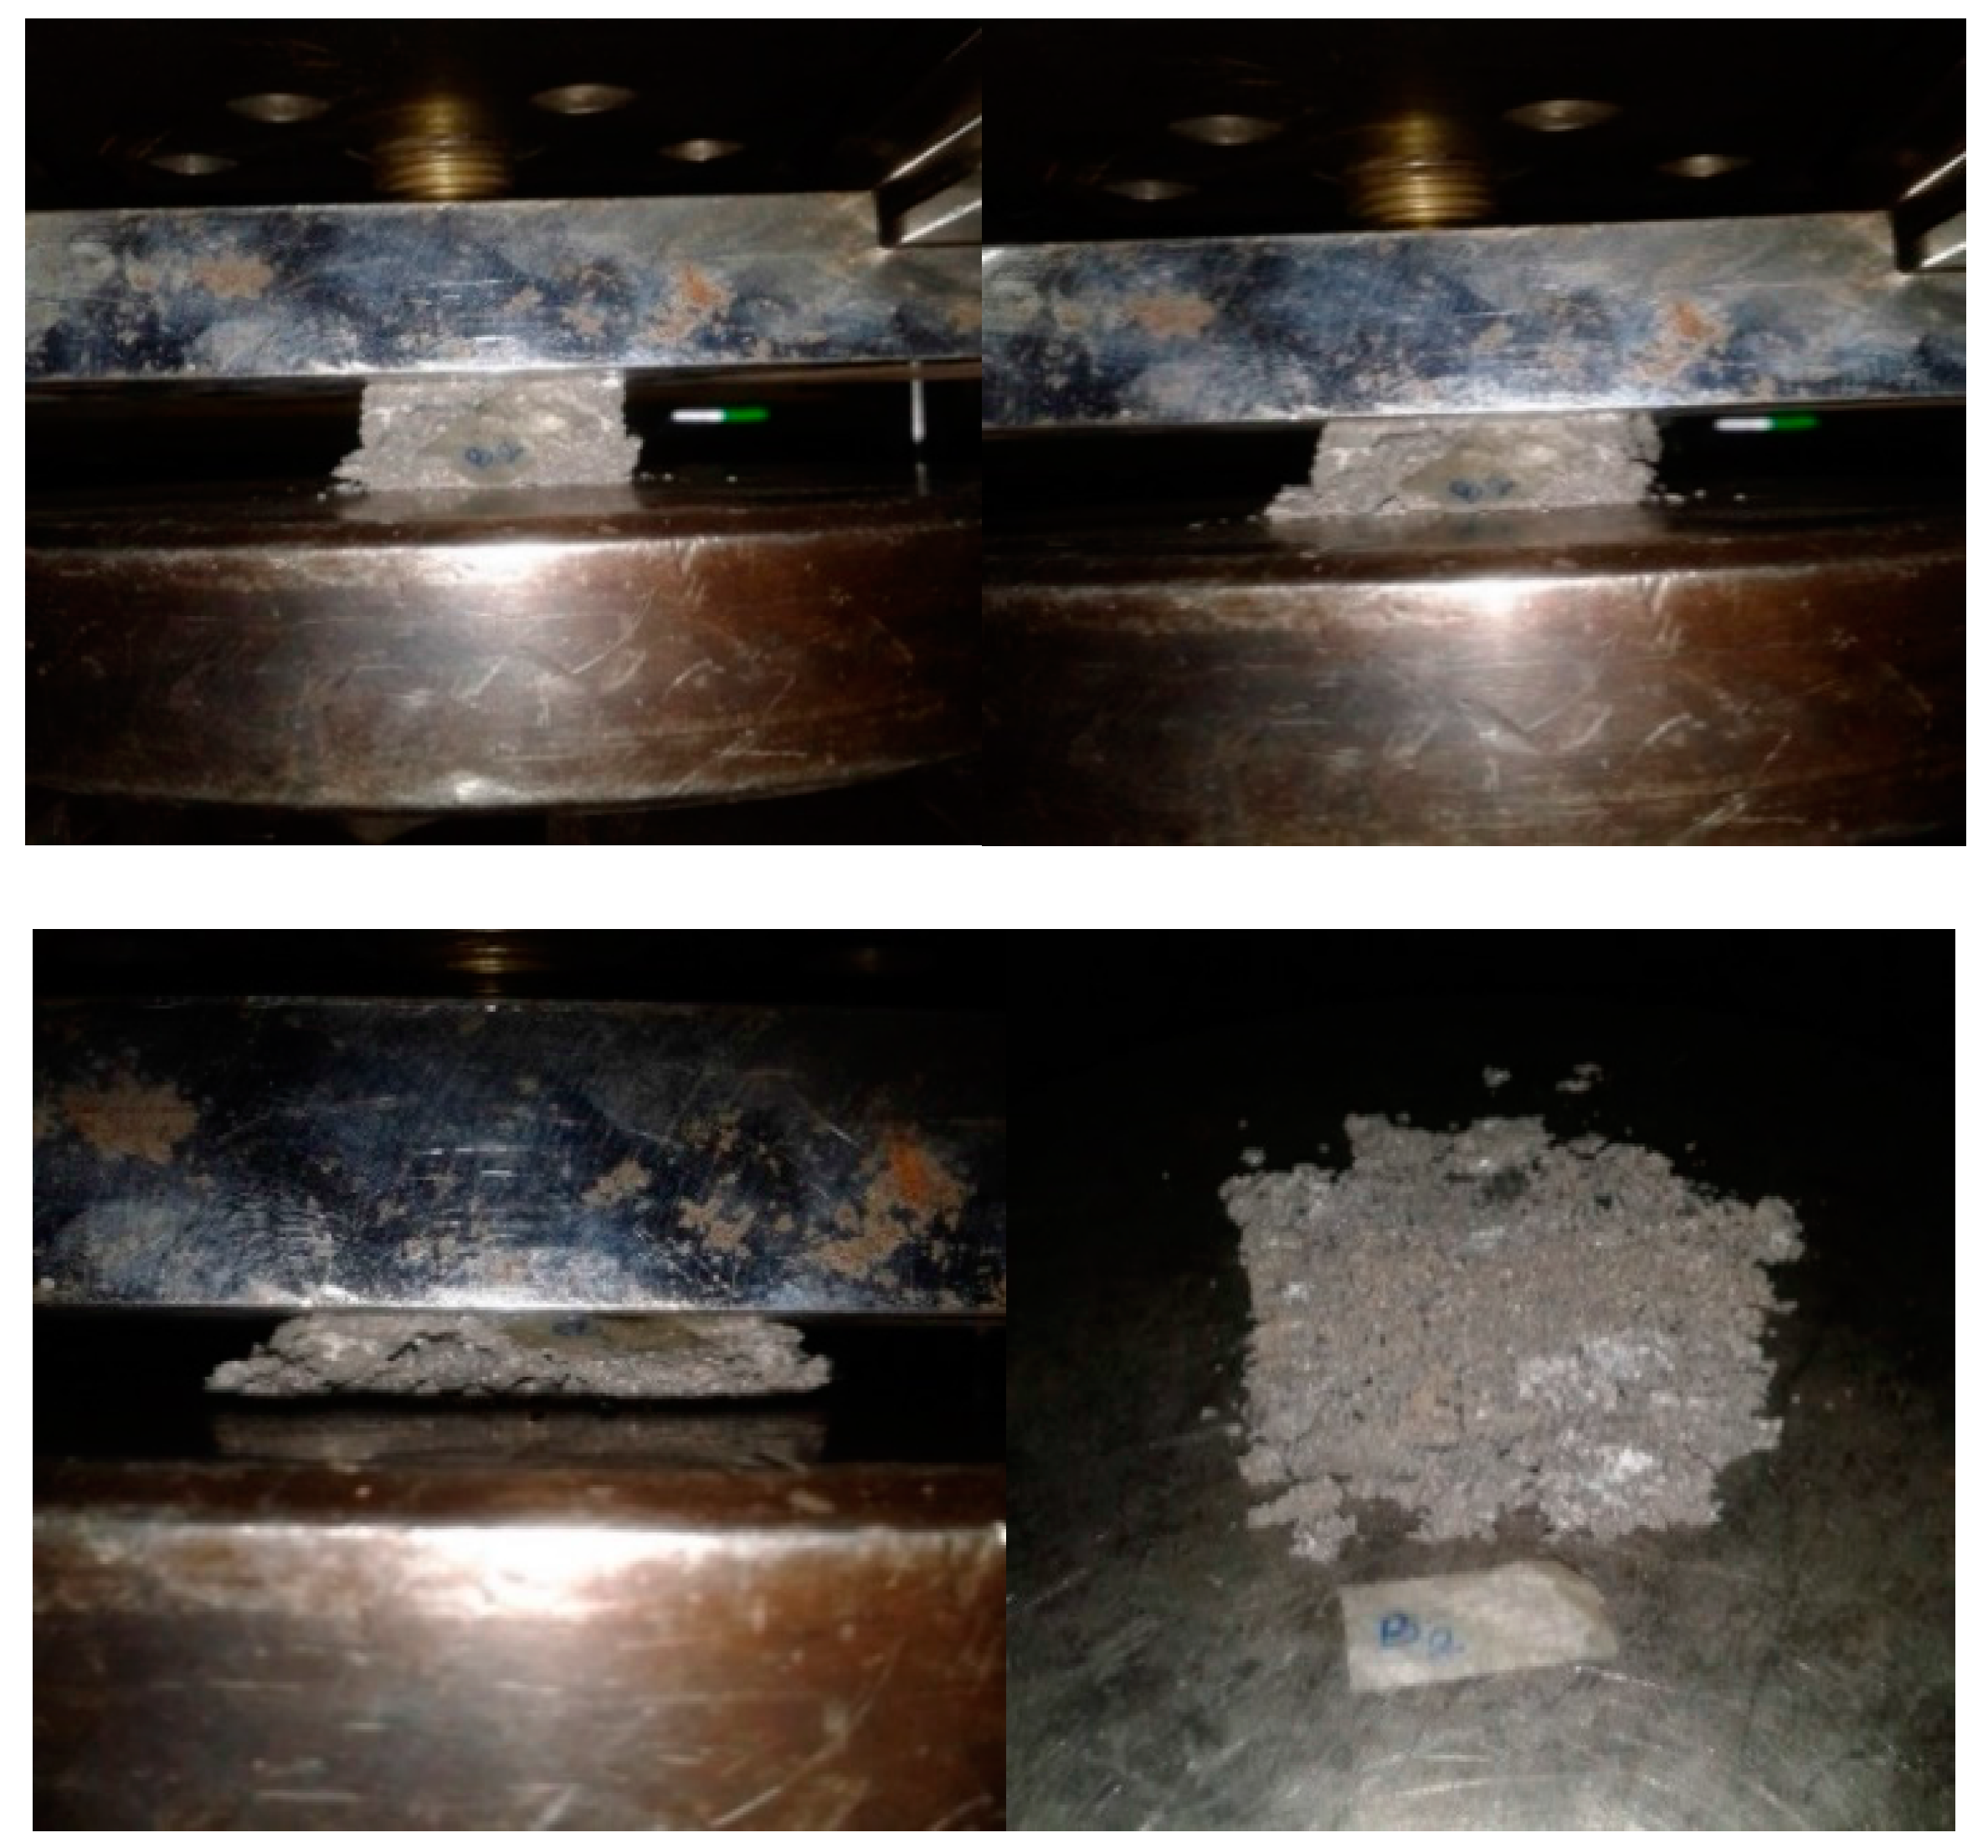
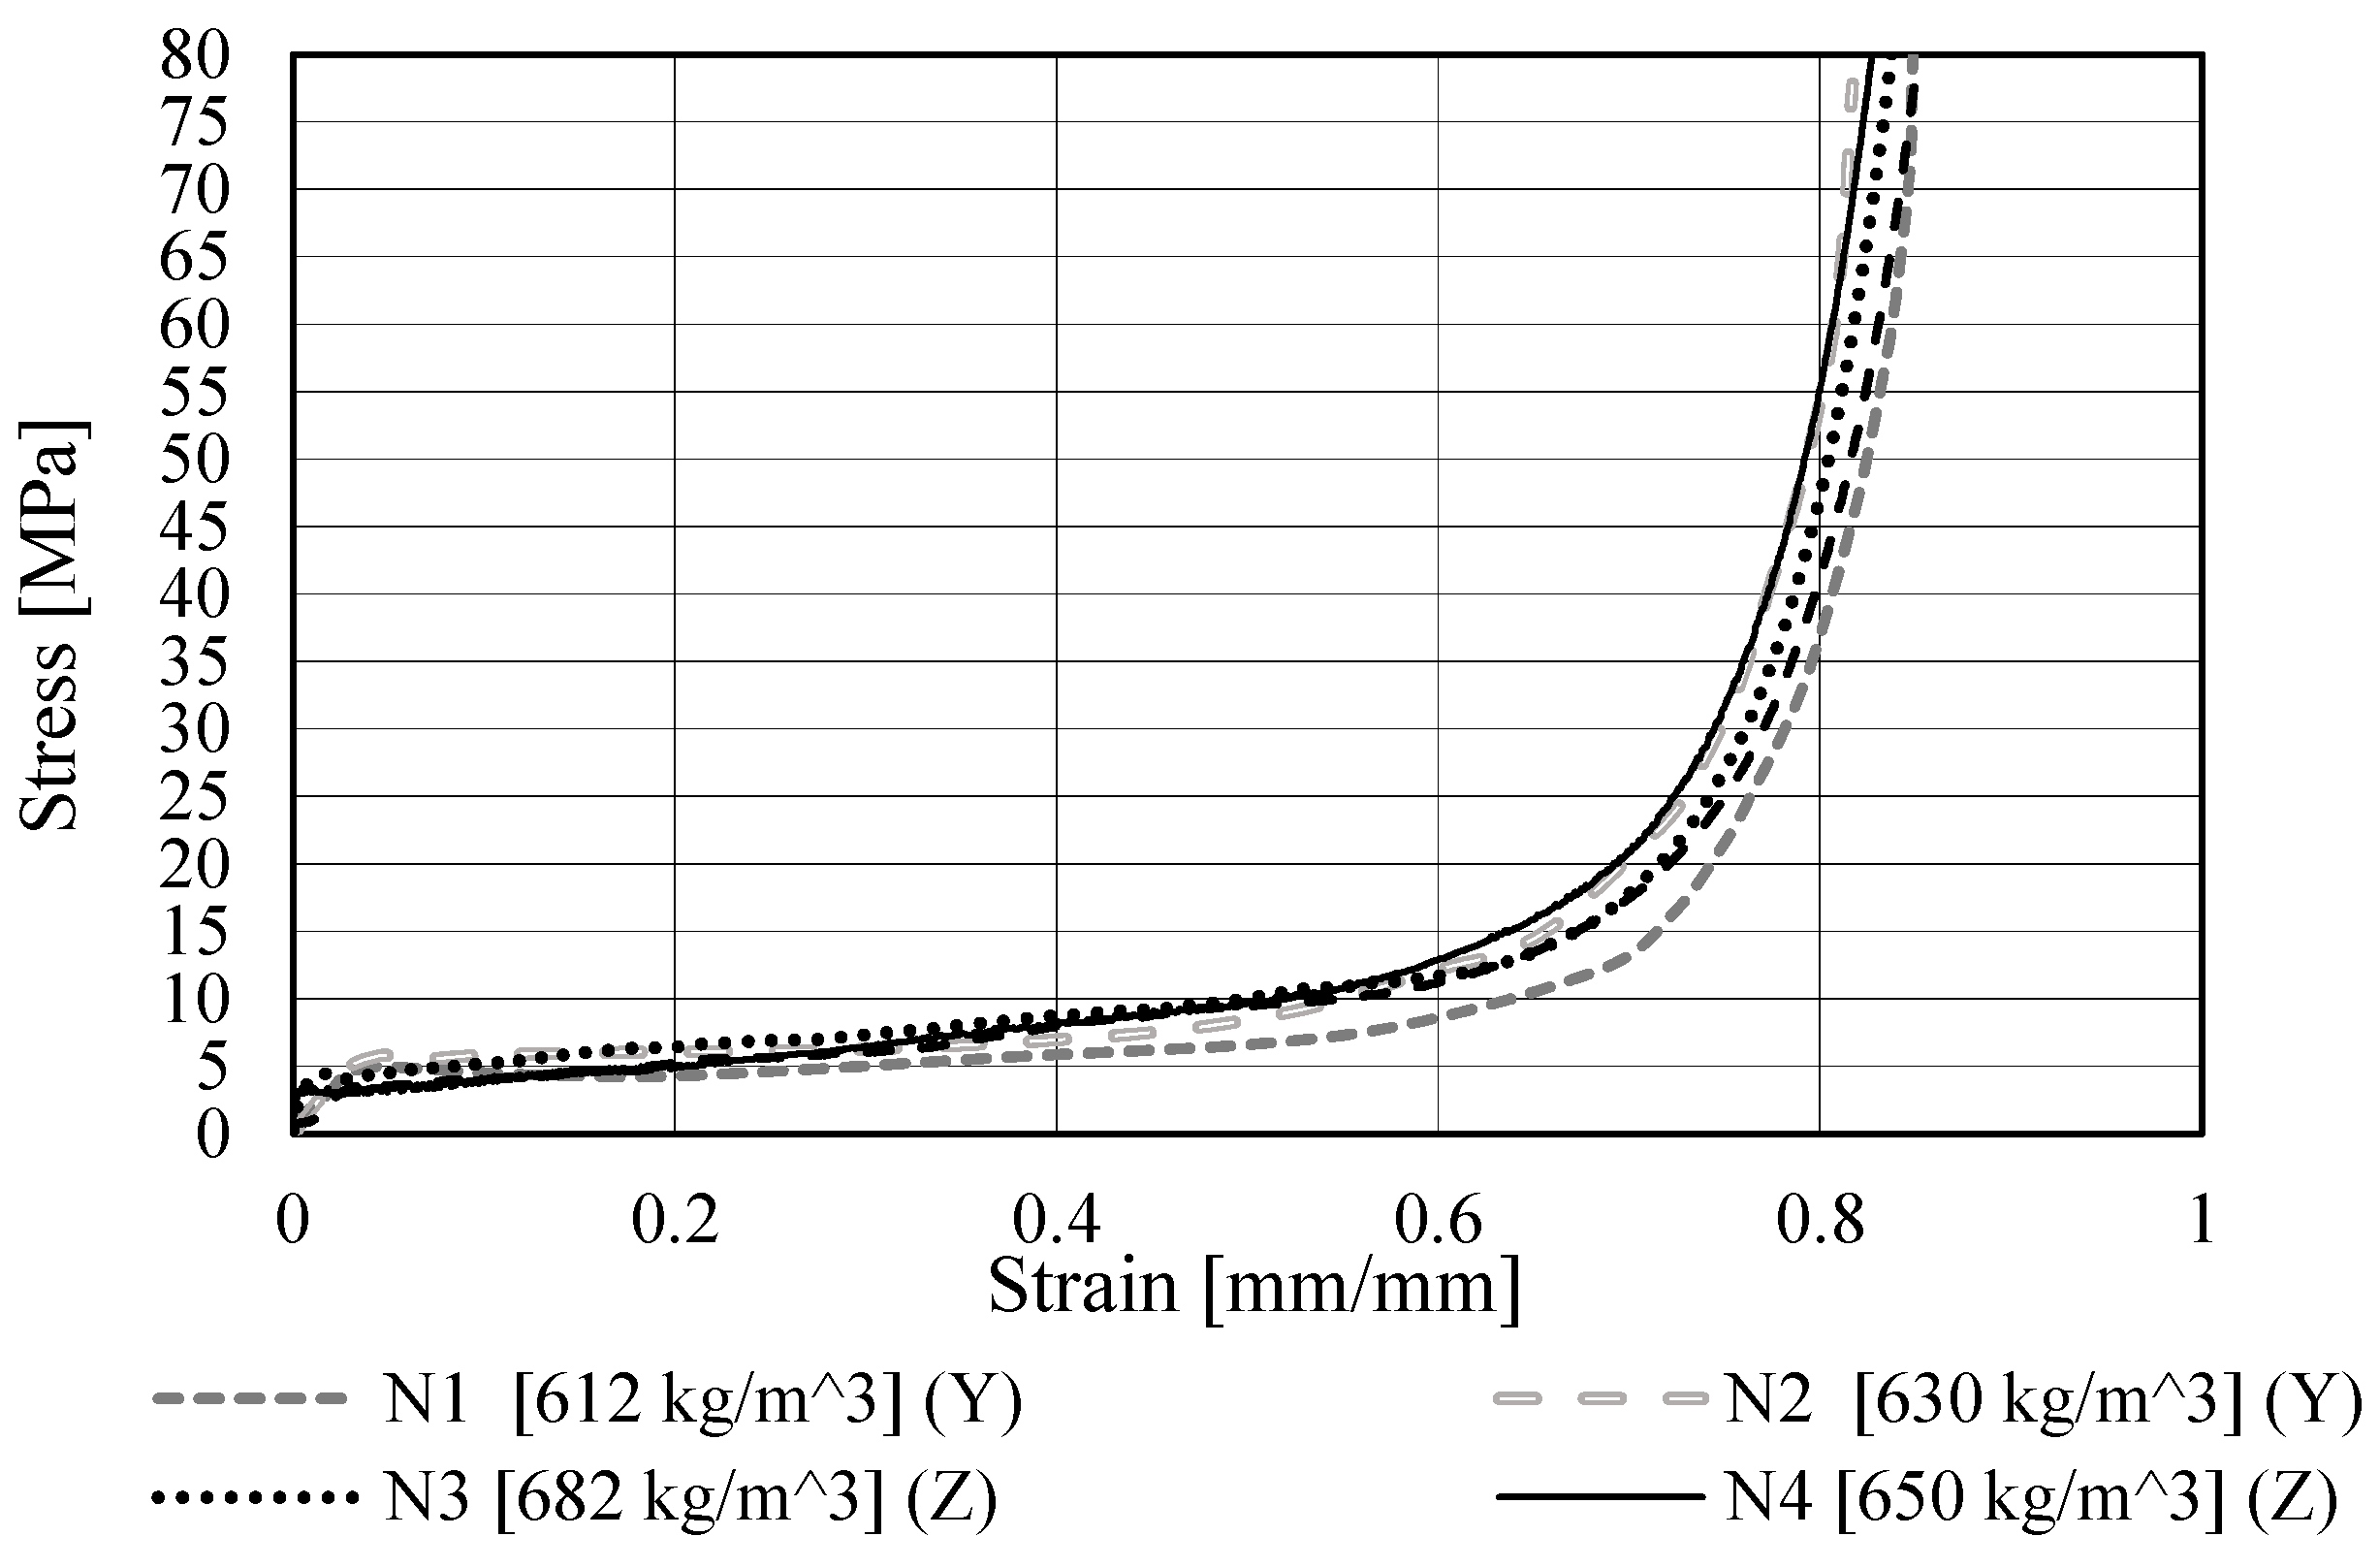
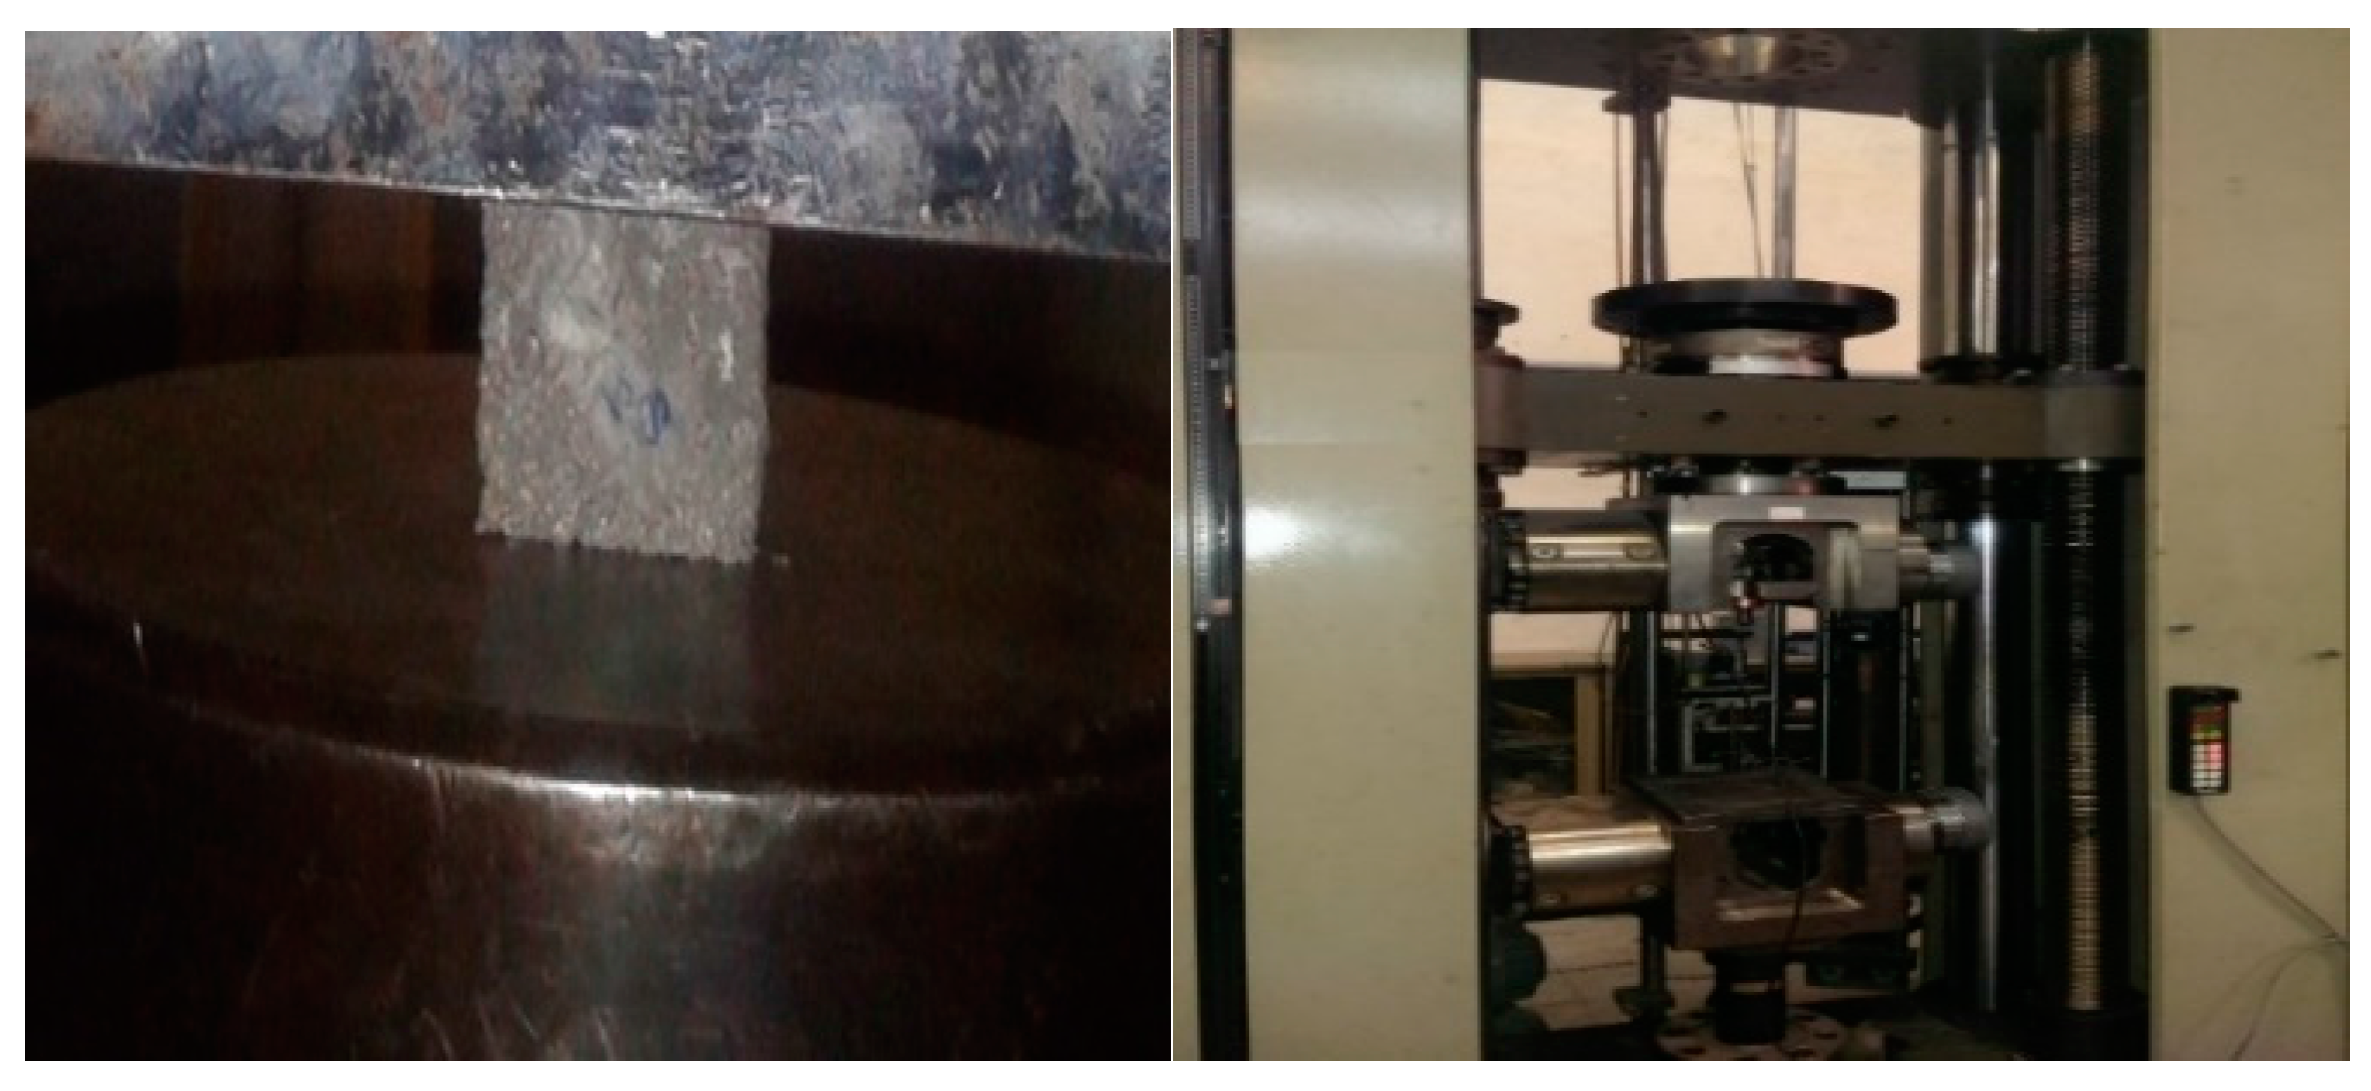
2.2. Compressive Quasi-Static Tests

In macro-structural FE analysis, knowing the macro-scale mechanical properties of the foams including their elastic modulus, yield stress, and stress-strain curve is necessary. Compressive quasi-static tests were carried out using Zwick 1494 (Zwick, Ulm, Germany) mechanical testing machine to obtain the data necessary for macro-scale FE modeling of the foam as well as to validate the results of the micro-scale FE models. Twelve compressive quasi-static tests were carried out on foam specimens in both y and z directions (N1-N12 in Table 2). To eliminate the strain-rate effects in the obtained results, the velocity of the top compression plate was set to a small value (2 mm/min). Figure 3 demonstrates the quasi-static compression test apparatus as well as the time sequences of the crushing of one of the specimens.

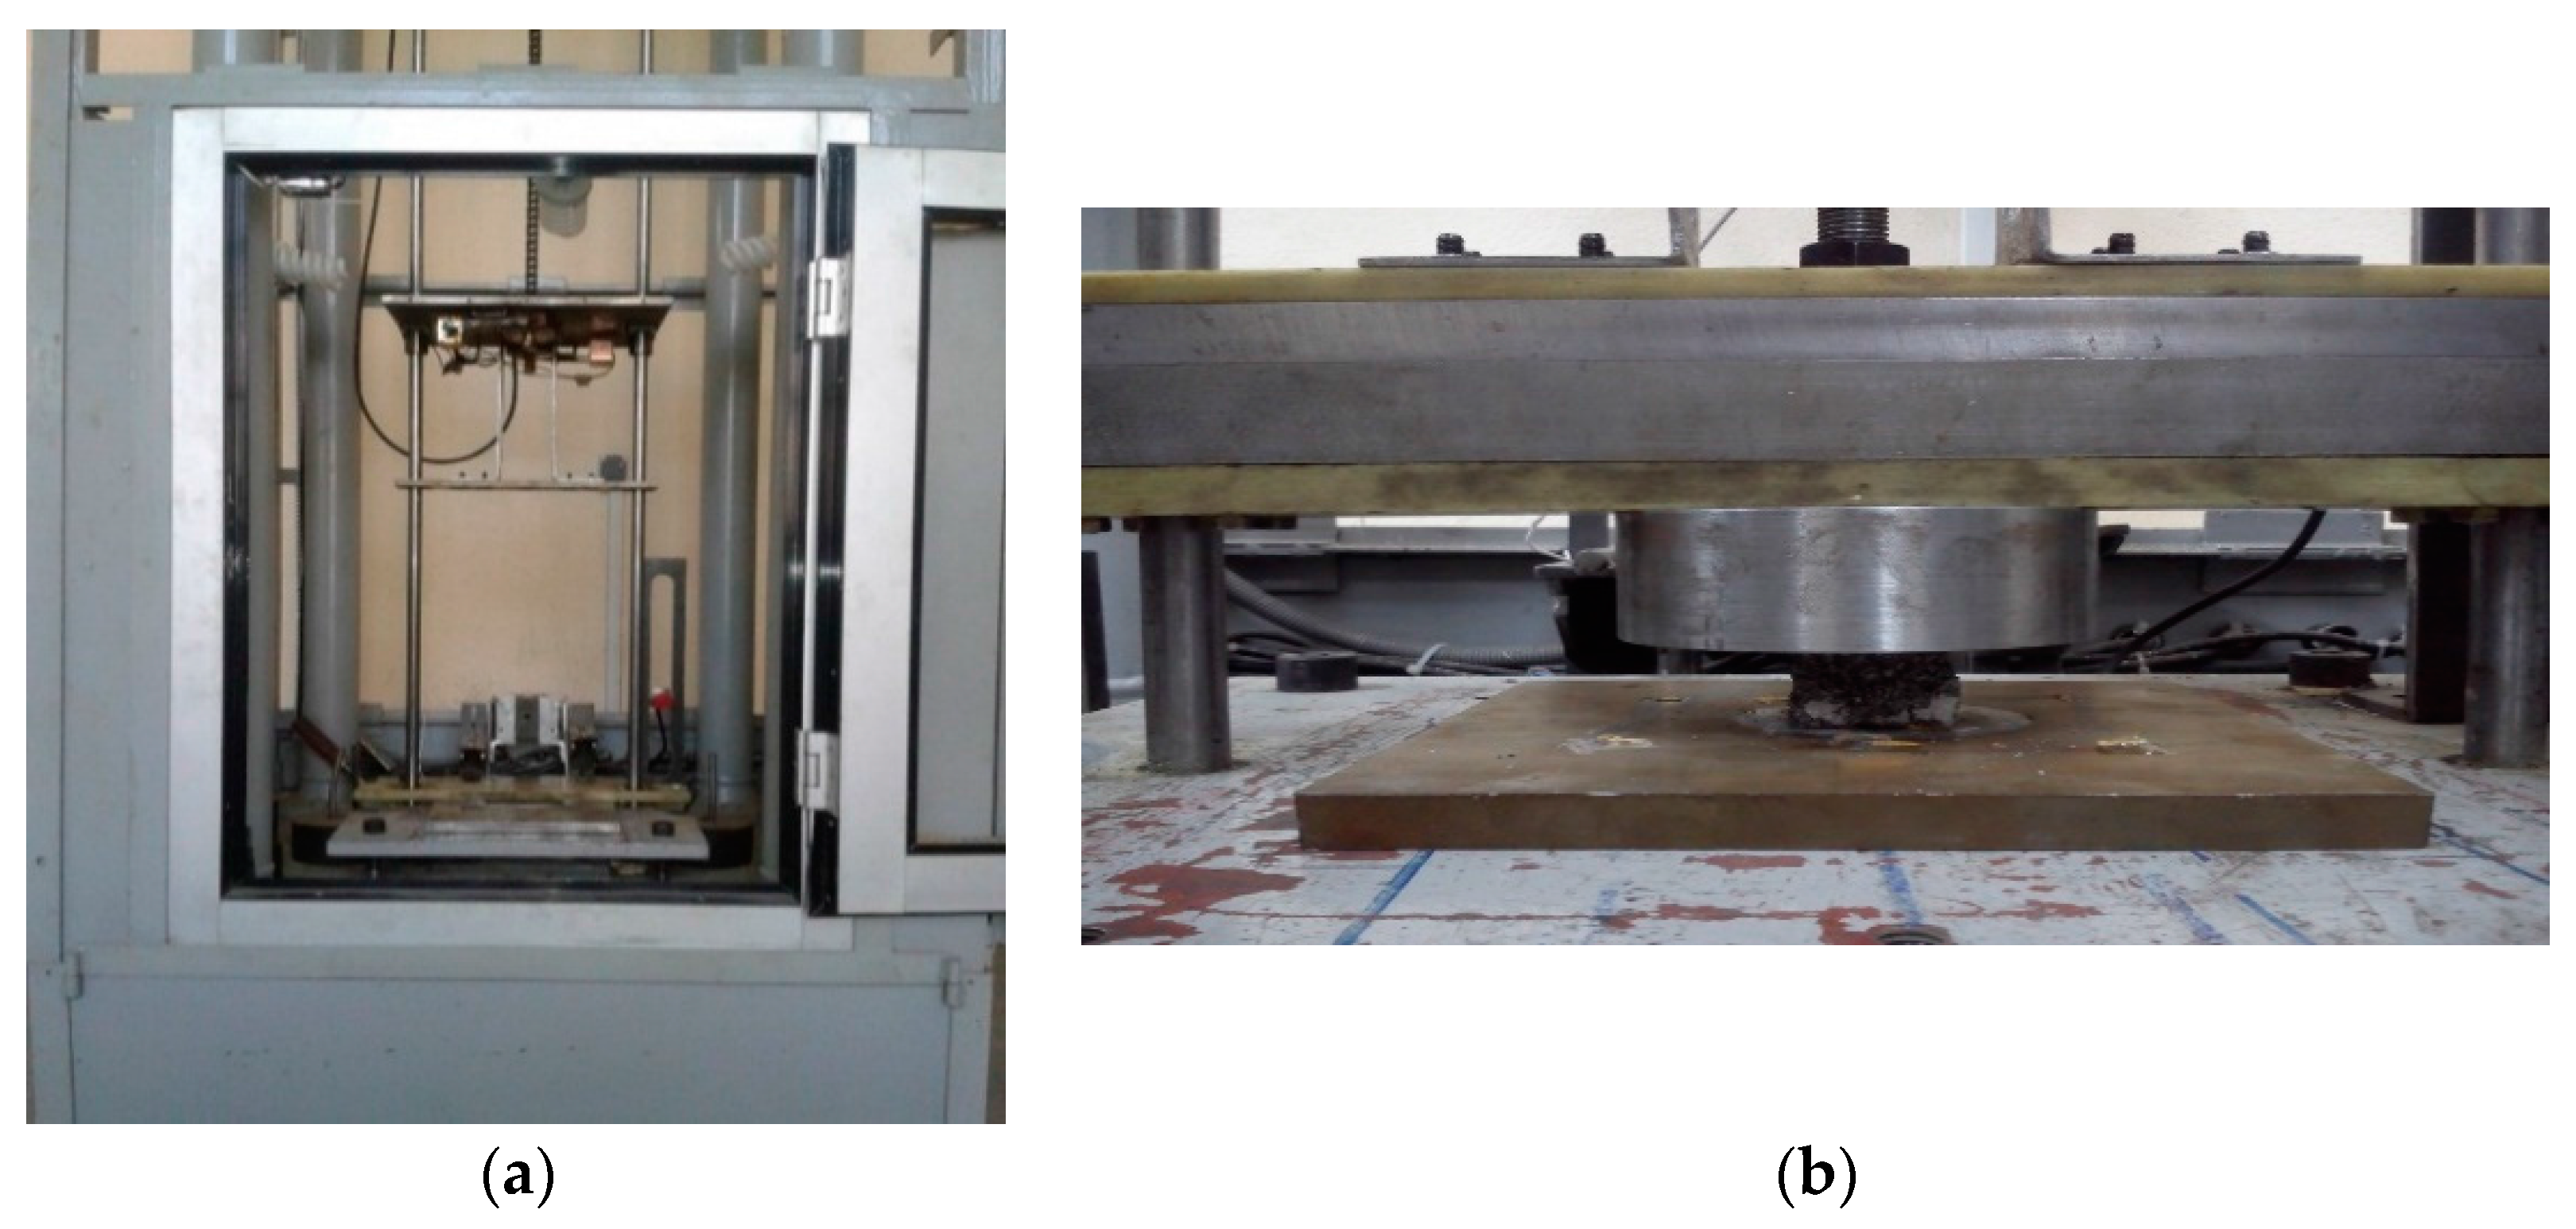
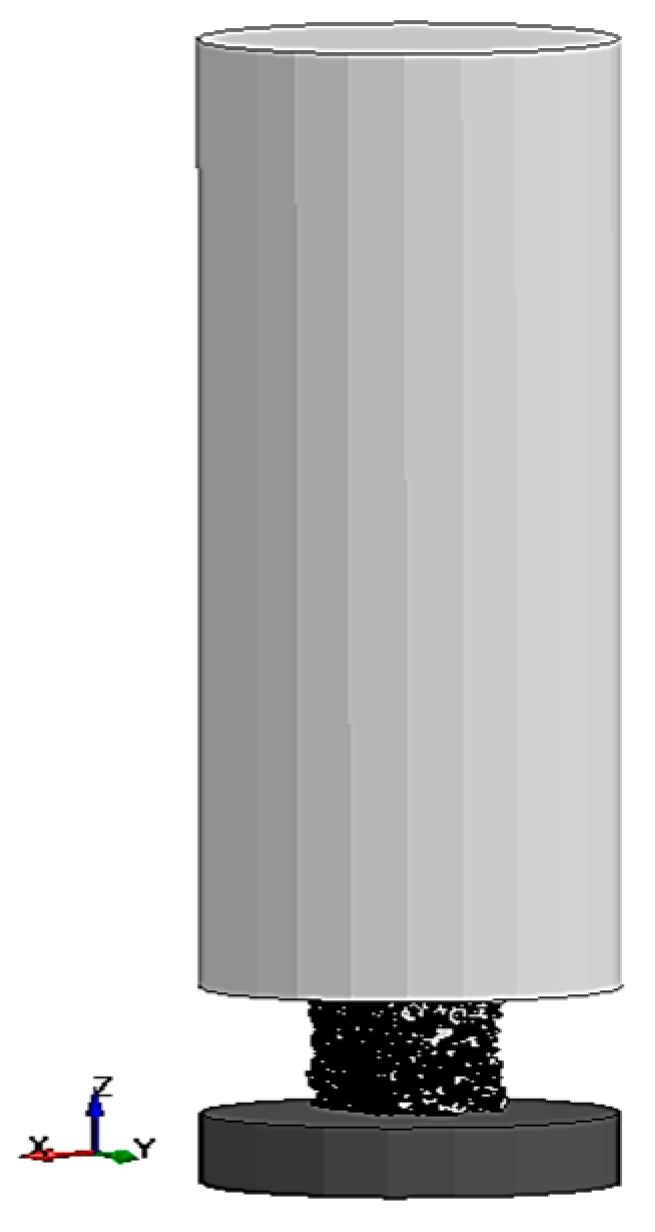
2.3. Drop Hammer Impact Tests
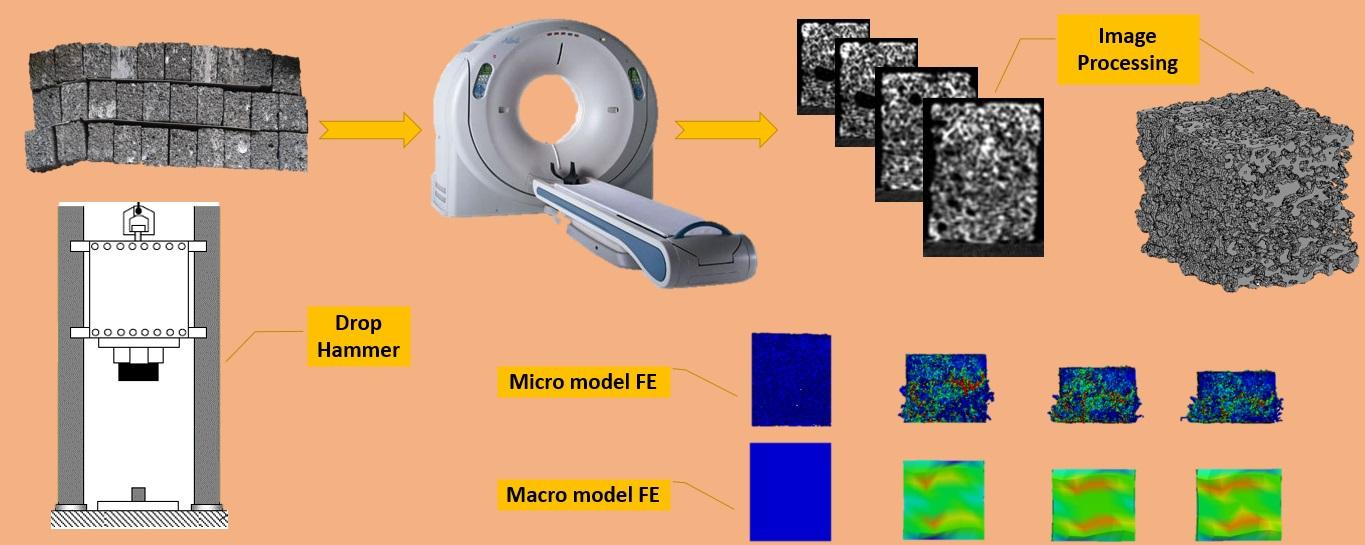
The impact tests were carried out using a lab-made drop-weight machine (Amirkabir University of Technology, Tehran, Iran). Two drop weights with flat mandrels (Figure 4) having the masses of M = 9 kg and 13.5 kg (N13-N20 in Table 2) were used. Two initial heights of h = 40 cm and 60 cm were chosen for the impact tests. The initial energy of the drop weight was calculated using the well-known potential energy formula U = Mgh.
An accelerometer sensor was attached on the top end of drop weight. The output of the recording device was acceleration-time diagram. By integrating the acceleration-time diagram over time, velocity-time and displacement-time diagrams of the drop weight were also achieved. Due to the propagation and reflection of the elastic stress waves in the system, the pores of the foam, and in the contact area between the foam and the compression plates, the output data of the recording device included some additional fluctuations. The noises observed in the acceleration-time diagrams were smoothed using SMOOTH function in MATLAB.
After calculating the area below the force-displacement diagram obtained for the drop weight, the maximum difference between the initial energy of the drop weight and the area below force-displacement diagram was found to be as small as 2.6% which verifies the validity of the methodology used to suppress the noises in data. Some parts of this 2.6% relate to the presence of friction between the impacting weight and the guiding rails.

3. FE Modeling

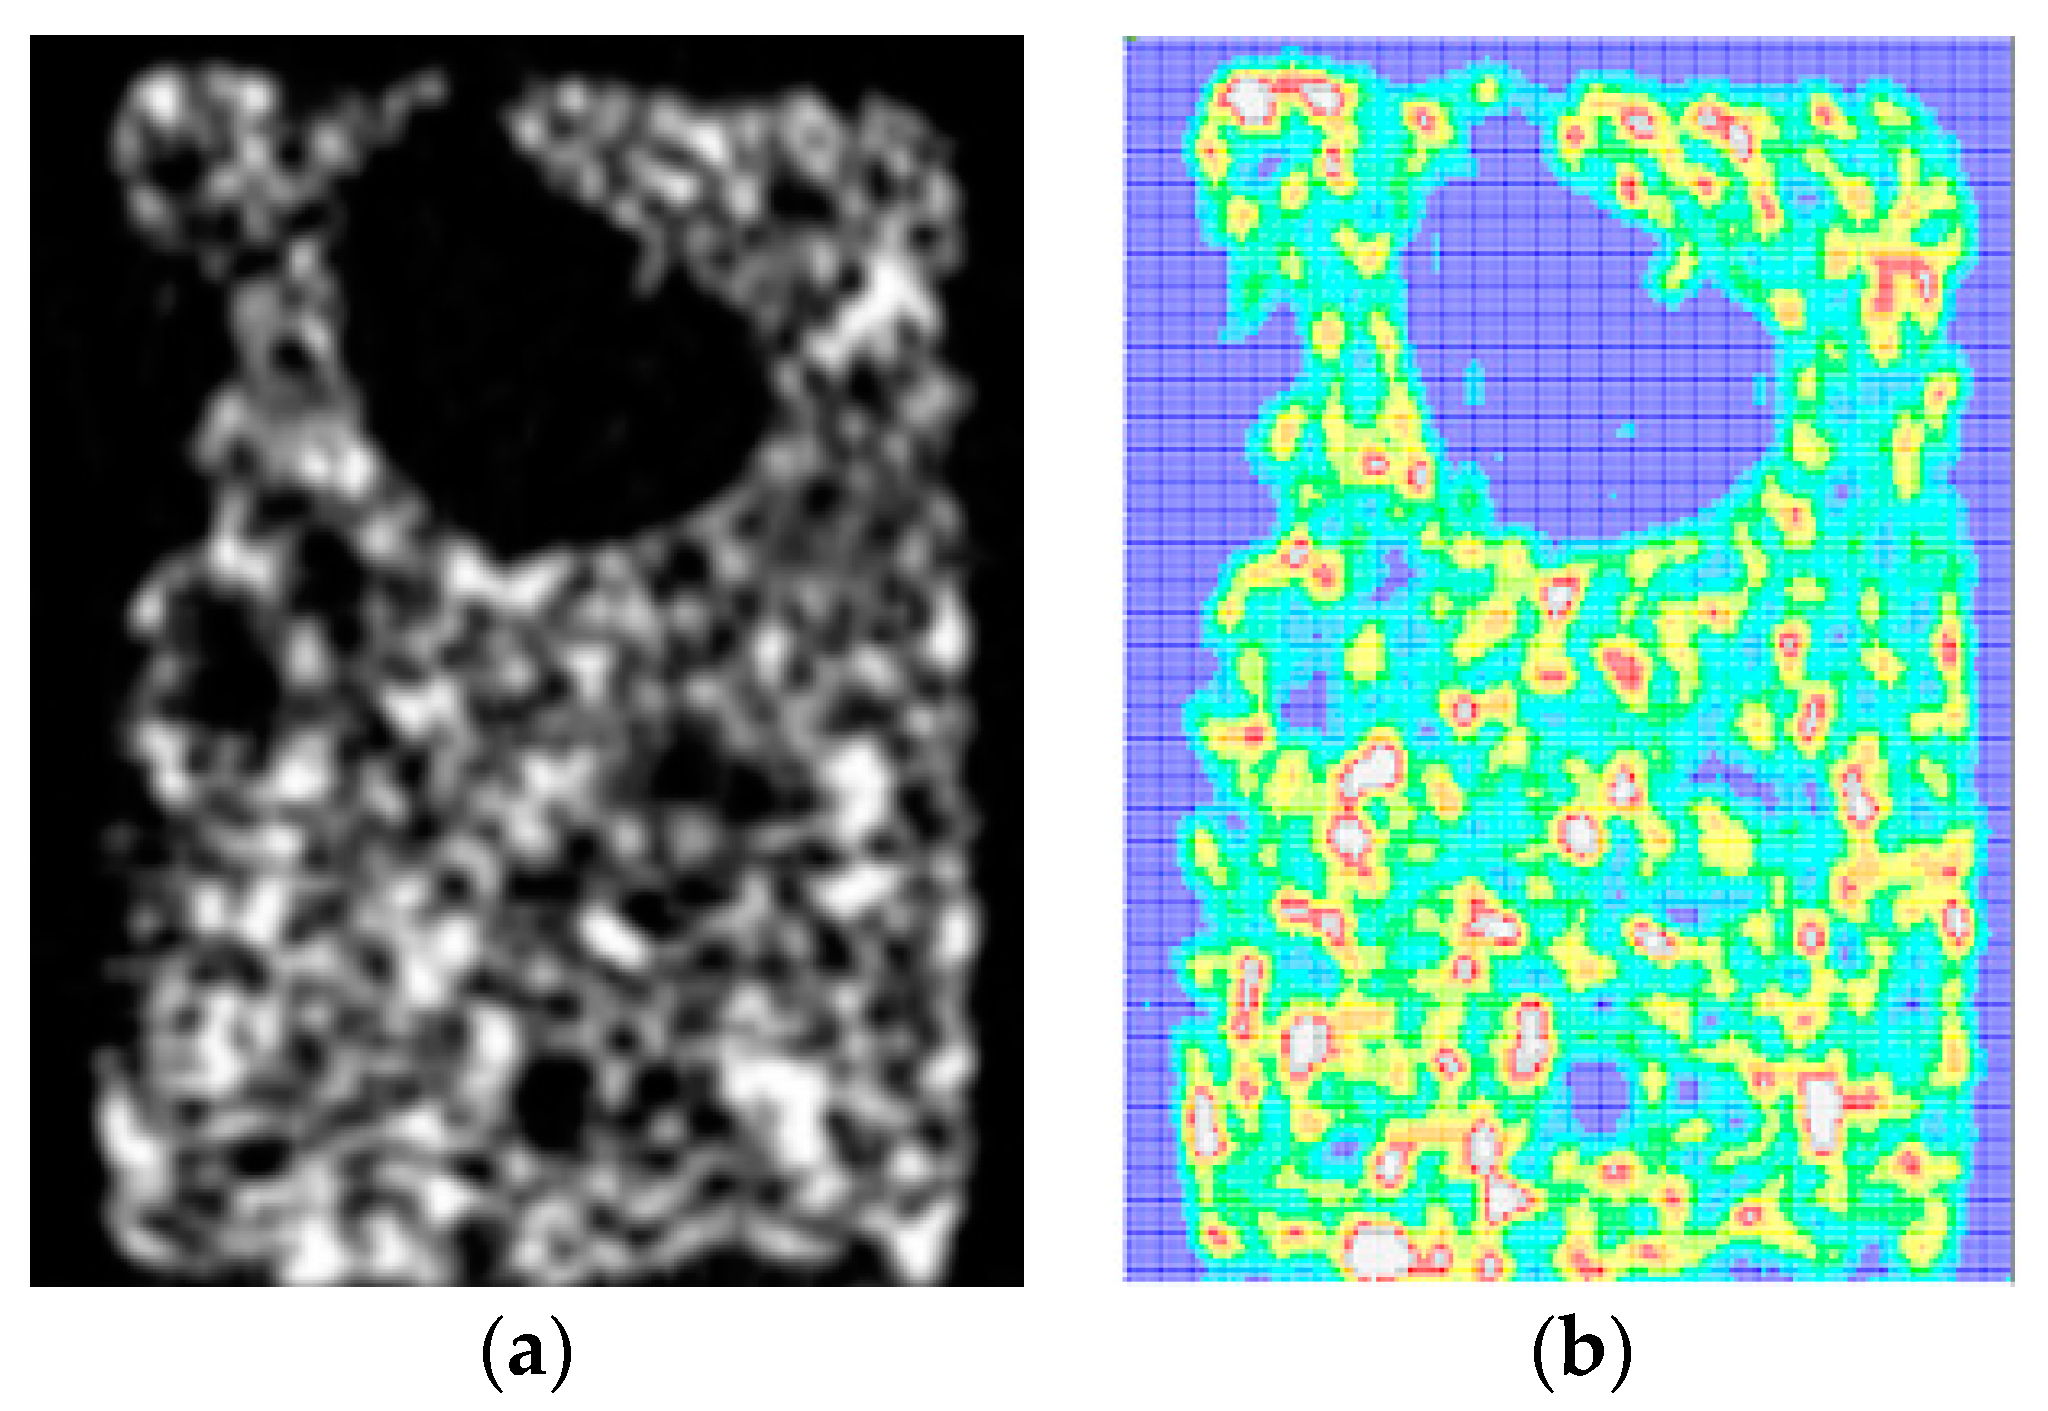
3.1. Micro-Scale Model

CT-scan images were used to model the micro-structure of the specimens in micro-scale FE models. For each foam specimen, about 250 CT images were obtained using a multislice CT-Scan 64 machine. The distance between each two consecutive images was 0.13 mm. Each CT image was discretized into an array of square cells each having different degrees of brightness. Generally, in a CT image, the dark points represent air (i.e., points with no material) and the bright points demonstrate the presence of material. Using a similar methodology to the one described in our previous work [21], a 3D structure made up of cubic elements was constructed for each specimen. A CT-scan image and the cross-section of the corresponding constructed 3D FE model is shown in Figure 5. The cubic elements used to construct the 3D structure were of 3D solid element type in ANSYS/LS-DYNA. The micro-structural FE model of each specimen consisted of about 660,000 elements.
The Plastic–Kinematic material model in ANSYS/LS-DYNA was used to describe the material behavior of A356 alloy. One of the advantages of the noted material model is that it includes the Cowper–Symonds relationship which determines the behavior of material in high strain rates:
σ y d = σ y s [ 1 + ( ε ˙ C ) 1 p ]
In Equation (1), C and p are constants corresponding to strain rate effect and are C = 5 and p = 4 for A356 alloy [17,22,23]. The aluminum alloys are usually low-sensitive to strain rate [22]. The Plastic-kinematic material model in ANSYS/LS-DYNA also includes a parameter Fs which represents the failure strain and was used to eliminate the failed elements after being highly distorted. The graphical view of the micro-structural FE model of a specimen is shown in Figure 6.
The largest dimension of each specimen (in z direction) was about 4 cm. To simulate the actual conditions of impact, an impactor and a flat plate were placed above and below the micro-structural model of foam (Figure 7). The mechanical properties of stainless steel (with elastic modulus of 200 GPa and Poisson’s ratio of 0.3) was used for describing the mechanical behavior of both the impactor and the flat plate. To model the interaction between the foam and the solid parts above and below it, AUTOMATIC_SURAFCE_TO_SURFACE contact algorithm was used. Self-contact was also defined for the elements of the foam model using AUTOMATIC_SINGLE_SURFACE contact algorithm in order to avoid artificial penetration of the foam elements into each other.
In all the FE models, the initial velocity of the drop weight for each specimen was obtained using the well-known formula V c = 2 g h , where h is a known parameter and is taken from Table 2.

3.2. Macro-Scale Model

To investigate the superiority or inferiority of the micro-structural FE model with respect to traditional macro-scale FE models, macro-structural FE models were also constructed and analyzed. Both the explicit FE solvers of ABAQUS and ANSYS/LS-DYNA were used for analyzing the macro-structural FE models. In both the FE models, crushable foam material model was used to describe the mechanical behavior of the foam. In ABAQUS, the crushable foam material model is based on the theory developed by Deshpande and Fleck for isotropic hardening materials [24,25] and has been used in [15,26,27,28,29,30,31] for modeling the material behavior of foams in ABAQUS package. This material model is also used in [14,32,33,34] for modeling the mechanical behavior of foams in LS-DYNA FE package. The yield surface for volumetric hardening model is [25]
F = q 2 + α 2 ( p p 0 ) 2 B = 0
where p is the pressure stress, q is the Mises stress, A is the size of the (horizontal) p-axis of the yield ellipse, B = α A = α p c + p t 2 is the size of the (vertical) q-axis of the yield ellipse, α = B/A is the shape factor of the yield ellipse that defines the relative magnitude of the axes, p0 is the center of yield ellipse on the p-axis, pc is the yield stress in hydrostatic compression, and pt is the strength of the material in hydrostatic tension [25].
The most important input for the crushable foam material model is the stress-strain curve obtained from quasi-static compressive tests. Figure 8 depicts the stress-strain curves of specimens N1, N2, N3, N4, and N5 in y and z directions. The slope of the stress-strain curve in the elastic part gives the elastic modulus of the foam specimens. To have more accurate elastic modulus values, four other specimens were tested under compression using a very sensitive load cell with low-capacity (1 kN). The elastic modulus obtained for four other specimens are listed in Table 3. As can be seen in Table 3, for foam specimens with relative densities around 25%, the elastic modulus was around 153 MPa.
To obtain the acceleration-time diagram for both micro- and macro-structural numerical models, the rigid body acceleration-time diagram of the impactor was used. The force-displacement diagram was obtained by multiplying the acceleration-time diagram by the mass of the impactor.
The boundary conditions were imposed on the specimen through contact forces between the drop weight and the samples as well as the sample and the lower compression plate. The bottom support plate was constrained in all the directions and the impactor was allowed to move only in the Z direction.

4. Results and Discussions

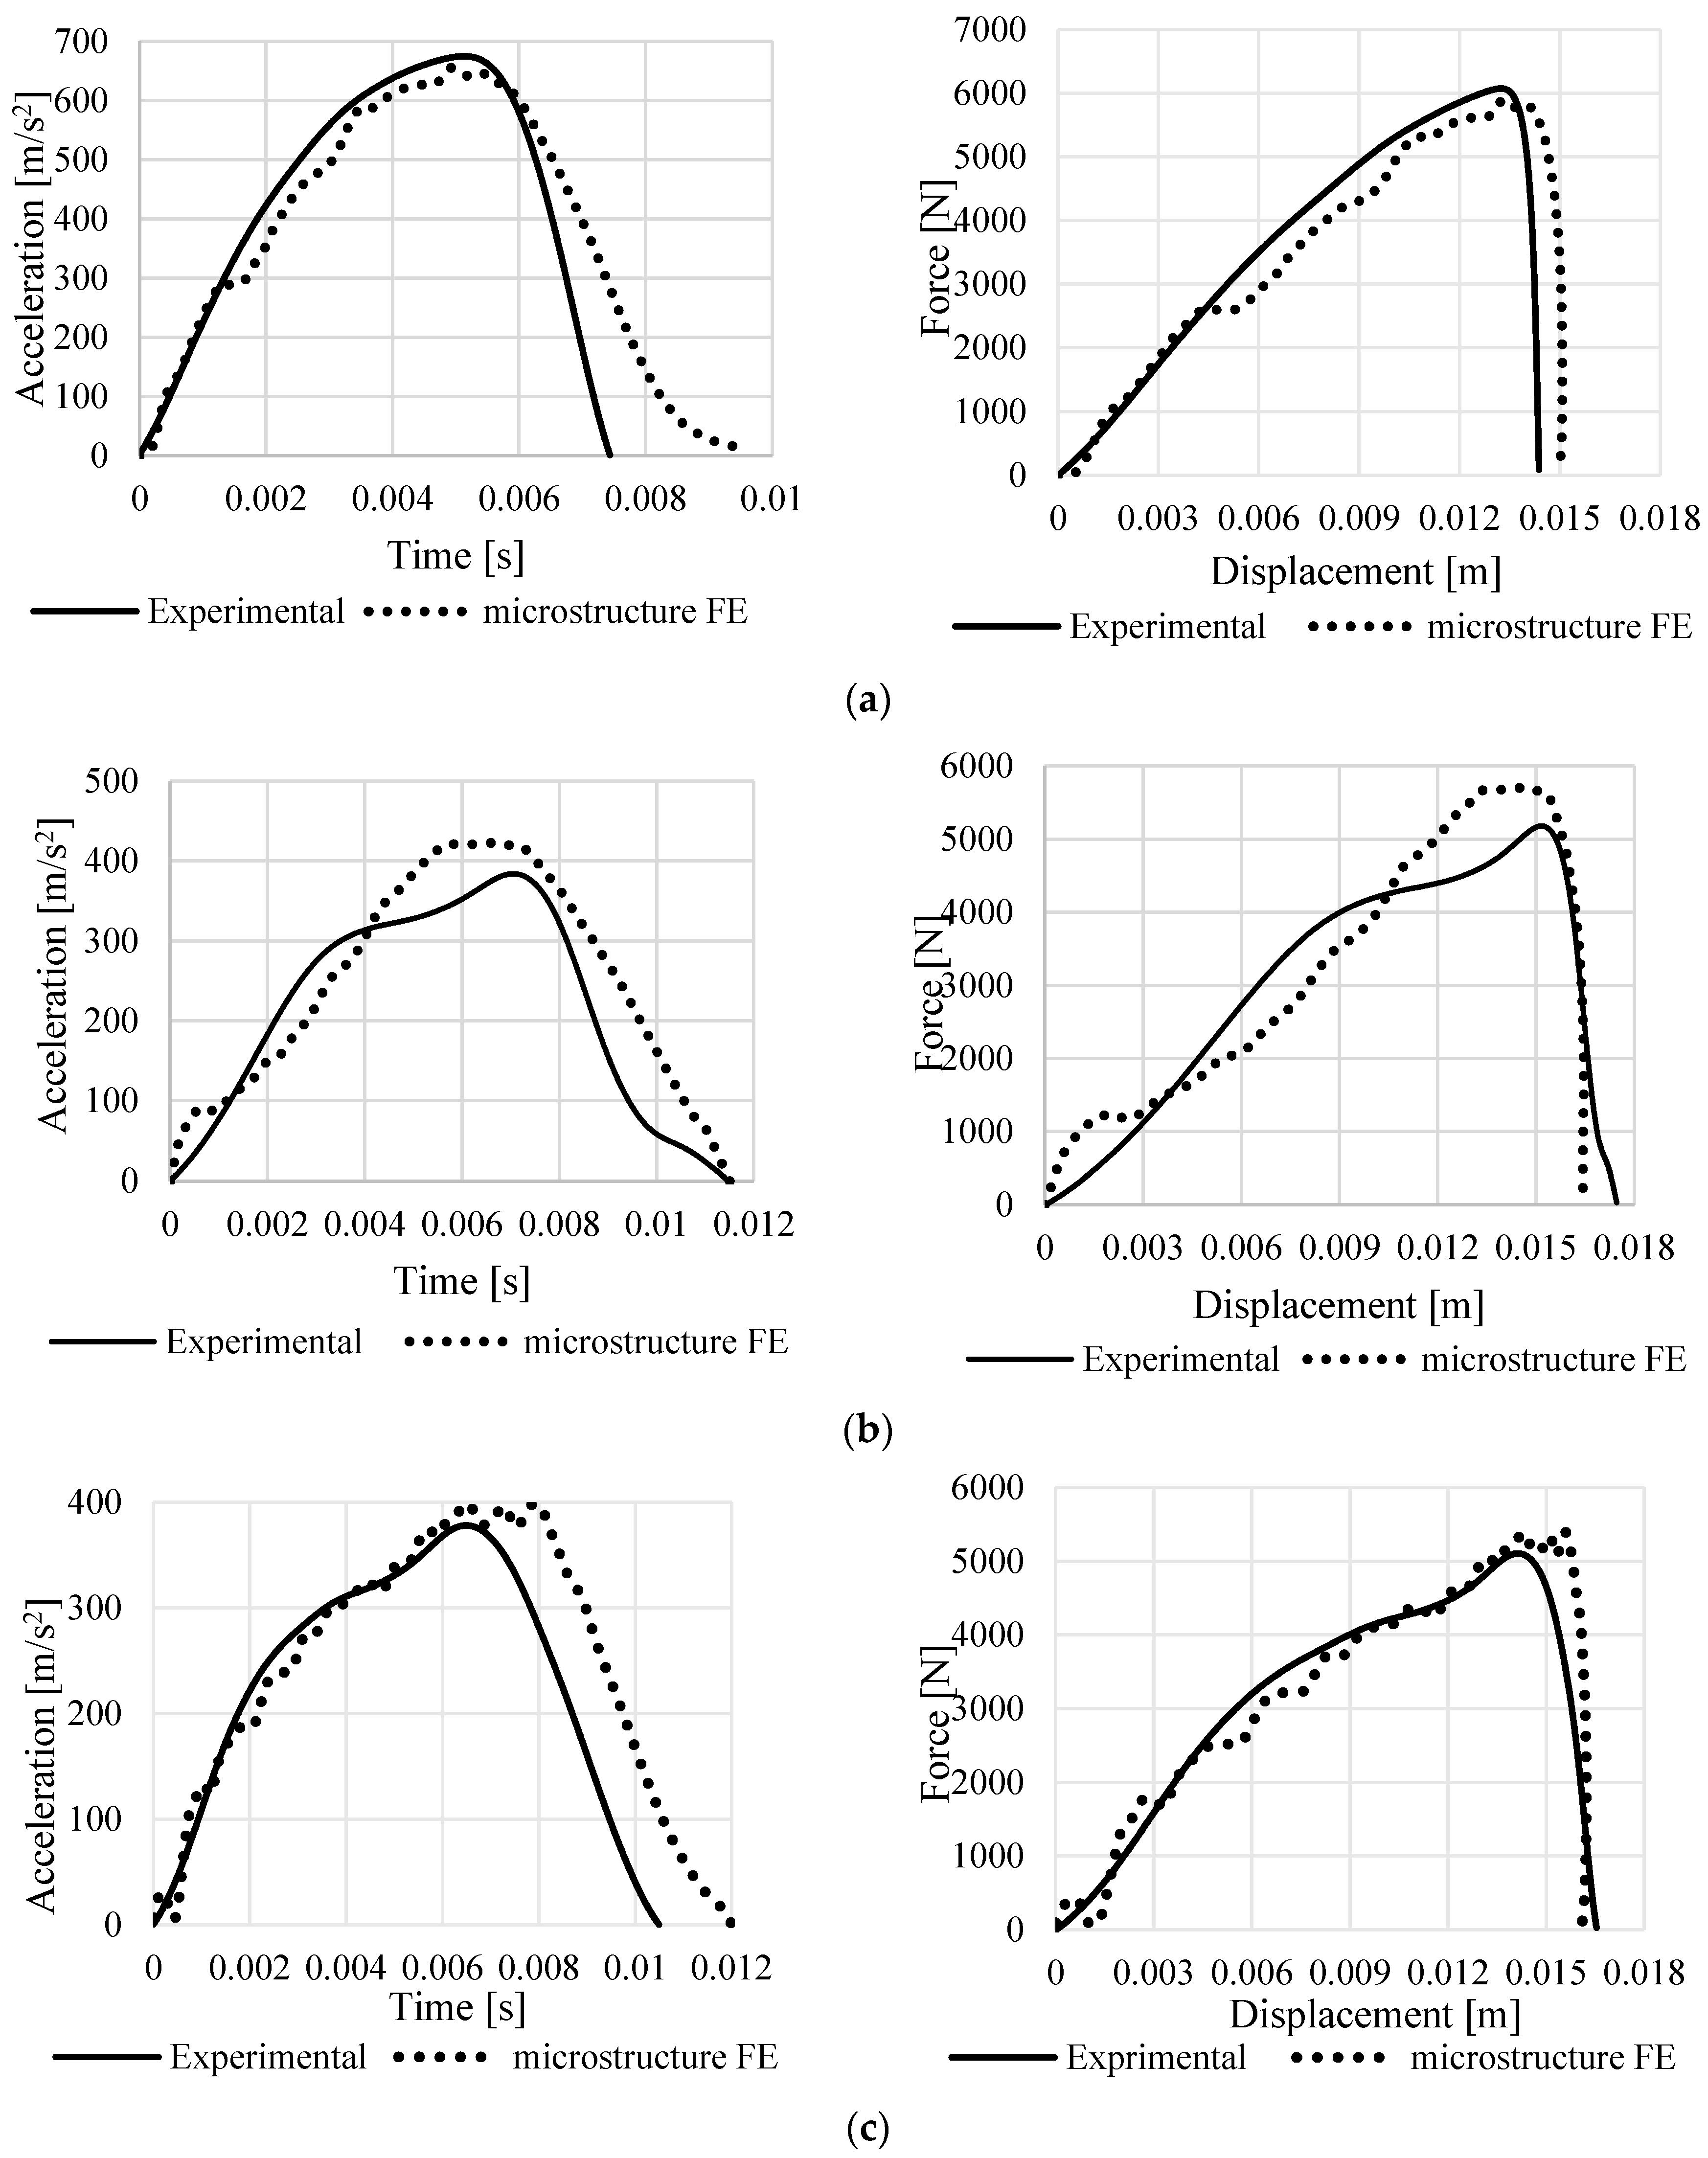
4.1. Validation of the Micro-Scale FE Models

If a micro-scale FE model works well, knowing the mechanical properties of the bulk material the foam specimen is made of is sufficient for predicting the mechanical behavior of foam structure which is a good accomplishment. Therefore, one of the first steps in this study was to evaluate the validity of the results of micro-scale models created for foams. Specimens N15, N18, and N20 were chosen for that purpose. Figure 9 shows that the experimental and numerical results are in good agreement with each other for both the acceleration-time and force-displacement diagrams of the noted specimens. The area below force-displacement diagrams of the noted specimens were measured and the consistency of the numerical and experimental results was also observed (the absorbed energy for all the three noted specimens was 51.8–52.85 J). The effective strain evolution in the micro-scale FE model of specimen N15 during impact is shown in Figure 10. The simulation results showed that the damage is extended to the whole specimen and one or two failure bands were formed (however, in higher strain rates, the cells start to collapse right below the drop weight [18,35,36]).

4.2. Comparison of the Results of Micro- and Macro-Scale Models

The results of the experimental test, the micro-structural FE model, and the two macro-structural FE models (constructed in ANSYS/LS-DYNA and ABAQUS) of specimen N15 were compared to each other to evaluate the results of the macro- and micro-structural models (Figure 11). The acceleration-time diagrams show that the micro-structural model correlates well with the experimental tests (Figure 11 left). The good agreement of the micro-structural model and the experimental results is better demonstrated in a force-displacement diagram (Figure 11 right).
In macro-structural models, in order to assign mechanical properties to the foam specimen, carrying out experimental tests is important (while as already mentioned, it is not necessary to carry our such tests in the micro-structural models and knowing the mechanical properties of the bulk material is sufficient). These static tests will damage the foam specimen and make it useless for subsequent impact tests. In the macro-structural models, the mechanical properties were accurately measured from the experimental static test results and assigned to the material of the foam specimen. However, the acceleration-time and force-displacement diagrams predicted by them have large discrepancies with the experimental tests (Figure 11). The input parameters of the macro-structural FE models were the results of the static mechanical tests on the foam specimens (such as elastic modulus, yield stress, plateau stress, densification strain, etc.). Therefore, the macro-structural models were not able to accurately consider the dynamic aspects of the problem (in contrast with the micro-structural models in which the parameters C = 5 and p = 4 were used for the Cowper-Symonds material model). Due to two reasons, the results of the impact tests on the foam specimens were not introduced to the macro-structural FE models. First, if the results of the impact tests on the foam models are introduced to the macro-structural FE models, the final required results are already given to the models as an input. In other words, the FE models simply return the input material properties that have already been given to them. Second, the aim of the study is to show that it is possible to predict the impact response of foam specimens by not testing them (the impact tests are always destructive) and just by having their CT-scanned images (CT scanning is not destructive to the foams).
The other reason behind this numerical/experimental difference while using macro-scale models can be the fact that foam specimens include several small or large pores. Since in macro-scale models, the foam specimen is modeled as a completely filled cubic structure, the FE model is incapable to accurately predict the mechanical behavior of specimens with large pores. The stress wave magnitude and direction can be changed greatly when it reaches each of these large pores. While the micro-structural model is capable of considering the interaction of stress waves with cell walls, the macro-structural models are not. The effect of pores in severely irregular foam specimens can become of greater importance compared to the foam specimens with regular micro-structure.
One question that can arise is that if in the microstructural model, the mechanical properties of the solid material (which does not present any crushable behavior) is used, then where does the crushable behavior of the foam structure as a whole come from? Closed-cell foams are structures composed of pores and solid walls. Even though the response of the foam in macro-scale is “crushable”, each small segment (i.e., walls) of its solid parts still behaves according to the response of the bulk material. This “crushing” behavior in the foam structure is observed due to the presence of the pores. After the foam yields, the pores inside the porous structure provide free space for the solid walls to deform without considerable resistance. That is why the stress-strain and stress-time curves of the foams demonstrate high degrees of crushability. The solid segments continue deforming without considerable resistance until the solid walls surrounding each pore come into contact with each other. That is the point where densification occurs and the foam behaves like a solid. In our designed experiments, all the initial energy is absorbed before the foam specimens reach the densification region.
While in the macro-structural model, this “crushing” behavior is defined for the foam structure (as a whole) artificially by providing it with the (crushable) stress-strain curve of the foam, this “crushing” behavior is observed in the micro-structural model, due to the same mechanism observed in the microstructure of the foams during experimental tests. After the first points in the solid parts of the foam structure yield, the solid walls do not experience much resistance against deformation. Therefore, even though we use the mechanical properties of the bulk material in the micro-structural model, the micro-structural foam structure demonstrates the crushable response of the foam with high accuracy.

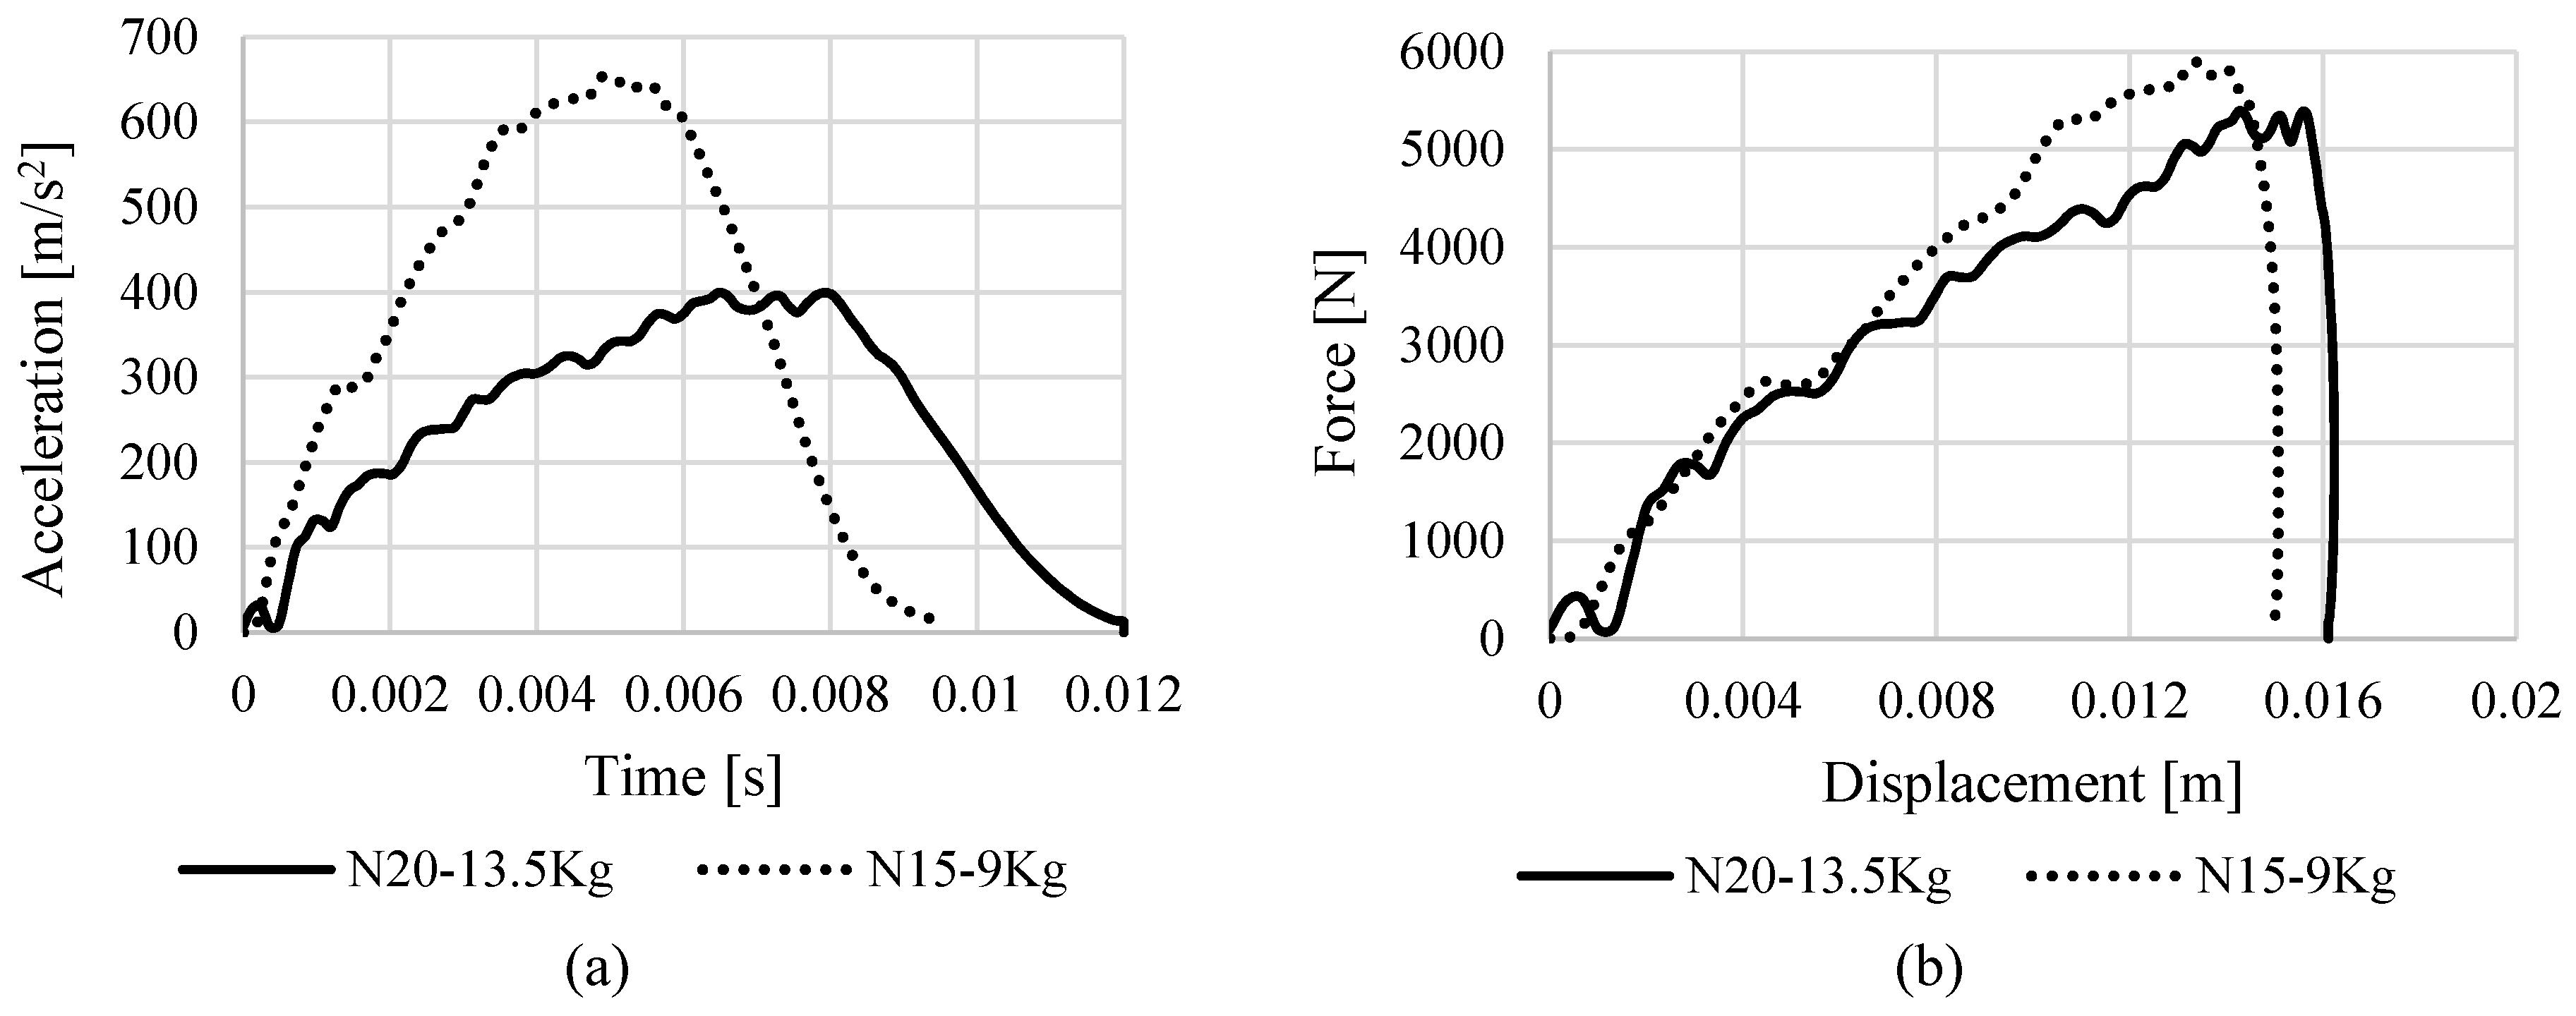
4.3. Effect of Drop Weight Initial Height and Mass

It is expected that in constant initial energy of the drop weight, by decreasing the mass of the drop weight (or equivalently increasing its initial height), the velocity of the drop weight at its first contact with the foam specimen increases which leads to rise in the magnitude of negative acceleration of the drop weight (and decrease in the impact duration as well). This prediction was verified by experimental tests on two similar specimens (N16 and N18) with the same initial energy of drop weight (52.97 J) and with different drop weight masses of 9 kg and 13.5 kg (Figure 12 left). The force-displacement diagram (Figure 12 right) also shows that by decreasing the mass of drop weight in constant energy, the maximum force applied to the specimen increases while the maximum strain of the specimen decreases. The micro-structural FE modeling also demonstrated a similar trend (Figure 13). The macro-scale models (with material model of crushable foam) made by both the LS-DYNA and ABAQUS FE packages were, however, incapable of predicting different force-displacement diagrams for different masses of drop weight in constant initial energy (Figure 14).

5. Conclusions

One of the main goals of the current study was to evaluate the advantages and disadvantages of constructing a micro-structural FE model instead of a macro-structural one. To create the micro-structural model with all the small and large pores, CT-scan images of foam specimens were used. To model the foam specimen in the macro-scale method, mechanical properties of the foam specimens obtained from experimental tests were used. The results of the two noted numerical model were compared to the results of experimental tests to evaluate their strengths and weaknesses in predicting the mechanical response.
The acceleration-time and force-displacement diagrams of the micro-structural models were in good agreement with corresponding experimental results. Although the acceleration-time and force-displacement diagrams of the macro-structural models were able to predict the trend of the experimental curves, they showed a large discrepancy compared to the experimental curves. This can be explained by the fact that the micro-structural model is capable of considering the interaction of stress waves with cell walls of large pores, while the macro-structural models are not.
One of the other advantages of micro-structural modeling of the foam specimens is that in order to have mechanical properties of the foam specimen (such as elastic modulus, yield stress, plateau stress, and densification strain), it is not necessary to carry out compressive static experimental tests until high strain levels which damage them. Despite their high demand for computational resources, micro-scale FE models are very beneficial to understand the failure mechanisms acting in the micro-structure of a foam in order to modify or diminish them.

Acknowledgments

We would like to thank High-performance computer research center of Amirkabir University of Technology (Tehran Polytechnic) for providing us with high-performance computers for carrying out the simulations of this study.

Author Contributions

Mojtaba Sadighi and Mohammad Mohammadi-Aghdam conceived and designed the experiments; Mehrdad Koloushani and Reza Hedayati performed the experiments; Mehrdad Koloushani analyzed the data; Mojtaba Sadighi and Mohammad Mohammadi-Aghdam contributed reagents/materials/analysis tools; Mehrdad Koloushani and Reza Hedayati wrote the paper.

Conflicts of Interest

The authors declare no conflict of interest.

References

  1. Gibson, L.J.; Ashby, M.F. Cellular Solids: Structure and Properties; Cambridge University Press: Hongkong, China, 1997. [Google Scholar]
  2. Hedayati, R.; Sadighi, M.; Mohammadi-Aghdam, M.; Zadpoor, A.A. Mechanical properties of regular porous biomaterials made from truncated cube repeating unit cells: Analytical solutions and computational models. Mater. Sci. Eng. C 2016, 60, 163–183. [Google Scholar] [CrossRef] [PubMed]
  3. Warren, W.; Kraynik, A. Linear elastic behavior of a low-density kelvin foam with open cells. J. Appl. Mech. 1997, 64, 787–794. [Google Scholar] [CrossRef]
  4. Hedayati, R.; Sadighi, M.; Mohammadi Aghdam, M.; Zadpoor, A.A. Mechanical properties of additively manufactured thick honeycombs. Materials 2016, 9, 613. [Google Scholar] [CrossRef] [PubMed]
  5. Weaire, D.; Phelan, R. Cellular structures in three dimensions. Philos. Trans. R. Soc. Lond. A: Math. Phys. Eng. Sci. 1996, 354, 1989–1997. [Google Scholar] [CrossRef]
  6. Veyhl, C.; Belova, I.; Murch, G.; Fiedler, T. Finite element analysis of the mechanical properties of cellular aluminium based on micro-computed tomography. Mater. Sci. Eng. A 2011, 528, 4550–4555. [Google Scholar] [CrossRef]
  7. Miedzińska, D.; Niezgoda, T.; Gieleta, R. Numerical and experimental aluminum foam microstructure testing with the use of computed tomography. Comput. Mater. Sci. 2012, 64, 90–95. [Google Scholar] [CrossRef]
  8. Bock, J.; Jacobi, A.M. Geometric classification of open-cell metal foams using X-ray micro-computed tomography. Mater. Charact. 2013, 75, 35–43. [Google Scholar] [CrossRef]
  9. Hedayati, R.; Sadighi, M.; Mohammadi-Aghdam, M.; Zadpoor, A. Mechanical behavior of additively manufactured porous biomaterials made from truncated cuboctahedron unit cells. Int. J. Mech. Sci. 2016, 106, 19–38. [Google Scholar] [CrossRef]
  10. Hedayati, R.; Sadighi, M.; Mohammadi-Aghdam, M.; Zadpoor, A.A. Mechanics of additively manufactured porous biomaterials based on the rhombicuboctahedron unit cell. J. Mech. Behav. Biomed. Mater. 2016, 53, 272–294. [Google Scholar] [CrossRef] [PubMed]
  11. Stress Shielding. Available online: https://en.wikipedia.org/wiki/Stress_shielding (accessed on 10 January 2018).
  12. Banhart, J. Manufacture, characterisation and application of cellular metals and metal foams. Prog. Mater. Sci. 2001, 46, 559–632. [Google Scholar] [CrossRef]
  13. Ashby, M.F.; Evans, T.; Fleck, N.A.; Hutchinson, J.; Wadley, H.; Gibson, L. Metal Foams: A Design Guide; Elsevier: Amsterdam, The Netherlands, 2000. [Google Scholar]
  14. Rajendran, R.; Moorthi, A.; Basu, S. Numerical simulation of drop weight impact behaviour of closed cell aluminium foam. Mater. Des. 2009, 30, 2823–2830. [Google Scholar] [CrossRef]
  15. Li, B.; Zhao, G.; Lu, T. Low strain rate compressive behavior of high porosity closed-cell aluminum foams. Sci. China Tech. Sci. 2012, 55, 451–463. [Google Scholar] [CrossRef]
  16. Zhang, C.; Tang, L.; Yang, B.; Zhang, L.; Huang, X.; Fang, D. Meso-mechanical study of collapse and fracture behaviors of closed-cell metallic foams. Comput. Mater. Sci. 2013, 79, 45–51. [Google Scholar] [CrossRef]
  17. Liu, Y.; Gong, W.; Zhang, X. Numerical investigation of influences of porous density and strain-rate effect on dynamical responses of aluminum foam. Comput. Mater. Sci. 2014, 91, 223–230. [Google Scholar] [CrossRef]
  18. Fang, Q.; Zhang, J.; Zhang, Y.; Liu, J.; Gong, Z. Mesoscopic investigation of closed-cell aluminum foams on energy absorption capability under impact. Compos. Struct. 2015, 124, 409–420. [Google Scholar] [CrossRef]
  19. Wang, P.; Xu, S.; Li, Z.; Yang, J.; Zhang, C.; Zheng, H.; Hu, S. Experimental investigation on the strain-rate effect and inertia effect of closed-cell aluminum foam subjected to dynamic loading. Mater. Sci. Eng. A 2015, 620, 253–261. [Google Scholar] [CrossRef]
  20. Andrews, E.; Gioux, G.; Onck, P.; Gibson, L. Size effects in ductile cellular solids. Part II: Experimental results. Int. J. Mech. Sci. 2001, 43, 701–713. [Google Scholar] [CrossRef]
  21. Mohammadi Nasrabadi, A.; Hedayati, R.; Sadighi, M. Numerical and experimental study of the mechanical response of aluminum foams under compressive loading using ct data. J. Theor. Appl. Mech. 2016, 54, 1357–1368. [Google Scholar] [CrossRef]
  22. Li, Z.; Xi, C.; Jing, L.; Wang, Z.; Zhao, L. Effect of loading rate on the compressive properties of open-cell metal foams. Mater. Sci. Eng. A 2014, 592, 221–229. [Google Scholar] [CrossRef]
  23. ANSYS Mechanical APDL Basic Analysis Guide. Available online: http://allaboutmetallurgy.com/wp/wp-content/uploads/2016/12/ANSYS-Mechanical-APDL-Basic-Analysis-Guide.pdf (accessed on 10 January 2018).
  24. Tanwongwan, W.; Carmai, J. Finite element modelling of titanium foam behaviour for dental application. In Proceedings of the World Congress on Engineering 2011, London, UK, 6–8 July 2011. [Google Scholar]
  25. ABAQUS Theory Manual Version 6.11-1 (R20). Available online: http://130.149.89.49:2080/v6.11/pdf_books/THEORY.pdf (accessed on 10 January 2018).
  26. Irausquín, I.; Teixeira-Dias, F.; Miranda, V.; Pérez-Castellanos, J.L. Numerical modeling of the compression a closed-cell aluminum foam. In Iberian Conference on Fracture and Structural Integrity; Emerald Group Publishing Limited: Porto, Portugal, 2010. [Google Scholar]
  27. Khalkhali, A.; Mousavi, S. Multi-objective crashworthiness optimization of the aluminum foam-filled tubes. Int. J. Automot. Eng. 2012, 2, 193–206. [Google Scholar]
  28. Rizov, V.I. Elastic–plastic response of structural foams subjected to localized static loads. Mater. Des. 2006, 27, 947–954. [Google Scholar] [CrossRef]
  29. McKown, S.; Mines, R. Impact behaviour of metal foam cored sandwich beams. In Fracture of Nano and Engineering Materials and Structures; Springer: Berlin, Germany, 2006. [Google Scholar]
  30. Cho, J.U.; Hong, S.J.; Lee, S.K.; Cho, C. Impact fracture behavior at the material of aluminum foam. Mater. Sci. Eng. A 2012, 539, 250–258. [Google Scholar] [CrossRef]
  31. Wang, J.; Waas, A.M.; Wang, H. Experimental and numerical study on the low-velocity impact behavior of foam-core sandwich panels. Compos. Struct. 2013, 96, 298–311. [Google Scholar] [CrossRef]
  32. Rajaneesh, A.; Sridhar, I.; Rajendran, S. Numerical modeling of low velocity impact response on metal foam cored sandwich panels. In Proceeding of the 18 th International Conference on Composite Materials, Jeju Island, Korea, 21–26 August 2011. [Google Scholar]
  33. Flores-Johnson, E.; Li, Q.; Mines, R. Degradation of elastic modulus of progressively crushable foams in uniaxial compression. J. Cell. Plast. 2008, 44, 415–434. [Google Scholar] [CrossRef]
  34. Motz, C.; Pippan, R. Deformation behaviour of closed-cell aluminium foams in tension. Acta Mater. 2001, 49, 2463–2470. [Google Scholar] [CrossRef]
  35. Li, Z.; Zhang, J.; Fan, J.; Wang, Z.; Zhao, L. On crushing response of the three-dimensional closed-cell foam based on voronoi model. Mech. Mater. 2014, 68, 85–94. [Google Scholar] [CrossRef]
  36. Zou, Z.; Reid, S.; Tan, P.; Li, S.; Harrigan, J. Dynamic crushing of honeycombs and features of shock fronts. Int. J. Impact Eng. 2009, 36, 165–176. [Google Scholar] [CrossRef]
Figure 1. (a) The foam plate before being cut, (b) the coordinate system used in this paper.
Jimaging 04 00049 g001
Figure 2. Two specimens extracted from foam plate.
Jimaging 04 00049 g002
Figure 3. The time sequence of crushing of Specimen N2.
Jimaging 04 00049 g003aJimaging 04 00049 g003b
Figure 4. (a) The drop weight apparatus (b) the drop weight crushing the foam specimen.
Jimaging 04 00049 g004
Figure 5. The cross-section of a specimen: (a) CT-scan image (b) the constructed FE model in ANSYS.
Jimaging 04 00049 g005
Figure 6. The micro-structural FE model of foam.
Jimaging 04 00049 g006
Figure 7. The FE model of drop weight, bottom support plate, and the foam specimen.
Jimaging 04 00049 g007
Figure 8. Comparison of stress-strain curves obtained for impacts from axial (Z) and lateral (Y) directions.
Jimaging 04 00049 g008
Figure 9. Acceleration-time and force-displacement curves obtained from experimental tests and microstructural FE models in specimens (a) N15, (b) N18, and (c) N20.
Jimaging 04 00049 g009
Figure 10. Effective strain distribution of micro-structural FE model of N15 during impact.
Jimaging 04 00049 g010
Figure 11. (a) Acceleration-time and (b) force-displacement diagrams obtained from experimental tests, microstructural FE model, and macrostructural FE model of specimen N15.
Jimaging 04 00049 g011
Figure 12. (a) Acceleration-time and (b) force-displacement diagrams obtained from two experimental tests with equal initial energy but with different drop weight masses.
Jimaging 04 00049 g012
Figure 13. (a) Acceleration-time and (b) force-displacement diagrams obtained from two micro-structural FE models (N15 and N20) with equal initial energy but with different drop weight masses.
Jimaging 04 00049 g013
Figure 14. (a) Acceleration-time and (b) force-displacement diagrams of macro-structural FE analysis of two impacts with equal drop weight initial energy but with different masses.
Jimaging 04 00049 g014
Table 1. A356 alloy mechanical properties.
PropertyValue
Density (kg/m3)2685
Elastic modulus (GPa)71
Yield stress (MPa)165
Tangent modulus (GPa)0.487
Poisson’s ratio0.33
Elongation2–3.5%
Table 2. Geometrical specifications of the specimens and their loading conditions.
Specimen #Mass (g)Dimension in x Direction (mm)Dimension in y Direction (mm)Dimension in z Direction (mm)Density ( k g / m 3 ) Static TestImpact Test
ElasticElastic-PlasticDrop Weight Mass (kg)Drop Weight Initial Height (cm)
N125.0931.5732.3340.18612 *
N225.9232.531.939.65630 *
N328.732.4432.1440.37682 *
N425.7431.3831.7839.7650 *
N525.4931.7832.2239.9624 *
N623.7930.4732.3539.5610 *
N724.932.7531.839.84600 *
N832.9632.7631.5839.97797*
N927.531.5732.3640.18670*
N1027.731.9832.5539.78669*
N1127.731.932.6540665*
N1227.533232.6939.64664*
N1327.531.6432.1340676 13.560
N1425.732.330.7540.2644 13.560
N1527.632.5332.5539.8655 960
N1627.4532.6632.3439.8653 960
N1732.330.9532.4140.3800 13.540
N1826.932.6132.4639.66641 13.540
N1930.7232.9632.4540.32714 13.540
N2027.732.132.5339.83666 13.540
Table 3. Elastic modulus for different specimens.
Specimen #Density (kg/m3)Relative Density (%)Measured Elastic Modulus (GPa)
N9670250.118
N1066924.80.153
N1166524.880.154
N1266424.70.152

