Deep Learning with a Spatiotemporal Descriptor of Appearance and Motion Estimation for Video Anomaly Detection


1
Department of E&TC, Sinhgad College of Engineering, Vadgaon, S.P.P.U., Pune 411 041, India
2
Department of E&TC, Cummins College of Engineering for Women, Karve Nagar, S.P.P.U., Pune 411 052, India
*
Author to whom correspondence should be addressed.
J. Imaging 2018, 4(6), 79; https://doi.org/10.3390/jimaging4060079
Submission received: 26 March 2018
/
Revised: 23 May 2018
/
Accepted: 5 June 2018
/
Published: 8 June 2018
(This article belongs to the Special Issue Detection of Moving Objects)
Abstract
:The automatic detection and recognition of anomalous events in crowded and complex scenes on video are the research objectives of this paper. The main challenge in this system is to create models for detecting such events due to their changeability and the territory of the context of the scenes. Due to these challenges, this paper proposed a novel HOME FAST (Histogram of Orientation, Magnitude, and Entropy with Fast Accelerated Segment Test) spatiotemporal feature extraction approach based on optical flow information to capture anomalies. This descriptor performs the video analysis within the smart surveillance domain and detects anomalies. In deep learning, the training step learns all the normal patterns from the high-level and low-level information. The events are described in testing and, if they differ from the normal pattern, are considered as anomalous. The overall proposed system robustly identifies both local and global abnormal events from complex scenes and solves the problem of detection under various transformations with respect to the state-of-the-art approaches. The performance assessment of the simulation outcome validated that the projected model could handle different anomalous events in a crowded scene and automatically recognize anomalous events with success.
1. Introduction
Anomaly detection implies the identification of events in the data that do not conform to the expected normal behavior [1]. There are numerous applications for anomaly detection such as fraud detection, intrusion detection for cyber security, etc. In recent years, video-based anomaly detection has become a major research topic due to its valuable applications in day-to-day social activities [2,3].
Generally, a deviation from a normal scenario is termed as an anomaly [4,5]. In the last few decades, researchers have identified the activities of jumping, running, and waving as anomalies from high-resolution videos [6,7,8]. If such approaches are applied in low-resolution videos, the details are not correctly visible and achieve a noisy trajectory [9,10]. Therefore, anomaly detection in a low-resolution video is a challenging task. Continuously monitoring and identifying abnormal activities on a surveillance video is tedious work for humans; it is especially difficult in crowded scenes [11,12]. Automatic anomaly detection is a new technology which overcomes the existing drawbacks [13,14].
Localizing the anomaly event automatically in a dynamic area and in crowded scenes is the most complex task. Due to the spatial and temporal dimensions, both the appearance and movement data can be encoded. In spatial representation, proximity is important, so anomaly localization is critical. The existing techniques [15,16,17,18,19] can identify only a few pixels due to the changing density of objects in crowded scenes, low resolution, and inter-object occlusions during surveillance video monitoring, making the work more complex and challenging [20]. There are different existing approaches applied to address these difficulties such as sparse representation, optical flow information, spatiotemporal context representation, trajectory modeling, etc.
This paper presents a novel spatiotemporal HOME-FAST (Histogram of Orientation, Magnitude, and Entropy with Fast Accelerated Segment Test) descriptor to detect abnormal activity from the video surveillance database based on video motion and appearance. The proposed work comprises pre-processing, feature extraction, and classification for detecting the anomaly event. In the pre-processing step, first, the training and testing frames are separately divided into non-overlapping blocks. Each block is filtered using a Gaussian smoothing filter to remove the noise present in the dataset. The proposed work mainly focuses on feature extraction to locate abnormal behaviors such as fighting, accidents, robberies, etc. Before the feature extraction, foreground estimation is performed on the image, as extracting features from the whole image is computationally expensive. Then, the magnitude, orientation, velocity, and interest points for the cuboids are extracted using the HOME-FAST feature descriptor. The extracted high-level (motion and appearance) features and the low-level input frames are fed as input to the Deep Neural Network (DNN), which uses pre-training and fine tuning to categorize the input features. Finally, a performance analysis is given for the state-of-the-art methods to show the contribution of the proposed approach. As compared to the state-of-the-art approaches, the research methodology achieves a better performance in terms of accuracy, Equal Error Rate (EER), and processing time in dense crowds and complex scenes.
The remainder of the paper is structured as follows. In Section 2, recent works related to video anomaly detection are discussed. In Section 3, the proposed work with the novel feature extraction technique to detect the anomalous behavior is presented. Next, the after-effect of the proposed strategy and its suggestions are examined in Section 4. The overall conclusions for the novel anomaly detection framework are given in Section 5.
2. State-of-the-Art Anomaly Detection Methods
This segment examines a portion of the current related works for anomaly detection. Existing works have identified events based on feature extraction, clustering and trajectory analysis, supervised learning, unsupervised learning, and deep learning.
2.1. Feature Extraction
Features have been employed to detect anomalous activities in previous studies. Zhang et al. ignored the problem of traditional feature extraction techniques for automatic violence detection [21]. They proposed a novel element descriptor called the Motion Weber Local Descriptor (MoWLD) to detect the motion images. The WLD descriptor was extended by adding some additional appearance features with time-based components which catch nearby movement data, low-level appearance information, and local motion information. Moreover, a non-parametric Kernel Density Estimation (KDE) was also used to remove the irrelevant and redundant information. Sparse coding and max-pooling were used to attain discriminative features. This method achieved a detection result with an Area under the Curve (AUC) of 94% on a crowd violence dataset.
Bertini et al. proposed an unsupervised approach based on spatiotemporal features to recognize contextual anomalies [22]. A multiscale ongoing non-parametric approach for oddity recognition was proposed by the author. They developed a method to update the scene statistics to solve the problem of high variability in unusual events. The main drawback of their approach was that they failed to extract the high-level information from local regions. An average 32% EER was achieved by the multiscale method on University of California San Diego (UCSD) Pedestrian (Peds) datasets. The spatial complexity of the input sequences made the feature extraction algorithm very complex to model anomalies in an unconstrained environment.
2.2. Trajectory Analysis and Clustering
The dynamic information can be described in trajectory analysis for abnormal event detection. This approach mainly evaluates the similarity between the trajectories.
Kumar et al. mainly focused on the direction investigation to detect the anomaly with a novel hierarchical clustering algorithm called the Visual Assessment of Tendency (VAT) [23]. Extension of the VAT also proposed a novel two-stage trajectory analysis named iVAT+ and clusiVAT+ for direction anomaly recognition. A thresholding approach was used to divide the VAT-generated minimum spanning tree. According to the generated path in a cluster, usual or abnormal patterns are classified based on trajectories. The trajectories approach is classified as a two-stage clusiVAT clustering method. In the first stage of clustering, the direction is not considered, but the second stage of clustering uses the trajectory direction and divides the clusters. Due to the presence of occluded objects, the tracking methods performance may become degraded in complex and crowded scenes.
2.3. Supervised Learning
Supervised learning methods mainly focus on the discriminating concept classes. Leyva et al. [24] presented an online structure for video irregularity identification. In their approach, the size of the feature set was limited as they only processed the limited support regions according to the scene changes. First, the foreground information and optical flow features were extracted. Then, the abnormal event detection with an interference mechanism including Markov chains, a bag of words, and the Gaussian mixture model were used to extract the compact feature.
Zhang et al. [25] introduced a novel technique that coordinated the movement and appearance factors to identify irregular objects and practices in the video. The statistical histogram was used for modeling the ordinary movement of dispersions and proposed the idea of “cut-bin” in histograms to recognize uncommon movements for motion anomaly identification. Then, they developed a novel arrangement called the Support Vector Data Description (SVDD) for appearance anomaly detection. A spherical boundary was formed around the normal objects to identify the abnormal events. These two reciprocal motion and appearance factors were finally joined to accomplish more complete recognition results. The supervised approaches ignore the unlabeled data during the training phase.
2.4. Unsupervised Learning
Unsupervised learning approaches have also received increasing approval to perform anomaly detection tasks with unknown distributions. Bao et al. also proposed an unsupervised approach for detecting and localizing abnormal events to extract the high-level information from local regions and model the relationship in the spatial domain [26]. A revised form of Principal Component Analysis Network (PCANet) was used to extract higher-level features from video frames. The EER of the frame level was up to 10% and a pixel-level EER of 18% was found for the UCSD Peds2 dataset.
Xu et al. proposed an unsupervised hierarchical activity-pattern discovery framework for both the global and spatiotemporal contexts in a scene [27]. The input motion pattern in the abnormal event was identified using a unified anomaly energy function. The AUC for anomaly detection on the UCSD dataset was 86.8%. The unsupervised learning required labeled data to guide the model generation as the detection performance was degraded due to the false matches.
2.5. Deep Learning
Deep learning succeeded in anomaly detection by overcoming the limitations in the state-of-the-art techniques. Feng et al. proposed automatic event detection based on an unsupervised deep Gaussian Mixture Model (GMM) [28]. First, the PCANet extracts the motion and appearance features from three-dimensional (3D) gradients. Then, the pattern model generated using deep GMM has many layers with normal events. The probability in the testing stages is ascertained to judge the abnormal event in a video. Ribeiro et al. proposed deep convolutional auto-encoders to learn features automatically during the training process [29]. The authors additionally proposed a strategy for aggregating high-level spatial and temporal features with the input frames to explore how they influence the convolutional auto-encoders (CAE) execution. They tried a new way to fuse low-level with high-level information using CAE with an AUC of 84.7% and an EER of 24.5% on the UCSD Peds2 dataset.
Xu et al. exhibited a novel unsupervised deep learning approach called Appearance and Motion DeepNet (AMDN) to learn the features automatically. Their work was a double fusion framework that combines the advantages of early combination and late combination [30]. Stacked denoising auto-encoders are used as an early fusion approach to learn both the appearance and motion patterns. Then, the anomaly score for each input is predicted using a multiple one-class Support Vector Machine (SVM) model as a late fusion strategy. The combination of appearance and movement pipelines was expressed at the outline level EER of 18% and AUC of 89.1% on the UCSD Peds1 dataset.
Carlos et al. [31] introduced a Magnitude-Orientation Stream (MOS) for activity detection. First, they used the concept of very deep two-stream to learn the magnitude and orientation data. Then, they incorporated that magnitude and orientation information as input to the neural network using the late fusion approach. Their algorithm mainly focused on activity detection. The feature extraction was not well suited for anomaly detection due to its simple features.
3. Deep Learning with HOME-FAST Spatiotemporal Descriptor for Abnormality Detection
The primary goal of the paper was to recognize patterns and classify anomalous events in crowded videos. One of the challenging issues in creating a model for detecting abnormal events is the volatility and dependency on the information of the scene. So, a spatiotemporal feature descriptor was proposed to recognize such patterns.
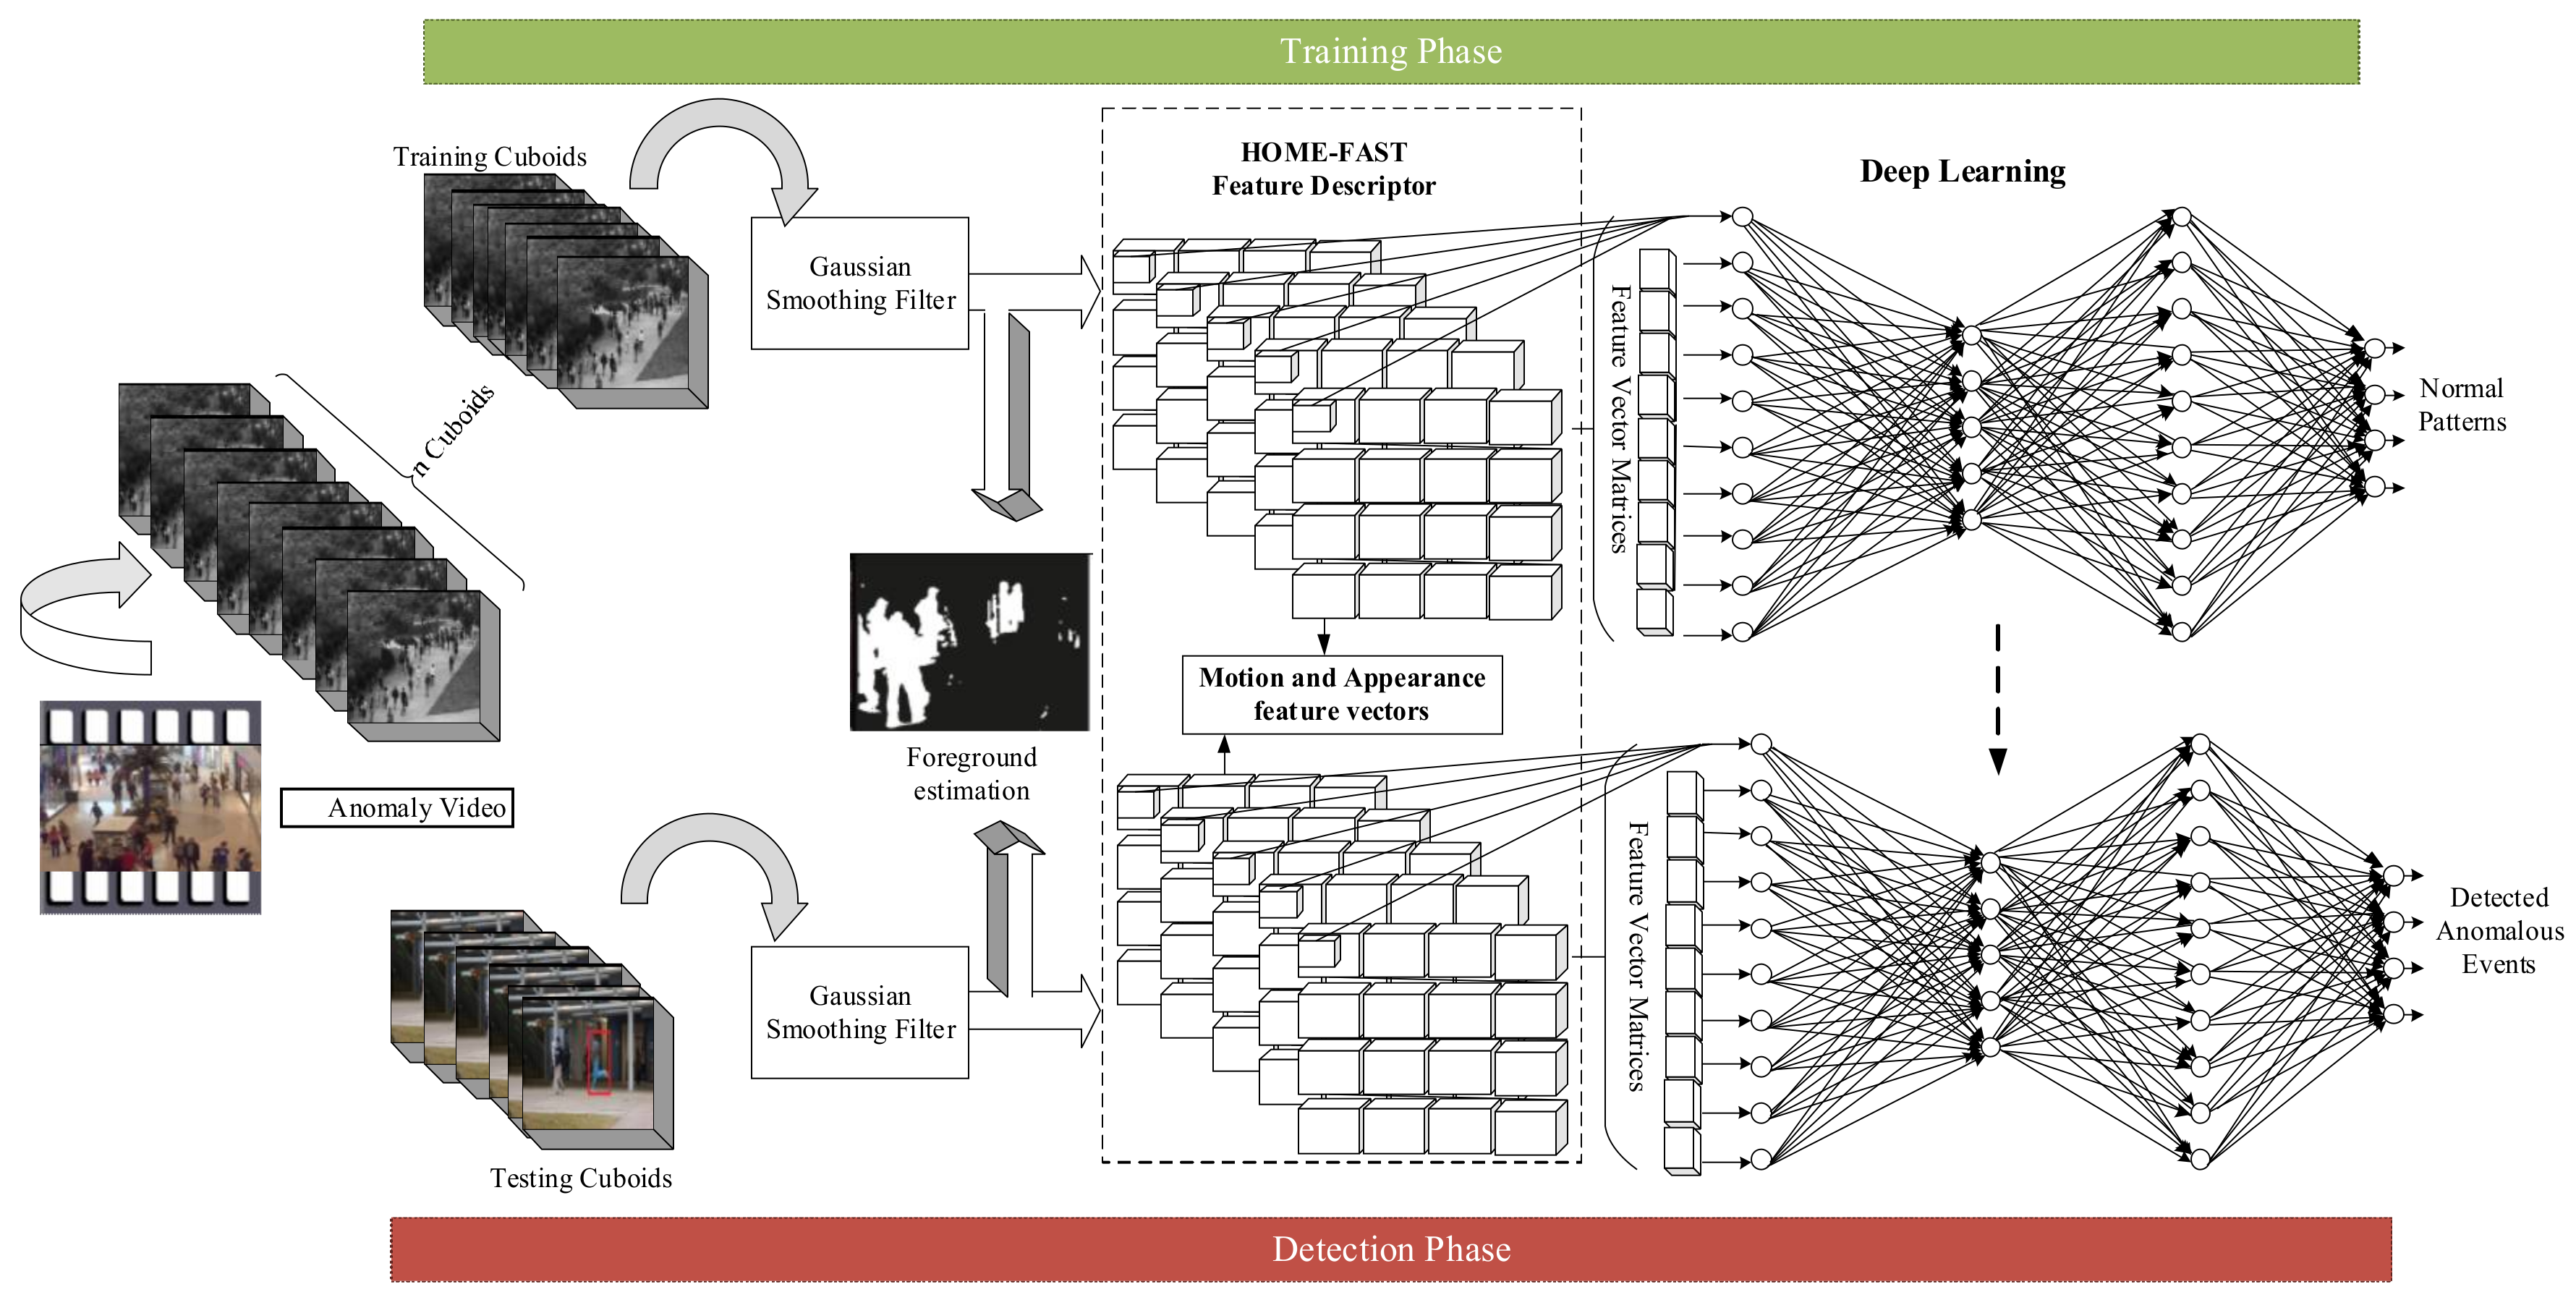
First, the input video is separated into a set of training and testing cuboids as non-overlapping n × m × t blocks, as shown in Figure 1. The proposed architecture is partitioned into the preparing and testing stage. In both phases, first, the frames are admitted to Gaussian filtering. After performing Gaussian smoothing, the foreground parts are extracted from a video. Then, the proposed HOME-FAST feature extractor extracts the motion and appearance features to identify the anomaly. This feature descriptor extracts the high-level features and uses them as input to the DNN along with the low-level information (input frames) to classify normal and abnormal events in the video. In the training phase, the feature descriptor at the spatial location is kept as a normal pattern at a particular spatial region. In the testing phase, the deep learning approach searches for a similar pattern from a training pattern. The events are considered as abnormal if none of the similar patterns are present.
3.1. Input Database
The surveillance videos from UCSD, Avenue, and Live Videos (LV) datasets, as described in Section 4, were used for the evaluation of the proposed method. Events such as accidents, illegal activities, and hazardous circumstances are included in the dataset. The input video is represented by Equation (1):
where is the -th input video in the database; is the -th frame from the video; and represents the total number of videos in the database.
The procedural flow of the proposed work is divided into training and testing phases. The training phase learns the normal patterns and the events that differ from the trained patterns are considered as abnormal during the testing phase. The following steps were applied to both the training and testing phases.
3.2. Pre-Processing
Initially, the video is divided into spatiotemporal or non-covering n × m × t areas, alluded to as cuboids. This will decrease the computational time while finding the comparable vector feature for the matching process in an image.
Then, a Gaussian smoothing filter is applied to improve the depth map to minimize the noises, occlusion, illumination, and clutter. The isotropic Gaussian function for the -throw and -th column can be represented by Equation (2):
The standard deviation of the distribution is denoted as . The above two-dimensional (2D) distribution function can be used as a point spread function. Since the image is stored as an accumulation of discrete pixels, it has to be recreated as a discrete approximation to the Gaussian function before performing the convolution. The feature extraction on each pixel in the entire image is computationally expensive. Here, the frontal area estimation is performed by creating a binary mask. The image subtraction is performed on the cuboids by setting up a threshold to gather all of the moving pixels. First, the image subtraction is performed between frame and frame for each pixel on the cuboid by creating a binary mask. In this procedure, the difference process is considered by setting a threshold value with certain conditions (i.e., the pixel is discarded if the resultant difference is less than ; or else the corresponding pixel value is added to the matching cuboids). Thus, the moving pixels of each cuboid are extracted using the foreground estimation.
3.3. Spatiotemporal HOME-FAST Feature Extraction
In this paper, a novel spatiotemporal feature extraction technique was developed that deals with the data in both space and time. This information gives the location of objects moving over invariant geometry (known as moving objects). First, the Kanade-Lucas-Tomasi (KLT) feature tracker [32] was used to extract the optical flow information. Optical flow is the outline for the apparent movement of objects, surfaces, and edges in a visual scene caused by the relative motion between a viewer and a prospect.
The optical flow information was extracted for each pixel. This feature tracking algorithm uses the spatial intensity information to track the object position over multiple frames from spatiotemporal image brightness variations. Normally, the optical flow estimate takes such a long time that real-time object tracking is difficult to realize. To overcome such drawbacks, a parallelization method was used after the optical flow estimation for consuming time. A method of parallelization was used in which the estimated optical flow results are divided into several regions that can be executed in parallel, thus avoiding a long time delay during the execution of real-time object tracking.
3.3.1. HOME (Histogram of Orientation, Magnitude, and Entropy)
The proposed HOME feature extraction builds a magnitude, orientation, and entropy representation for each cuboid. First, the proposed HOME uses the orientation, magnitude, and entropy representation to create a feature model for each cuboid. Each cube, after extracting the Kanade-Lucas-Tomasi (KLT) information can be defined as , where the number of magnitude, orientation, and entropy ranges can be specified as , , and , then “+1” is specified as some of them exceeded the range of magnitude. Afterwards, the resultant optical flow information vectors form a 3D matrix with the orientation, magnitude, and entropy feature vectors.
Magnitude and orientation estimation: For each target scene, the magnitude of each bin from its motion vectors can be patched to corresponding bins. Given the sorted magnitude histogram Hp and the “cut-bin” number of a certain point , we measured the magnitude abnormality of a new observation in this pixel position based on the relationship between the bin it falls in and the cut-bin. The magnitude abnormality of the observation is computed as:
where is the sequence number of the bin in which the new observation falls, is the sequence number of the last bin for the sorted histogram, and represents the value of the -th bin.
The likelihood of the test data being anomalous is inversely proportional to the frequency it appeared in the training videos. is the weight calculated by a sigmoid function with and as parameters to control the abnormal degree in terms of the specific position.
where is the scale parameter. Similar to the irregular speed detection, the direction abnormality (orientation ) of pixel is calculated based on the “cut-bin” of the direction histogram.
Entropy estimation: There may be a great chance to detect the normal scene as an abnormal event if the displacement and direction respectively change. In order to consider both the direction and displacement carefully, the entropy calculation is a necessary step.
The Shannon entropy of each frame is calculated by Equation (5).
where is the probability assigned to the measured value of a random variable for direction and displacement . If the value of is higher than zero, then there is a greater possibility for an abnormal event in the frame. The Shannon entropy for a normal event is zero. So, Shannon entropy values higher than zero are considered as abnormal events in the frame.
Specifically, the histogram of orientation identifies the events based on the direction of the entrance and exit level in the video dataset. Then, a histogram of the motion vector magnitudes is computed to detect the uneven speed of events such as the wrong direction of driving or running. Finally, the histogram of the entropy of each frame is used to estimate heavy objects such as bags, vehicles, etc. Commonly, all three histograms can be engaged to identify the unusual events based on its actual information on the scenes.
3.3.2. FAST (Fast Accelerated Segment Test)
The interest points for the spatiotemporal domain can be extracted after extracting the histogram for orientation, magnitude, and entropy from the video using the FAST detector. The Fast Accelerated Segment Test (FAST) algorithm is the extension of the Feature from Accelerated Segment Test (FAST) used to extract the interest points in a spatiotemporal domain. It considers pixels in three Bresenham circles surrounding the interest point in the XY plane, XT plane, and YT plane (X, Y, and Time (T) dimensions) with a radius . The circle is labeled for each pixel in a clockwise manner. Similar to the existing FAST, interest points are extracted if all of the intensities of the nearest pixels are larger than a threshold value. On the other hand, the new FAST extracts the interest point when the reference pixel shows both a spatial (XY-plane) and temporal (XT-plane or YT-plane) domain. The existing FAST algorithm has a drawback, i.e., a high-speed test cannot be generalized well for all cases. The new FAST detector removes the background details if it is applied on the exact temporal frame differences and gives a dense set of interest points.
Finally, the optical flow energy of the KLT (L), HOME (H), and FAST (F) descriptors are computed to generate the feature pair, as in Equation (6):
The horizontal and vertical optical flow information of the feature descriptors in modulo 2 is represented by , where represents the horizontal optical flow component and denotes the vertical optical flow components in a video volume for pixels. Here, modulo 2 is used as per the resulting requirement; modulo 1 can also be used, but modulo 2 achieves a better result.
Thus, the proposed feature extraction technique measures the abnormality of motion and appearance based on orientation, magnitude, entropy, and interest points, as shown in Table 1. Features are fused to obtain a robust detection result. The fusion of two features, i.e., appearance (spatial) and motion (temporal) are achieved by the weighted sum of two vectors. The final feature vectors after the fusion are arranged in a matrix.
3.4. Deep Neural Network for Anomaly Detection and Prediction
A Deep Learning Classifier is used for the implementation of anomaly detection. The decision of whether the test video belongs to the unusual event or not is generated by the output of the DNN. The major goals of the DNN in anomaly detection are object classification, object detection, and activity recognition. The deep learning mechanism automatically learns the features from the input frames as well as the hand-crafted features to improve the classification performance. The high-level features extracted from the HOME-FAST feature extraction technique and the low-level input frames are fed as input to the deep learning mechanism.
The DNN handles a huge amount of video data in the training stage and the optimal convolution weights to decrease the error in the network are searched. The training stage needs iterative steps for the optimization with many cycles to reach the global minima; moreover, it is time-consuming. The DNN performs the task of anomaly detection, which studies the mapping procedure between the input and output vectors. The rectifier linear unit is used as an activation function that maps the input feature descriptor units into its equivalent activation function . Thus, the activation function can be defined by Equation (7):
The rectified linear unit (ReLU) is the most popular activation function for the DNN. The value of is calculated as:
In Equation (8), denotes the bias elements for every unit and the weight of each unit is represented as . Even though the neural network achieves powerful modeling in various research areas, it cannot achieve good results in video anomaly detection as the final mapping function is very difficult for the high dimensional feature vectors. There are large intra-class variations in the high dimension and low resolution of the video, which may be caused by background clutter, viewpoint change, and various motion speeds and styles. Meanwhile, the high dimension and low resolution of the video further increase the difficulty in achieving anomaly detection. The performance degradation on the existing prediction or mapping strategies is eliminated due to the deep and extensive architecture of the DNN. The major principle behind the DNN is to separate the output layer vectors into sub-vectors and implement the divide and conquers strategy to make the regression function easier. The basic model for the DNN can be represented by Equation (9):
The number of frames can be represented by F, is the estimated output, and is the real output. The features vectors extracted from the HOME-FAST feature tracker is fed to the network to find the anomaly events from the target events with a class posterior probability. The loss function provides a feedback procedure to combine the past frame with the new frame in the stage of a stochastic gradient-based optimization procedure. The softmax layer is typically the final output layer in a neural network that performs multi-class classification. The probability of the target events is estimated in the softmax layer with its activation function defined as:
In Equation (10), is the probability of the activation functions for target events, the last hidden layer is denoted as and is the total number of classes. The final decision-making strategy is attained at the output layer. The occasions other than the normal event obtained during the training stage are detected as anomalies. Finally, the DNN attains a mapping function with good decision-making as the result of a video sequence as typical or abnormal with the strange events. The DNN is prepared with just normal data. The feature learning technique for anomaly detection does not require task-based labels, so the network can be easily trained in the absence of anomaly samples. At testing time, the real data are compared with both the appearance and the motion representations reconstructed by the deep network and anomalous areas are detected by computing local differences.
4. Experimental Result and Discussion
This section provides the detailed experimental results of the proposed approach. The performance of the proposed technique was tested with 100+ videos (UCSD, Avenue, and LV datasets) in the MATLAB simulation platform.
4.1. Datasets
Descriptions regarding the datasets used for evaluation are listed below.
- UCSD dataset: An openly accessible dataset for the assessment of anomalous recognition and confinement in localization in crowded scenarios featuring pedestrian walkways [34]. The dataset was obtained with frames of 238 × 158 pixels in a stationary camera at 10 frames per second. The movement of non-passerby substances in the walkways and irregular persons on foot are expected as strange occasions. Both the Peds1 and Peds2 examples of a UCSD standard dataset were caught on a camera on an alternate area. Every situation in the video groupings (cuts) contained around 200 frames. In Peds1, there were 34 training and 36 testing videos. Likewise, Peds2 had 16 training and 12 testing videos.
- Avenue dataset: In the Chinese University of Hong Kong (CUHK) campus avenue, videos were taken with 30,652 (15,328 training, 15,324 testing) frames [35]. Sixteen training and 21 testing videos were available in the Avenue dataset. Challenges in the dataset included slight camera shake (in testing video 2, frames 1051–1100). A couple of anomalies were incorporated into the training data and some typical examples from time to time showed up in the training data. The training videos captured normal situations. Testing videos incorporated both ordinary and anomalous occasions.
- LV dataset: This particular LV dataset [36] was taken under different inside and outside light changes and camera movement situations. Strange occasions lasted for a few frames to a huge number of frames. All videos contained various test and training frames. It was extremely difficult to choose real-world recordings if the uncommon territories contained both a forefront area and background pixels.
4.2. Setup
In order to test the performance evaluation, all of the frames in a video were first resized to 120 × 160 pixels, which reduced the computational cost of the algorithm. The threshold value for the foreground estimation was set between 10 and 25 to achieve good results. So, we used 15 as the threshold value for the estimation. The spatiotemporal length was fixed at five. The spatiotemporal features were extracted for each frame from a cuboid with the dimensions of 5 × 5 × 3. During the evaluation of the proposed HOME-FAST feature extraction, we used four bins for magnitude, orientation, entropy, and interest point ranges. The four magnitude, orientation, and entropy ranges varied depending on the dimensions. The scale parameter was equal to 1.2, which controlled the increasing speed of the logistic curve at the central point while calculating the sigmoid function. The convolutional neural network (CNN) is one type of DNN that was used in this paper for anomaly prediction. The five layers of the CNN along with a fully connected layer specification are provided in Table 2. During the training process, the initial learning rate was 0.003; furthermore, the very last learning rate was set to 0.00003. During the learning phase, 45 epochs were used. The weights were initialized using the Xavier algorithm [37]. There are three primary kinds of layers in CNN architecture: Convolutional (Conv.) layer, Pooling layer, and Fully Connected (FC) layer. The layers of the CNN have neurons arranged in three dimensions.
4.3. Observation of Anomalous Events
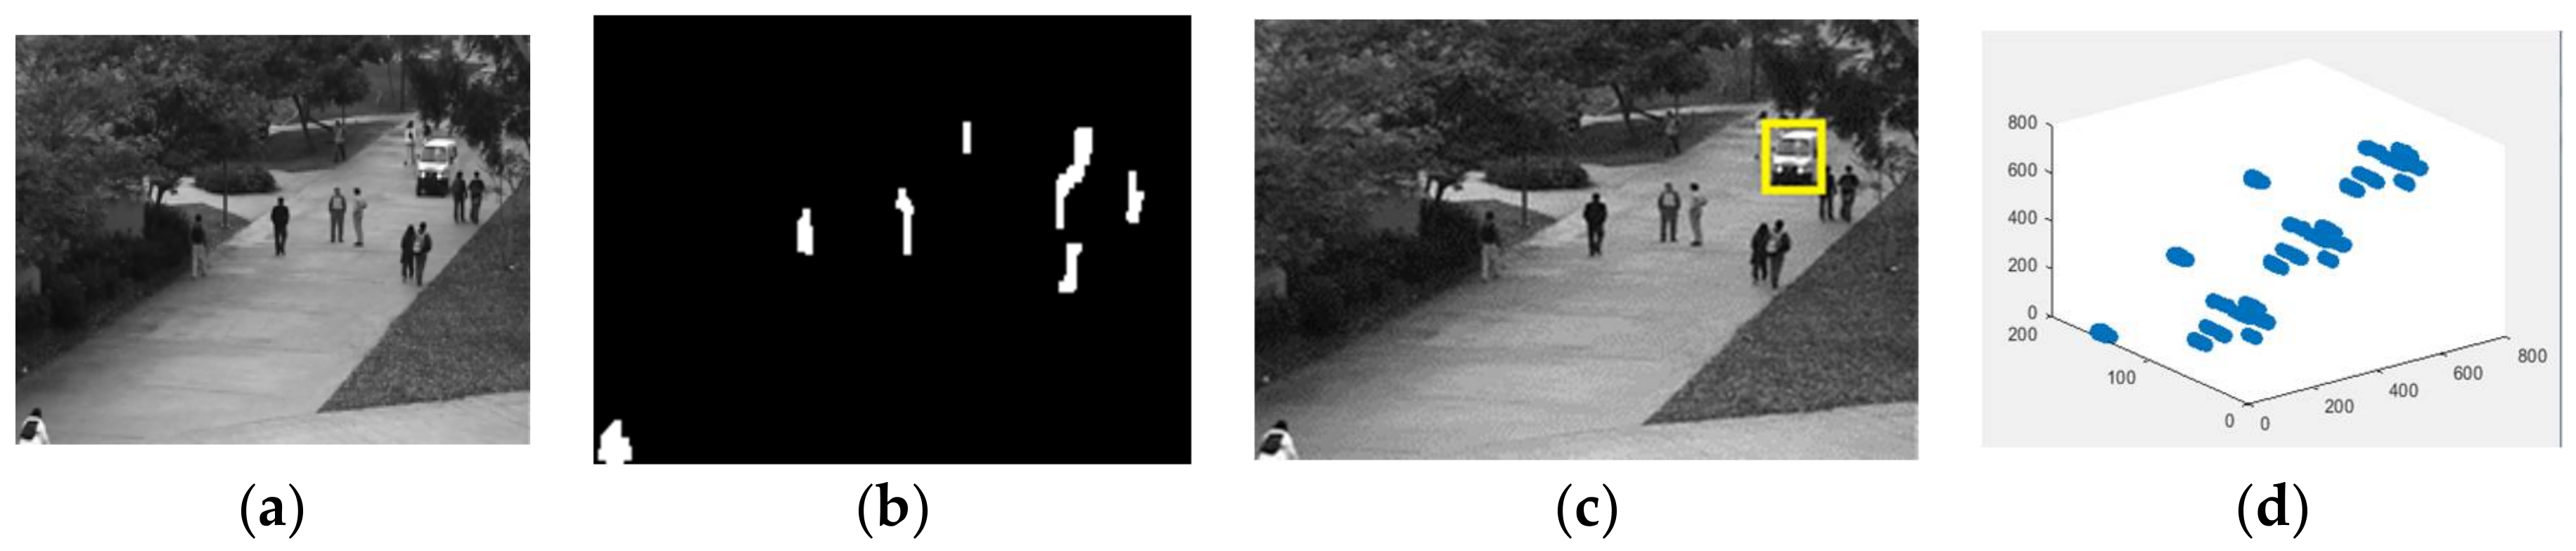
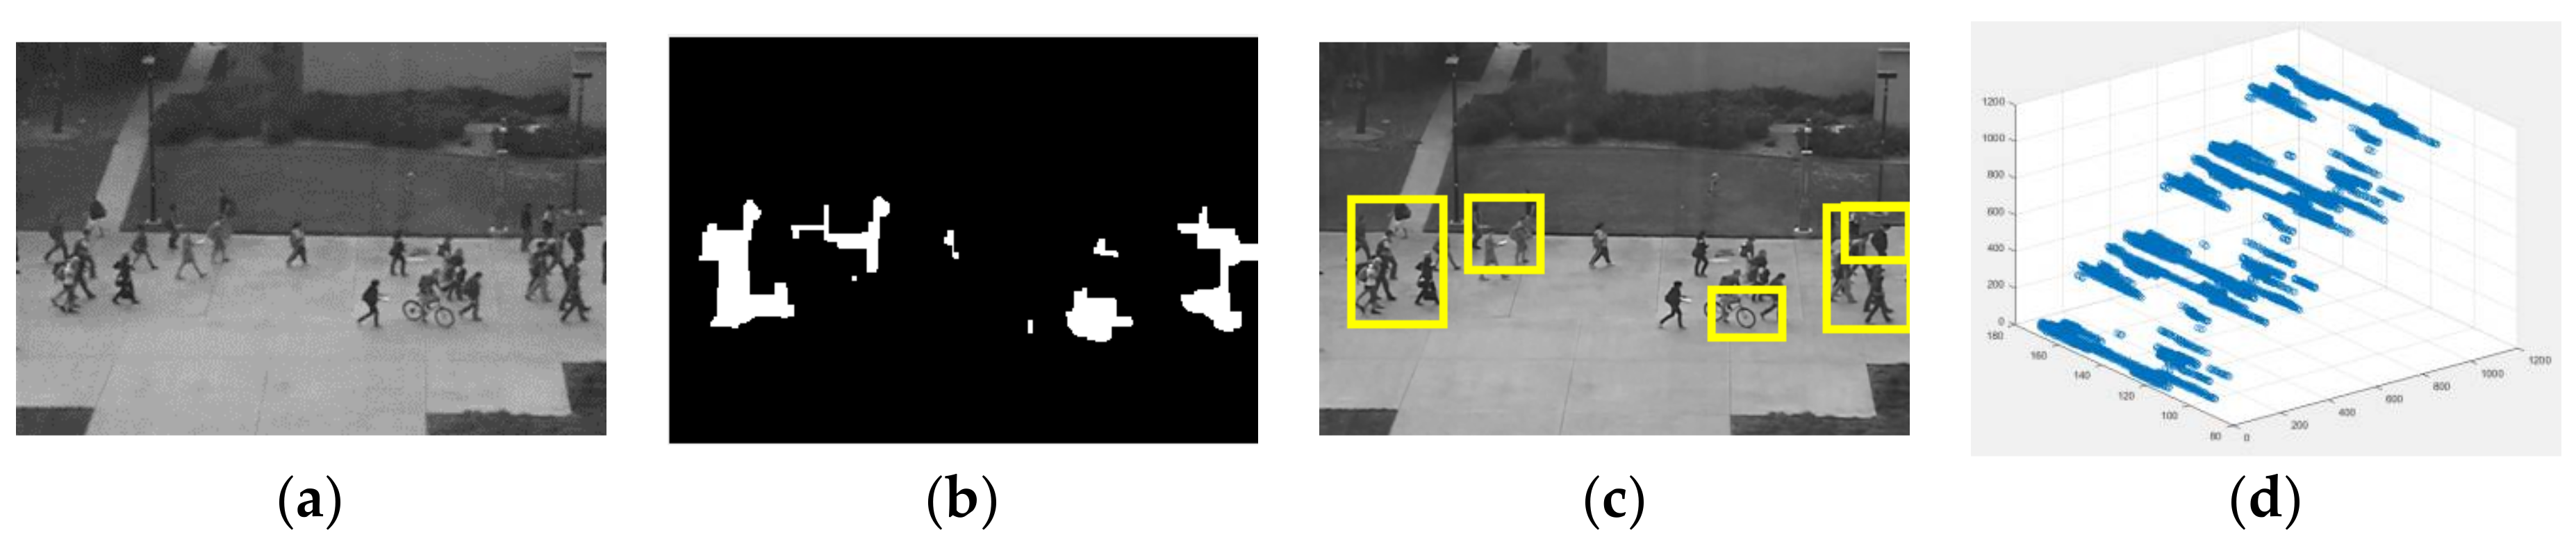
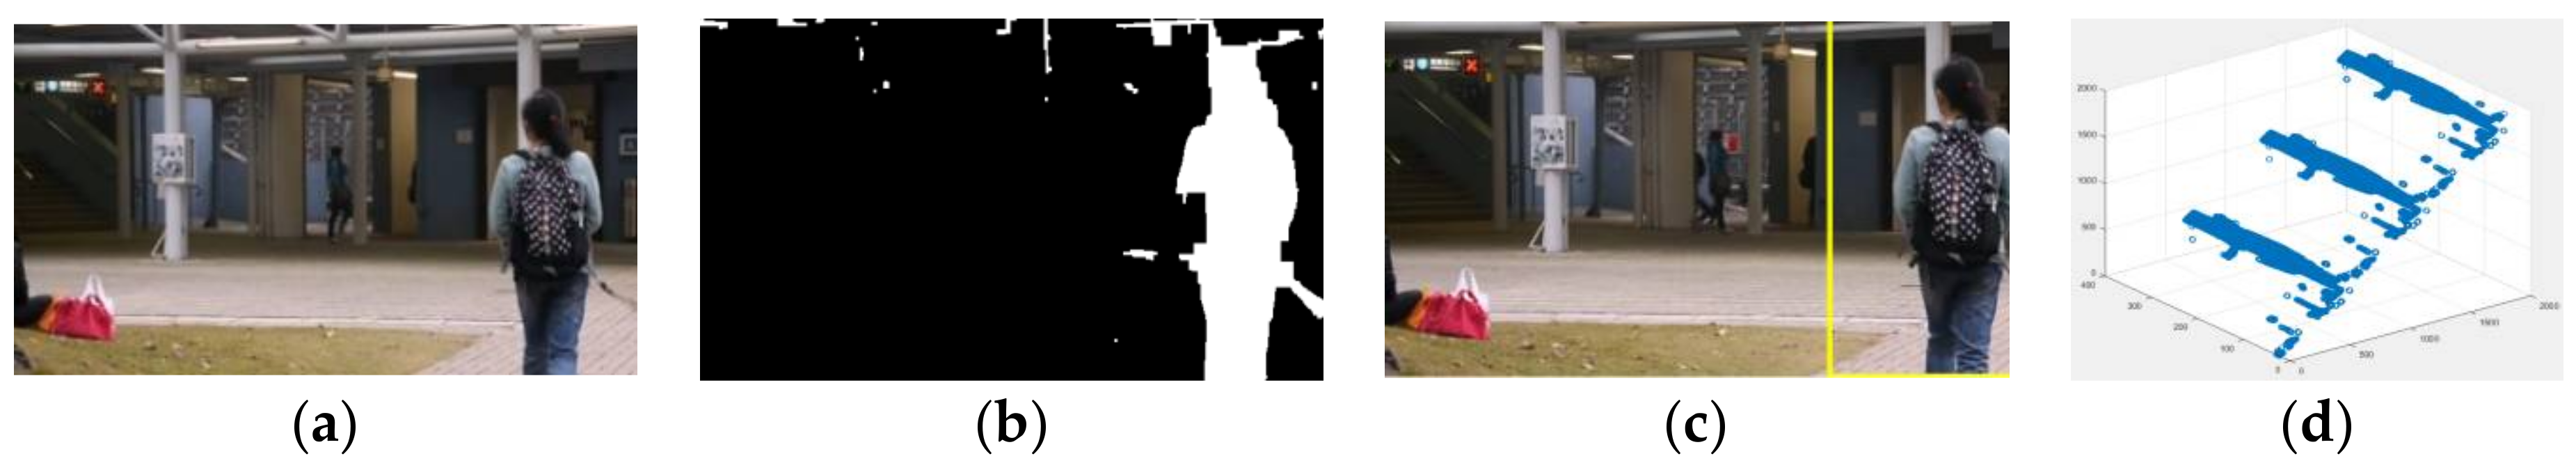
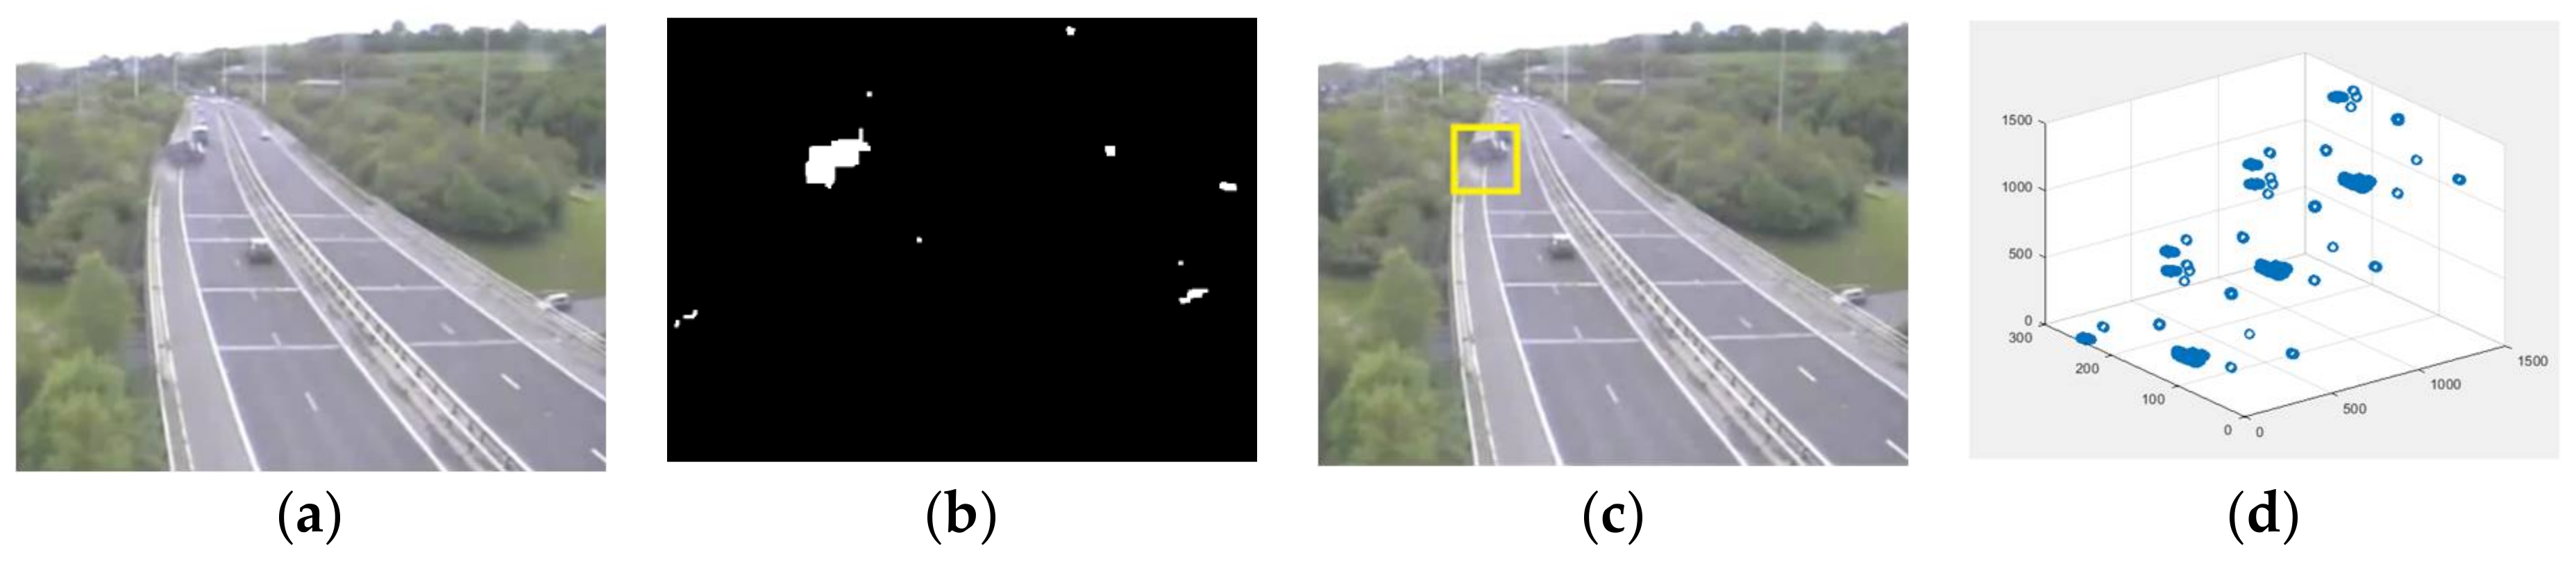
The anomalous events detected in the video dataset using the proposed approach are shown in Figure 2, Figure 3, Figure 4 and Figure 5. Figures significantly show some of the example frames for abnormal event detection. The small carts, cyclist, bikers, skaters, people walking in the grass or across a walkway and a man in the trolley are commonly occurring anomalies in the UCSD Peds1 and Peds2 dataset. Figure 2 shows a sample case of Peds1. Furthermore, it shows some cases of false alarms. In crowded scenes, sometimes one or more normal events are detected as anomalies. A small cart detected as an anomaly is represented by a box. Figure 3 shows the cyclist, people across a walkway, and uneven movements as anomalies. The example frame for the Avenue dataset is given in Figure 4, which shows the movement of people in the wrong direction. Finally, an accident on the roadway was identified as an anomaly for the LV dataset, which is given in Figure 5.
4.4. Evaluation Metrics and Result Analysis
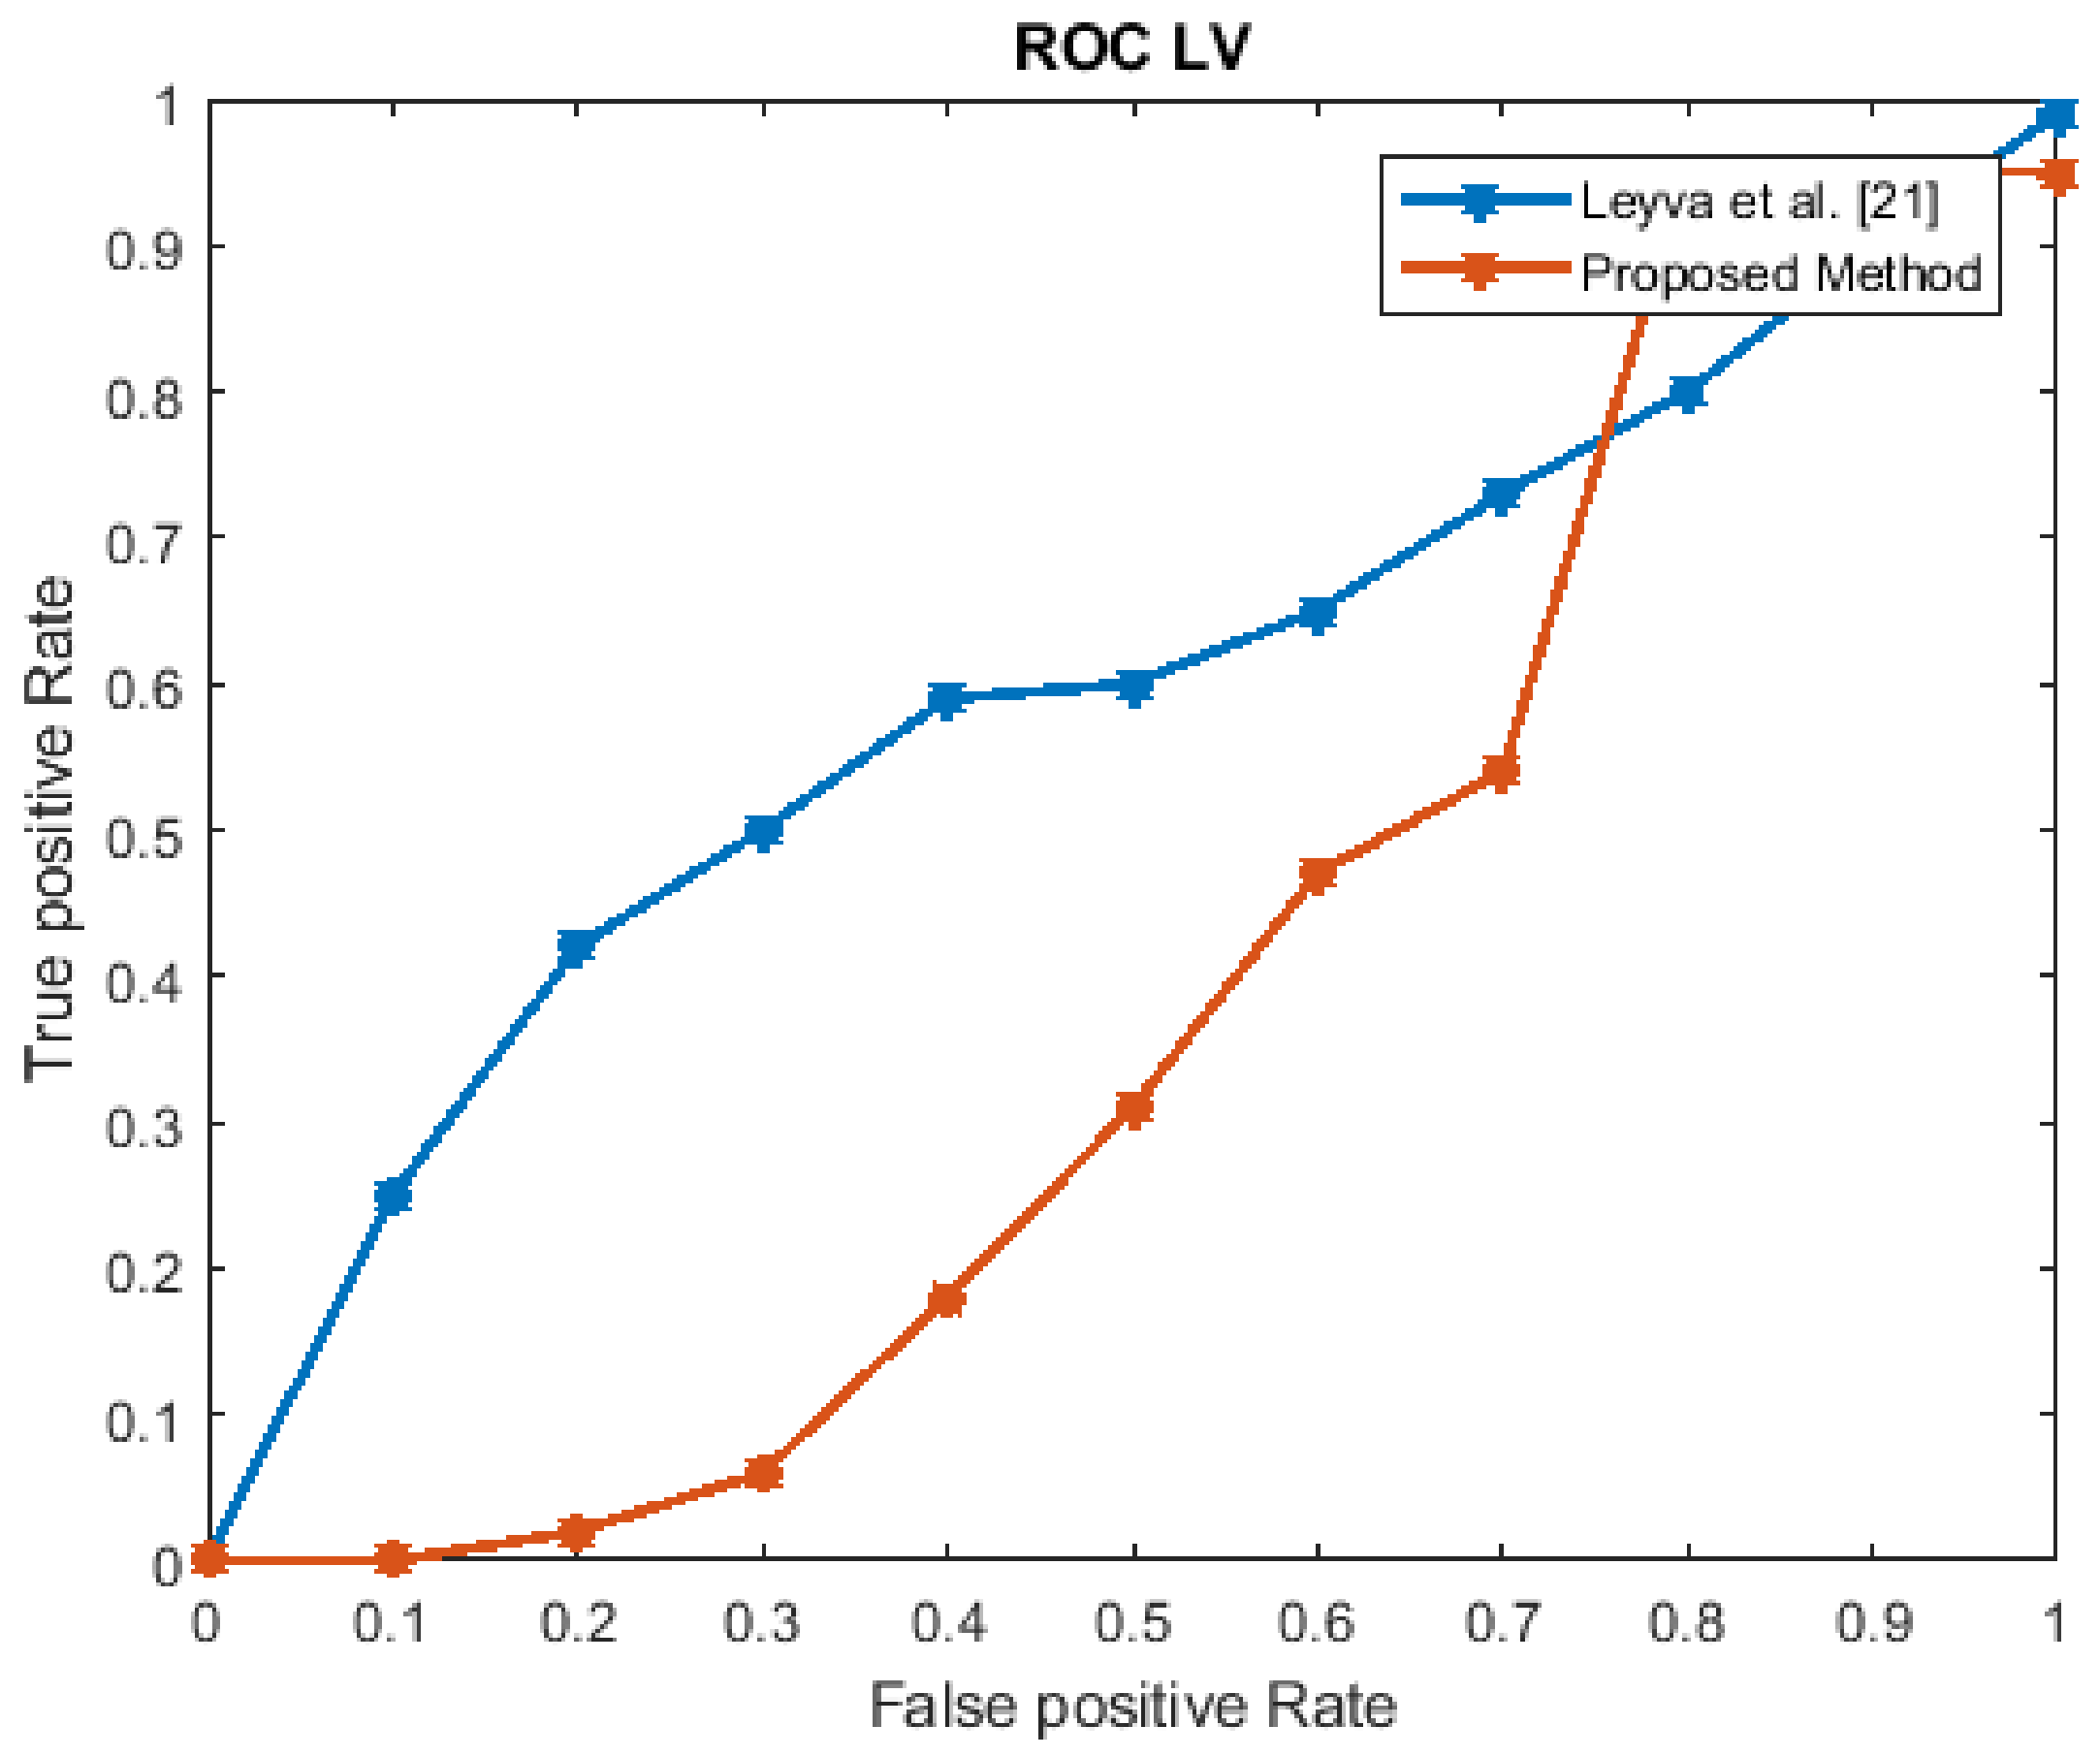
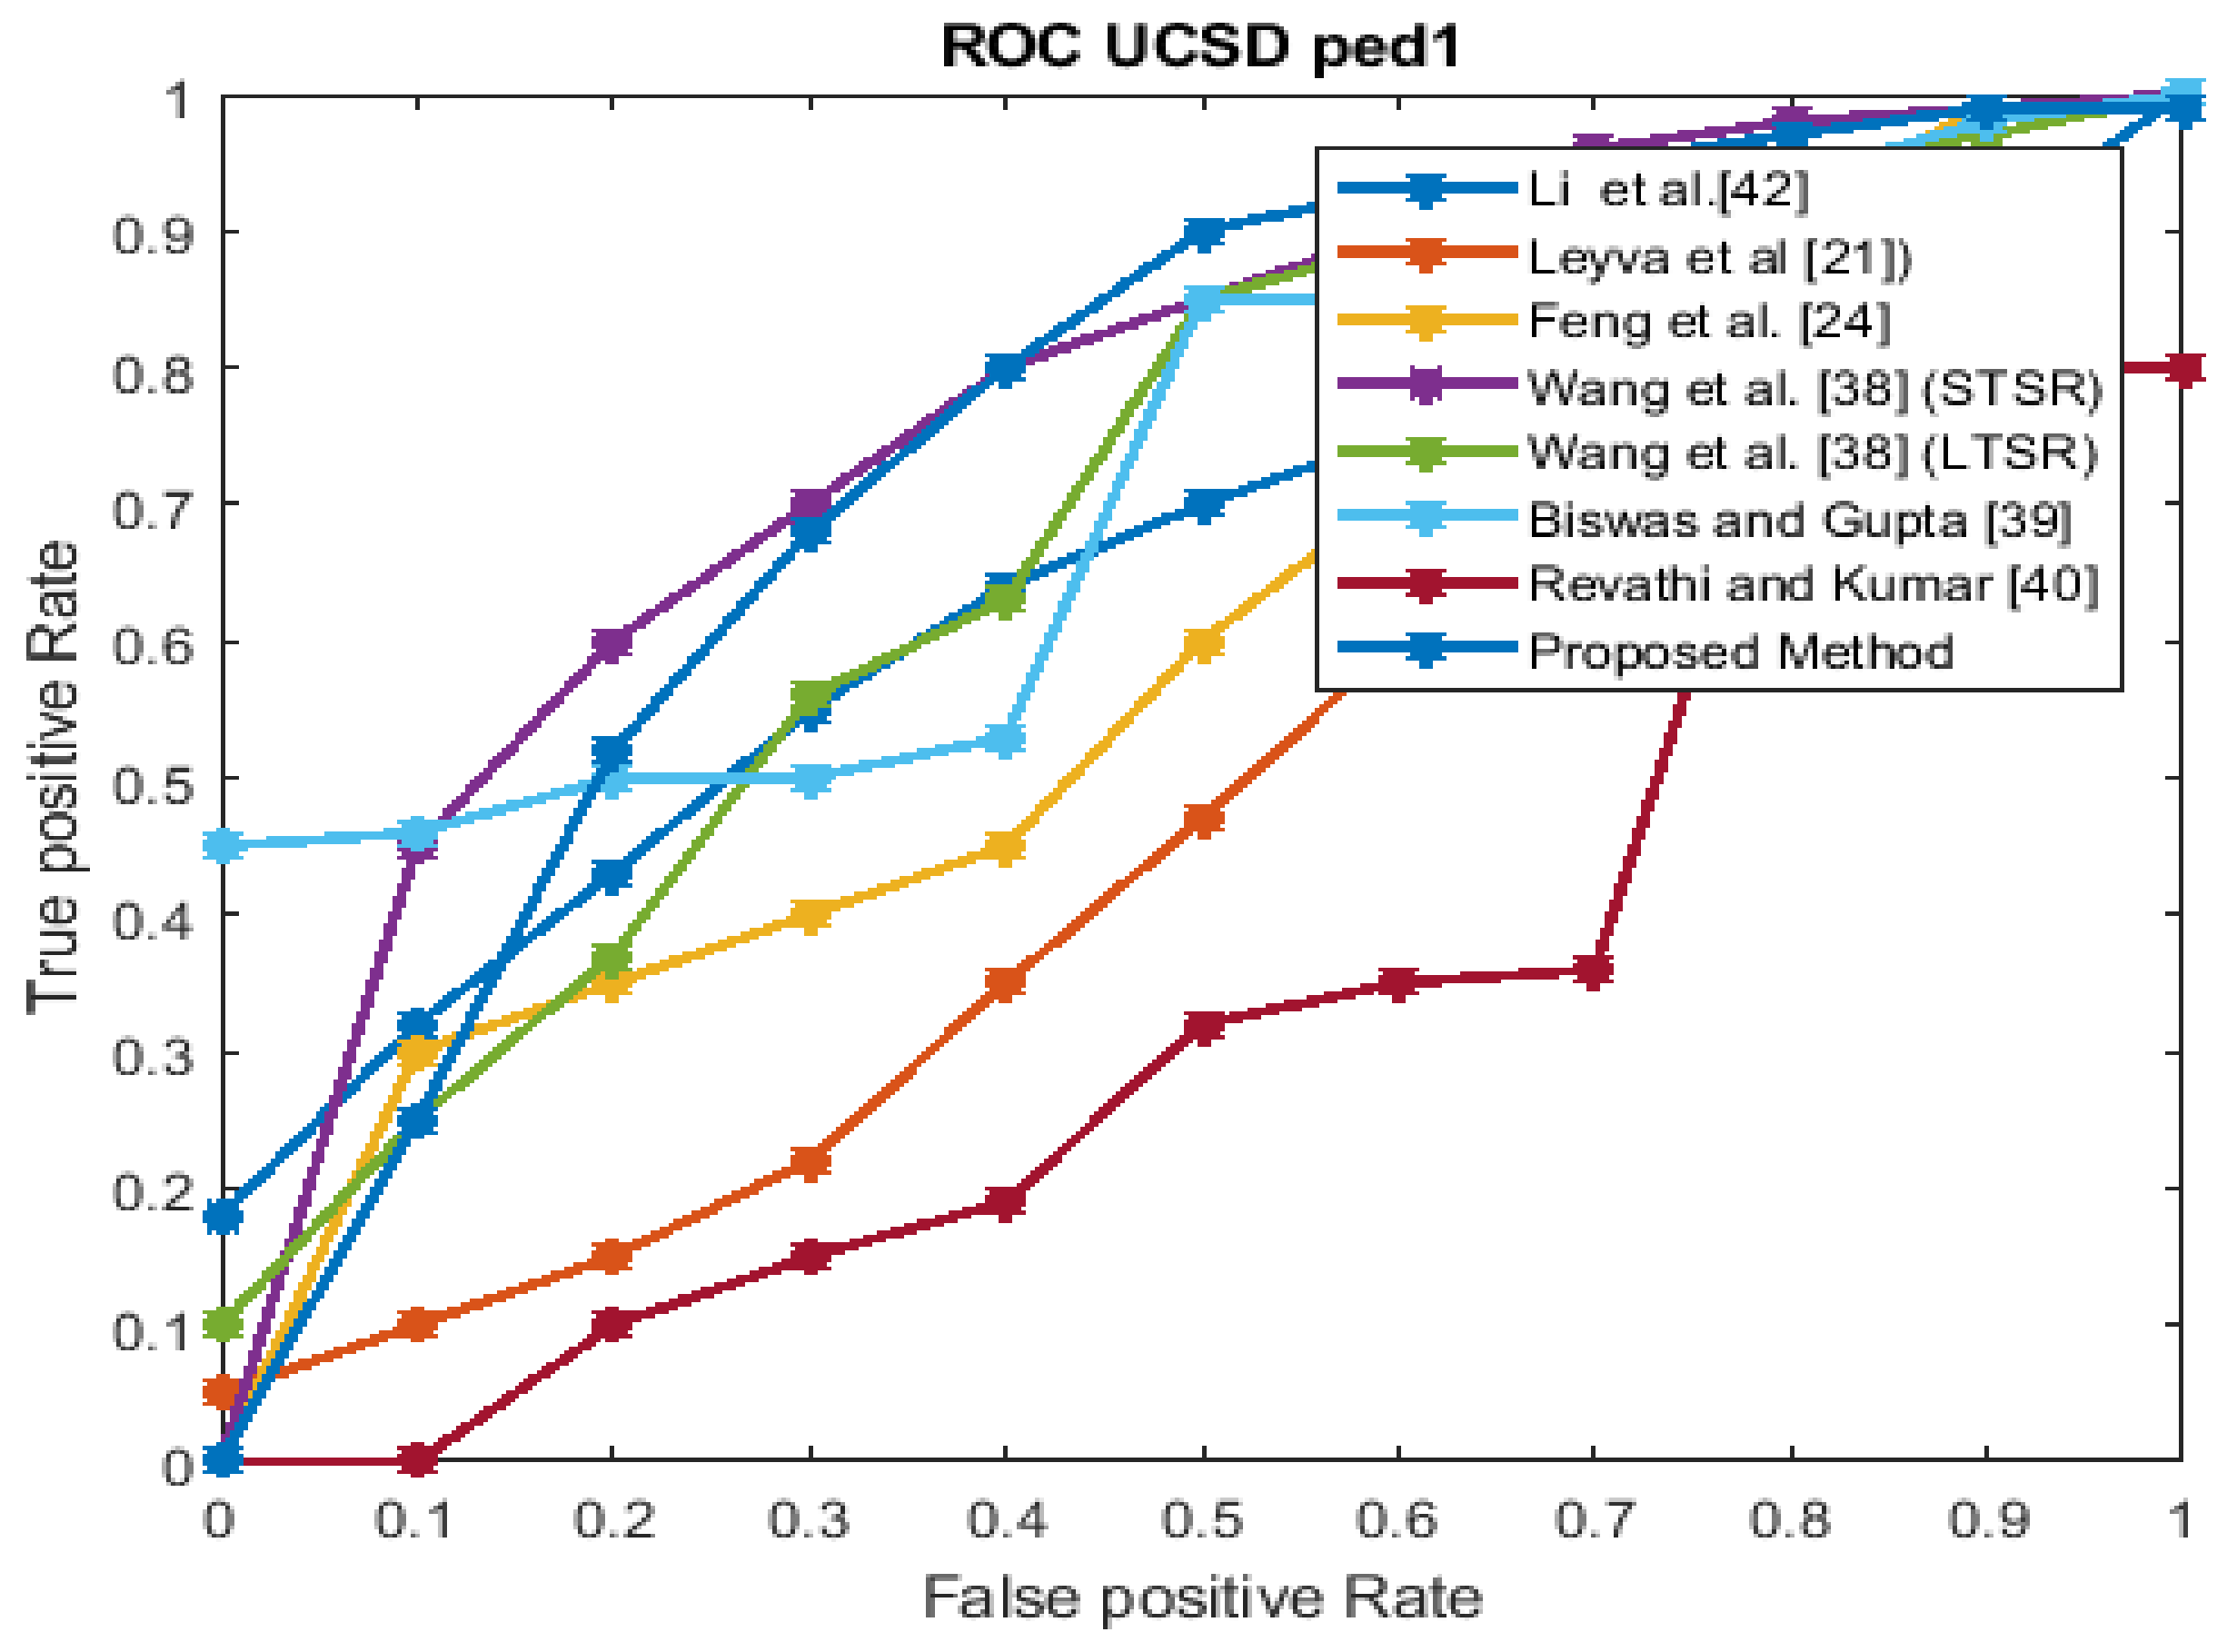
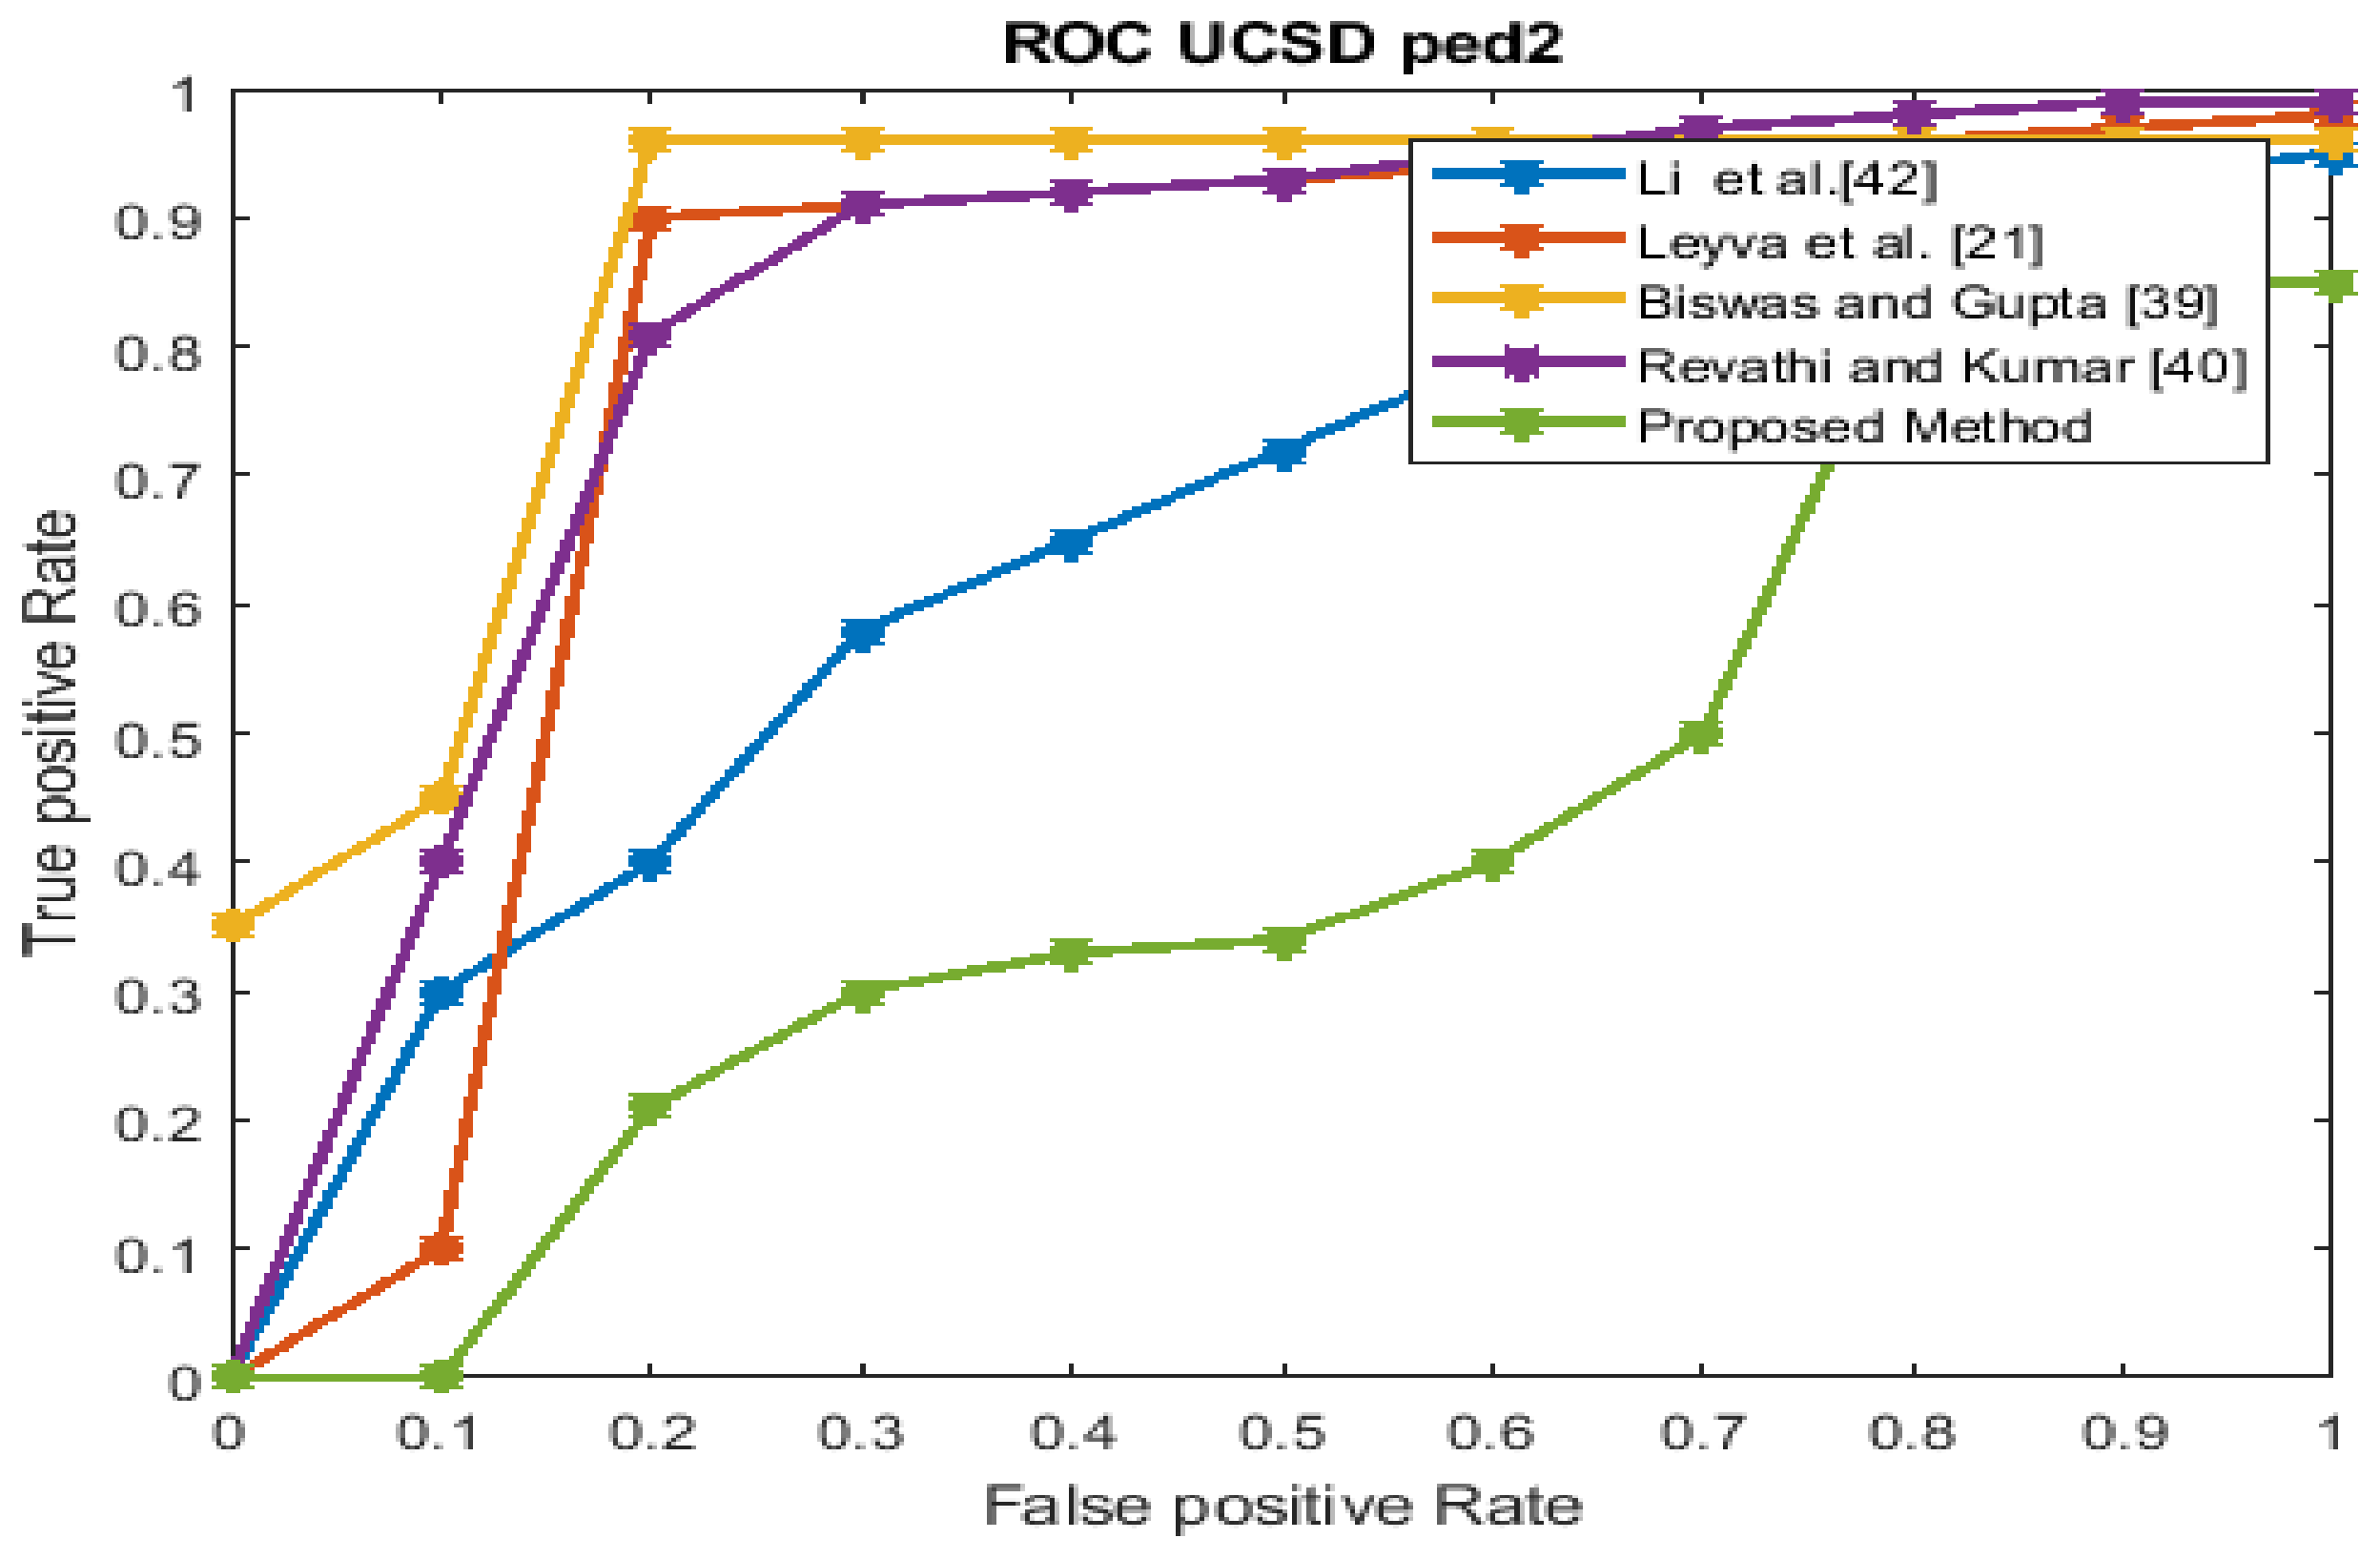
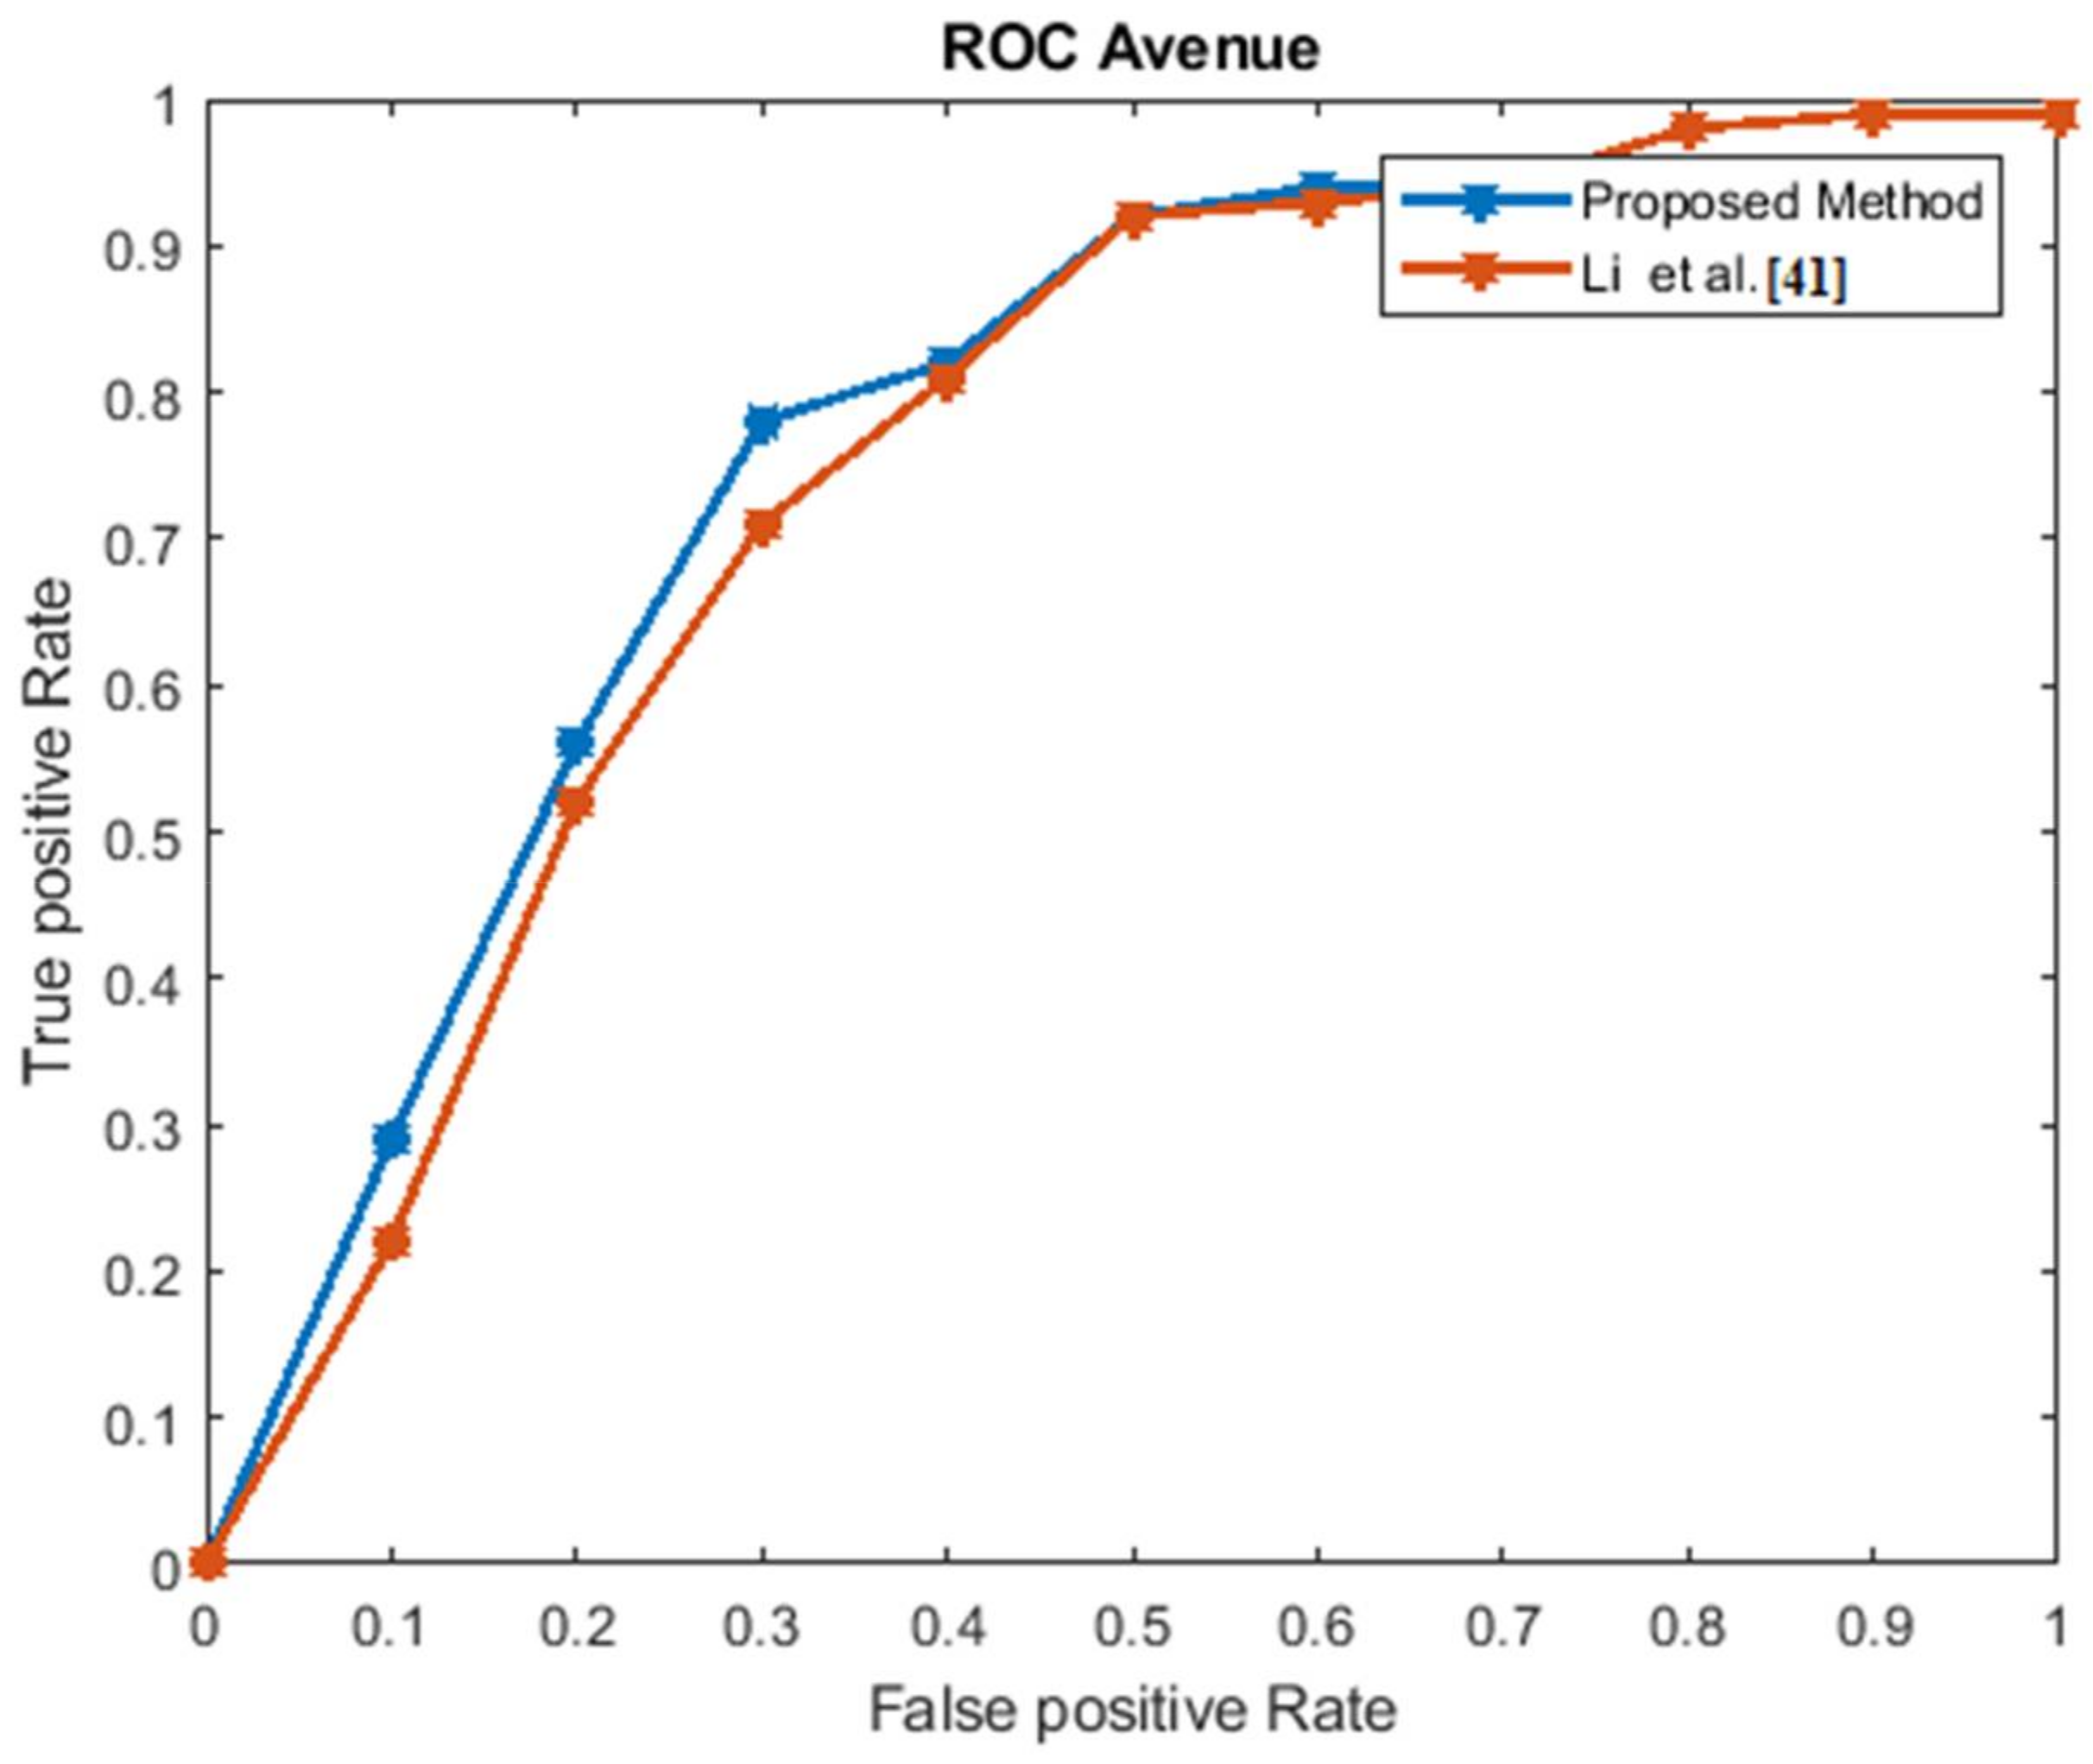
The performance estimation of the proposed strategy was computed in the form of the EER for the three datasets at frame level detection and compared with existing techniques. The existing approaches were modeled to improve the performance for an indoor environment, but the proposed approach used in this paper concentrated on the performance (accuracy, EER, and processing time) in unconstrained scenarios (dense crowds and complex scenes). The Receiver Operating Characteristics (ROC) curve indicates its precision in the form of its sensitivity. From the ROC curve, note that the anomaly identification of the proposed approach achieved a better result for the three datasets.
Figure 6, Figure 7, Figure 8 and Figure 9 show the ROC curves for the three datasets to measure the cut-off points in terms of sensitivity and specificity. The proposed approach achieved a competitive performance compared with the existing approaches in References [21,24,38,39,40,41].
The frame processing time and EER of the projected approach for the three datasets are given in Table 3. In Table 4, the EER for the proposed approach is contrasted with those of the state-of-the-art techniques.
Some existing techniques mainly concentrate on the frame processing time, but do not consider the motion features (neither optical flow nor background subtraction). Moreover, they use some simple motion vectors and temporal gradients to achieve the minimum processing time, but this leads to the degradation of the detection performance. The proposed work in this paper concentrated on both of these problems and achieved a better result when compared to other recent existing techniques. The HOME-FAST feature descriptor identifies activities such as a person moving in the wrong direction, running, robbery, etc. as the entropy used in this approach does not add discriminative details.
In Reference [43], the author proposed a 3D spatiotemporal local histogram of gradient (HOG3D) descriptor, which achieved a maximum EER (%). It extracts only the histogram of magnitude and orientation information. The Histogram of Oriented Optical Flow (HOOF) is also a spatiotemporal feature descriptor proposed by Chaudhry et al. [44]. This descriptor captures information based on the optical flow orientation. The extension of HOOF is the Histograms of Optical Flow Orientation and Magnitude (HOFM) [47], which improves the performance by aggregating the velocity information. To improve the performance, another descriptor called the Histograms of Optical Flow Orientation, Magnitude, and Entropy (HOFME) [46] evaluates the entropy of the orientation flow. Our HOME-FAST method outperforms all of the existing methods by measuring the magnitude, orientation, entropy, and interest points along with the optical flow information. It achieved a better performance when compared with the existing approaches in terms of EER. Thus, the proposed approach was found to extract high-level features such as appearance and motion information accurately to detect anomaly events.
Table 6 represents the running time during the testing of each frame for the proposed approach compared with those of the state-of-the-art techniques. The calculation region was divided into four parts as per the cores and assigning it to four threads made the processing speed 3.2 GHz. This limited the frame processing time during testing to 5.8 and 5.4 milliseconds for the UCSD Peds1 and UCSD Peds2 dataset, respectively.
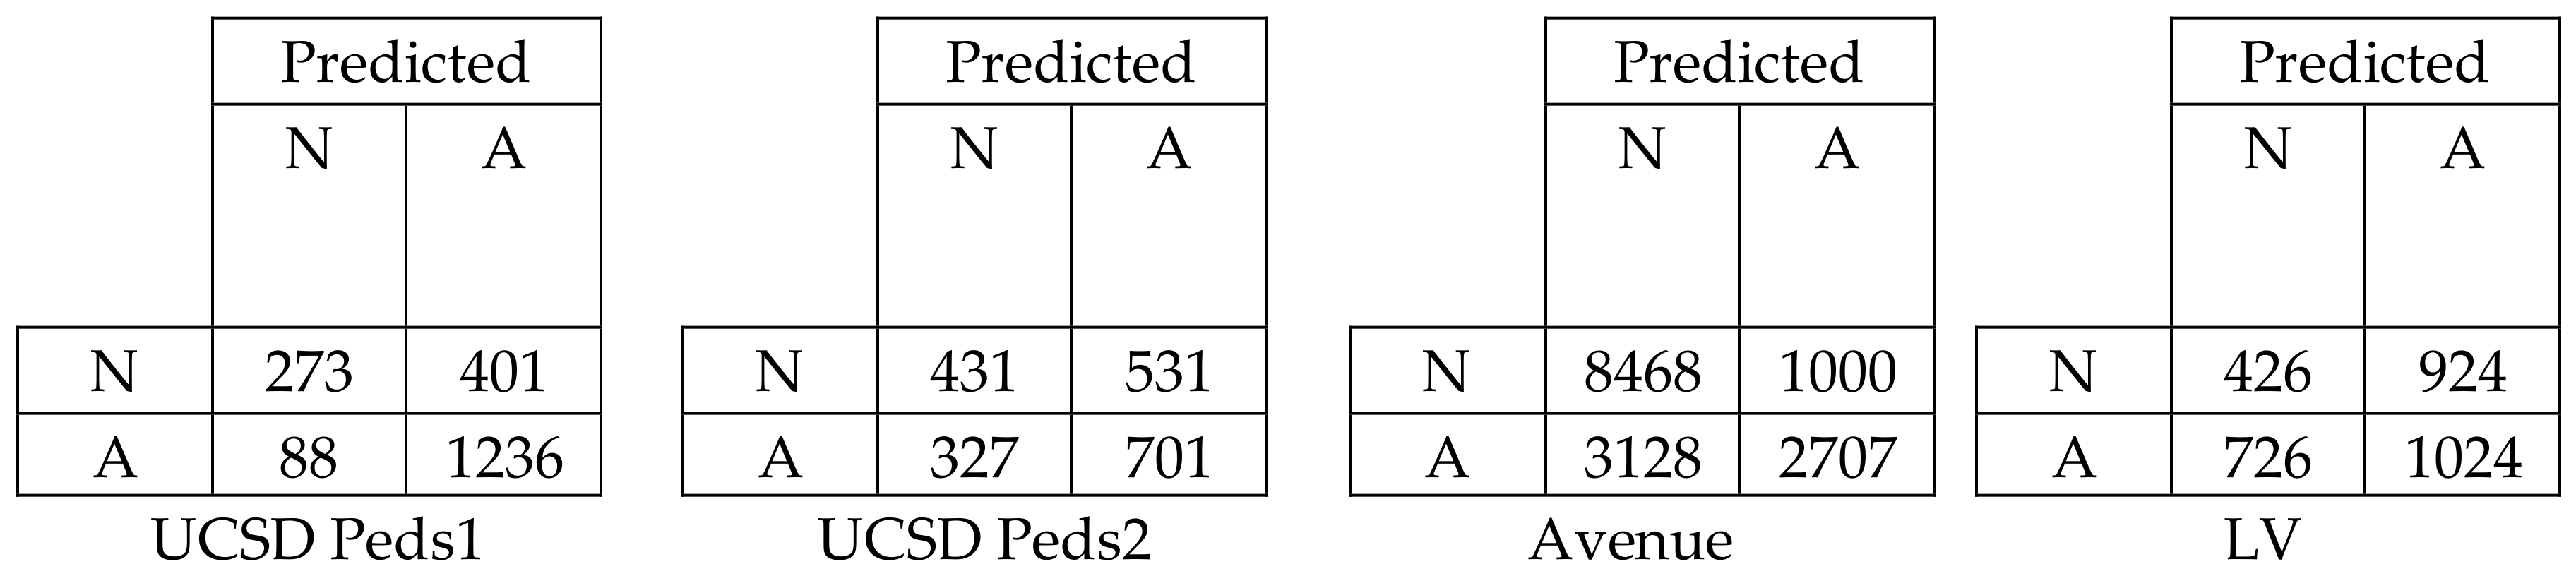
Figure 10 represents the confusion matrix for all datasets in terms of EER to show the classification performance of deep learning with low-level and high-level features. We can easily evaluate the True Positive Rate (TPR) and True Negative Rate (TNR) from the above table. The TPR and TNR for the UCSD Peds1, UCSD Peds2, Avenue, and LV datasets were calculated as 0.756 and 0.755, 0.569 and 0.568, 0.730 for both, and 0.726 and 0.727, respectively. Thus, the confusion matrix proved that the deep learning achieved a high classification performance by obtaining a balanced output in terms of TPR and TNR.
5. Conclusions
This paper presented a framework called the HOME-FAST descriptor with deep learning. The main goal was to detect the anomalous behavior of events in crowded scenes. In this method, a model was presented in the spatiotemporal domain for generating feature vectors based on orientation, velocity, entropy, and interest points from the cuboids. The performance evaluation was conducted on the UCSD, Avenue, and LV familiar datasets to obtain the AUC result. On the UCSD dataset, the results achieved for the Peds2 scenario in the proposed work was better when compared to the results of the Peds1 scenario. Due to these outcomes, the HOME-FAST deep learning achieved better results than all of the other previous features. The percentage of accuracy for the proposed approach was improved when compared with the recent existing methods for the Avenue and LV datasets. Even though the proposed approach provided a better performance on the anomalous events, there were some false alarms in the crowded scenes.
In the present scenario, the anomalous activities were identified by considering patches in isolation. It would be beneficial if multiple patterns are allowed in future research to identify the additional unusual events.
Author Contributions
Conceptualization, Methodology K.G.G., P.M.; Software, K.G.G.; Validation, K.G.G.; Investigation, Writing—Original Draft Preparation, K.G.G.; Resources, Review and Editing, Supervision, P.M.
Conflicts of Interest
The authors declare no conflict of interest.
References
- Sodeman, A.A.; Ross, M.P. A Review of Abnormality Detection in Automated Surveillance. IEEE Trans. Syst. Man Cybern. 2012, 42, 1257–1272. [Google Scholar] [CrossRef]
- Chen, C.; Shao, Y.; Bi, X. Detection of Anomalous Crowd Behaviour Based on the Acceleration Feature. IEEE Sens. J. 2015, 15, 7252–7261. [Google Scholar] [CrossRef]
- Kaltsa, V.; Briassouli, A.; Komptsiaris, L. Swarm Intelligence for Detecting Interesting Events in Crowded Environ. IEEE Trans. Image Process 2015, 24, 2153–2166. [Google Scholar] [CrossRef] [PubMed]
- Chen, C.; Shao, Y. Crowd Escape Behaviour Detection and Localization Based on Divergent Centers. IEEE Sens. J. 2015, 15, 2431–2439. [Google Scholar] [CrossRef]
- Chen, D.Y.; Hung, P.C. Visual-Based Human Crowds Behaviour Analysis Based on Graph Modelling and Matching. IEEE Sens. J. 2013, 13, 2129–2138. [Google Scholar] [CrossRef]
- Piciarelli, C.; Foresti, G.L. Surveillance-Oriented Event Detection in Video Streams. IEEE Intell. Syst. 2011, 26, 32–41. [Google Scholar] [CrossRef]
- Utasi, A.; Czuni, L. Detecting irregular camera events in time-multiplexed videos. Electron. Lett. 2009, 45, 935–937. [Google Scholar] [CrossRef]
- Cai, Y.; Wang, X.; Chen, X.; Jiang, H. Trajectory-based anomalous behaviour detection for intelligent traffic surveillance. IET Intell. Transp. Syst. 2015, 9, 810–816. [Google Scholar] [CrossRef]
- Li, W.; Mahadevan, V.; Vasconcelos, N. Anomaly Detection and Localization in Crowded Scenes. IEEE Trans. Patterns Anal. Mach. Intell. 2014, 36, 18–32. [Google Scholar] [CrossRef] [Green Version]
- Cong, Y.; Yuan, J.; Tang, Y. Video Anomaly Search in crowded scenes via Spatio-temporal Motion Context. IEEE Trans. Inf. Forensics Secur. 2013, 8, 1590–1599. [Google Scholar] [CrossRef]
- Li, N.; Wu, X.; Xu, D.; Guo, H.; Feng, W. Spatio-temporal context analysis within video volumes for anomalies-event detection and localization. Neurocomputing 2015, 155, 309–319. [Google Scholar] [CrossRef]
- Biswas, S.; Babu, R.V. Anomaly detection in compressed, H. 264/AVC video. Multimedia Tools Appl. 2015, 74, 11099–11115. [Google Scholar] [CrossRef]
- Yuan, Y.; Feng, Y.; Lu, Y. Statistical Hypothesis Detector for Anomalous Detection in Crowded Scenes. IEEE Trans. Cybern. 2016, 99, 1–12. [Google Scholar]
- Singh, D.; Mohan, C.K. Graph formulation of video activities for abnormal event recognition. Pattern Recognit. 2017, 65, 265–272. [Google Scholar] [CrossRef]
- Zhang, Y.; Lu, H.; Zhang, L.; Ruan, X.; Sakai, S. Video anomaly detection based on locality sensitive hashing filters. Pattern Recognit. 2016, 59, 302–311. [Google Scholar] [CrossRef]
- Zhou, S.; Shen, W.; Zeng, D.; Fang, M.; Wei, Y.; Zhang, Z. Spatial-temporal convolution neural networks for anomaly detection and localization in crowded scenes. Image Commun. 2016, 47, 358–368. [Google Scholar] [CrossRef]
- Cosar, G.; Donatiello, V.; Bogorny, C.; Garate; Alvares, L.O.; Brémond, F. Toward Abnormal Trajectory and Event Detection in video Surveillance. IEEE Trans. Circuits Syst. Video Technol. 2017, 27, 683–695. [Google Scholar] [CrossRef]
- Sun, Q.; Liu, H.; Harada, T. Online growing neural gas for anomaly detect in changing surveillance scene. Pattern Recognit. 2017, 64, 187–201. [Google Scholar] [CrossRef]
- Cheng, K.W.; Chen, Y.T.; Fang, W.H. An efficient subsequence search for video anomaly detection and localization. Multimedia Tools Appl. 2016, 75, 15101–15122. [Google Scholar] [CrossRef]
- Pennisi, A.; Bloisi, D.D.; Iocchi, L. Online real-time crowd behaviour detection in video sequences. Comput. Vis. Image Underst. 2016, 144, 166–176. [Google Scholar] [CrossRef]
- Zhang, T.; Jia, W.; Yang, B.; Yang, J.; He, X.; Zheng, Z. MOWLD: A robust motion image descriptor for violence detection. Multimedia Tools Appl. 2017, 76, 1419–1438. [Google Scholar] [CrossRef]
- Bertini, M.; Bimbo, A.D.; Seidenari, L. Multi-scale and real-time non-parametric approach for anomaly detection and localization. Comput. Vis. Image Underst. 2012, 116, 320–329. [Google Scholar] [CrossRef]
- Kumar, D.; Bezdek, J.C.; Rajasegarar, S.; Leckie, C.; Palaniswami, M. A Visual-Numeric Approach to clustering and Anomaly Detection for Trajectory Data. Vis. Comput. 2017, 33, 265–281. [Google Scholar] [CrossRef]
- Leyva, R.; Sanchez, V.; Li, C.T. Video Anomaly Detection with Compact Feature Sets for Online Performance. IEEE Trans. Image Process. 2017, 26, 3463–3478. [Google Scholar] [CrossRef] [PubMed]
- Zhang, Y.; Lu, H.; Zhang, L.; Ruan, X. Combining motion and appearance cues for anomaly detection. Pattern Recognit. 2016, 51, 443–452. [Google Scholar] [CrossRef]
- Bao, T.; Karmoshi, S.; Ding, C.; Zhu, M. Abnormal event detection and localization in crowded scenes based on PCANet. Multimedia Tools Appl. 2017, 76, 23213–23224. [Google Scholar] [CrossRef]
- Xu, D.; Song, R.; Wu, X.; Li, N.; Feng, W.; Qian, H. Video anomaly detection based on a hierarchical activity discovery within spatio-temporal contexts. Neurocomputing 2014, 143, 144–152. [Google Scholar] [CrossRef]
- Feng, Y.; Yuan, Y.; Lu, X. Learning deep event models for crowd anomaly detection. Neurocomputing 2017, 219, 548–556. [Google Scholar] [CrossRef]
- Ribeiro, M.; Lazzaretti, A.E.; Lopes, H.S. A study of deep convolutional auto-encoders for anomaly detection in videos. Pattern Recognit. Lett. 2018, 105, 13–22. [Google Scholar] [CrossRef]
- Xu, D.; Ricci, E.; Yan, Y. Learning deep representation of appearance and motion for anomalous event detection. arXiv, 2015; arXiv:1510.01553. [Google Scholar]
- Caetano, C.A.; De Melo, V.H.; dos Santos, J.A.; Schwartz, W.R. Activity Recognition based on a Magnitude-Orientation Stream Network. In Proceedings of the 2017 30th SIBGRAPI Conference on Graphics, Patterns and Images (SIBGRAPI), Niteroi, Brazil, 17–20 October 2017; pp. 47–54. [Google Scholar]
- Bouguet, J.Y. Pyramidal implementation of the affine lucaskanade feature tracker description of the algorithm. Intel Corp. 2001, 5, 1–10. [Google Scholar]
- Sharif, M.H.; Djeraba, C. An entropy approach for abnormal activities detection in video streams. Pattern Recognit. 2012, 45, 2543–2561. [Google Scholar] [CrossRef]
- Statistical Visual Computing Lab. UCSD Anomaly Data Set. 2014. Available online: http://www.svcl.ucsd.edu/projects/anomaly/ (accessed on 26 February 2013).
- Lu, C.; Shi, J.; Jia, J. Abnormal event detection at 150 FPS in MATLAB. In Proceedings of the 2013 IEEE International Conference on Computer Vision (ICCV), Sydney, Australia, 1–8 December 2013; pp. 2720–2727. [Google Scholar]
- Leyva, R.; Sanchez, V.; Li, C.T. The LV dataset: A realistic surveillance video dataset for abnormal event detection. In Proceedings of the 2017 5th International Workshop on Biometrics and Forensics (IWBF), Coventry, UK, 4–5 April 2017; pp. 1–6. [Google Scholar]
- Glorot, X.; Bengio, Y. Understanding the difficulty of training deep feedforward neural networks. In Proceedings of the Thirteenth International Conference on Artificial Intelligence and Statistics, Sardinia, Italy, 13–15 May 2010; pp. 249–256. [Google Scholar]
- Wang, C.; Yao, H.; Sun, X. Anomaly detection based on spatio-temporal sparse representation and visual attention analysis. Multimedia Tools Appl. 2017, 76, 6263–6279. [Google Scholar] [CrossRef]
- Biswas, S.; Gupta, V. Abnormality detection in crowd videos by tracking sparse components. Mach. Vis. Appl. 2017, 28, 35–48. [Google Scholar] [CrossRef]
- Revathi, A.R.; Kumar, D. An efficient system for anomaly detection using deep learning classifier. Signal Image Video Process. 2017, 11, 291–299. [Google Scholar] [CrossRef]
- Li, S.; Yang, Y.; Liu, C. Anomaly detection based on two global grid motion templates. Signal Process. Image Commun. 2018, 60, 6–12. [Google Scholar] [CrossRef]
- Rabiee, H.; Mousavi, H.; Nabi, M.; Ravanbakhsh, M. Detection and localization of crowd behavior using a novel tracklet-based model. Int. J. Mach. Learn. Cybern. 2017, 8, 1–12. [Google Scholar] [CrossRef]
- Klaser, A.; Marszałek, M.; Schmid, C. A spatio-temporal descriptor based on 3D-gradients. In Proceedings of the British Machine Vision Conference, Leeds, UK, 1–4 September 2008. [Google Scholar]
- Chaudhry, R.; Ravichandran, A.; Hager, G.; Vidal, R. Histograms of oriented optical flow and binet-cauchy kernels on nonlinear dynamical systems for the recognition of human actions. In Proceedings of the IEEE Conference on Computer Vision and Pattern Recognition (CVPR 2009), Miami, FL, USA, 20–25 June 2009. [Google Scholar]
- Wang, H.; Klser, A.; Schmid, C.; Liu, C.-L. Dense trajectories and motion boundary descriptors for action recognition. Int. J. Comput. Vis. 2013, 103, 60–79. [Google Scholar] [CrossRef]
- Colque, R.V.H.M.; Caetano, C.; de Andrade, M.T.L.; Schwartz, W.R. Histograms of Optical Flow Orientation and Magnitude and Entropy to Detect Anomalous Events in Videos. IEEE Trans. Circuits Syst. Video Technol. 2017, 27, 673–682. [Google Scholar] [CrossRef]
- Colque, R.V.H.M.; Junior, C.A.C.; Schwartz, W.R. Histograms of optical flow orientation and magnitude to detect anomalous events in videos. In Proceedings of the 2015 28th SIBGRAPI Conference on Graphics, Patterns and Images (SIBGRAPI), Salvador, Brazil, 26–29 August 2015. [Google Scholar]
- Mahadevan, V.; Li, W.; Bhalodia, V.; Vasconcelos, N. Anomaly detection in crowded scenes. In Proceedings of the 2010 IEEE Conference on Computer Vision and Pattern Recognition (CVPR), San Francisco, CA, USA, 13–18 June 2010. [Google Scholar]
- Cong, Y.; Yuan, J.; Liu, J. Sparse reconstruction cost for abnormal event detection. In Proceedings of the 2011 IEEE Conference on Computer Vision and Pattern Recognition (CVPR), Providence, RI, USA, 20–25 June 2011. [Google Scholar]
- Xu, D.; Yan, Y.; Ricci, E.; Sebe, N. Detecting anomalous events in videos by learning deep representations of appearance and motion. Comput. Vis. Image Underst. 2017, 156, 117–127. [Google Scholar] [CrossRef]
Figure 1.
Architecture of the proposed deep learning with the HOME-FAST (Histogram of Orientation, Magnitude, and Entropy with Fast Accelerated Segment Test) Spatiotemporal Descriptor for anomaly detection.
Figure 1.
Architecture of the proposed deep learning with the HOME-FAST (Histogram of Orientation, Magnitude, and Entropy with Fast Accelerated Segment Test) Spatiotemporal Descriptor for anomaly detection.

Figure 2.
Illustration outlines for the Peds1 datasets. Inconsistent occasions are featured by boxes. (a) Original image; (b) background subtraction frame; (c) abnormal event detected frame; and (d) three-dimensional (3D) plot representation.
Figure 2.
Illustration outlines for the Peds1 datasets. Inconsistent occasions are featured by boxes. (a) Original image; (b) background subtraction frame; (c) abnormal event detected frame; and (d) three-dimensional (3D) plot representation.

Figure 3.
Illustration outlines for the Peds2 datasets. Inconsistent occasions are featured by boxes. (a) Original image; (b) background subtraction frame; (c) abnormal event detected frame; and (d) 3D plot representation.
Figure 3.
Illustration outlines for the Peds2 datasets. Inconsistent occasions are featured by boxes. (a) Original image; (b) background subtraction frame; (c) abnormal event detected frame; and (d) 3D plot representation.

Figure 4.
Illustration outlines for the Avenue datasets. Inconsistent occasions are featured by boxes. (a) Original image; (b) background subtraction frame; (c) abnormal event detected frame; and (d) 3D plot representation.
Figure 4.
Illustration outlines for the Avenue datasets. Inconsistent occasions are featured by boxes. (a) Original image; (b) background subtraction frame; (c) abnormal event detected frame; and (d) 3D plot representation.

Figure 5.
Illustration outlines for the LV datasets. Inconsistent occasions are featured by boxes. (a) Original image; (b) background subtraction frame; (c) abnormal event detected frame; and (d) 3D plot representation.
Figure 5.
Illustration outlines for the LV datasets. Inconsistent occasions are featured by boxes. (a) Original image; (b) background subtraction frame; (c) abnormal event detected frame; and (d) 3D plot representation.

Figure 6.
The LV dataset Receiver Operating Characteristics (ROC) curve.

Figure 7.
The UCSD Peds1 dataset ROC curve.

Figure 8.
The UCSD Peds2 dataset ROC curve.

Figure 9.
The Avenue dataset ROC curve.

Figure 10.
Confusion matrix for the deep learning in terms of EER.


Table 1.
HOME-FAST algorithm.
| Algorithm 1: HOME-FAST Feature Descriptor |
| 1: Procedure HOME-FAST |
| 2: is the cuboid I at time t |
| 3: for every cuboid do |
| 4. KLT feature tracker to extract the optical flow |
| Information |
| 5. q: Magnitude (M) [22] |
| 6. o: Orientation (R) [22] |
| 7. e: Entropy (E) [33] |
| 8. i: interest points (I) [21] |
| (Interest points are calculated using FAST) |
| 9. F [q,o,e,i] = His [q,o,e,i] + 1 |
| 10: return |
Table 2.
Layers and their convolutional neural network (CNN) specification.
| Layers | Specification |
|---|---|
| Convolutional (Conv.) 1a | 64 (filters: 3 × 3 × 3 and stride: 1 × 1 × 1) |
| Pooling 1 | 1 × 2 × 1 |
| Conv. 2a | 128 (filters: 3 × 3 × 3 and stride: 1 × 1 × 1) |
| Pooling 2 | 2 × 2 × 2 |
| Conv. 3a | 256 (filters: 3 × 3 × 3 and stride: 1 × 1 × 1) |
| Conv. 3b | 256 (filters: 3 × 3 × 3 and stride: 1 × 1 × 1) |
| Pooling 3 | 2 × 2 × 2 |
| Conv. 4a | 512 (filters: 3 × 3 × 3 and stride: 1 × 1 × 1) |
| Conv. 4b | 512 (filters: 3 × 3 × 3 and stride: 1 × 1 × 1) |
| Conv. 5b | 512 (filters: 3 × 3 × 3 and stride: 1 × 1 × 1) |
| Pooling 5 | 2 × 2 × 2 |
| Fully Connected (FC) | 4096 |
| FC | 4096 |
| Soft-max | Output |
Table 3.
EER and frame processing times for the proposed approach.
| Dataset | EER % | Frame Processing Time |
|---|---|---|
| UCSD (Peds1) | 14.82 | 5.8 ms |
| UCSD (Peds2) | 11.1 | 5.4 ms |
| Avenue | 7.4 | 4.2 ms |
| LV | 14.6 | 5.3 ms |
Table 4.
Anomaly detection EER results of HOME-FAST.
| Approach | Peds1 EER (%) | Peds2 EER (%) |
|---|---|---|
| Leyva et al. [21] | 21.15 | 19.2 |
| Feng et al. [24] | 15.1 | - |
| Biswas and Gupta [39] | 18 | 8 |
| Revathi and Kumar [40] | 0.75 | 18 |
| Rabiee et al. [42] | 21.3 | 49 |
| Proposed | 14.82 | 11.1 |
Table 5.
Comparison between deep learning-based HOME-FAST and the state-of-the-art techniques.
| Approach | Peds1 EER (%) | Peds2 EER (%) |
|---|---|---|
| HOG3D [43] | 50.0 | 47.7 |
| HOOF [44] | 36.4 | 25.9 |
| MBH [45] | 43.4 | 45.0 |
| MDT-temporal [9] | 25.4 | 25.9 |
| HOFM [47] | 33.3 | 20.7 |
| HOFME [46] | 33.1 | 20.0 |
| Proposed | 14.82 | 11.1 |
Table 6.
Comparison of computational time during testing for the proposed approach and the state-of-the-art techniques.
Table 6.
Comparison of computational time during testing for the proposed approach and the state-of-the-art techniques.
| Method | Platform | Central Processing Unit (CPU) | Graphics Processing Unit (GPU) | Memory | Running time (Milliseconds per Frame) | |
|---|---|---|---|---|---|---|
| UCSD Peds1 | UCSD Peds2 | |||||
| Mahadevan et al. [48] | - | 3.0 GHz | - | 2.0 GB | 25 | - |
| Cong et al. [35] | MATLAB | 2.6 GHz | - | 2.0 GB | 3.8 | - |
| Lu et al. [49] | MATLAB | 3.4 GHz | - | 8.0 GB | 0.00697 | - |
| Xu et al. [50] | MATLAB | 2.1 GHz | Nvidia Quadro K4000 | 32 GB | 5.2 | 7.5 |
| Proposed | MATLAB | 3.4 GHz | - | 8.0 GB | 5.8 | 5.4 |
© 2018 by the authors. Licensee MDPI, Basel, Switzerland. This article is an open access article distributed under the terms and conditions of the Creative Commons Attribution (CC BY) license (http://creativecommons.org/licenses/by/4.0/).
Share and Cite
MDPI and ACS Style
Gunale, K.G.; Mukherji, P. Deep Learning with a Spatiotemporal Descriptor of Appearance and Motion Estimation for Video Anomaly Detection. J. Imaging 2018, 4, 79. https://doi.org/10.3390/jimaging4060079
AMA Style
Gunale KG, Mukherji P. Deep Learning with a Spatiotemporal Descriptor of Appearance and Motion Estimation for Video Anomaly Detection. Journal of Imaging. 2018; 4(6):79. https://doi.org/10.3390/jimaging4060079
Chicago/Turabian StyleGunale, Kishanprasad G., and Prachi Mukherji. 2018. "Deep Learning with a Spatiotemporal Descriptor of Appearance and Motion Estimation for Video Anomaly Detection" Journal of Imaging 4, no. 6: 79. https://doi.org/10.3390/jimaging4060079
Note that from the first issue of 2016, this journal uses article numbers instead of page numbers. See further details here.