1. Introduction
Museum visits are by now perceived as an opportunity for individuals to explore and make up their own minds, and to test their own interpretations instead of the experts’; they have become a tool of entertainment like theaters or cinemas. Throughout time, museums and art galleries have preserved our important Cultural Heritage (CH) and served as important sources of education and learning. Moreover, visitors are increasingly taking an active role within museums. The visitor experience is not adequately described by understanding the content, the design of exhibitions, or even by understanding visit frequency or the social arrangements in which people enter the museum. To get a more complete answer to the questions of why people do or do not visit museums, what they do there, and what learning/meaning they derive from the experience, researchers’ efforts have been aimed at better describing and understanding the museum visitors’ experience.
In addition, nowadays museums have a unique perspective on technology’s impact. A modern approach to the fruition of art is actually based on a wide and targeted use of technologies [
1,
2] and a growing number of museums are adopting digital tools as an integral part of the exhibition, providing users new instruments to study art deeply [
3,
4]. Among others, the increasing technical capabilities of Augmented Reality (AR) have raised audience expectations, advancing the use of mobile AR in CH settings [
5]. At the same time, the attention regarding the use of AR has shifted from purely attracting and entertaining audiences, to finding proper ways of providing contextually relevant information that can enhance visitors’ experiences. The visualization of digital contents through a display is allowed with the same point of view of the user, by superimposing virtual objects on the real scene. As well, AR permits the visualization of virtual objects (e.g., 3D models, audio, text, images) avoiding the use of artifacts (i.e., QR code) to retrieve contents, besides permitting an automatic and interactive visualization of Points of Interest (POIs) [
6]. This might positively influence visitors’ experience in front of a painting, hence increasing museum appeal. However, a current practice for the development of AR painting applications is to choose the contents with the advice of historians, without taking into account the user’s preferences. Although the validation of the conveyed contents must be entrusted on the validation of experts, it might be positive to introduce on the development pipeline the user’s feedback, using a more objective data-driven approach. For this reason, in a previous work [
7] we have performed a preliminary study to evaluate if the definition of a protocol to understand the visual behaviour of subjects looking at paintings might help to improve and optimize an existing AR application. The study presented in [
7] gives the basic logic for the visual behaviour and eye-tracking and has been used as the motivation for the analysis conducted in this work, which will be better explained later. Interested readers can find a detailed description of the application in [
5,
8]. In fact, eye tracking is a methodology whereby the position of the eye is used to determine gaze direction of a person at a given time and also the sequence in which they have been moved [
9]. Eye-movement data consist of eye fixations and saccades. The first are brief moments in which the eye is still and information is extracted from the stimulus (about two to four times per second). The saccades, instead, are rapid jumps of the eye between fixations to redirect the line of sight to a new location [
10].
Eye gaze data have been used in many fields such as psychology, neurology, ophthalmology and related areas to study oculomotor characteristics and abnormalities, and their relation to mental states and cognition, because of their relation with internal brain processes (thinking, cognition, etc.). In many research fields, eye-tracking devices are used for analysing user behaviour [
11], such as in market research [
12], human-computer interaction [
9] and visualization research [
13]. Due to the wide fields of eye-tracking applications and the types of research questions, different approaches have been developed to analyze eye-tracking data such as statistical algorithms (either descriptive or inferential) [
14,
15], string editing algorithms [
16], visualization-related techniques, and visual analytics techniques [
17], and finally also data-driven approaches [
18,
19]. Eye-tracking can be used to determine which objects in a visual scene a person is interested in, and thus might like to have annotated in their augmented reality view. The use of such technology can be definitively considered as a turnkey to address users’ needs and expectations (even for different kinds of users), to assess the intrinsic value of CH resources and to collect usage statistics by the users.
In line with the above-mentioned research issues, the main goal of this paper is to provide a truly predictive model of the museum visitors’ visual behaviour; eye-tracking is used because it can provide quantifiable learning outcomes and a rich contextual customized learning environment as well as contents for each single individual. An Hidden Markov Model (HMM) approach is presented, developed to predict users’ attention, in front of a painting, measured by an eye tracker. Therefore, most visited areas of interest (AOI) are used to predict the next transitions between AOIs. Besides the innovative nature of the model, the work even provides a user’s behaviour comparison between adults and children, expanding the results to different kinds of users. Moreover, we design an HMM for tackling two issues: (a) modeling and learning complex behaviours from human eye trajectories; (b) recognizing the behaviors from new trajectories. To build robust and scalable behaviour recognition systems, it is crucial to model not only the natural hierarchical decomposition in the movement trajectories, but also the inherent shared structure embedded in the hierarchy.
The application of this approach yields good results in terms of precision, recall and F1-score and demonstrates its effectiveness.
Several contributions are made by this research, briefly outlined in the following. First of all, the model is generic, so it can be applied to any sequential datasets or sensor types. Second, our model deals with the problem of scalability. Finally, our approach is validated using real data gathered from eye-tracking acquisitions which helps to make our results more accurate and our experiments repeatable. The innovative aspects of this paper lie in proposing an adequate HMM structure and also the use of eye trajectories to estimate the probability that a certain AOI transition will be performed. This model could be a representation of the attention scheme that can be incorporated in the AR applications to have a transition probability or to guide the user on a novel AR interaction scheme. In fact, the tests are performed on two classes of users (adults and children), thus proving a reliable approach to eye trajectories.
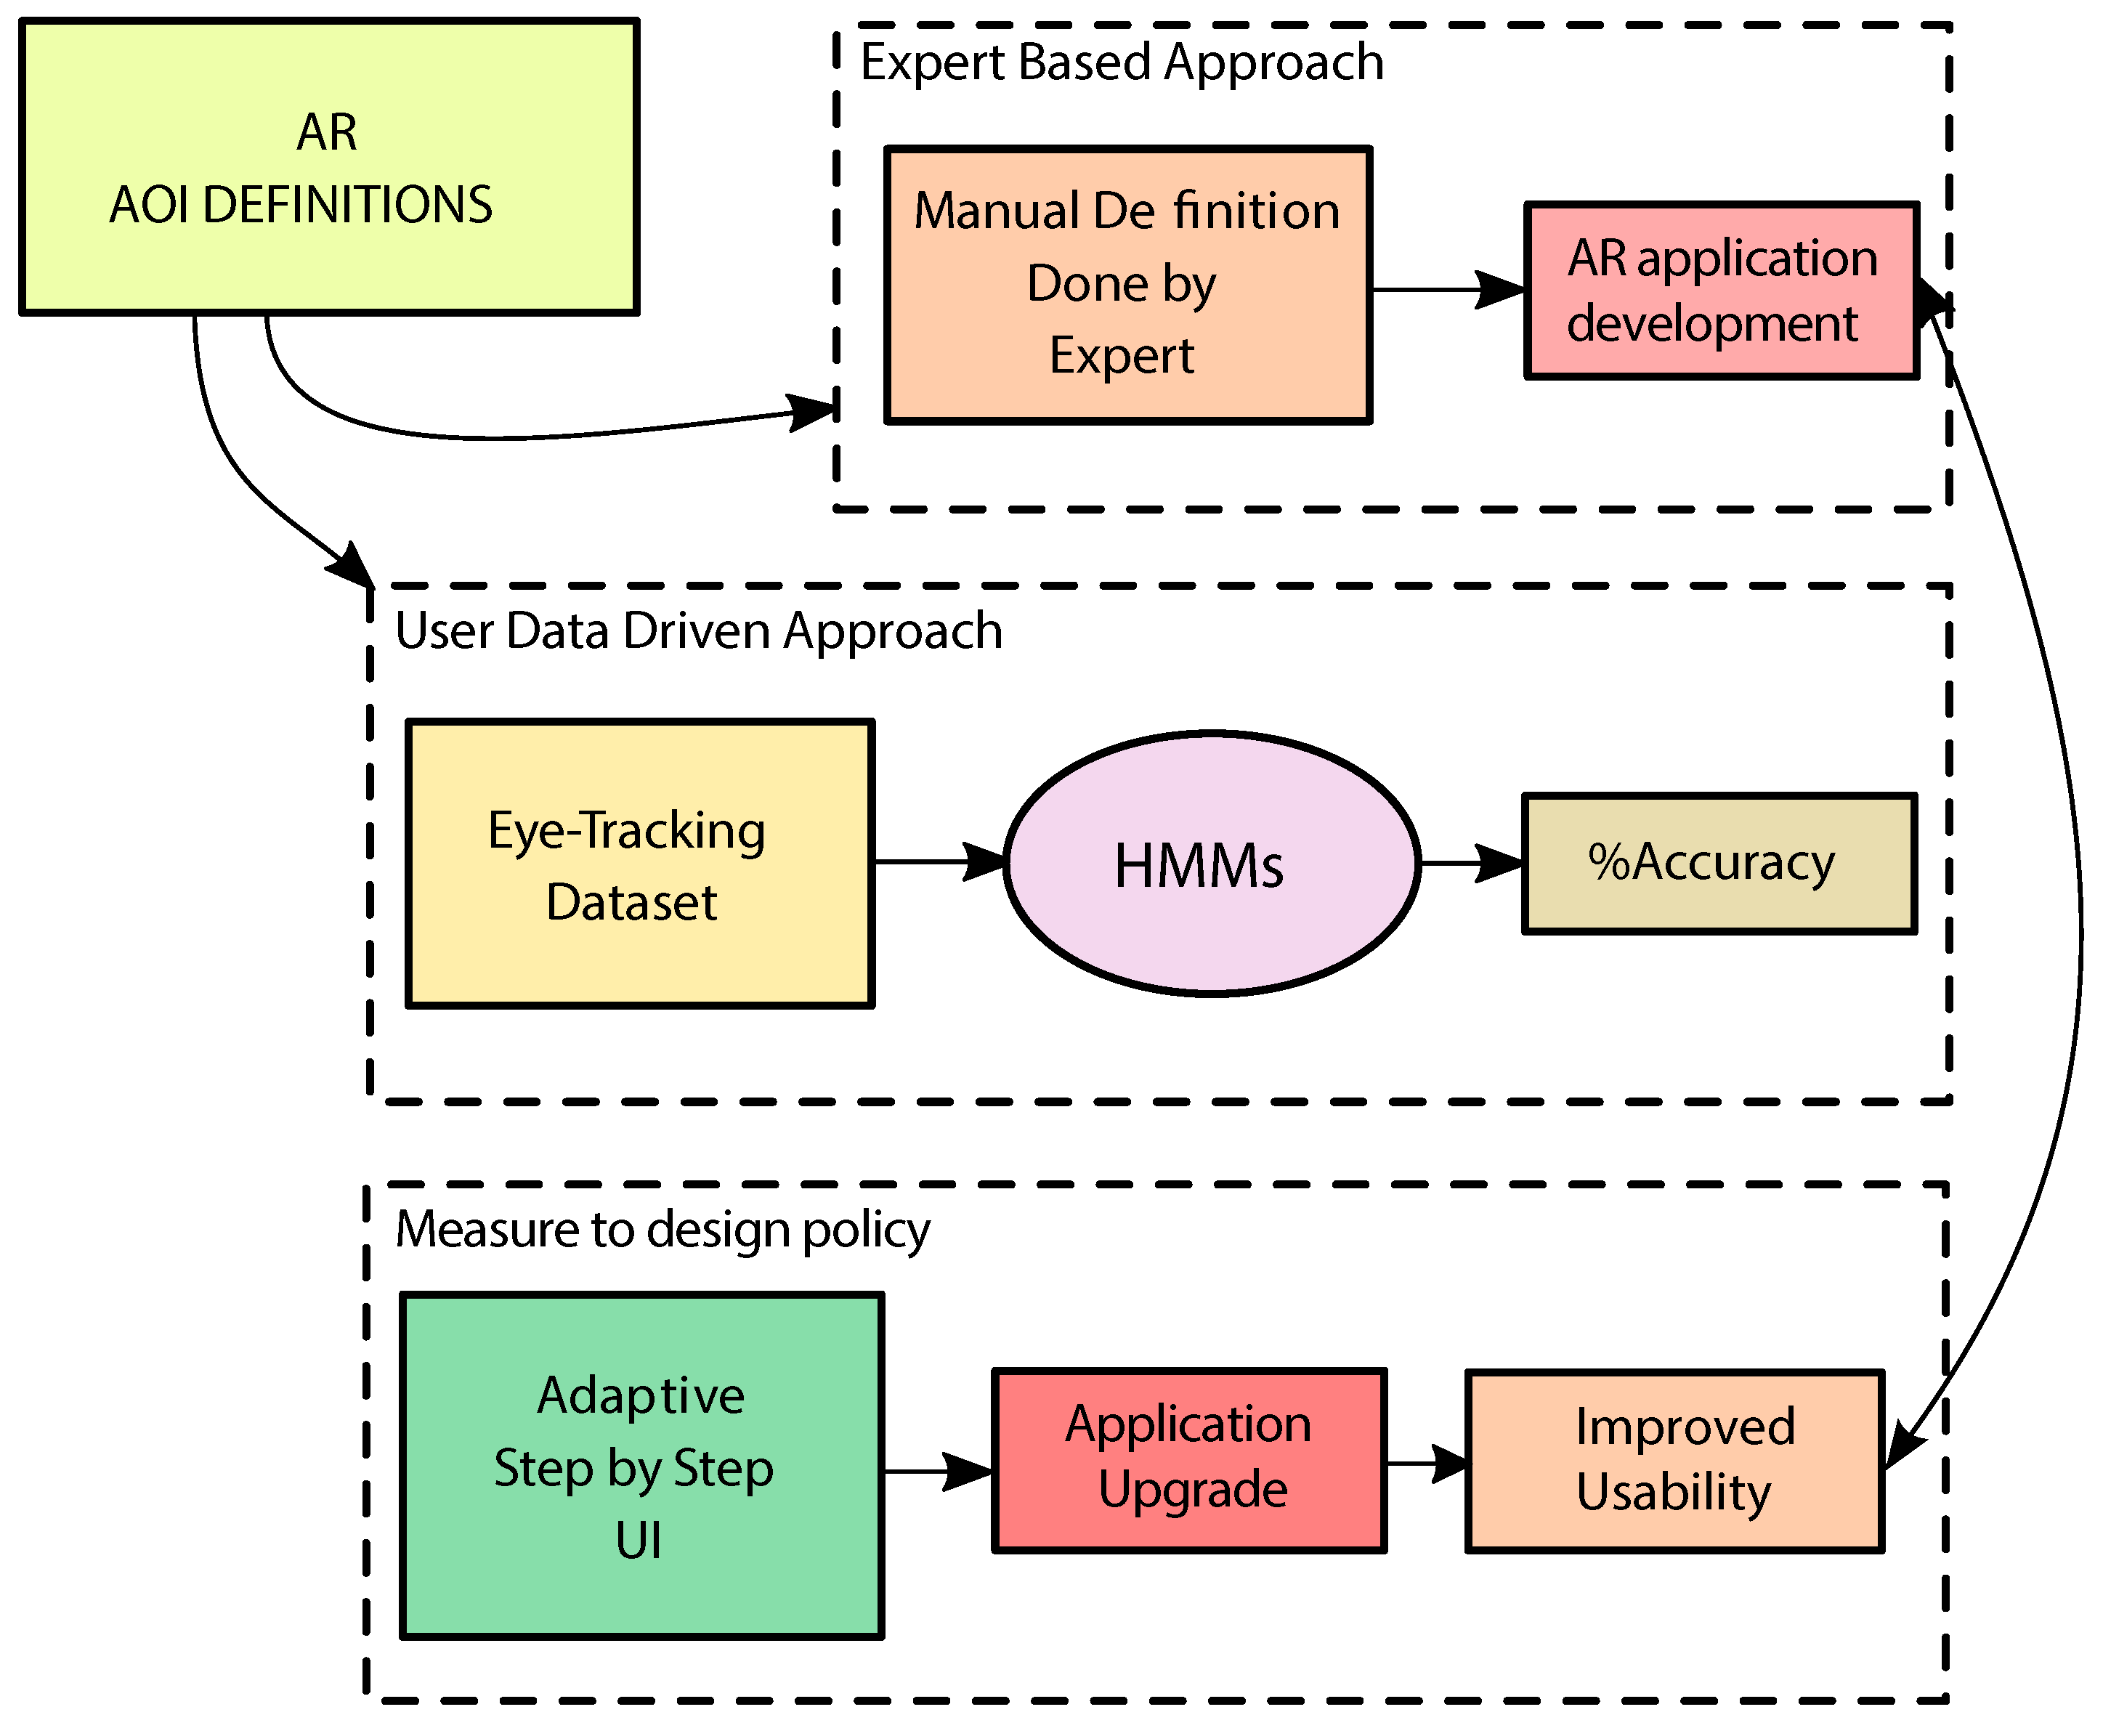
Figure 1 summarizes and compares our approach with a classical approach. After the definition of AOI, the approaches could be: Expert Based or User Data-Driven. In the first one, there is a manual AOI definition done by an expert, then the usability of AR applications is evaluated. In the User Data driven Approach, which is the one proposed in this paper, an eye-tracking dataset is built and a HMMs are designed with the aim of estimating the AOIs transition probability. The accuracy is estimated and these models help the user step by step, with voice guidance, in the painting vision. The study paves the way towards the development of AR applications based on a ”measure to design” policy, providing a method for a more aware app optimization. In fact, the first version of the application has been strongly updated thanks to the results of this research, and it has been expanded to other paintings.
The remainder of the paper is organized as follows:
Section 2 gives an overview of the latest achievements about the analysis of users’ behaviour and predictive models, specifically for CH-related applications; Section (
Section 3) describes the collection of the data acquired; the following
Section 4 describes in detail the problem formulation for the design of the HMM structure and the model that is the core of our work; the final sections present the experimental results (
Section 5). The conclusion, final remarks and future perspectives are reported in
Section 6.
2. Related Work
Eye-tracking has become a method to analyse user behaviour in human-computer interaction, neuroscience, marketing, and visualization research. Eye-trackers have been used to select objects on the screen or in a virtual environment, to provide users’ attentional information [
20]. In recent years, this technology has been applied for the art content evaluation. In [
21], the authors describe statistical regularities in artwork that appear related to low-level processing strategies in human vision, especially for the processing of natural scenes and the variations in these statistics. Quiroga et al. in [
22] have found that people look at art depending on the subject’s interest and their own artistic appreciation. This is done by describing the pattern of fixations of subjects looking at figurative and abstract paintings from different artists and at modified versions and several aspects of these art pieces were changed with digital manipulations. The aim of investigating the influence of bottom-up and top-down processes on the visual behaviour of subjects, while they observe representational paintings is pursued in [
23]. Another example of bottom-up and top-down processes was explored in [
24], where the eye tracking behaviour of adults and children was studied while they looked at five Van Gogh paintings. Bottom-up processes were quantified by determining a salience map for each painting, while for the top-down processing, the participants were allowed to firstly view the painting freely with the background information provided and then they were allowed a second view. Bottom-up factors were indicated as a strong role in children, while in adults the observed patterns were similar in both phases. In [
25] eye movement was analysed by the simple model, a spatio-temporal point process model, to compare the eye movements of experienced and inexperienced art viewers. However, the model developed in this paper is not good enough for studying the complete dynamics of the fixation process, since it does not capture how the fixation process is changing in time.
Due to the wide application fields of eye-tracking, several approaches have been developed to analyse eye-tracking data such as statistical algorithms (either inferential or descriptive) [
14], string editing algorithms [
15,
16], visualization related techniques, and visual analytics techniques [
17].
The application of learning methods for content-based curation and dissemination of CH data offers unique advantages for physical sites that are at risk of damage. Innovative techniques from computing, computer vision, image and natural language processing to analyse images and enable semantic are used in this context. Outputs can be multimedia and automated reports of the state of repair of cultural artifacts as well as real-time, elucidating comments for site visitors. Pattern Recognition approaches that include machine learning and statistical classification are applied with the aim of assisting preservation endeavours. They incorporate multimodal data analysis, and content-based augmented data retrieval. The suitability of machine learning and semantic technologies for the documentation of CH is demonstrated in [
26].
The artistic content of historical manuscripts is challenging in terms of automatic text extraction, picture segmentation and retrieval by similarity. Grana et al. have addressed the problem of automatic extraction of meaningful pictures, distinguishing them from handwritten text and floral and abstract decorations [
27]. They have proposed a solution that first employed a circular statistics description of a directional histogram in order to extract text. Then visual descriptors were computed over the pictorial regions of the page: the semantic content was distinguished from the decorative parts using color histograms and a texture feature called Gradient Spatial Dependency Matrix. The feature vectors were processed using an embedding procedure which allows increased performance in later SVM classification.
In [
28], the authors have addressed the problem of identifying artistic styles in paintings, and have suggested a compact binary representation of the paintings. They have tried to recognize the style of paintings using features extracted from a deep network. The features suggested in the paper have shown excellent classification results on a large scale collection of paintings.
In recent years, the HMMs became popular from visual processing psychology that differentiated between the overt and covert attention [
29]. HMMs have been successfully applied also for speech recognition, handwritten character recognition and gesture recognition for interpreting sign language [
30,
31]. HMMs provide a probabilistic framework for modelling a time series of multivariate observations. These models give a stochastic solution that can be used to make decisions on localization, navigation and path-planning [
32]. This Pattern Recognition approach is applied for CH content evaluation.
In [
33], the authors have used telemetry data from Oztoc, an open-ended exploratory tabletop exhibit in which visitors embody the roles of engineers who are tasked with attracting and cataloging newly-discovered aquatic creatures by building working electronic circuits. This data was used to build HMMs to devise an automated scheme of identifying when a visitor is behaving productively or unproductively. Evaluation of HMM was shown to effectively discern when visitors were productively and unproductively engaging with the exhibit. Using a Markov model, they have identified common patterns of visitor movement from unproductive to productive states to shed light on how visitors struggle and the moves they made to overcome these struggles. These findings offer considerable promise for understanding how learners productively and unproductively persevere in open-ended exploratory environments and the potential for developing real-time supports to help facilitators know how and when to best engage with visitors.
In [
34], Li et al. have addressed the learning-based characterization of fine art painting styles. They have compared the painting styles of artists. To profile the style of an artist, a mixture of stochastic models is estimated using training images. The two-dimensional (2D) multi-resolution hidden Markov model (MHMM) was used in the experiment. These models formed an artist’s distinct digital signature. The 2D MHMM analyzed relatively large regions in an image, which in turn makes it more likely to capture properties of the painting strokes. The mixtures of 2D MHMMs established for artists can be further used to classify paintings and compare paintings or artists. They have implemented and tested the system using high-resolution digital photographs of some of China’s most renowned artists.
Ever since the seminal work of Yarbus [
35], several recent studies are using computational methods to infer observers’ characteristics from their eye movements. In [
36], the authors used HMM to infer the visual-task of a viewer given measured eye movement trajectories. They have noted that it frequently happens that Centre of Gaze (COG) does not match the Focus of Attention (FOA). The approach begins by first using the K-means clustering technique to generate a set of regions likely to be task-relevant in an image, and then using the HMM-based method to decode the eye trajectories. With this approach they were able to achieve a prediction accuracy of 59.64%. In [
18], the authors have presented a turnkey method for scanpath modeling and classification. This method relies on variational hidden Markov models (HMMs) and discriminant analysis (DA). They have shown the versatility of their approach with two very different public datasets: the first one with natural scene images and the second with conversational videos. This approach led to an average correct classification rate of 55.9%. However, this approach suffers from several limitations such as that HMMs are dependent on the structure of the visual stimuli, which must contain regions of interest (ROIs) in order for the model to be stable. Another example of an HMM based approach applied for analyzing eye movement data in face recognition was proposed in [
19]. Compared to other methods, the HMM method they proposed demonstrated several advantages: firstly, the method can learn at the same time ROIs for each person and the transitions from one ROI to another, and secondly, using the clustering algorithm VHEM, the HMMs can be grouped into clusters based on their similarities. The findings from this clustering showed the two main strategies that participants demonstrated: holistic (mainly looking at the center of a face) or analytic (dominantly looking at the eyes and mouth of a face).
To infer and describe the user’s next fixation in front of the painting, HMM applied to eye-tracking data is proposed. This provides new answers to predict the next visited area in a painting.
3. Setup and Acquisition
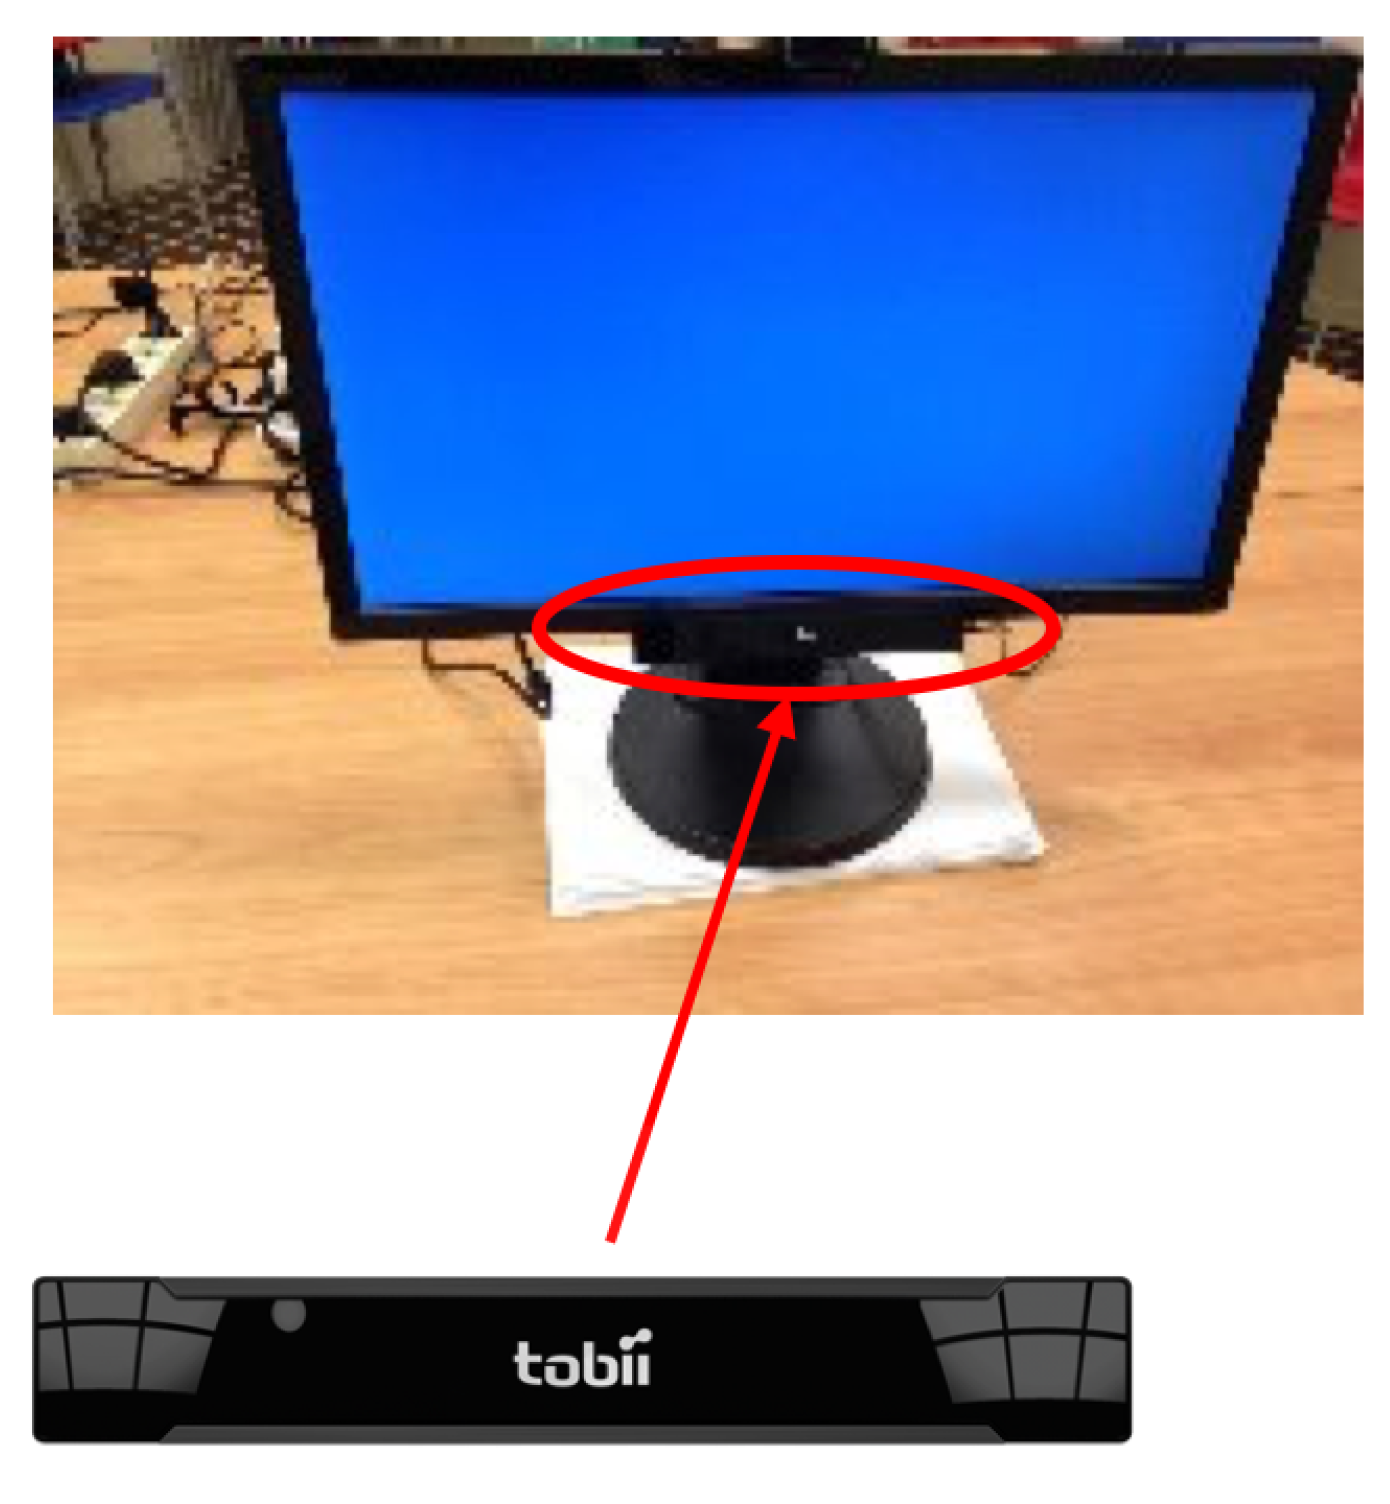
The eye-tracking data are recorded by using a Tobii Eye-Tracker X2-60 (
Figure 2) and the Imotions
® Attention Tool software (vers. 5.7), as described in [
7]. The eye-tracking dataset stores eye tracking data collected from 80 participants to the tests. In particular, the 40 adults taken in exam in this work are Italian students and employees at Universitá Politecnica delle Marche. The 40 children are students of primary school. In both cases, all the acquisitions are collected in a quiet room and under standard illumination conditions. Each participant was seated 60 cm from the eye-tracker and monitor (
Figure 3).
The digital versions of the painting were shown on a 23 inch monitor, at a resolution of
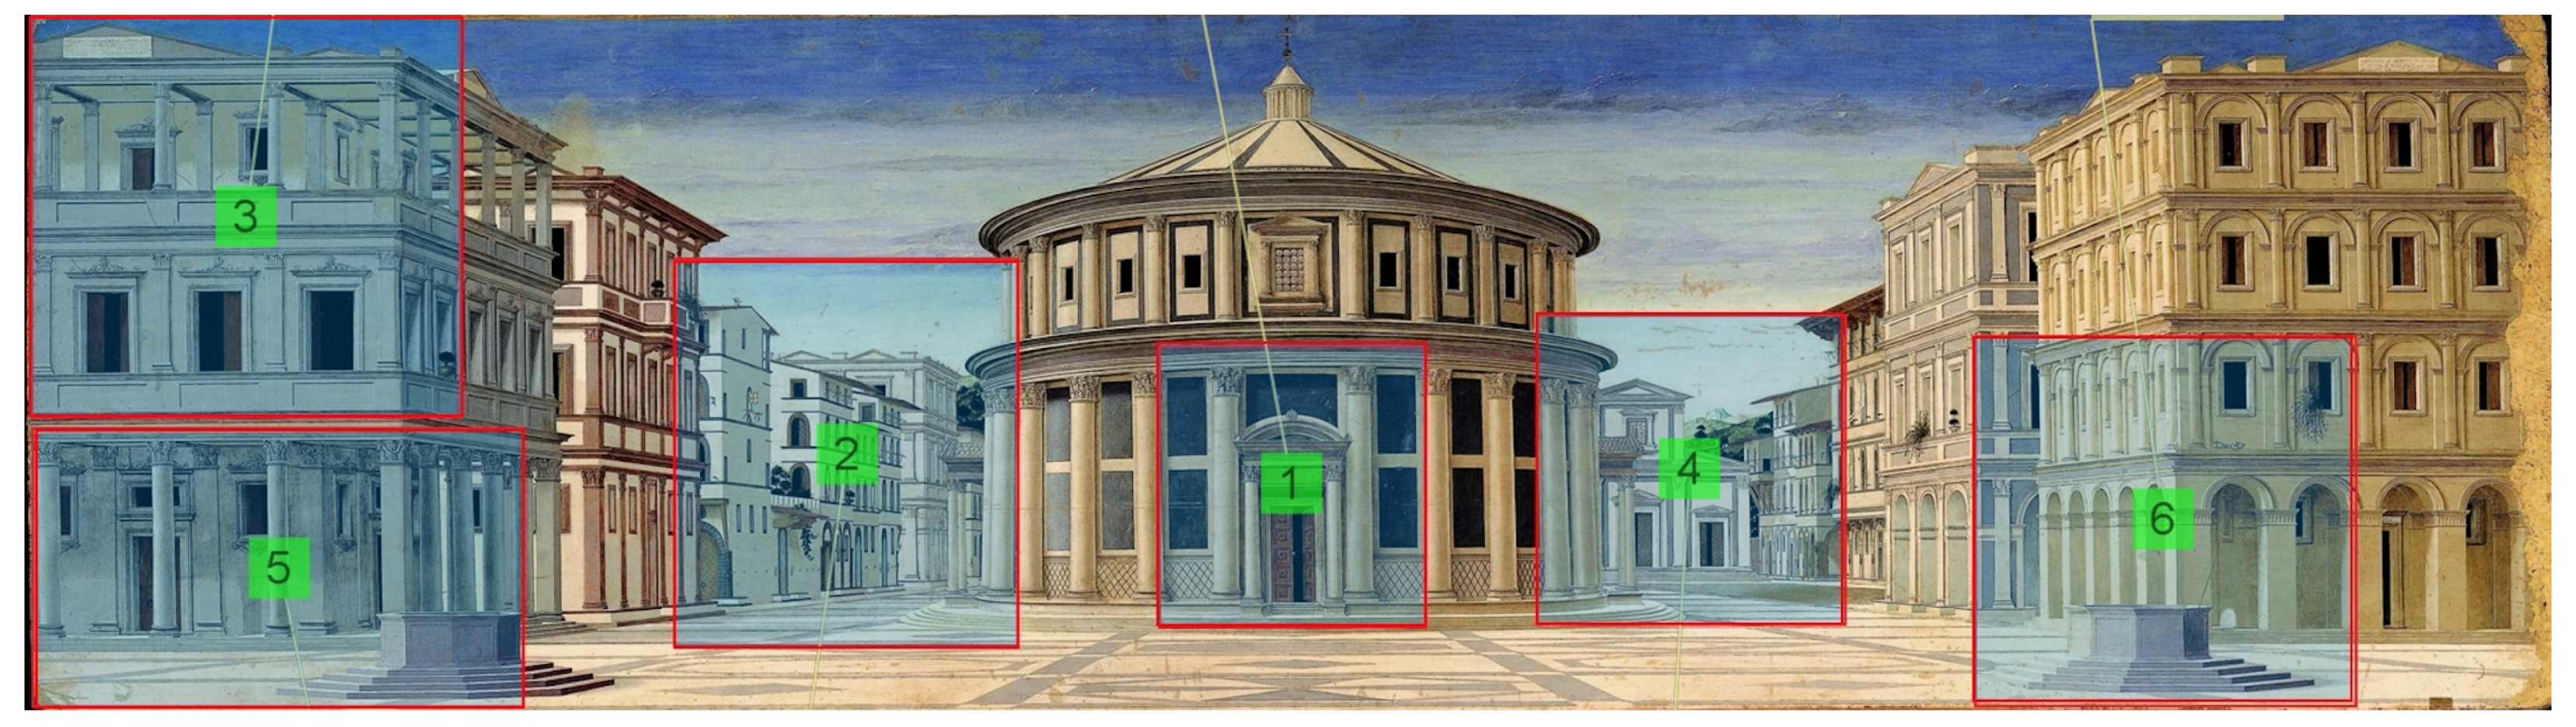
pixels, preserving the original aspect ratio. The eye-movement indicators, on which the analysis is based, are fixations and saccades. Fixations are eye pauses over a particular area of interest averaging about 300 ms. Saccades are rapid eye-movements between fixations. Participants were informed that their eye-movements were recorded. Each trial started with a 9-point calibration pattern, then the study started. In this work, we focus on the eye trajectories collected for the painting “The Ideal City”. The subjects analysed have to observe a faithful reproduction of the picture “The Ideal City” as if they were at the museum. For this test, we used the Eye-Glasses mobile eye-tracker. The average time of observation registered was 64 s. We perform a pre-test, useful for comparing the outcomes between using the digital image and using the real-size artwork. The six-framed details, shown in
Figure 4 were defined according to the existing AR application for “The Ideal City”. They include some architectural details that experts considered relevant in this painting: the doves, the vanishing point; the capitals; the landscape in the background; the floor and the geometry that characterize the whole painting.
Data collected were extracted using the IMotions
® Attention Tool software and they are analysed using STATA vers.13. IMotions
® provides different metrics for each AOI such as the TTFF-F, the Time spent-F,
x and
y (the coordinates of fixation). The TTFF-F represents the time to first fixation or in other words, it identifies which AOI the participants saw at first sight. The Time spent-F provides the time spent in a specific AOI. In general, a low time value of TTFF-F indicates that the participant’s fixation for that particular AOI started immediately as the image appeared on the screen. Instead, a high time value of TTFF-F shows that the fixation has started late or not started. The TTFF-F value is equal to the entire exposure time of the image when the fixation not started.
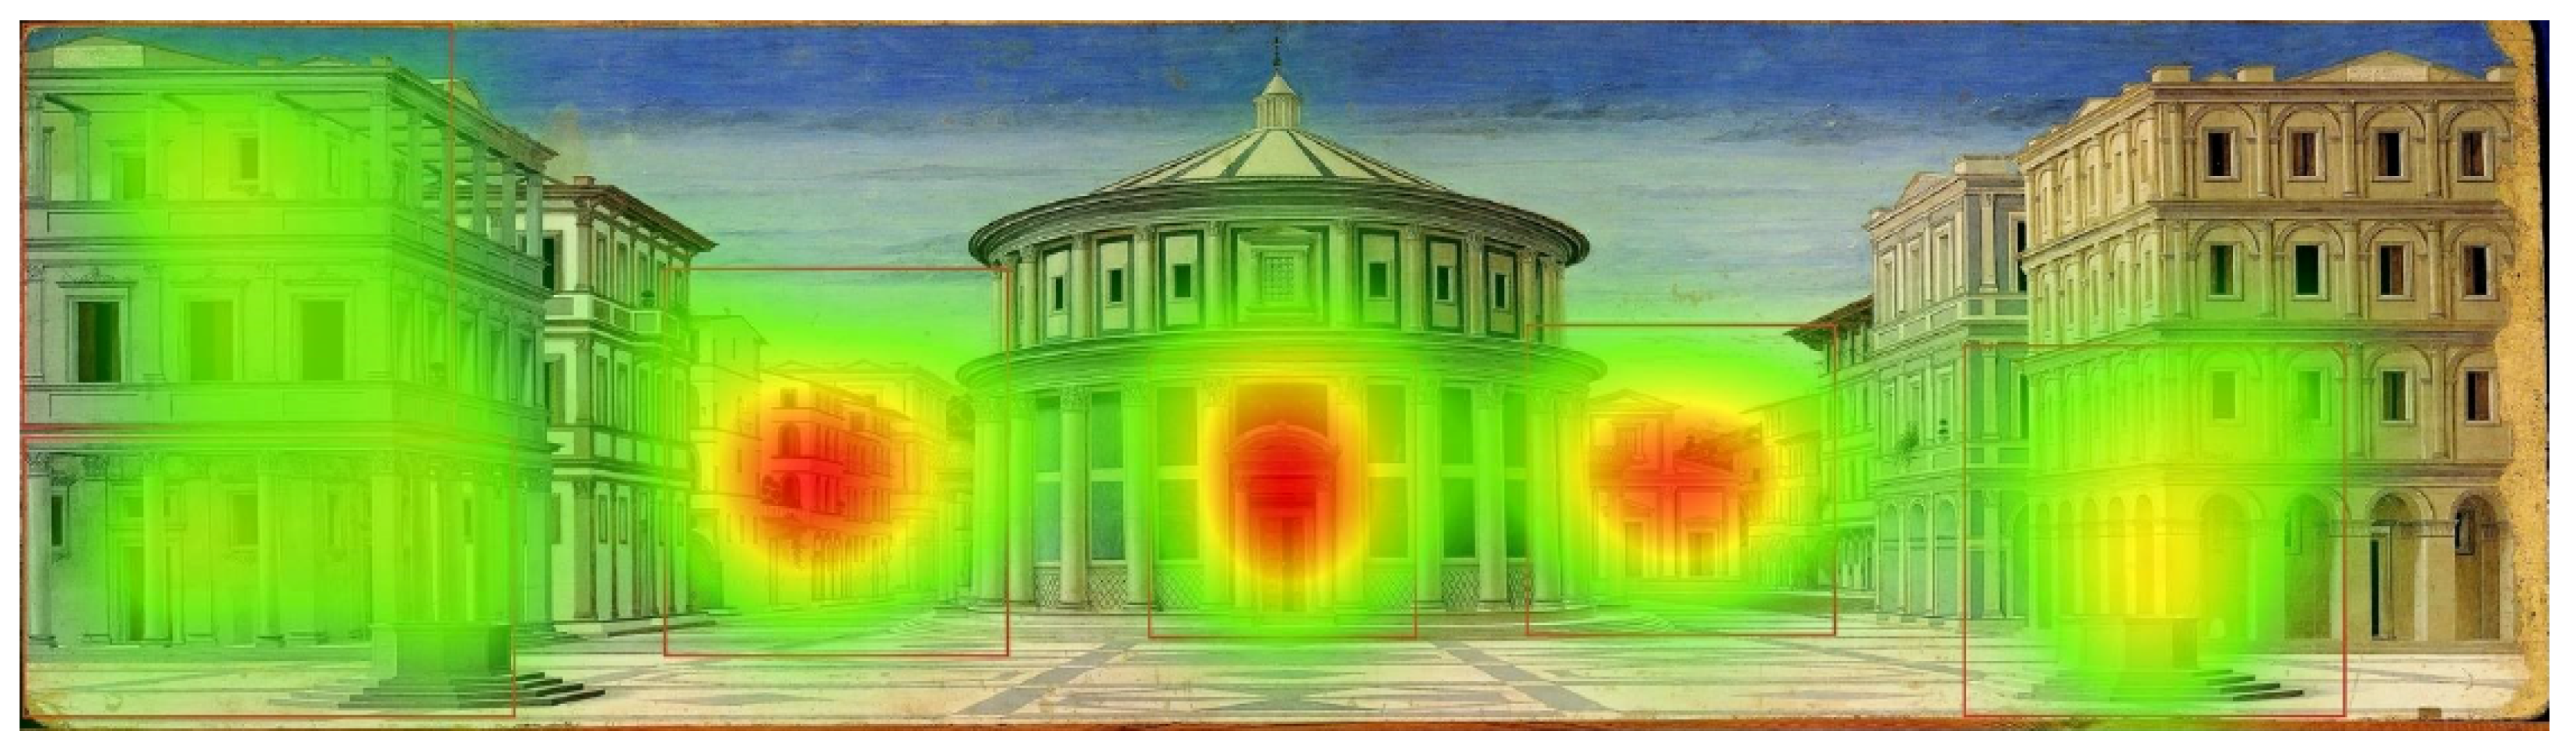
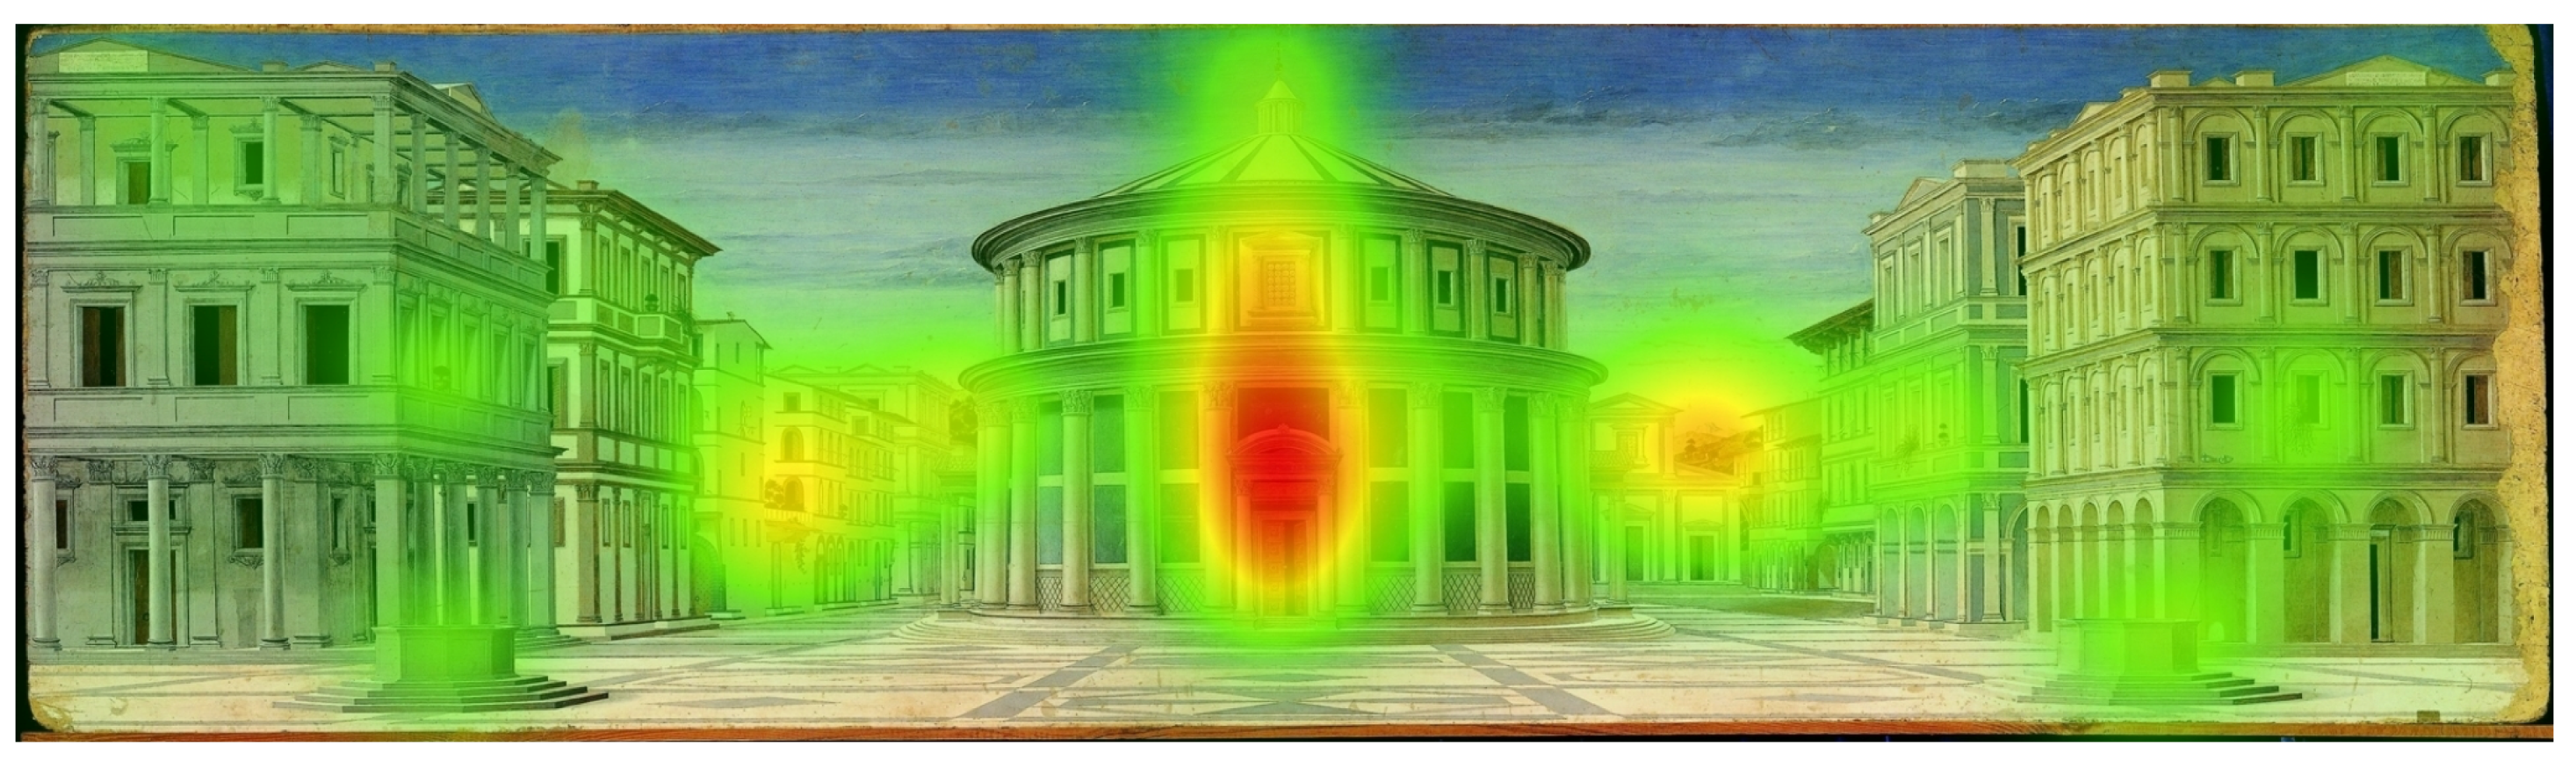
Figure 5 represents the heat map, for the 40 adults participants, when they were asked to observe the painting as they were at the museum.
Figure 5 represents the heat map, for the 40 child participants, when they were asked to observe the painting as they were at the museum. The heat map is a graphical representation of data that uses a system of color-coding to represent different values. In particular, in our case the red colour represents the most attracting area.
4. Design of HMM Structure
Let:
be a discrete finite AOI attraction space and
the observation space of a HMM [
37]. Let
T be the transition matrix of this HMM, with
representing the probability of transitioning from attraction in AOI
to attraction in AOI
, and
be the emission probability of observation
in attraction in AOI
.
We denote the probability that the HMM trajectory follows the attraction sequence
s given the sequence of
n observations, as:
where
is a set of all length
n trajectories whose duration free sequence equals to
s.
Finding the most probable attraction sequence can be seen as a search problem that requires evaluation of probabilities of attraction sequences. The Viterbi algorithm [
38], based on dynamic programming, can be used to efficiently find the most probable trajectory. In fact, it makes use of the Markov property of an HMM (that the next state transition and symbol emission depend only upon the current state) to determine, in linear time with respect to the length of the emission sequence, the most likely path through the states of a model which might have generated a given sequence. A Viterbi-type training algorithm based on the maximum likelihood criterion is also derived.
After training the model, we consider a trajectory
and calculate its probability
for the observation sequence
. Then we classify the trajectory as the one which has the largest posterior probability. To each observation, we have associated the ground truth (state) that is the AOI from which the user was attracted. The observations are the grid cells in which we divided the painting. The number of vertical layers is 10 and this is the same as the horizontal layers used in the quantization step for each HMM.
is a compromise between the observations’ space and the accuracy. In fact, this choice is done after the establishment of a range between the three dimensions x, y and z. The purpose is to limit the matrix of dimensions’ space. Although, the observations’ space would have lost its significance. The standard algorithm for HMM training is the forward-backward, or Baum-Welch algorithm [
39]. Baum-Welch is an iterative algorithm that uses an iterative expectation/maximization process to find an HMM which is a local maximum in its likelihood to have generated a set of training observation sequences. This step is required because the state paths are hidden, and the equations cannot be solved analytically.
In this work, the Baum-Welch algorithm has been employed to estimate a transition probability matrix and an observation emission matrix so that the model best fits the training dataset.
Since the discrete observation density is adopted in HMMs implementation, a Vector Quantization and clustering step is required to map the continuous observation in order to convert continuous data to discrete data. Vector Quantization is a process of mapping vectors of a large vector space to a finite number of regions in that space. The results were obtained using the cross-validation technique.
To evaluate the performance of the algorithms, the following metrics are used [
40]:
Precision: is a function of true positives and examples misclassified as positives (false positives).
Recall: is a function of correctly classified examples (true positives) and misclassified examples (false negatives).
F1-score: is the usual measure that combines precision and recalls through the harmonic mean as a single measure of a test’s accuracy.
The information about actual and predicted classifications done by the system is depicted by confusion matrix [
41] reported for every test case using both transition matrix and a normalized confusion matrix. The use of a confusion matrix can also be insightful for analyzing the results of the model. Confusion matrix is a specific table layout that allows visualization of the performance of an algorithm, where each column of the matrix represents the instances in a predicted class, and each row represents the instances in an actual class. Furthermore, an HMM is defined as
and consists of states,
i, in a finite set
S of size
n, and an
transition matrix:
The transition matrix P is row stochastic, i.e., for all states, i, , and we assume that P is irreducible and aperiodic, i.e., that exists m such that .
5. Experimental Results
In this section, we present the experimental results obtained using our approach. An architecture to implement HMMs eye-tracking trajectories is proposed. The architecture uses the eye-tracking data to classify different AOIs.
Below, the results are given for each AOI in which the examined painting is divided. The main goal is to gradually estimate the AOIs transition probability. We applied a k-fold cross-validation approach (with ) to test our HMM.
Table 1 and
Table 2 reports the results for the adults’ and children’s eye-tracking respectively. The results demonstrate the effectiveness and suitability of our approach with high values of Precision, Recall and F1-score.
From the adults’ classification results, it is possible to infer that the AOIs 1, 2, 4 reach high values of precision, recall and F1-score because they are the AOIs in which the attention is most focused, as shown by the heatmap (
Figure 5 and
Figure 6).
From the children’s classification results, it is possible to infer that the AOIs 1, 4 reach high values of precision, recall and F1-score because are the AOIs in which the attention is most focused, as shown by the corresponding heatmap (
Figure 6).
The resulting confusion matrix for adults is shown in
Figure 7. As we can see in the confusion matrix, the AOIs eye transitions are detected with high accuracy.
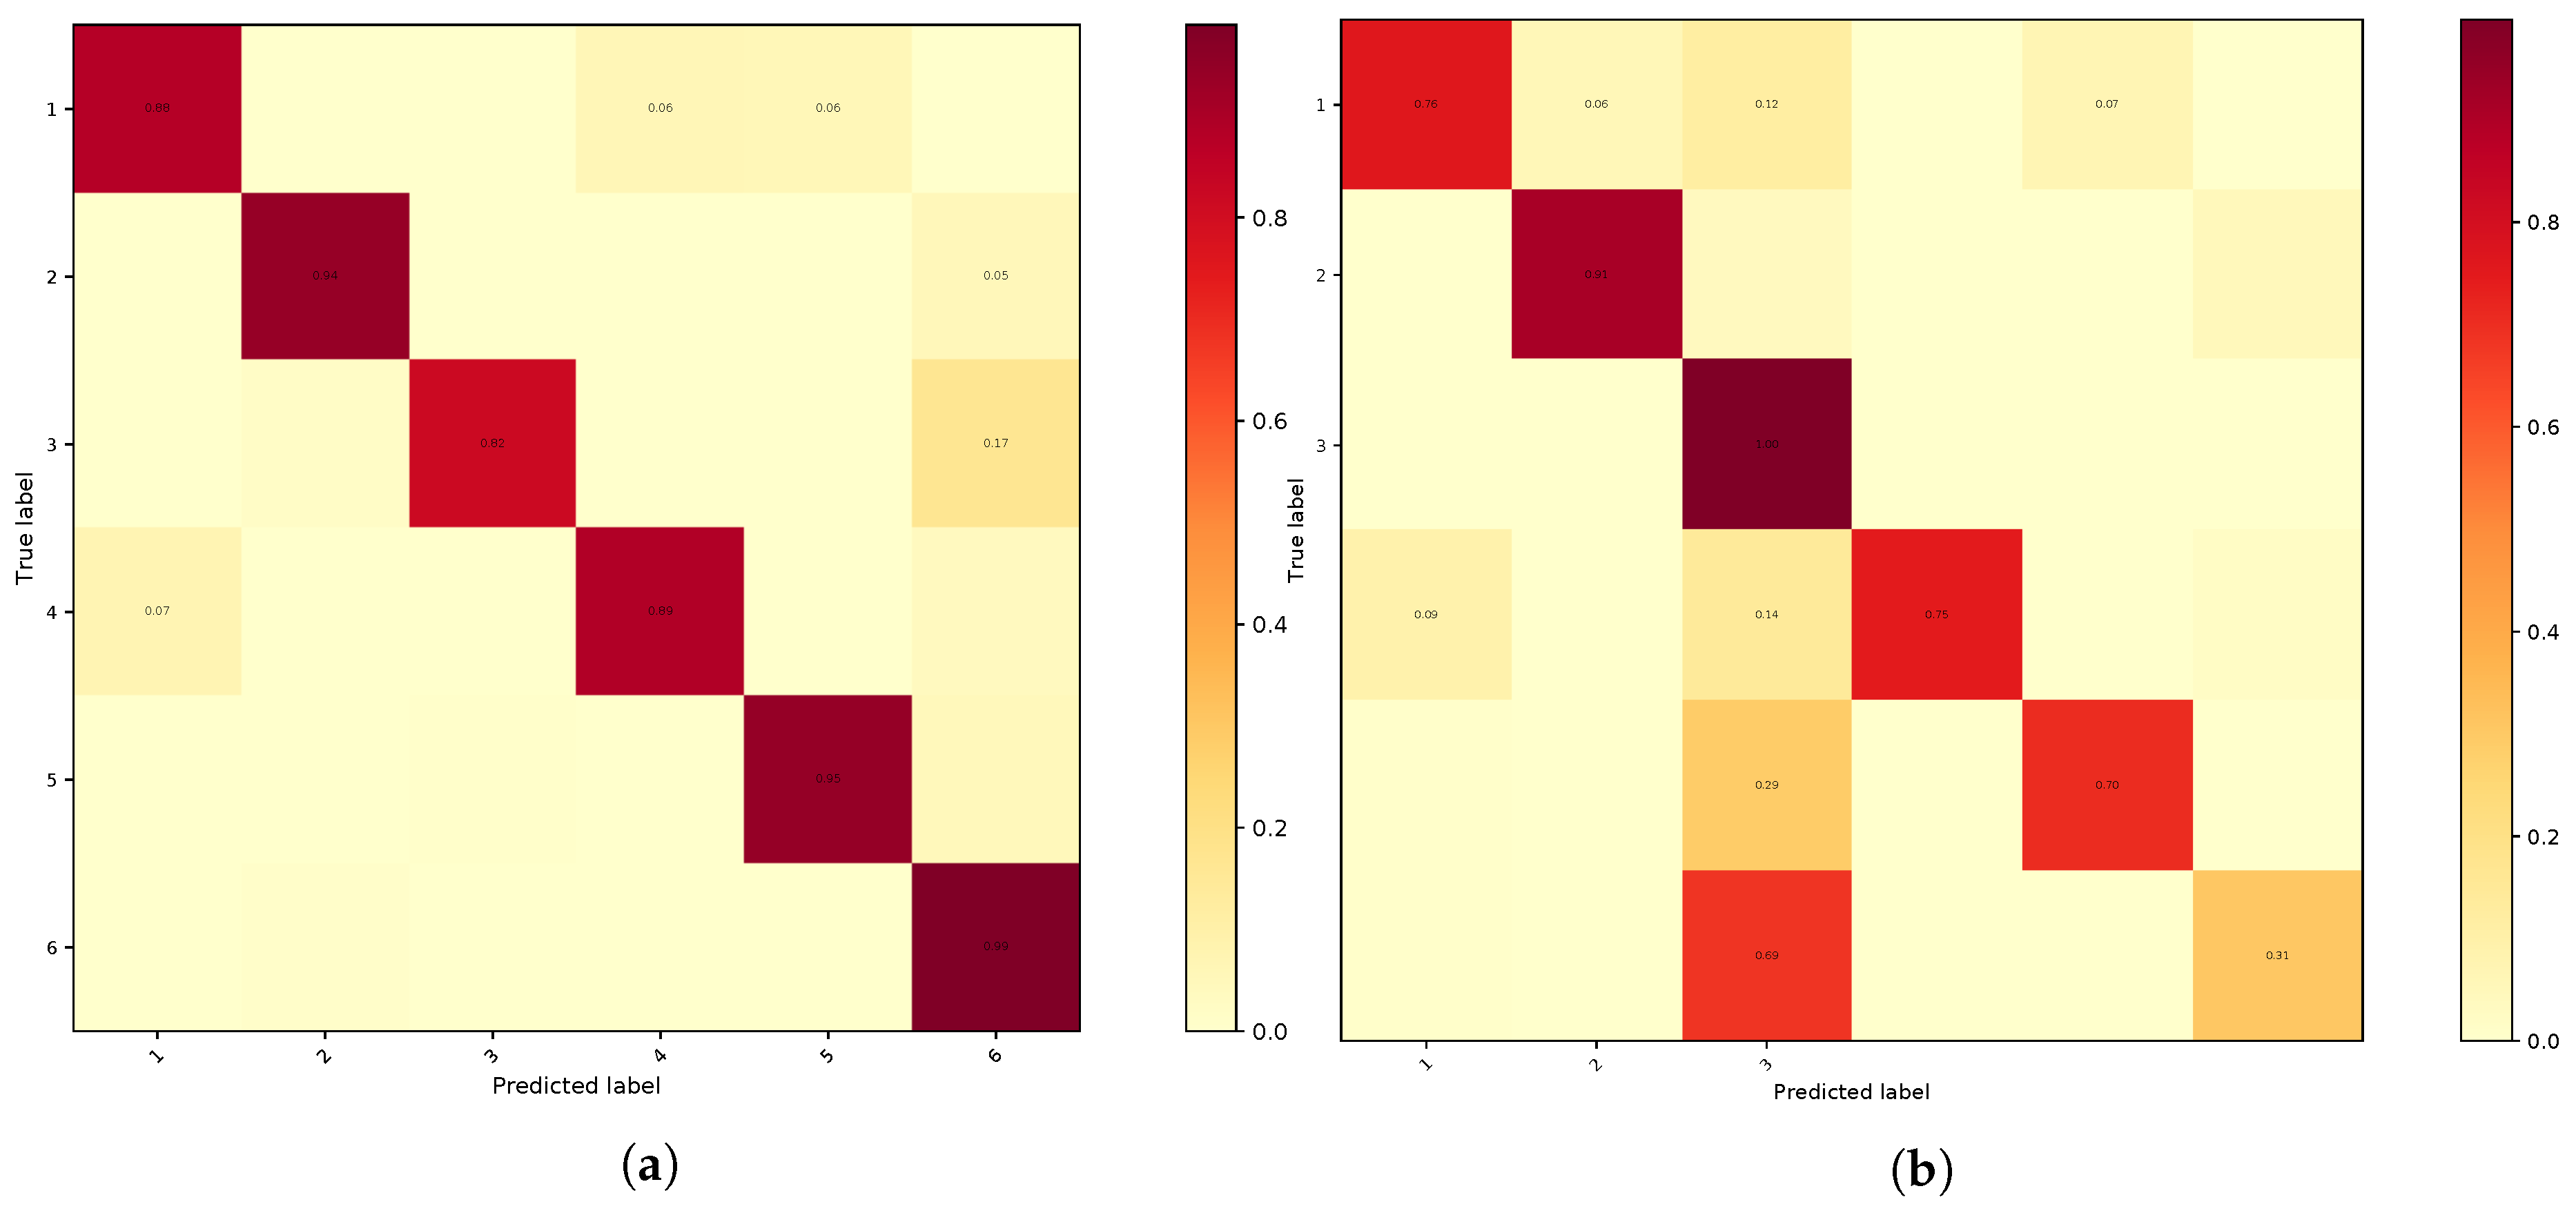
In
Figure 8a, that represents the modelling of the transition matrix of the total recorded period, we can see the matrix representation of the probability of transition from one state to another, whose values range from zero to one. The fact that the probability values along the matrix diagonal are very high means that the probability that in the next instant (K + 1) eyes remains in the same AOI of the previous instant is very high. In other words, it is very likely that once eyes observe certain AOIs, they continue observing those same AOIs also in the next instant. Furthermore, we can see other elements, not along the diagonal, with significant probability values such as the elements (1, 5), (1,6), (5,3) because the user has a high probability to focus his/her attention passing from the center of the painting to the AOI in the corners.
Figure 8b depicts the modelling of the transition matrix of the total recorded period for the children. Even in this case, the fact that the probability values along the matrix diagonal are very high means that the probability that in the next instant (K + 1) eyes remains in the same AOI of the previous instant is very high. It is entirely possible that when children’s eyes observe certain AOIs, they continue observing those same AOIs also in the next instant. Moreover, we can see other elements, not along the diagonal, with significant probability values such as the elements (1,5), (2,1), (4,3) because the user has a high probability of focusing his/her attention passing from the center of the painting to the AOI in the corners.
Experimental results demonstrate that our eye-tracking system provides useful input information to design a personalised user experience in AR applications. In fact, this kind of model will be used as a seed to automatically complete all the information needed to build the AR application. Another interesting piece of information is that there is not a significant difference when a child observes a painting and when an adult observes that same painting. This is an important point for distinguishing the users’ classes.
6. Conclusions
In this paper, we aim for a better understanding of users’ behaviour in front of a painting. For this purpose, eye-tracking technology is adopted. This choice is due to its potential measure of analysing people’s attitudes during visual processing, offering a deeper understanding of possible common patterns of fixations. Eye-tracking could provide quantifiable learning outcomes and rich contextual customized learning environment as well as contents for each single individual. In the painting taken in the exam “The Ideal City”, we can observe that the attention is focused on the central area, because subjects generally are attracted to the area in the painting with the most relevant particular. Results show the affordability of the predictive model of the museum visitor behaviour, based on an HMM to predict the user’s attention. By using the areas of interest (AOI) most visited, we attempted to predict the next transitions between AOIs. The application of this approach yields good results in terms of precision, recall and F1-score and demonstrates its effectiveness. The approach is able to learn a high-level representation of eye trajectories and achieve high precision and recall. The experiments yield high accuracy and demonstrate the effectiveness and suitability of our approach. Some interesting insight can be inferred from this study. Firstly, there is not a significant difference when a child observes painting and an adult observes the same painting. This is an important point for distinguishing the users’ classes, and it deserves further investigation in order to understand if, in other cases, the visual behaviour changes between different categories of users. Moreover, the study proves that conducting eye tracking tests on a diversified sample of users allows to understand users’ preferences, enhancing the development of the AR application for paintings. Finally, the study helped to improve the previously developed application, enhancing its usability and conveying contents in a more efficient way, based on users expectations (
https://itunes.apple.com/it/app/ducale/id1128703560?mt=8).
This work paves the way for further investigations. The aim will be to improve our approach by employing a larger dataset in order to compare different types of behaviour of users. In fact, this research has two goals. One is to illustrate how HMMs can be built using eye-tracking data collected from subjects in front of a painting. The other is the design method to construct a personalised AR application.
Moreover, an important goal is to improve users’ attitude toward mobile advertising. By sensing the user awareness to the system, for instance allowing the application to know what area the user is interested in at the moment with the aid of gaze tracking devices, contents will be provided in a more reliable and proper way. In fact, our model learns from real experiences and updates the probabilities automatically when the function is applied in practice. It is possible to improve our HMM with different sub-user training and test process and a methodology refinement for user-centred HMM training. Similarly, AR users can use their devices to identify which application best fits their profile. The application will search for the most suitable experience by matching the user personal profile with the user’s content plus context information.

 ,
, 


