Article

Retinal Microvasculature Image Analysis Using Optical Coherence Tomography Angiography in Patients with Post-COVID-19 Syndrome

1
Department of Eye Research, Manchester Royal Eye Hospital, Manchester University NHS Foundation Trust, Oxford Road, Manchester M13 9WL, UK
2
Ophtalmologie Département, Centre Hospitalier Universitaire de Toulouse, 31300 Toulouse, France
3
Division of Pharmacy and Optometry, School of Health Sciences, Faculty of Biology, Medicine and Health, The University of Manchester, Oxford Road, Manchester M13 9PL, UK
*
Author to whom correspondence should be addressed.
J. Imaging 2023, 9(11), 234; https://doi.org/10.3390/jimaging9110234
Submission received: 2 September 2023 / Revised: 14 October 2023 / Accepted: 17 October 2023 / Published: 24 October 2023
(This article belongs to the Special Issue Advances in Retinal Image Processing)

Abstract

:
Several optical coherence tomography angiography (OCT-A) studies have demonstrated retinal microvascular changes in patients post-SARS-CoV-2 infection, reflecting retinal-systemic microvasculature homology. Post-COVID-19 syndrome (PCS) entails persistent symptoms following SARS-CoV-2 infection. In this study, we investigated the retinal microvasculature in PCS patients using OCT-angiography and analysed the macular retinal nerve fibre layer (RNFL) and ganglion cell layer (GCL) thickness via spectral domain-OCT (SD-OCT). Conducted at the Manchester Royal Eye Hospital, UK, this cross-sectional study compared 40 PCS participants with 40 healthy controls, who underwent ophthalmic assessments, SD-OCT, and OCT-A imaging. OCT-A images from the superficial capillary plexus (SCP) were analysed using an in-house specialised software, OCT-A vascular image analysis (OCTAVIA), measuring the mean large vessel and capillary intensity, vessel density, ischaemia areas, and foveal avascular zone (FAZ) area and circularity. RNFL and GCL thickness was measured using the OCT machine’s software. Retinal evaluations occurred at an average of 15.2 ± 6.9 months post SARS-CoV-2 infection in PCS participants. Our findings revealed no significant differences between the PCS and control groups in the OCT-A parameters or RNFL and GCL thicknesses, indicating that no long-term damage ensued in the vascular bed or retinal layers within our cohort, providing a degree of reassurance for PCS patients.

1. Introduction

In March of 2020, the severe acute respiratory syndrome coronavirus 2 (SARS-CoV-2) gave rise to a global pandemic, incurring detrimental effects on the health, economy, and social infrastructures of populations worldwide. The effects of the SARS-CoV-2 infection, termed acute coronavirus disease 2019 (COVID-19), range from pneumonia and acute respiratory distress syndrome (ARDS) to thromboembolic disease, septic shock, and multi-organ failure [1]. In the aftermath of the pandemic, a post-viral sequela of SARS-CoV-2 infection emerged, referred to as post-COVID-19 syndrome (PCS) [2] or post-COVID-19 condition [3].
Post COVID-19 syndrome refers to the persistence of certain clinical symptoms more than 12 weeks after the initial COVID-19 infection, which cannot be explained by an alternative diagnosis [4]. Persistence of symptoms 4 or more weeks after the infection may be referred to as post-acute sequelae of SARS-CoV-2 infection (PASC) [5] or ‘Long COVID’. Symptoms of PCS may include but are not limited to fatigue, dyspnoea, cough, autonomic symptoms (chest pain, palpitations, tachycardia), neurocognitive impairment i.e., ‘brain fog’, arthralgia, myalgia, headaches, anosmia, ageusia, gastrointestinal disturbances, sleep disturbances, hair loss, and psychiatric disorders such as depression and anxiety [5]. Immune dysregulation, autoimmunity, dysautonomia, viral persistence, re-activation of latent viral pathogens, neutrophil extracellular traps (NETs), dysregulation of the renin-angiotensin-aldosterone system (RAAS), coagulopathies (hypercoagulation, thrombosis), fibrin amyloid micro-clots, endothelial dysfunction, and impaired microvasculature, are some of the principle pathophysiological mechanisms underpinning post-COVID-19 syndrome described in the literature to date [5,6,7,8,9,10,11,12,13,14,15,16,17,18,19,20,21,22,23,24,25,26,27,28,29,30,31,32,33,34].
Studies have shown that increasing age, female sex, lower socioeconomic status, obesity, presence of co-morbidities, and smoking are associated with an increased risk of development of PCS [35,36,37,38,39,40]. It has been estimated that, globally, approximately 15% of COVID-19 patients experience persistent symptoms at 12 months following acute SARS-CoV-2 infection [41]. In the UK, 3.1% of the population self-reported suffering with long-term symptoms following their initial COVID-19 infection between September 2022 and January 2023 [42]. The worldwide influence of COVID-19 affects not only personal mental and physical well-being, but also social, economic, and productivity-related aspects in the healthcare, finance, and employment sectors. Decreased productivity, the requirement for medical assistance, and the growing need for diagnosis render post COVID-19 syndrome a deserving candidate for investment in the healthcare industry [43]. Therefore, it is important to investigate and research all characteristics of this condition.
SARS-CoV-2 enters cells via the angiotensin-converting enzyme-related carboxypeptidase (ACE2) receptor [44], which is also expressed on the surface of neuroretinal cells including Muller cells, retinal pigment epithelium, and pericytes of retinal and choroidal endothelial cells [45]. Whilst the most common ophthalmic manifestations of acute SARS-CoV-2 infection consist of conditions such as conjunctivitis and anterior uveitis [46,47,48], scleritis, episcleritis, inflammatory orbital diseases (dacryoadenitis, orbital cellulitis, mucormycosis), optic neuritis, papillophlebitis, cranial nerve palsies, choroiditis, retinitis, retinal vasculitis [48,49,50,51], and retinal artery and vein occlusion have also been reported [52]. Retinal examination in patients following COVID-19 infection has demonstrated a wide array of clinical signs ranging from cotton wool spots (CWS), retinal micro- and macro-haemorrhages, and venous tortuosity [51,53,54] indicative of acute vascular events and retinal ischaemia. One of the first studies pertaining to optical coherence tomography (OCT) imaging of the retina in patients with COVID-19 identified hyper-reflective plaques in the ganglion-cell-inner plexiform layer (GC-IPL) [54]. However, subsequent publications attributed this finding to normal variations in the retinal vasculature [55,56]. Increased peri-papillary retinal nerve fibre layer (RNFL) thickness [57,58], increased central macular thickness, and decreased ganglion cell layer and inner nuclear layer thickness have also been reported in patients following COVID-19 infection [59]. Therefore, SARS-CoV-2 infection can induce microstructural changes in the retina, which may persist long-term in patients with post-COVID-19 syndrome. Given that the retina and optic disc are considered to be intraorbital extensions of the central nervous system [60], alterations may prevail especially in those with neurocognitive symptoms.
The eye can be considered as a window into the body’s microvascular system. Optical coherence tomography angiography (OCT-A) offers a non-invasive opportunity to analyse the retinal circulation in vivo, providing insight into the subject’s systemic microvasculature by inference [61]. Several studies have investigated the retinal vasculature of patients infected with COVID-19 using OCT-A to date. A key finding of note is reduction in the macular vessel density from as early as 2 weeks following the infection up to 8 months afterward [62,63,64,65,66,67,68,69,70,71,72,73,74,75].
Considering the overwhelming amount of literature reporting an alteration in the retinal microvasculature in patients with a history of COVID-19 illness, it is pertinent to investigate whether these effects last long term, especially in patients with ongoing symptoms of post-COVID-19-syndrome. Furthermore, there is currently a paucity of literature examining the retinal vasculature of patients with PCS. Therefore, the primary aim of this study is to investigate the retinal microvasculature of patients with post-COVID-19 syndrome using OCT-angiography, in order to determine the long-term sequelae of SARS-CoV-2 infection on retinal tissues. Additionally, using spectral domain-OCT (SD-OCT) the thickness of the macular retinal nerve fibre layer and macular ganglion cell layer will also be examined, to determine if any anatomical alterations coincide with ongoing symptoms of PCS, particularly neurocognitive symptoms.

2. Materials and Methods

This was a prospective, cross-sectional observational study, conducted at the Manchester Royal Eye Hospital (MREH), UK. Ethical approval was obtained from the Health Research Authority (HRA) and Health and Care Research Wales (HCRW) along with the Office for Research Ethics Committees Northern Ireland (ORECNI). The study was conducted with adherence to the Declaration of Helsinki; written informed consent was obtained from all participants.

2.1. Participant Recruitment

Patients were recruited into two distinct groups for this comparative study. The first group comprised of patients over 18 years of age with an established clinical diagnosis of post-COVID-19 syndrome by the respiratory team at Manchester Royal Infirmary, UK. All included subjects either had a reverse transcription-polymerase chain reaction (RT PCR)—confirmed diagnosis of COVID-19 at an earlier stage or a clinical diagnosis of COVID-19 (as testing was not readily available in the early stages of the pandemic in the UK). Patients recruited within the post-COVID-19 syndrome cohort may have an initial mild, moderate, or severe initial illness with or without requirement for hospitalisation or outpatient treatment, allowing us to examine the retinal microvasculature in a wider range of PCS participants.
The second group, the controls, included patients over 18 years of age who did not have a recent history of COVID-19 infection or a diagnosis of post-COVID-19 syndrome. For both groups, we excluded patients with a history of diabetes, uncontrolled hypertension, stroke, haematological disorders, neurodegenerative diseases, high myopia or hypermetropia (above ± 6 dioptres), high astigmatism (>3 dioptres), significant media opacity compromising fundus imaging, or signs or previous history of choroidal atrophy, exudative age-related macular degeneration (AMD), central serous chorioretinopathy, glaucoma, acquired and hereditary optic neuropathy, hereditary retinal diseases, demyelinating disorders, and keratoconus. Both cohorts were age and sex matched. Recruitment commenced in April 2021 and extended to March 2023 due to delays caused by the COVID-19 pandemic.
Clinical history taking, visual acuity measurement, and OCT-A imaging was undertaken for each participant of the study. The clinical history taking comprised of details of the participants’ acute COVID-19 illness, method of acute COVID-19 diagnosis (i.e., clinical or by PCR testing), disease course, ongoing symptoms of post-COVID-19 syndrome, vaccination history, relevant past medical history, smoking history, Body Mass Index (BMI) and HbA1c (if available), past ocular history, and ophthalmic prescription. The best corrected visual acuity was measured using Early Treatment Diabetic Retinopathy Study (ETDRS) charts at four metres, converted to the Logarithm of the Minimum Angle of Resolution (LogMAR).

2.2. OCT Imaging

Each patient then underwent wide-field (10 × 10 mm) macula and foveal (4 × 4 mm) OCT-A imaging using the Canon Xephilio OCTA-1 machine (Canon Medical Systems Europe B.V©, Amstelveen, The Netherlands). The field of investigation was centred on the foveal region. Scans had a 10-layer automated segmentation and a refresh rate of 70,000 A-scans/s. The depth of field of view was set to 10 × 10 mm and 4 × 4 mm with an axial sampling density of 464 × 464 px, with the number of repetitions set at two. For the purposes of this study, only the retinal superficial capillary plexus (SPC), which provided the most consistently high-quality images, was examined. Both eyes were imaged in each participant, however only the highest quality eye image was used for analysis. Inter-eye correlations and statistical complexities highlighted by Murdoch et al. would allow for us to include both eyes into the study, albeit with more complex and less easily recognised and interpreted techniques [76]. In this study however, image quality for accurate OCT-A measures, as noted by Czako et al., was of paramount importance [77]. Notably, we were aware that many PCS participants suffered with dry eyes, fatigue, and dyspnoea, and we opted to include the highest quality imaged eye only for each patient in this study protocol with standard statistical techniques to optimise overall image analysis validity. Lubricants were offered to all patients to mitigate effects of any dry eye disease. Pharmacological mydriasis was attained (tropicamide 1%) in cases where the quality of imaging was affected by lack of pupillary dilatation. The image acquisition technique was regimented, in that all patients were instructed to focus on the cross shape in the OCT-A machine to ensure standardisation of the macular image procured. Stability of the head was ensured, and all images were captured in dim lighting.
A two-fold strategy was employed to evaluate the quality of the images obtained. Initially, the Canon Quality Index from the OCT-A machine was utilised, accepting only images with an index of ≥7. Additionally, imagers with clinical expertise and a senior consultant conducted real-time evaluations of the OCT-A and OCT images to identify significant segmentation errors, and shadow or motion artefacts, leading to image exclusion if detected. The OCT-A images obtained from both participant groups (one eye per patient) were then analysed using an in-house specially designed image-processing software, OCT-A Vascular Image Analysis (OCTAVIA), which carried out an automated analysis and uploaded the specified measurements to a central Microsoft® Excel® 2021 spreadsheet.
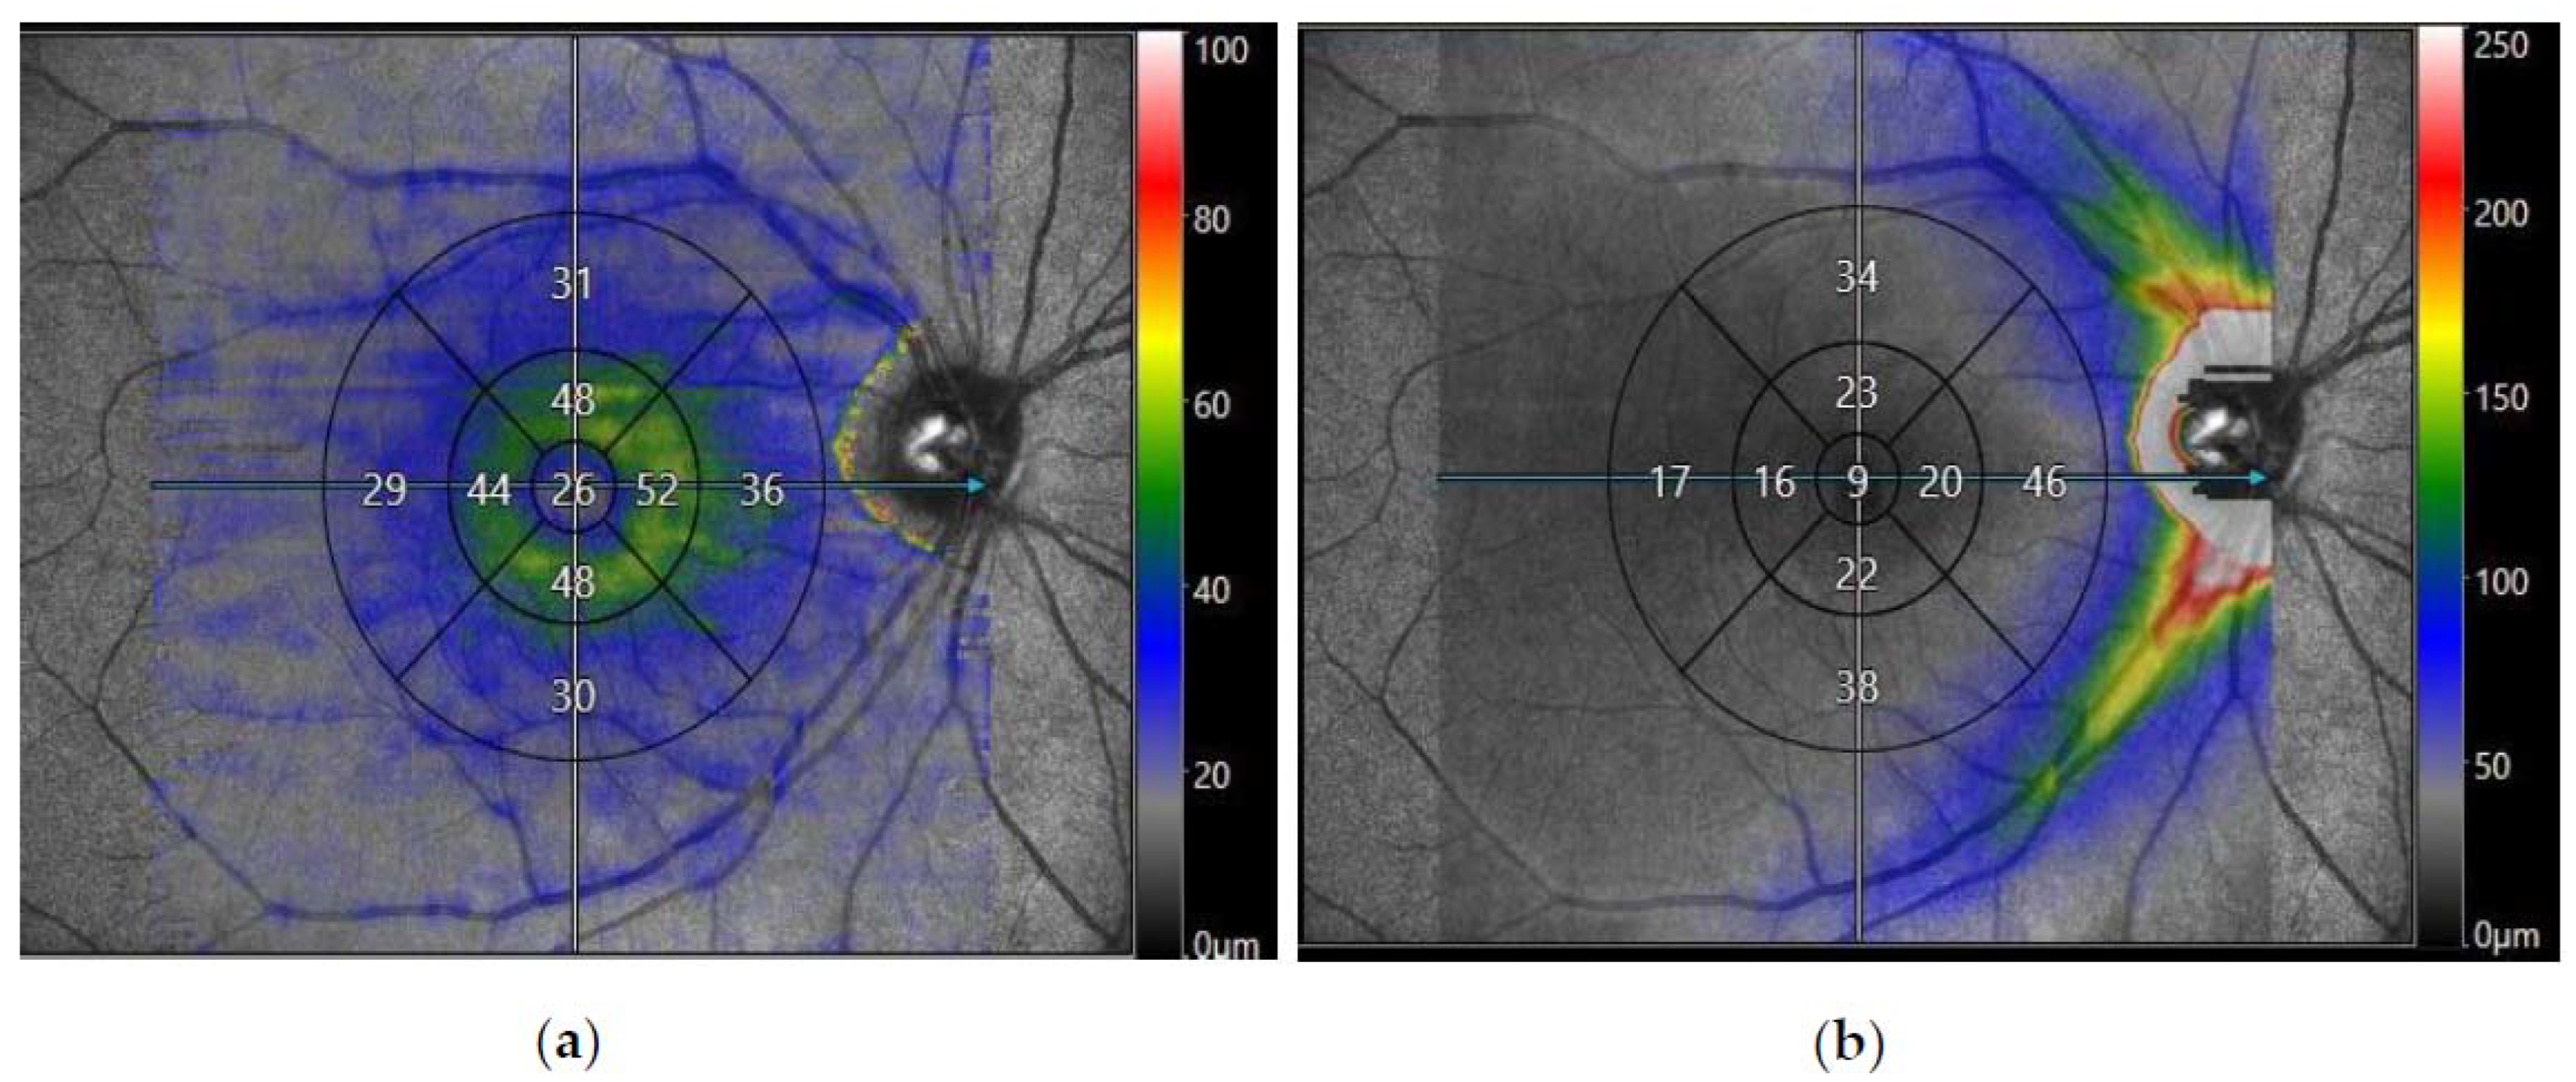
Spectral domain OCT of the macula was also performed to analyse the average thicknesses of the macular retinal nerve fibre layer (mRNFL) and macular ganglion cell layer (mGCL) in microns. The OCT machine’s internal software segmented the 10 × 10 macular image into the nine zones specified by the Early Treatment Diabetic Retinopathy Study (ETDRS) [78], giving an average value of RNFL or GCL thickness in each zone, shown in Figure 1. These values were exported into a Microsoft® Excel® 2021 spreadsheet, and a mean value for the thickness of the outer and inner segments was calculated. The final study parameters included the mean thickness of the outer segment, inner segment, and foveal (central) region of the mRNFL and mGCL.

2.3. OCT-Angiography Image Processing Algorithm

The OCTAVIA algorithm was programmed using MATLAB® 2021 by the corresponding author (TA), developed from previously published work on small field OCT-A imaging in diabetic retinopathy (DR) [79]. Additional evidence for its reliability and validity are provided in Appendix A, Appendix A.1 Reliability and validity of the software.
OCT-angiography has demonstrated a range of retinal vascular changes, including enlargement of the foveal avascular zone (FAZ) and reduced macular vessel density, in diabetic retinopathy [80,81] but also specifically in patients with recent SARS-CoV-2 infection [62,63,64,65,66,67,68,69,70,71,72,73,74,75].For our study we chose outcome measures to reflect a comprehensive but relevant assessment based upon previous research and clinical experience. The final measured parameters are listed in Table 1.
Large vessel and capillary intensity refer to the amount of blood flow through the large and capillary vessels, respectively. The percentage capillary network or vessel density is an index of vascularity, indicating the retinal area occupied by vessels divided by the total retinal area. Foveal avascular zone (FAZ) refers to the foveola and immediate parafoveal retina which lacks capillaries, relying on blood supply from the choriocapillaris. In addition to enlargement of the area of the FAZ, distortion of its circularity has also been observed in DR [82], leading us to examine this parameter to investigate the retinal microvasculature in detail.
To perform image analysis, OCTAVIA has two distinct processes, using both 4 × 4 and 10 × 10 images, shown in Figure 2. The software firstly inputs the subject’s 10 × 10 mm macular image, followed by the OCT-A machine’s own in-built proprietary binary interpretation of the same image. This process is repeated for the 4 × 4 mm foveal image. The 4 × 4 mm image allows for greater detail of the foveal avascular zone (FAZ) aiding more accurate measurement of its parameters. The proprietary binary images provide a template for accurately deriving the SCP vasculature. Morphological processing techniques are utilised to distinguish between larger and smaller vessels and thresholds applied onto processed images to identify low-intensity i.e., ischaemic areas. The large and capillary vessel intensity is measured by measuring the intensity of the pixels within the skeletonised vessels. During the initial software development phase, it became apparent that small vitreous opacities can cause darkened patches on the OCT-A images. To prevent the software misinterpreting areas of such low signal, including the optic disc, as ischaemia, the functionality to manually crop out these observed areas and the optic disc was integrated into an initial pre-processing step. The final data are directly outputted to a central Microsoft® Excel® spreadsheet by the software.

2.4. Statistical Methodology

The sample size for this study was calculated based on data collected in a previous study on diabetic retinopathy and OCT-angiography [79] and is provided in full in Appendix A, Appendix A.2 Sample size calculation. We opted to calculate the sample size using data from a cohort of patients with diabetic retinopathy because the alterations observed in OCT-A studies in patients with diabetic retinopathy are comparable to those seen in the early stages of COVID-19 infection, such as the enlargement of the FAZ [80]. A minimum of 31 participants in each group were calculated. Therefore, we aimed to have 40 participants in each of our study cohorts (PCS and controls).
Statistical analyses were performed using jamovi (version 2.3) [83]. Normality was assessed using the Shapiro–Wilk test, histograms, and Q-Q plots. Quantitative variables following a normal distribution were studied with Student t-tests, while those without a normal distribution were analysed using the Mann–Whitney U-test. The adjusted p value was set at <0.00357 after Bonferroni correction for 14 study parameters. A linear regression was also undertaken, evaluating the effect of dependent variables including age, gender, and length of time since initial COVID-19 infection on a key outcome variable mean capillary intensity (10 × 10 mm OCT-A image).

3. Results

3.1. Demographic Distribution

A total of 80 eyes of 80 patients were included in this study (44 right eyes and 36 left eyes). There were 40 patients included in the group with post-COVID-19 syndrome and 40 controls. The PCS group was comprised of 31 females and 9 males, with an average age of 47.8 ± 10.4 years. Ethnic distribution consisted of thirty-five Caucasians, two Asians, one Black Caribbean and one Mixed Caucasian and Black Caribbean participant. Clinical assessment including clinical history, visual acuity measurement, OCT and OCT-A imaging was conducted at an average of 15.2 ± 6.9 months (range 3–32 months) after the initial SARS-CoV-2 infection. The control group was comprised of twenty-seven females and thirteen males, with an average age of 44.0 ± 14.6 years. Ethnic distribution consisted of thirty-four Caucasians, five Asians, and one Black African participant. No significant differences in age (p = 0.107) or sex (p = 0.317) distribution were found between the two groups. The mean LogMAR visual acuity was −0.0045 ± 0.168 in the PCS cohort, and 0.01652 ± 0.137 in the control subjects (p = 0.302). The average quality of the OCT-angiography 10 × 10 mm images was 7.40 ± 0.67 in the PCS cohort and 7.55 ± 0.64 in the controls (p = 0.465). Average quality of 4 × 4 mm images was 7.68 ± 0.76 in the PCS group and 7.83 ± 0.90 in the controls (p = 0.465). The quality of the SD-OCT macula images was 8.18 ± 0.82 in the PCS group and 8.24 ± 0.65 in the controls (0.779). Further details can be found in Table 2.

3.2. Clinical History

Participants in the PCS cohort with notable past medical histories included six obese participants, eight asthmatic individuals, six with obstructive sleep apnoea, and one with fibromyalgia. Neither the controls nor any of the PCS cohort participants had a history of diabetes or hypertension. Only one patient in the cohort had a history of prior hospitalisation for COVID-19 pneumonia, with the remainder having had a mild COVID-19 infection which did not require any inpatient or outpatient treatment.
The most prevalent symptoms of post-COVID-19 syndrome identified during clinical history taking were fatigue (30/40), dyspnoea (23/40) of which 4/23 reported exertional dyspnoea, cognitive dysfunction termed “brain fog” (16/40), and palpitations (15/40). Four patients had been diagnosed with paroxysmal orthostatic tachycardia syndrome (POTS). Interestingly, 3/40 patients reported intermittent visual disturbance and 11/40 expressed presence of dry eyes. Table 3 provides further details on the PCS cohort’s clinical symptoms, categorised by physiological systems, adapted from a comprehensive review of PCS by NICE guidelines [84].

3.3. OCT-Angiography Image Analysis

All 80 eyes were processed successfully through the OCTAVIA image analysis system, which provided output metrics as planned. No clinically observable significant macro- or micro-vascular abnormalities were detected in either participant groups by a retinal specialist (TA). The results indicated that there were no statistically significant differences between the PCS and control cohort in any of the SCP measures in the 10 × 10 images in terms of the mean large vessel intensity (p = 0.588), mean capillary intensity (p = 0.099), mean vessel densities (p = 0.103) and the total area of ischaemia (p = 0.541). In the 4 × 4 images also, no statistically significant differences were noted between the PCS and control cohort in relation to the mean vessel densities (p = 0.895), area of the FAZ (p = 0.399), and circularity of the FAZ (p = 0.319).
During the study, a required remote OCT-A software upgrade occurred. Although there was no visible effect on clinical examination of the image, we explored impact of this on images and there appeared to be a possible subtle change in values of the mean capillary intensities on 4 × 4 images but of no other parameters. Therefore, for the purposes of inter-cohort and intra-cohort analysis of the mean capillary intensity (4 × 4 mm images) only individuals recruited from December 2021 (PCS cohort n = 20, control cohort n = 26) have been included. The mean capillary intensity was measured as 139.25 ± 4.32 in the PCS cohort, and 140.51 ± 6.03 in the controls (p = 0.350). Further details are illustrated in Table 4.

3.4. OCT Analysis

3.4.1. Macular RNFL and GCL Thickness

An analysis of SD-OCT-macula images was performed in 39 participants with PCS and 34 controls following exclusion of images of inferior quality. Although increased thickness of the mean outer, inner, and foveal segments of the mRNFL was noted in the PCS cohort compared to the controls, the differences were not statistically significant. Furthermore, a reduction in the thickness of the outer and inner segment of mGCL was observed in the PCS cohort compared to the control cohort, however these findings were not statistically significant. Details provided in Table 5.

3.4.2. Neurocognitive Symptoms and Macular RNFL and GCL Thickness

Within the PCS cohort, we evaluated the thickness of the macular RNFL and GCL segments in patients with ongoing neurocognitive symptoms, encompassing cognitive dysfunction i.e., brain fog and headaches (n = 24) compared with PCS participants without these symptoms (n = 15). No statistically significant differences were noted in the thickness of the macular RNFL or GCL segments within these sub-groups, described in Table 6.

3.5. Linear Regression

Linear regression analysis was undertaken to evaluate the effect of age, gender, and length of time since COVID-19 infection on mean capillary intensity (10 × 10 OCT-A image), a key measure of retinal microvasculature examined in our study. No significant relationships were observed with respect to the above independent variables on the mean capillary intensity (age, p = 0.922; gender, p = 0.966; length since initial infection, p = 0.332). This has been demonstrated below in Table 7.

4. Discussion

Post-COVID-19 syndrome has been linked to a persistent impairment of the systemic microvasculature. This study explored the retinal microvasculature network as a potential window into the pathophysiology of post-COVID-19, considering the known homology of the retinal vascular bed with systemic diseases.
We used custom-designed image analysis algorithms to assess a range of features using the most modern retinal imaging techniques including OCT and narrow and wide-field OCT-A imaging, in patients with and without post-COVID-19 syndrome. Our study shows that there were no significant differences found in any of the comprehensive measures used between our populations of people with and without this syndrome. There were no defects or abnormalities detected in the OCT of retinal layers or OCT-A of retinal vasculature.
Most studies discussing OCT-A in relation to COVID-19 primarily concentrate on patients who were hospitalised and/or treated for COVID-19 during the early stages of recovery from the infection as opposed to those experiencing post-COVID-19 syndrome (PCS). As a result, any inferences about persistent changes in the retina may be limited in their generalisability. A prominent finding in these studies has been the reduction in the central vessel density (VD) in patients with COVID-19 infection as compared to control patients [62,63,64,65,66,67,68,69,70,71,72,73,74,75].
Further studies entailing a slightly longer length of time between initial infection and imaging comprise of a duration of 3 month [71], up to 4 months [72], 6 months [73,74], with the longest follow-up being at 8 months post-infection [75]. The key findings were of reduced VDs in the superficial [71,72,73,74,75], deep [71,72,73,75], and radial peripapillary plexi [73], GCL thinning [74], parafoveal RNFL thinning [73,74] and FAZ enlargement [72,74,75].
In contrast to the studies above, the patients in our study cohort had a longer length of time since initial SARS-CoV-2 infection (15.2 ± 6.9 months (range 3–32)). Our analyses did not demonstrate any significant reduction in vessel densities or intensities in the SCP nor any differences in the area of the FAZ. The results of our investigation are encouraging, therefore, as they may indicate that any alterations in the retinal vasculature of individuals with a recent COVID-19 disease may not necessarily be long-term.
Alternatively, our negative findings may be due to our particular cohort—Other studies have been performed on patients with a moderate-severe SARS-CoV-2 infection [62,63,64,65,67,70,71,73,74,75] whilst in our study almost all participants had experienced a milder form of the disease which did not require hospitalisation and/or outpatient treatment.
A similar narrative to OCT-A research can be seen when assessing literature on structural OCT changes. Mavi et al. found statistically significant changes with higher central foveal, mean outer nuclear layer, and mean peri-papillary RNFL thickness in the post COVID-19 patients compared to normal [85]. Ugurlu et al. also examined SD-OCTs of 129 patients with COVID-19 infection 29 to 45 days following a positive PCR test, with findings of a statistically thinner macular RNFL and GCL layer in COVID-19 patients with neurological symptoms during the acute infection compared to those with non-neurological symptoms, no symptoms/pauci-symptoms, and control subject [86]. Interestingly, Taskiran-Sag et al. studied 40 patients 113 ± 62 (SD) days after recovering from acute COVID-19 infection. Within the COVID-19 recovered cohort, significantly reduced GCL thickness were found in patients with symptoms of cognitive disturbance and headaches [87]. More recently, Kanra et al. examined 34 eyes of 20 patients with neurological symptoms 4.3 ± 2.7 (range, 1–12) months following the initial COVID-29 infection. Thinning of the macular RFNL, the GCL, and inner plexiform layer (IPL) segments were noted [88]. In our study, analysis of the SD-OCT of 39 PCS and 34 control subjects did not demonstrate any differences in the mRNFL and mGCL between PCS and control cohorts. Furthermore, no distinguishable results were noted within the PCS cohort in patients with and without neurocognitive symptoms. It is therefore possible that structural changes noted in the retinal layers post-COVID-19 infection may not persist long-term. A summary of studies pertaining to OCT-A and OCT studies in COVID-19 can be found in Appendix B, Table A5 and Table A6.
We opted to analyse OCT-A images of the superficial retinal plexus, noting the clinical importance of this region and improved quality of imaging compared to intermediate or deep plexi as well as its predominance as a focus of analysis in other publications. However, Schlick et al. recently explored the retinal microvasculature of patients with post-COVID-19 syndrome using OCT-Angiography and found significant changes in the intermediate capillary plexus (ICP), as compared to the controls [89]. Future studies may benefit from attention to improved imaging of intermediate and deeper plexi to assess if this effect is seen longer term.
Overall, no long-term structural changes were noted in the retinal microvasculature pertaining to the SCP, and the thickness of the RNFL and GCL layers within our PCS cohort. Our PCS cohort comprised of patients with a predominantly mild initial COVID-19 illness, no underlying conditions known to affect the retinal microvasculature such as diabetes or hypertension, with an extended length of time since the initial infection. Therefore, our results should be interpreted with this in mind when comparing to other studies. Further examination with improved imaging of the intermediate and deep plexi and the choriocapillaris, as well as recruitment of patients with varying severity of initial disease, could further enhance our understanding of the long-term implications of COVID-19 on the retinal microvasculature in different patient groups.
SARS-CoV-2 enters cells by binding to angiotensin-converting enzyme 2 (ACE2), downregulating its activity and causing a disruption in the signalling effects of Angiotensin II and its receptor (Angiotensin II type 1 receptor, AT1). This leads to an accumulation of Angiotensin II, resulting in vasoconstriction, inflammation, cellular differentiation and growth, endothelial dysfunction, formation of reactive oxidative species (ROS), and microvascular thrombosis [90]. ACE2 is expressed within multiple retinal tissues, including the vascular endothelium, making it susceptible to Ag II/AT1 signalling effects and the resulting activation of the caspase 1/inflammasome pathway, responsible for the release of inflammatory cytokines [91]. Additionally, both dysregulation of the renin-angiotensin-aldosterone system (RAAS) and inflammation have been elucidated in the aetiology of post-COVID-19 syndrome [5]. No protracted alterations in the retinal microvasculature and structural layer thickness were observed in our study group following COVID-19 infection. We postulate that retinal microvascular alterations noted in the acute period post-SARS-CoV-2 infection might be predominantly ascribed to pro-inflammatory mechanisms linked to Angiotensin II. During a profound COVID-19 infection, compounded by additional co-morbidities, this response may be amplified. This is supported by studies demonstrating increased severity and mortality of COVID-19 in patients with diabetes, hypertension, and cardiovascular disease [92]. Additionally, COVID-19 disease severity has been found to affect the presence of retinopathy as a higher incidence was reported in moderate to severe disease [51,91,93]. Therefore, it is possible that, in the presence of a diminished disease severity, no underlying comorbidities, and as the duration since the initial infection extends, these inflammatory changes subside, without the occurrence of long-term ischaemic damage.
Our study was limited predominantly by challenges in imaging and defining study populations. Due to the immobility of the ophthalmic imaging apparatus, participant recruitment faced limitations as individuals were required to visit our facility instead of us conducting assessments at their respective respiratory clinics. Challenges were also encountered in image acquisition of the participants, especially with PCS due to the debilitating symptoms encompassing the disease, including dyspnoea, fatigue, and dry eyes. Movement of the head up and down due to dyspnoea posed limitations in maintaining a still stature whilst imaging was undertaken. Dry eyes significantly increased the participants’ blink frequency, and despite provision of lubricants, interfered with image acquisition. Fatigue resulted in easy tiring during imaging, reducing the number of repetitions which could be utilised to capture high quality images. These challenges were further compounded by a required imaging software update that led to potential changes in specific scans which were not visible clinically but excluded them from image analysis. In order to address these expected challenges in imaging, we dedicated some time at the beginning of the study to explore different imaging techniques with the OCT-A camera and developed a protocol that was standardised yet gave the best possible results for both cohorts of patients. We incorporated software routines for example to negate the effect of artefacts including vitreous aberrations that could obscure some regions of wide field OCTA imaging. Therefore, despite imaging challenges, we are confident that the images that were ultimately accepted into analysis in our study were all of adequate quality in both groups.
We defined patients as clearly as possible as those with a clinical diagnosis of post-COVID-19 syndrome, who were all recruited from specialist clinics designed to treat these patients. However, we recognised the heterogeneity of patients within this group. In addition, due to practical restrictions, our control sample included patients who have had COVID-19 infection but did not develop post COVID-19 symptoms. Ideally, we would have benefitted from comparing against patients who had not had a previous COVID-19 infection. Furthermore, in an ideal situation we would have compared the scans of patients with post-COVID-19 syndrome to scans they had prior to their infection. Again, this was not possible for practical reasons within the confines of this study.
This study is distinguishable within the literature due to a multitude of reasons. To our knowledge, it is the longest study examining the effects of SARS-CoV-2 on retinal tissues in patients up to 32 months following initial acute infection, particularly those who continue to suffer with symptoms of post-COVID-19 syndrome. Furthermore, our work is distinct as our in-house specially designed image analysis software, OCTAVIA, provides a comprehensive analysis of the data obtained from OCT-A imaging, with evidence for its reliability and validity. Parameters beyond the vessel densities are obtained, providing in-depth detail on the microvasculature of the retina, including vessel intensities, presence of ischaemia, and FAZ area and circularity measures.

5. Conclusions

In this study, we have demonstrated that there were no statistically significant differences in the retinal microvasculature of patients with post-COVID-19 syndrome compared to healthy cohorts. Furthermore, no significant structural differences were observed in the macular retinal nerve fibre layer (RNFL) and ganglion cell layer (GCL) of the study participants. The findings of this study indicate that despite an extensive investigation in patients with post-COVID-19 syndrome, there were no long-term structural signs of damage after detailed analysis of this accessible microvasculature bed that is known to have homology with systemic vasculature. This may serve as some positive reassurance for patients experiencing ongoing symptoms of PCS.

Author Contributions

Conceptualization, T.A., O.M. and M.N.; funding acquisition, T.A.; data curation, M.N., O.M. and I.D.; investigation, M.N., O.M. and I.D.; software design, T.A.; validation, M.N., O.M., I.D. and T.A.; formal analysis, M.N., O.M. and I.D.; methodology, M.N., O.M., I.D. and T.A.; project administration, M.N., O.M., I.D. and T.A.; resources, T.A.; supervision, T.A.; visualization, M.N., O.M., I.D. and T.A.; writing—original draft preparation, M.N.; writing—review and editing, T.A. All authors have read and agreed to the published version of the manuscript.

Funding

The position of the most recent research fellow (M.N.) was funded by the University of Manchester. The position of the previous research fellow (O.M.G.) was partly funded by Canon Medical EU, Zilverstraat, The Netherlands. The funders had no role in the design of the study; in the collection, analyses, or interpretation of data; in the writing of the manuscript; or in the decision to publish the results.

Institutional Review Board Statement

The study was conducted in accordance with the Declaration of Helsinki and approved by the Ethics Committees Health Research Authority (HRA) and Health and Care Research Wales (HCRW) along with the Office for Research Ethics Committees Northern Ireland (ORECNI). The IRAS project ID is 291767 and the reference number is 21/NI/0045.

Informed Consent Statement

Informed consent was obtained from all subjects involved in the study. Written informed consent has been obtained from the patient(s) to publish this paper.

Data Availability Statement

All data generated or analysed during this study are included in this published article. The datasets generated during and/or analysed during the current study are available from the corresponding author on reasonable request.

Acknowledgments

We would like to express our gratitude to the participants both with post-COVID-19 syndrome and without for their invaluable contribution to this study. We would also like to extend our appreciation to the respiratory team at the Manchester Royal Infirmary, UK, including Respiratory and Acute Medicine consultant John Bright and specialist respiratory nurses for their support in the recruitment of patients with post-COVID-19 syndrome.

Conflicts of Interest

Dr Maha Noor, Dr Orlaith McGrath, and Dr Ines Drira declare that they have no personal, financial, commercial, or academic conflict of interest. Professor Tariq M. Aslam has received funding and educational grants from Bayer, Novartis, Roche, Allergan, Laboratoires, Thea, Oraya, and Bausch and Lomb, Topcon, Heidelberg, Canon. The funders had no role in the design of the study; in the collection, analyses, or interpretation of data; in the writing of the manuscript; or in the decision to publish the results.

Appendix A

Appendix A.1. Reliability and Validity of the Software

To verify the utility of the OCTAVIA software, we appraised the reliability by assessing its automated large vessel intensity measurement in the 10 × 10 mm images of 20 participants on two separate occasions by the same examiner (T.A., a medical retina consultant). This included the manual pre-processing steps involving removal of artefacts. Data is shown below in Table A1.
A Pearson correlation coefficient between the two sets of measurements of 0.9963 was found, demonstrating excellent reliability. A Bland-Altman plot to graphically examine the repeatability was also plotted, shown in Figure A1, which also indicated high reliability. Using jamovi, additional reliability statistics were obtained which were also found to be supportive of our results (Cronbach’s α score of 0.998 and McDonalds’s ω score of 0.997).
Table A1. Measurement of large vessel intensities in the 10 × 10 mm OCT-A images of 20 participants, calculated twice to evaluate reliability.
OCTAVIA1OCTAVIA2MeanDifference
1200.2152200.8782200.546715−0.66295
2214.7086214.2896214.49906030.418981
3214.8738215.4842215.1789925−0.61038
4226.5071226.0975226.30233620.409616
5224.3287225.3507224.8396983−1.02203
6213.7813213.7845213.7829488−0.0032
7223.4939223.8539223.6739096−0.36005
8216.0177216.0692216.0434456−0.05153
9215.3221215.9063215.6141776−0.58424
10217.7659218.0761217.9210217−0.31021
11212.5384213.0391212.7887705−0.50068
12216.6652216.777216.7211303−0.11176
13216.6811216.6882216.6846339−0.00713
14213.7026213.9167213.8096195−0.2141
15218.6594217.7792218.21928330.880265
16220.9376221.0125220.9750348−0.07491
17217.0157216.9396216.97764280.076176
18217.3771217.8395217.608298−0.46247
19213.694213.1311213.41257190.562955
20218.2591218.2816218.2703393−0.02244
Figure A1. A Bland-Altmann plot demonstrating the difference between the results measuring large vessel intensities using the OCTAVIA software on two occasions by the same assessor.
Jimaging 09 00234 g0a1
To measure the validity of the OCTAVIA software, Image J was utilised to manually measure the area of the FAZ, comparing this with the measure outputted from the automated OCTAVIA software in the same 20 participants. Data is shown below in Table A2. This was demonstrated in a scatterplot, Figure A2, illustrating that the line of best fit for the relationship between the manual and automatic measurements was not significantly different from the 1:1 line (where a perfect match of both measurements would lie).
Table A2. Measurement of the area of the foveal avascular zone (FAZ) using the OCTAVIA software vs manual assessment utilising image J.
OCTAVIAImage J
10.0057880.005673325
20.02120.0227944
30.0144880.01531618
40.0264280.027984508
50.0174750.01882717
60.0062080.00685339
70.0194270.02044105
80.0074630.00819081
90.0084050.00898651
100.0174280.0184428
110.0078470.0070062
120.0072380.007172576
130.0226080.02153121
140.0042260.004765234
150.003860.00383916
160.0094130.009449548
170.0048610.004664085
180.0117560.010274797
190.0050880.005610388
200.0114910.011762485
Figure A2. A scatterplot demonstrating the measurements of the area of the foveal avascular zone (FAZ) using Image J and the OCTAVIA software, outlining the relationship between a line of best fit compared to the 1:1 line.
Jimaging 09 00234 g0a2
An additional evaluation of validity was performed by comparing the measurement of mean large vessel intensities in 10 × 10 mm OCT-A images outputted by the OCTAVIA software with manual measurements made using large vessel data points in MATLAB®® 2021. In the 10 × 10 mm OCT-A images of 20 study participants, three large vessels were selected, and data corresponding with vessel intensity was obtained by selecting two points at the centre of the vessel and two near the margin in each vessel. The data was noted in a Microsoft® Excel® spreadsheet and a total average was calculated to compare against OCTAVIA measurements, shown in Table A3. The results are also demonstrated in a scatter plot, Figure A3, illustrating no significant differences between the line of best fit and 1:1 line.
Table A3. Data points corresponding with vessel intensities measured in three large vessels in the 10 × 10 mm OCT-A images of 20 participants using MATLAB, compared with measurements from the OCTAVIA algorithm.
Large Vessel 1Large Vessel 2Large Vessel 3Manual AverageOCTAVIA
CentreCentreMarginMarginCentreCentreMarginMarginCentreCentreMarginMargin
110.9294120.7098040.7882350.9254910.8156860.7921570.94117610.850980.8392160.8826796670.885820538
20.91372510.8784310.7686270.9333330.8352940.8980390.8901960.9254910.850980.8431370.8947710.893043548
30.8941180.9450980.7450980.9960780.9333330.7333330.8039220.9137250.90196110.7843140.9647060.88464050.90166909
410.9294120.725490.8196080.8666670.9450980.80.9411760.90196110.8549020.850980.88627450.889066606
510.9333330.8823530.83137310.9882350.8235290.8431370.8784310.9764710.8039220.8313720.8993463330.893814466
610.9647060.874510.7529410.9098040.9176470.8705880.8431370.9686270.9294120.8117650.7647060.8839869170.883226069
70.9843140.8352940.8196080.88235310.9882350.8470590.78431410.9725490.7686270.7843140.8888889170.887244315
80.98039210.7960780.83921610.9058820.8705880.7098040.9764710.8117650.850980.7411760.8735293330.875732357
90.9254910.7647060.83921610.8862750.73333330.8274510.97254910.8274510.7529410.8774510250.864223212
100.9333330.8980390.8313730.8795880.9921570.9647060.8588240.8039220.9764710.9725490.8156860.7529410.889965750.885640208
110.9843140.9607840.8156860.7764710.8509810.8313730.850980.9058820.9882350.7137250.7686270.8705880830.868688789
1210.9450980.8235290.8274510.9960780.9921570.7450980.7843140.9215690.9921570.7843140.8470590.8882353330.871880492
130.9176470.9686270.8941180.78039210.9058820.8980390.7607840.81176510.8666670.725490.8774509170.874451774
140.9058820.8862750.8784310.870588110.80.7803920.90588210.8078430.7176470.8794116670.874872568
1510.9764710.8784310.8352940.9764710.8823530.7607840.874510.9686270.9686270.7960780.8078430.893790750.893920821
160.874510.9372550.8352940.7098040.9372550.9294120.8470590.86274510.9725490.8862750.7843140.8813726670.882249605
170.98039210.8784310.83921610.949020.8274510.7529410.8156860.8941180.8941180.8235290.88790850.8875187
1810.9137250.850980.8431370.9686270.7764710.874510.8627450.9568630.9176470.7372550.725490.8689541670.862268732
19110.8156860.949020.9960780.925490.7647060.76470610.8666670.7960780.9176470.8996731670.90460477
200.99607810.8901960.7921570.88235310.8352940.7450980.99215710.7686270.8313730.8944444170.897619232
Figure A3. A scatterplot demonstrating manual measurements of large vessel intensities in 10 × 10 OCT-A images compared with OCTAVIA software, outlining the relationship between the line of best fit and 1:1 line.
Jimaging 09 00234 g0a3

Appendix A.2. Sample Size Calculation

The sample size for this study was calculated based on data collected in a previous study on diabetic retinopathy and OCT-Angiography [79]. The method was as follows:
Typically, we set:
α   =   0.05   so   Z α / 2   =   1.960 β   =   0.20   so   Z β / 2   =   0.8416 which   gives : n g     2 ( z α / 2 + z β ) 2   ( σ μ 1 μ 2 ) 2   2   ×   ( 1.960 + 0.8416 ) 2   ( σ μ 1 μ 2 ) 2   2   ×   7.849   ( σ μ 1 μ 2 ) 2
σ is the population standard deviation. µ1−µ2 is the smallest difference with scientific significance. The sample size for this study is based on the sample size for the key metric, mean capillary intensity. The mean capillary intensity of a normal patient from the study was 98.69, shown in Table A4, with σ = 6.23. The difference between mean capillary intensities in Normal vs Diabetic patients with no retinopathy suggested a clinically important difference in this metric, µ1−µ2 = 98.69−94.22 = 4.47. Therefore: 2 × 7.849   6.23 4.47 2 = 30.49 ≈ 31. A minimum of 31 in each group was needed, hence, we aimed to have 40 participants in each of our study cohorts (PCS and controls).
Table A4. Table excerpt from Aslam et al.’s study of optical coherence tomography angiography in diabetic retinopathy [79] demonstrating the strategy utilised in the calculation of sample size for this study.
Variable StatisticNormal, N (n = 49)Diabetic No Retinopathy, DnR (n = 50)Diabetic with Retinopathy, DR (n = 53)
Sex Male 32, Female 17Male 36, Female 14Male 43, Female 10
AgeMean (SD)57.14 (13.56)61.06 (12.77)58.38 (13.06)
Median57.061.560
Best Corrected Visual Acuity (BCVA)Mean (SD)85 (19.66)96.36 (7.39)86.17 (13.3
Median959590
Mean Vessel IntensityMean (SD)180.65 (6.43)181.38 (6.04)179.28 (7.45)
Median182.0183.5181.0
Mean Capillary IntensityMean (SD)98.69 (6.23)94.22 (5.41)93.47 (6.03)
Median999594
Standard Deviation, SD.

Appendix B

A summary of studies examining OCT-A and SD-OCT images in patients following COVID-19 Infection can be found in Table A5 and Table A6.
Table A5. A summary of studies pertaining to OCT-Angiography and SD-OCT macula findings in patients following COVID-19 infection.
StudyTime Following Initial SARS-CoV-2 InfectionSeverity of InfectionSize (Case, Control)Key Findings (Statistically Significant)
OCT-Angiography: Studies Demonstrating Reduction in Vessel Densities in Patients with a History of COVID-19 Infection
Zapata et al., 2022 [62]≤90 days (3 months)Mild, Moderate, Severe24, 24, 21, 27Reduced VDs in the SCP of patients with moderate and severe disease, compared to mild disease and control subjects.
Turker et al., 2021 [63]7 days following hospital dischargeModerate27, 27Reduced VD in SCP and DCP regions. No difference in area of the FAZ.
Abrishami et al., 2021 [64]≥14 days following recoveryModerate, Severe31, 23Reduced VD in the SCP and DCP. No difference in area of the FAZ.
Gonzalez-Zamora et al., 2021 [65]14 days following hospital dischargeSevere25, 25Reduced VD in SCP and DCP regions. Enlargement of FAZ area.
Hazar et al., 2021 [66]≈30 days (1 month) following hospital dischargeMild, Moderate50, 55Reduced VD in SCP and DCP regions. No difference in area of the FAZ.
Guemes Villahoz et al., 2021 [67]88 days following initial diagnosisModerate, Severe66 (19, 47), 29Reduction in VDs in the SCP and reduced perfusion density in the fovea. No difference in the area of the FAZ.
Rodman et al., 2021 [68]-Mild18, 18Reduced VDs in regions of the SCP.
Yilmaz Cebi et al., 2022 [69]67–86 daysMild, Moderate52, 42Reduced VDs in SCP and DCP.
Cetinkaya et al., 2022 [70]≈30 days following hospital dischargeModerate45, 45Reduced VDs in SCP, DCP, and CC.
Abrishami et al., 2022 [71]7 days, 1 month, 3 monthsModerate, Severe18 (follow-up study)Reduced VDs in the SCP and DCP, no difference in the area of the FAZ.
Nageeb Louz et al., 2022 [72]30–120 days (1–4 months)Mild, Moderate, Severe45, 45Reduced VDs in the SCP, DCP, and enlargement of FAZ.
Cennamo et al., 2021 [73]180 days (6 months)Moderate40, 40Reduced VDs in SCP, RPC, DCP. RNFL thickness reduced.
Bilbao-Malave V et al., 2021 [74]6 months from hospital dischargeSevere17 (follow-up study)Reduced VDs in SCP and DCP, enlargement of FAZ, Thinner GCL and RNFL.
Banderas Garcia S et al., 2022 [75]8 months after initial infectionMild, Moderate, Severe75, 19Reduced VDs in the SCP and DCP of patients with moderate and severe disease, compared to mild disease and control subjects. Enlargement of FAZ in patients with more severe disease.
OCT-Angiography: Studies demonstrating no difference in vessel densities in patients with a history of COVID-19 infection
Savastano et al., 2021 [93]1 month following hospital dischargeModerate70, 22No differences in VD and VP in the SCP and DCP.
Szkodny et al., 2021 [94]1–4 months following infectionMild, Moderate156, 98No differences in the VDs of the SVP, area of the FAZ, macular RNFL thickness, and central macular thickness.
Kal M et al., 2022 [95]8 weeks following hospital dischargeSevere63, 45No difference in the VDs in SCP or DCP between the two groups. Reduced VD in the foveal CC. Enlargement of area of FAZ.
Chiosi F et al., 2022 [96]1 month following recovery from infectionMild, Moderate, Severe142, 60No difference in the VDs in SCP. Reduced VD in the DCP and CC.
OCT-Angiography: Studies demonstrating increase in vessel densities in patients with a history of COVID-19 infection
Naderi Beni A et al., 2022 [58]40–95 days following initial infectionModerate51, 37Increased VDs in the SCP and DCP. Increased peripapillary RNFL thickness.
OCT macula structural retinal findings in patients with a history of COVID-19 infection
Sim et al., 2021 [52]16.1 ± 3.6 daysMild108, 0Microhaemorrhages, retinal vascular tortuosity, cotton wool spots, hyper-reflective plaques in the GCL-IPL.
Marinho et al., 2020 [54]11–33 daysMild to Moderate12Hyper-reflective plaques in the GCL-IPL, cotton wool spots, microhaemorrhages.
Burgos-Blasco et al., 2022 [57]4 weeks following recoveryMild, Moderate, Severe90, 70Increased peri papillary RNFL and macular GCL thickness (more significant in patients with anosmia and ageusia) and decreased macular RNFL thickness.
Oren et al., 2021 [59]14–30 daysMild35, 25Increased central macular thickness, decreased GCL and INL thickness.
Mavi et al., 2022 [85]2–8 weeksModerate63 (30 hospitalised), 59Increased central foveal, mean outer nuclear layer, mean peri papillary RNFL thickness.
Ugurlu A et al., 2022 [86]29–45 daysModerate, Severe129, 130No difference between COVID-19 and controls. Thinner macular RNFL and GCL in patients with neurological symptoms within the COVID-19 cohort. Reduced VD in SCP, DCP, RPCP, enlargement of FAZ area, reduction of FAZ circularity in symptomatic COVID-10 patients.
Taskiran-Sag et al., 2022 [87]113 ± 62 days following recovery from infectionMild, Moderate40, 40No difference between GCL thickness between COVID-19 and controls. Thinner macular GCL in patients with neuro-cognitive symptoms.
Choriocapillaris, CC; Cotton wool spots, CWS; Deep capillary plexus; DCP; Foveal avascular zone, FAZ; Ganglion cell layer; GCL; Inner nuclear layer, INL; Inner plexiform layer, IPL; Retinal nerve fibre layer, RNFL; Radial peri papillary capillary plexus, RPCP; radial peripapillary capillaries, RPC; Superficial capillary plexus, SCP; Vessel density, VD; Vessel perfusion, VP.
Table A6. A Summary of studies pertaining to OCT-Angiography and SD-OCT macula findings in patients with post-COVID-19 syndrome.
StudyTime Following Initial SARS-CoV-2 InfectionSeverity of InfectionSize (Case, Control)Key Findings (Statistically Significant)
Kanra AY et al., 2022 [88]4.3 ± 2.7 months (1–12)Mild to Moderate20, 23Thinning in segments of the macular RNFL, GCL, and IPL.
Schlick et al., 2022 [89]231 ± 111 days (7.59 ± 3.65 months)-173, 28Reduced VDs in ICP, no difference in SVP, DCP. Females with PCS had lower VDs in SVP than males. PCS participants with CF had lower VDs in SVP than those without.
Ganglion cell layer, GCL; Inner Plexiform Layer, IPL; Intermediate capillary plexus, ICP; Post COVID-19 syndrome, PCS; Retinal nerve fibre layer, RNFL; Vessel density, VD.

References

  1. Wiersinga, W.J.; Rhodes, A.; Cheng, A.C.; Peacock, S.J.; Prescott, H.C. Pathophysiology, Transmission, Diagnosis, and Treatment of Coronavirus Disease 2019 (COVID-19): A Review. JAMA 2020, 324, 782–793. [Google Scholar] [CrossRef] [PubMed]
  2. National Institute of Health and Care Excellence (NICE). COVID-19 Rapid Guideline: Managing the Long-Term Effects of COVID-19; NICE: Sutton-in-Ashfield, UK, 2021; Available online: https://www.nice.org.uk/guidance/ng188 (accessed on 3 March 2023).
  3. Soriano, J.B.; Murthy, S.; Marshall, J.C.; Relan, P.; Diaz, J.V. A clinical case definition of post-COVID-19 condition by a Delphi consensus. Lancet Infect. Dis. 2022, 22, e102–e107. [Google Scholar] [CrossRef] [PubMed]
  4. Nalbandian, A.; Sehgal, K.; Gupta, A.; Madhavan, M. Post-acute COVID-19 syndrome. Nat. Med. 2021, 27, 601–615. [Google Scholar] [CrossRef] [PubMed]
  5. Sherif, Z.A.; Gomez, C.R.; Connors, T.J.; Henrich, T.J.; Reeves, W.B. Pathogenic mechanisms of post-acute sequelae of SARS-CoV-2 infection (PASC). eLife 2023, 12, e86002. [Google Scholar] [CrossRef]
  6. Ahamed, J.; Laurence, J. Long COVID endotheliopathy: Hypothesized mechanisms and potential therapeutic approaches. J. Clin. Investig. 2022, 132, e161167. [Google Scholar] [CrossRef] [PubMed]
  7. Al-Ramadan, A.; Rabab’h, O.; Shah, J.; Gharaibeh, A. Acute and Post-Acute Neurological Complications of COVID-19. Neurol. Int. 2021, 13, 102–119. [Google Scholar] [CrossRef]
  8. Amenta, E.M.; Spallone, A.; Rodriguez-Barradas, M.C.; El Sahly, H.M.; Atmar, R.L.; A Kulkarni, P. Postacute COVID-19: An Overview and Approach to Classification. Open Forum Infect. Dis. 2020, 7, ofaa509. [Google Scholar] [CrossRef]
  9. Camargo-Martínez, W.; Lozada-Martínez, I.; Escobar-Collazos, A.; Navarro-Coronado, A.; Moscote-Salazar, L.; Pacheco-Hernández, A.; Janjua, T.; Bosque-Varela, P. Post-COVID 19 neurological syndrome: Implications for sequelae’s treatment. J. Clin. Neurosci. 2021, 88, 219–225. [Google Scholar] [CrossRef]
  10. Choutka, J.; Jansari, V.; Hornig, M.; Iwasaki, A. Unexplained post-acute infection syndromes. Nat. Med. 2022, 28, 911–923. [Google Scholar] [CrossRef]
  11. Carod-Artal, F.J. Post-COVID-19 syndrome: Epidemiology, diagnostic criteria and pathogenic mechanisms involved. Rev. Nuerol. 2021, 72, 384–396. [Google Scholar]
  12. Cortés-Telles, A.; López-Romero, S.; Figueroa-Hurtado, E.; Pou-Aguilar, Y.N.; Wong, A.W.; Milne, K.M.; Ryerson, C.J.; Guenette, J.A. Pulmonary function and functional capacity in COVID-19 survivors with persistent dyspnoea. Respir. Physiol. Neurobiol. 2021, 288, 103644. [Google Scholar] [CrossRef] [PubMed]
  13. Doykov, I.; Hällqvist, J.; Gilmour, K.C.; Grandjean, L.; Mills, K.; Heywood, W.E. ‘The long tail of COVID-19’—The detection of a prolonged inflammatory response after a SARS-CoV-2 infection in asymptomatic and mildly affected patients. F1000 Res. 2021, 9, 1349. [Google Scholar] [CrossRef] [PubMed]
  14. Gottschalk, C.G.; Peterson, D.; Armstrong, J.; Knox, K.; Roy, A. Potential molecular mechanisms of chronic fatigue in long haul COVID and other viral diseases. Infect. Agent Cancer 2023, 18, 7. [Google Scholar] [CrossRef]
  15. Fernández-De-Las-Peñas, C.; Palacios-Ceña, D.; Gómez-Mayordomo, V.; Cuadrado, M.L.; Florencio, L.L. Defining Post-COVID Symptoms (Post-Acute COVID, Long COVID, Persistent Post-COVID): An Integrative Classification. Int. J. Environ. Res. Public Health 2021, 18, 2621. [Google Scholar] [CrossRef] [PubMed]
  16. Andrade, B.S.; Siqueira, S.; Soares, W.R.d.A.; Rangel, F.d.S.; Santos, N.O.; Freitas, A.d.S.; da Silveira, P.R.; Tiwari, S.; Alzahrani, K.J.; Góes-Neto, A.; et al. Long-COVID and Post-COVID Health Complications: An Up-to-Date Review on Clinical Conditions and Their Possible Molecular Mechanisms. Viruses 2021, 13, 700. [Google Scholar] [CrossRef] [PubMed]
  17. Lee, J.C.; Nallani, R.; Cass, L.; Bhalla, V.; Chiu, A.G.; Villwock, J.A. A Systematic Review of the Neuropathologic Findings of Post-Viral Olfactory Dysfunction: Implications and Novel Insight for the COVID-19 Pandemic. Am. J. Rhinol. Allergy 2020, 35, 323–333. [Google Scholar] [CrossRef]
  18. Mantovani, A.; Morrone, M.C.; Patrono, C.; Santoro, M.G.; Schiaffino, S.; Remuzzi, G.; Bussolati, G.; Cappuccinelli, P. Long Covid: Where we stand and challenges ahead. Cell Death Differ. 2022, 29, 1891–1900. [Google Scholar] [CrossRef]
  19. McFarland, A.J.; Yousuf, M.S.; Shiers, S.; Price, T.J. Neurobiology of SARS-CoV-2 interactions with the peripheral nervous system: Implications for COVID-19 and pain. Pain Rep. 2021, 6, e885. Available online: https://journals.lww.com/painrpts/Fulltext/2021/01000/Neurobiology_of_SARS_CoV_2_interactions_with_the.1.aspx (accessed on 15 March 2023). [CrossRef]
  20. Oronsky, B.; Larson, C.; Hammond, T.C.; Oronsky, A.; Kesari, S.; Lybeck, M.; Reid, T.R. A Review of Persistent Post-COVID Syndrome (PPCS). Clin. Rev. Allergy Immunol. 2023, 64, 66–74. [Google Scholar] [CrossRef]
  21. Song, W.-J.; Hui, C.K.M.; Hull, J.H.; Birring, S.S.; McGarvey, L.; Mazzone, S.B.; Chung, K.F. Confronting COVID-19-associated cough and the post-COVID syndrome: Role of viral neurotropism, neuroinflammation, and neuroimmune responses. Lancet Respir. Med. 2021, 9, 533–544. [Google Scholar] [CrossRef]
  22. Toniolo, S.; Scarioni, M.; Di Lorenzo, F.; Hort, J.; Georges, J.; Tomic, S.; Nobili, F.; Frederiksen, K.S.; the Management Group of the EAN Dementia and Cognitive Disorders Scientific Panel. Dementia and COVID-19, a Bidirectional Liaison: Risk Factors, Biomarkers, and Optimal Health Care. J. Alzheimer’s Dis. 2021, 82, 883–898. [Google Scholar] [CrossRef] [PubMed]
  23. Touyz, R.M.; Boyd, M.O.; Guzik, T.; Padmanabhan, S.; McCallum, L.; Delles, C.; Mark, P.B.; Petrie, J.R.; Rios, F.; Montezano, A.C.; et al. Cardiovascular and Renal Risk Factors and Complications Associated with COVID-19. CJC Open 2021, 3, 1257–1272. [Google Scholar] [CrossRef] [PubMed]
  24. Townsend, L.; Fogarty, H.; Dyer, A.; Martin-Loeches, I.; Bannan, C.; Nadarajan, P.; Bergin, C.; O’Farrelly, C.; Conlon, N.; Bourke, N.M.; et al. Prolonged elevation of D-dimer levels in convalescent COVID-19 patients is independent of the acute phase response. J. Thromb. Haemost. 2021, 19, 1064–1070. [Google Scholar] [CrossRef] [PubMed]
  25. Wong, S.W.; Fan, B.E.; Huang, W.; Chia, Y.W. ST-segment elevation myocardial infarction in post-COVID-19 patients: A case series. Ann. Acad. Med. Singap. 2021, 50, 425–430. [Google Scholar] [CrossRef] [PubMed]
  26. Wirth, K.J.; Scheibenbogen, C. Pathophysiology of skeletal muscle disturbances in Myalgic Encephalomyelitis/Chronic Fatigue Syndrome (ME/CFS). J. Transl. Med. 2021, 19, 162. [Google Scholar] [CrossRef]
  27. Kell, D.B.; Laubscher, G.J.; Pretorius, E. A central role for amyloid fibrin microclots in long COVID/PASC: Origins and therapeutic implications. Biochem. J. 2022, 479, 537–559. [Google Scholar] [CrossRef]
  28. Szewczykowski, C.; Mardin, C.; Lucio, M.; Wallukat, G.; Hoffmanns, J.; Schröder, T.; Raith, F.; Rogge, L.; Heltmann, F.; Moritz, M.; et al. Long COVID: Association of Functional Autoantibodies against G-Protein-Coupled Receptors with an Impaired Retinal Microcirculation. Int. J. Mol. Sci. 2022, 23, 7209. [Google Scholar] [CrossRef]
  29. Fernández-de-las-Peñas, C.; Pellicer-Valero, O.J.; Navarro-Pardo, E.; Palacios-Ceña, D.; Florencio, L.L.; Guijarro, C.; Martín-Guerrero, J.D. Symptoms Experienced at the Acute Phase of SARS-CoV-2 Infection as Risk Factor of Long-term Post-COVID Symptoms: The LONG-COVID-EXP-CM Multicenter Study. Int. J. Infect. Dis. 2022, 116, 241–244. [Google Scholar] [CrossRef]
  30. Gaebler, C.; Wang, Z.; Lorenzi, J.C.C.; Muecksch, F.; Finkin, S.; Tokuyama, M.; Cho, A.; Jankovic, M.; Schaefer-Babajew, D.; Oliveira, T.Y.; et al. Evolution of antibody immunity to SARS-CoV-2. Nature 2021, 591, 639–644. [Google Scholar] [CrossRef]
  31. Hopkinson, N.S.; Jenkins, G.; Hart, N. COVID-19 and what comes after? Thorax 2021, 76, 324. [Google Scholar] [CrossRef]
  32. Gupta, A.; Madhavan, M.V.; Sehgal, K.; Nair, N.; Mahajan, S.; Sehrawat, T.S.; Bikdeli, B.; Ahluwalia, N.; Ausiello, J.C.; Wan, E.Y.; et al. Extrapulmonary manifestations of COVID-19. Nat. Med. 2020, 26, 1017–1032. [Google Scholar] [CrossRef] [PubMed]
  33. Fogarty, H.; Townsend, L.; Morrin, H.; Ahmad, A.; Comerford, C.; Karampini, E.; Englert, H.; Byrne, M.; Bergin, C.; O’sullivan, J.M.; et al. Persistent endotheliopathy in the pathogenesis of long COVID syndrome. J. Thromb. Haemost. 2021, 19, 2546–2553. [Google Scholar] [CrossRef] [PubMed]
  34. Hohberger, B.; Harrer, T.; Mardin, C.; Kruse, F.; Hoffmanns, J.; Rogge, L.; Heltmann, F.; Moritz, M.; Szewczykowski, C.; Schottenhamml, J.; et al. Case Report: Neutralization of Autoantibodies Targeting G-Protein-Coupled Receptors Improves Capillary Impairment and Fatigue Symptoms After COVID-19 Infection. Front. Med. 2021, 8, 754667. Available online: https://www.frontiersin.org/articles/10.3389/fmed.2021.754667 (accessed on 15 March 2023). [CrossRef] [PubMed]
  35. Robertson, M.M.; Qasmieh, S.A.; Kulkarni, S.G.; Teasdale, C.A.; Jones, H.E.; McNairy, M.; Borrell, L.N.; Nash, D. The Epidemiology of Long COVID in US Adults. Clin. Infect. Dis. 2022, 76, 1636–1645. [Google Scholar] [CrossRef]
  36. Thompson, E.J.; Williams, D.M.; Walker, A.J.; Mitchell, R.E.; Niedzwiedz, C.L.; Yang, T.C.; Huggins, C.F.; Kwong, A.S.F.; Silverwood, R.J.; Di Gessa, G.; et al. Long COVID burden and risk factors in 10 UK longitudinal studies and electronic health records. Nat. Commun. 2022, 13, 3528. [Google Scholar] [CrossRef]
  37. Subramanian, A.; Nirantharakumar, K.; Hughes, S.; Myles, P.; Williams, T.; Gokhale, K.M.; Taverner, T.; Chandan, J.S.; Brown, K.; Simms-Williams, N.; et al. Symptoms and risk factors for long COVID in non-hospitalized adults. Nat. Med. 2022, 28, 1706–1714. [Google Scholar] [CrossRef]
  38. Chen, C.; Haupert, S.R.; Zimmermann, L.; Shi, X.; Fritsche, L.G.; Mukherjee, B. Global Prevalence of Post-Coronavirus Disease 2019 (COVID-19) Condition or Long COVID: A Meta-Analysis and Systematic Review. J. Infect. Dis. 2022, 226, 1593–1607. [Google Scholar] [CrossRef]
  39. Su, Y.; Yuan, D.; Chen, D.G.; Ng, R.H.; Wang, K.; Choi, J.; Li, S.; Hong, S.; Zhang, R.; Xie, J.; et al. Multiple early factors anticipate post-acute COVID-19 sequelae. Cell 2022, 185, 881–895.e20. [Google Scholar] [CrossRef]
  40. Desgranges, F.; Tadini, E.; Munting, A.; Regina, J.; Filippidis, P.; Viala, B.; Karachalias, E.; Suttels, V.; Haefliger, D.; Kampouri, E.; et al. Post-COVID-19 Syndrome in Outpatients: A Cohort Study. J. Gen. Intern. Med. 2022, 37, 1943–1952. [Google Scholar] [CrossRef]
  41. Hanson, S.W.; Abbafati, C.; Aerts, J. A global systematic analysis of the occurrence, severity, and recovery pattern of long COVID in 2020 and 2021. medRxiv 2022. [Google Scholar] [CrossRef]
  42. Office for National Statistics (ONS). Prevalence of Ongoing Symptoms Following Coronavirus (COVID-19) Infection in the UK: 2 February 2023; Office for National Statistics (ONS) Website, Statistical Bulletin: London, UK, 2023. Available online: https://www.ons.gov.uk/peoplepopulationandcommunity/healthandsocialcare/conditionsanddiseases/bulletins/prevalenceofongoingsymptomsfollowingcoronaviruscovid19infectionintheuk/2february2023 (accessed on 15 March 2023).
  43. Davis, H.E.; Assaf, G.S.; McCorkell, L.; Wei, H.; Low, R.J.; Re’Em, Y.; Redfield, S.; Austin, J.P.; Akrami, A. Characterizing long COVID in an international cohort: 7 months of symptoms and their impact. EClinicalMedicine 2021, 38, 101019. [Google Scholar] [CrossRef] [PubMed]
  44. Ni, W.; Yang, X.; Yang, D.; Bao, J.; Li, R.; Xiao, Y.; Hou, C.; Wang, H.; Liu, J.; Yang, D.; et al. Role of angiotensin-converting enzyme 2 (ACE2) in COVID-19. Crit. Care 2020, 24, 422. [Google Scholar] [CrossRef] [PubMed]
  45. Gheblawi, M.; Wang, K.; Viveiros, A.; Nguyen, Q.; Zhong, J.C.; Turner, A.J.; Raizada, M.K.; Grant, M.B.; Oudit, G.Y. Angiotensin-Converting Enzyme 2: SARS-CoV-2 Receptor and Regulator of the Renin-Angiotensin System. Circ. Res. 2020, 126, 1456–1474. [Google Scholar] [CrossRef] [PubMed]
  46. Lomi, N.; Sindhuja, K.; Asif, M.; Tandon, R. Clinical profile and prevalence of conjunctivitis in mild COVID-19 patients in a tertiary care COVID-19 hospital: A retrospective cross-sectional study. Indian J. Ophthalmol. 2020, 68, 1546–1550. [Google Scholar] [CrossRef]
  47. Costa, F.; Bonifácio, L.P.; Bellissimo-Rodrigues, F.; Rocha, E.M.; Jorge, R.; Bollela, V.R.; Antunes-Foschini, R. Ocular findings among patients surviving COVID-19. Sci. Rep. 2021, 11, 11085. [Google Scholar] [CrossRef]
  48. Honavar, S.; Sen, M.; Sharma, N.; Sachdev, M. COVID-19 and Eye: A Review of Ophthalmic Manifestations of COVID-19. Indian J. Ophthalmol. 2021, 69, 488–509. [Google Scholar] [CrossRef]
  49. Feizi, S.M.; Meshksar, A.; Naderi, A.; Esfandiari, H. Anterior Scleritis Manifesting After Coronavirus Disease 2019: A Report of Two Cases. Cornea 2021, 40, 1204–1206. [Google Scholar] [CrossRef]
  50. Bertoli, F.; Veritti, D.; Danese, C.; Samassa, F.; Sarao, V.; Rassu, N.; Gambato, T.; Lanzetta, P. Ocular Findings in COVID-19 Patients: A Review of Direct Manifestations and Indirect Effects on the Eye. J. Ophthalmol. 2020, 2020, 4827304. [Google Scholar] [CrossRef]
  51. Teo, K.Y.; Invernizzi, A.; Staurenghi, G.; Cheung, C.M.G. COVID-19-Related Retinal Micro-vasculopathy—A Review of Current Evidence. Arch. Ophthalmol. 2021, 235, 98–110. [Google Scholar] [CrossRef]
  52. Sen, S.; Kannan, N.B.; Kumar, J.; Rajan, R.P.; Kumar, K.; Baliga, G.; Reddy, H.; Upadhyay, A.; Ramasamy, K. Retinal manifestations in patients with SARS-CoV-2 infection and pathogenetic implications: A systematic review. Int. Ophthalmol. 2022, 42, 323–336. [Google Scholar] [CrossRef]
  53. Sim, R.; Cheung, G.; Ting, D.; Wong, E.; Wong, T.Y.; Yeo, I.; Wong, C.W. Retinal microvascular signs in COVID-19. Br. J. Ophthalmol. 2022, 106, 1308–1312. [Google Scholar] [CrossRef] [PubMed]
  54. Marinho, P.M.; Marcos, A.A.A.; Romano, A.C.; Nascimento, H.; Belfort, R. Retinal findings in patients with COVID-19. Lancet 2020, 395, 1610. [Google Scholar] [CrossRef] [PubMed]
  55. Vavvas, D.G.; Sarraf, D.; Sadda, S.R.; Eliott, D.; Ehlers, J.P.; Waheed, N.K.; Morizane, Y.; Sakamoto, T.; Tsilimbaris, M.; Miller, J.B. Concerns about the interpretation of OCT and fundus findings in COVID-19 patients in recent Lancet publication. Eye 2020, 34, 2153–2154. [Google Scholar] [CrossRef] [PubMed]
  56. Ouyang, P.; Zhang, X.; Peng, Y.; Jiang, B. Seeking clarity on retinal findings in patients with COVID-19. Lancet 2020, 396, e35. [Google Scholar] [CrossRef]
  57. Burgos-Blasco, B.; Güemes-Villahoz, N.; Vidal-Villegas, B.; Martinez-De-La-Casa, J.M.; Donate-Lopez, J.; Martín-Sánchez, F.J.; González-Armengol, J.J.; Porta-Etessam, J.; Martin, J.L.R.; Garcia-Feijoo, J. Optic nerve and macular optical coherence tomography in recovered COVID-19 patients. Eur. J. Ophthalmol. 2022, 32, 628–636. [Google Scholar] [CrossRef]
  58. Naderi Beni, A.; Dehghani, A.; Kianersi, F.; Ghanbari, H.; Habibidastenae, Z.; Memarzadeh, S.E.; Beni, Z.N. Retinal findings of COVID-19 patients using ocular coherence tomography angiography two to three months after infection: Ocular appearance recovered COVID-19 patient. Photodiagnos. Photodyn. Ther. 2022, 38, 102726. [Google Scholar] [CrossRef]
  59. Oren, B.; Aydemır, G.A.; Aydemır, E.; Atesoglu, H.I.; Goker, Y.S.; Kızıltoprak, H.; Ozcelık, K.C. Quantitative assessment of retinal changes in COVID-19 patients. Clin. Exp. Optom. 2021, 104, 717–722. [Google Scholar] [CrossRef]
  60. Salvi, L.; Plateroti, P.; Balducci, S.; Bollanti, L.; Conti, F.G.; Vitale, M.; Recupero, S.M.; Enrici, M.M.; Fenicia, V.; Pugliese, G. Abnormalities of retinal ganglion cell complex at optical coherence tomography in patients with type 2 diabetes: A sign of diabetic polyneuropathy, not retinopathy. J. Diabetes Complicat. 2016, 30, 469–476. [Google Scholar] [CrossRef]
  61. Patton, N.; Aslam, T.; MacGillivray, T.; Pattie, A.; Deary, I.J.; Dhillon, B. Retinal vascular image analysis as a potential screening tool for cerebrovascular disease: A rationale based on homology between cerebral and retinal microvasculatures. J. Anat. 2005, 206, 319–348. [Google Scholar] [CrossRef]
  62. Zapata, M.Á.; Banderas García, S.; Sánchez-Moltalvá, A.; Falcó, A.; Otero-Romero, S.; Arcos, G.; Velazquez-Villoria, D.; García-Arumí, J. Retinal microvascular abnor-malities in patients after COVID-19 depending on disease severity. Br. J. Ophthalmol. 2022, 106, 559. [Google Scholar] [CrossRef]
  63. Turker, I.C.; Dogan, C.U.; Guven, D.; Kutucu, O.K.; Gul, C. Optical coherence tomography angiography findings in patients with COVID-19. Can. J. Ophthalmol. 2021, 56, 83–87. [Google Scholar] [CrossRef] [PubMed]
  64. Abrishami, M.; Emamverdian, Z.; Shoeibi, N.; Omidtabrizi, A.; Daneshvar, R.; Rezvani, T.S.; Saeedian, N.; Eslami, S.; Mazloumi, M.; Sadda, S.; et al. Optical coherence tomography angiography analysis of the retina in patients recovered from COVID-19: A case-control study. Can. J. Ophthalmol. 2021, 56, 24–30. [Google Scholar] [CrossRef] [PubMed]
  65. González-Zamora, J.; Bilbao-Malavé, V.; Gándara, E.; Casablanca-Piñera, A.; Boquera-Ventosa, C.; Landecho, M.F.; Zarranz-Ventura, J.; García-Layana, A. Retinal Microvascular Impairment in COVID-19 Bilateral Pneumonia Assessed by Optical Coherence Tomography Angiography. Biomedicines 2021, 9, 247. [Google Scholar] [CrossRef] [PubMed]
  66. Hazar, L.; Karahan, M.; Vural, E.; Ava, S.; Erdem, S.; Dursun, M.E.; Keklikçi, U. Macular vessel density in patients recovered from COVID 19. Photodiagnos. Photodyn. Ther. 2021, 34, 102267. [Google Scholar] [CrossRef]
  67. Guemes-Villahoz, N.; Burgos-Blasco, B.; Vidal-Villegas, B.; Donate-López, J.; de la Muela, M.H.; López-Guajardo, L.; Martín-Sánchez, F.J.; García-Feijoó, J. Reduced macular vessel density in COVID-19 patients with and without associated thrombotic events using optical coherence tomography angiography. Graefe’s Arch. Clin. Exp. Ophthalmol. 2021, 259, 2243–2249. [Google Scholar] [CrossRef]
  68. Rodman, J.; Ferraz, M.; Baran, A.; Zhang, B. Optical coherence tomography angiography of retinal vasculature in recovered COVID-19 patients compared to age and ethnic matched controls. Clin. Exp. Optom. 2022, 105, 842–847. [Google Scholar] [CrossRef]
  69. Yılmaz Çebi, A.; Kılıçarslan, O.; Uçar, D. Evaluation of Retinal Microvascular Impairment after COVID-19 and Its Clinical Correlates Using Optical Coherence Tomography Angiography. Turk. J. Ophthalmol. 2022, 52, 324–330. [Google Scholar] [CrossRef]
  70. Cetinkaya, T.; Kurt, M.M.; Akpolat, C. Analysis of swept-source optical coherence tomography angiography measurement al-terations in adult patients recovered from COVID-19. Clin. Exp. Optom. 2022, 105, 848–852. [Google Scholar] [CrossRef]
  71. Abrishami, M.; Hassanpour, K.; Hosseini, S.; Emamverdian, Z.; Ansari-Astaneh, M.R.; Zamani, G.; Gharib, B.; Abrishami, M. Macular vessel density re-duction in patients recovered from COVID-19: A longitudinal optical coherence tomography angiography study. Graefe’s Arch. Clin. Exp. Ophthalmol. 2022, 260, 771–779. [Google Scholar] [CrossRef]
  72. Nageeb Louz, R.E.; Salah Eddin, M.A.; Macky, T.A.; Tolba, D.A.A. Post COVID-19 Retinal Evaluation Using Optical Coherence Tomography Angiography: A Case Control Study. Ocul. Immunol. Inflamm. 2022, 31, 1175–1183. [Google Scholar] [CrossRef]
  73. Cennamo, G.; Reibaldi, M.; Montorio, D.; D’Andrea, L.; Fallico, M.; Triassi, M. Optical Coherence Tomography Angiography Features in Post-COVID-19 Pneumonia Patients: A Pilot Study. Am. J. Ophthalmol. 2021, 227, 182–190. [Google Scholar] [CrossRef] [PubMed]
  74. Bilbao-Malavé, V.; González-Zamora, J.; de Viteri, M.S.; de la Puente, M.; Gándara, E.; Casablanca-Piñera, A.; Boquera-Ventosa, C.; Zarranz-Ventura, J.; Landecho, M.F.; García-Layana, A. Persistent Retinal Microvascular Impairment in COVID-19 Bilateral Pneumonia at 6-Months Follow-Up Assessed by Optical Coherence Tomography Angiography. Biomedicines 2021, 9, 502. [Google Scholar] [CrossRef] [PubMed]
  75. García, S.B.; Aragón, D.; Azarfane, B.; Trejo, F.; Garrell-Salat, X.; Sánchez-Montalvá, A.; Otero-Romero, S.; Garcia-Arumi, J.; Zapata, M.A. Persistent reduction of retinal microvascular vessel density in patients with moderate and severe COVID-19 disease. BMJ Open Ophthalmol. 2022, 7, e000867. [Google Scholar] [CrossRef] [PubMed]
  76. E Murdoch, I.; Morris, S.S.; Cousens, S.N. People and eyes: Statistical approaches in ophthalmology. Br. J. Ophthalmol. 1998, 82, 971–973. [Google Scholar] [CrossRef] [PubMed]
  77. Czakó, C.; István, L.; Benyó, F.; Élő, Á.; Erdei, G.; Horváth, H.; Nagy, Z.Z.; Kovács, I. The Impact of Deterministic Signal Loss on OCT Angiography Measurements. Transl. Vis. Vision Sci. Technol. 2020, 9, 10. [Google Scholar] [CrossRef]
  78. Early Treatment Diabetic Retinopathy Study Research Group. Early Photocoagulation for Diabetic Retinopathy: ETDRS Report Number 9. Ophthalmology 1991, 98, 766–785. [Google Scholar] [CrossRef]
  79. Aslam, T.M.; Hoyle, D.C.; Puri, V.; Bento, G. Differentiation of Diabetic Status Using Statistical and Machine Learning Techniques on Optical Coherence Tomography Angiography Images. Transl. Vis. Sci. Technol. 2020, 9, 2. [Google Scholar] [CrossRef]
  80. Thompson, I.A.; Durrani, A.K.; Patel, S. Optical coherence tomography angiography characteristics in diabetic patients without clinical diabetic retinopathy. Eye 2019, 33, 648–652. [Google Scholar] [CrossRef]
  81. Mastropasqua, R.; Toto, L.; Mastropasqua, A.; Aloia, R.; De Nicola, C.; A Mattei, P.; Di Marzio, G.; Di Nicola, M.; Di Antonio, L. Foveal avascular zone area and parafoveal vessel density measurements in different stages of diabetic retinopathy by optical coherence tomography angiography. Int. J. Ophthalmol. 2017, 10, 1545–1551. [Google Scholar] [CrossRef]
  82. Krawitz, B.D.; Mo, S.; Geyman, L.S.; Agemy, S.A.; Scripsema, N.K.; Garcia, P.M.; Chui, T.Y.; Rosen, R.B. Acircularity index and axis ratio of the foveal avascular zone in diabetic eyes and healthy controls measured by optical coherence tomography angiography. Vis. Res. 2017, 139, 177–186. [Google Scholar] [CrossRef]
  83. The Jamovi Project [Computer Software]. 2021. Available online: http://www.jamovi.org (accessed on 1 January 2020).
  84. National Institute of Health and Care Excellence (NICE). COVID-19 Rapid Evidence Review: Risk Factors for Long-Term Effects of COVID-19; NICE: Sutton-in-Ashfield, UK, 2021; Available online: https://files.magicapp.org/guideline/08d10c67-1331-4146-9471-b15d1d93e707/files/Evidence_review_for_risk_factors_FINAL_r400881.pdf (accessed on 15 March 2023).
  85. Mavi Yildiz, A.; Ucan Gunduz, G.; Yalcinbayir, O.; Acet Ozturk, N.A.; Avci, R.; Coskun, F. SD-OCT assessment of macular and optic nerve alterations in patients recovered from COVID-19. Can. J. Ophthalmol. 2022, 57, 75–81. [Google Scholar] [CrossRef]
  86. Ugurlu, A.; Agcayazi, S.B.; Icel, E.; Budakoglu, O.; Unver, E.; Barkay, O.; Karakeçili, F.; Bayrakceken, K. Assessment of the optic nerve, macular, and retinal vascular effects of COVID-19. Can. J. Ophthalmol. 2022. Available online: https://www.sciencedirect.com/science/article/pii/S0008418222001892 (accessed on 24 April 2023).
  87. Taskiran-Sag, A.; Eroglu, E.; Ozulken, K.; Canlar, S.; Poyraz, B.M.; Sekerlisoy, M.B.; Mumcuoglu, T. Headache and cognitive disturbance correlate with ganglion cell layer thickness in patients who recovered from COVID-19. Clin. Neurol. Neurosurg. 2022, 217, 107263. [Google Scholar] [CrossRef] [PubMed]
  88. Kanra, A.Y.; Altınel, M.G.; Alparslan, F. Evaluation of retinal and choroidal parameters as neurodegeneration biomarkers in patients with post-COVID-19 syndrome. Photodiagnos. Photodyn. Ther. 2022, 40, 103108. [Google Scholar] [CrossRef]
  89. Schlick, S.; Lucio, M.; Wallukat, G.; Bartsch, A.; Skornia, A.; Hoffmanns, J.; Szewczykowski, C.; Schröder, T.; Raith, F.; Rogge, L.; et al. Post-COVID-19 Syndrome: Retinal Microcirculation as a Potential Marker for Chronic Fatigue. Int. J. Mol. Sci. 2022, 23, 13683. [Google Scholar] [CrossRef] [PubMed]
  90. Jevnikar, K.; Meglič, A.; Lapajne, L.; Logar, M.; Valentinčič, N.V.; Petrovič, M.G.; Mekjavić, P.J. The Comparison of Retinal Microvascular Findings in Acute COVID-19 and 1-Year after Hospital Discharge Assessed with Multimodal Imaging—A Prospective Longitudinal Cohort Study. Int. J. Mol. Sci. 2023, 24, 4032. [Google Scholar] [CrossRef] [PubMed]
  91. Jevnikar, K.; Mekjavic, P.J.; Valentincic, N.V.; Petrovski, G.; Petrovic, M.G. An Update on COVID-19 Related Ophthalmic Manifestations. Ocul. Immunol. Inflamm. 2021, 29, 684–689. [Google Scholar] [CrossRef] [PubMed]
  92. de Almeida-Pititto, B.; Dualib, P.M.; Zajdenverg, L.; Dantas, J.R.; de Souza, F.D.; Rodacki, M.; Bertoluci, M.C.; Brazilian Diabetes Society Study Group (SBD). Severity and mortality of COVID 19 in patients with diabetes, hypertension and cardiovascular disease: A meta-analysis. Diabetol. Metab. Syndr. 2020, 12, 75. [Google Scholar] [CrossRef]
  93. Savastano, M.C.; Gambini, G.; Cozzupoli, G.M.; Crincoli, E.; Savastano, A.; De Vico, U.; Culiersi, C.; Falsini, B.; Martelli, F.; Minnella, A.M.; et al. Retinal capillary involvement in early post-COVID-19 patients: A healthy controlled study. Graefe’s Arch. Clin. Exp. Ophthalmol. 2021, 259, 2157–2165. [Google Scholar] [CrossRef]
  94. Szkodny, D.; Wylęgała, E.; Sujka-Franczak, P.; Chlasta-Twardzik, E.; Fiolka, R.; Tomczyk, T.; Wylęgała, A. Retinal OCT Findings in Patients after COVID Infection. J. Clin. Med. 2021, 10, 3233. [Google Scholar] [CrossRef]
  95. Kal, M.; Winiarczyk, M.; Cieśla, E.; Płatkowska-Adamska, B.; Walczyk, A.; Biskup, M.; Pabjan, P.; Głuszek, S.; Odrobina, D.; Mackiewicz, J.; et al. Retinal Microvascular Changes in COVID-19 Bilateral Pneumonia Based on Optical Coherence Tomography Angiography. J. Clin. Med. 2022, 11, 3621. [Google Scholar] [CrossRef]
  96. Chiosi, F.; Campagna, G.; Rinaldi, M.; Manzi, G.; Dell’Omo, R.; Fiorentino, G.; Toro, M.; Tranfa, F.; D’Andrea, L.; Rejdak, M.; et al. Optical Coherence Tomography Angiography Analysis of Vessel Density Indices in Early Post-COVID-19 Patients. Front. Med. 2022, 9, 927121. Available online: https://www.frontiersin.org/articles/10.3389/fmed.2022.927121 (accessed on 24 April 2023). [CrossRef] [PubMed]
Figure 1. Spectral domain-optical coherence tomography (SD-OCT) of the macula obtained from Canon Xephilio OCT-A1 Machine (Canon Medical Systems Europe B.V©, Amstelveen, Netherlands) displaying a 10 × 10 mm macular image from a participant with post-COVID-19 syndrome segmented into nine EDTRS zones. The segments consist of superior outer, superior inner, nasal outer, nasal inner, inferior outer, inferior inner, temporal outer, temporal inner, and foveal (central) zones. (a) Displays the average thickness of the macular retinal nerve fibre layer (mRNFL) in nine EDTRS zones. (b) Displays the average thickness of the macular ganglion cell layer (mGCL) in nine EDTRS zones.
Jimaging 09 00234 g001
Figure 2. Analysis of the macular 10 × 10 mm and 4 × 4 mm optical coherence tomography-angiography (OCT-A) images performed by our inhouse software. (a) 10 × 10 mm macular OCT-Angiography image of the right eye. (b) Binarisation of the 10 × 10 mm macular OCT-A image as a processing step. (c) Final segmentation of the image following removal of optic disc and the central 4 × 4 mm area which was analysed in separate dedicated 4 × 4 mm images (d) 4 × 4 mm macular OCT-Angiography image of the right eye. (e) Binarisation of the 4 × 4 mm macular OCT-A image. (f) Final segmentation of the 4 × 4 mm image with parafoveal and perifoveal zones highlighted.
Jimaging 09 00234 g002
Table 1. Parameters evaluated in the analysis of optical coherence tomography-angiography (OCT-A) images.
10 × 10 mm Image4 × 4 mm Image
Mean large vessel intensityMean capillary intensity
Mean capillary intensityPercentage capillary network (vessel density)
Percentage capillary network (vessel density)Area of the foveal avascular zone (FAZ)
Total area of ischaemiaCircularity of the foveal avascular zone (FAZ)
Table 2. Demographic details and analysis of participants in the post COVID-19 syndrome (PCS) and control cohorts.
TotalPCS GroupControl GroupStatistical TestSignificance p < 0.00357
No. of Patients804040Chi Squared test0.317
Female583127
Male22913
MeanSDMeanSD
Age 47.8010.4044.00 14.60Mann-Whitney U test 0.107
LogMAR Visual Acuity −0.00450.168+0.01650.137Mann-Whitney U test0.302
OCT-A 10 × 10 mm Quality 7.400.677.550.64Mann-Whitney U test0.368
OCT-A 4 × 4 mm Quality 7.680.767.830.90Mann-Whitney U test0.465
SD-OCT Macula Quality 8.180.828.240.65Mann-Whitney U test0.779
Post COVID-19 syndrome, PCS; Standard Deviation, SD; Logarithm of the Minimum Angle of Resolution, LogMAR; Optical coherence tomography-angiography, OCT-A; Spectral-domain optical coherence tomography, SD-OCT. Note: Hₐ μ Control ≠ μ PCS—The two-tailed alternative hypothesis for this study was that there is a significant difference in the measured parameters between the participants with post COVID-19 syndrome (PCS) and healthy control subjects.
Table 3. Categories of clinical symptoms of post-COVID-19 syndrome according to physiological systems.
Physiological SystemClinical Symptoms
SystemicFatigueDizzinessFever
3050
CardiopulmonaryDyspnoeaChest PainPalpitationsPericarditis
238151
Upper RespiratoryBlocked NoseCoughSore ThroatVoice ChangesLaryngeal Disorders *
04012
GastrointestinalNauseaVomitingDiarrhoeaAppetite ChangesAbdominal PainWeight Loss
100011
MusculoskeletalJoint PainMuscle PainWorsened Mobility
330
Neurological Or NeuromuscularHeadacheHyposmia/
Anosmia
Hypogeusia/
Ageusia
Paraesthesia
10331
PsychologicalAnxietyDepressionPost-Traumatic Stress Disorder (PTSD)Sleep Disturbances
1202
NeurocognitiveCognitive Dysfunction i.e., Brain Fog (Reduced Memory And/Or Concentration)Cognitive ImpairmentConfusion
1600
OphthalmicVision DisturbancesDry Eyes
311
AuditoryReduced HearingTinnitus
11
OtherHair LossPost-Menopausal BleedingRestless Legs
011
* Sensation of Intermittent Laryngeal Obstruction; Coughing Hypersensitivity Related Inducible Laryngeal Obstruction.
Table 4. Analysis of optical coherence tomography-angiography (OCT-A) parameters in the post-COVID-19 syndrome (PCS) cohort compared with the control cohort.
Shapiro-WilkStatistical TestStatisticdfp < 0.00357
Cohort
Category
N Mean SD W p
Mean Large Vessel Intensity (10 × 10 mm)PCS40225.1332.9780.9670.298Student’s t0.543578.00.588
Control40225.4802.7390.9650.243
Mean Capillary Intensity (10 × 10 mm)PCS40136.5045.6870.887<0.001Mann-Whitney U628 0.099
Control40134.0353.8500.9860.890
Percentage Capillary Network (Vessel Densities) (10 × 10 mm)PCS4045.6371.2960.9780.632Mann-Whitney U630 0.103
Control4044.9341.8270.827<0.001
Total Area of Ischaemia (10 × 10 mm)PCS40203.400680.8470.342<0 .001Mann-Whitney U763 0.541
Control40198.000683.6380.331<0.001
Percentage Capillary Network (Vessel Densities) (4 × 4 mm)PCS4041.1921.2400.9860.888Student’s t−0.132778.00.895
Control4041.1471.7460.9500.073
Mean Capillary Intensity (4 × 4 mm)PCS20139.2454.3230.949<0.359Mann-Whitney U217 0.350
Control26140.5126.0280.795<0.001
Area of Foveal Avascular Zone (FAZ) (4 × 4 mm)PCS401917.725405.8800.573<0.001Mann-Whitney U715 0.399
Control401925.050389.7840.589<0.001
Circularity of Foveal Avascular Zone (FAZ) (4 × 4 mm)PCS400.8970.1940.702<0.001Mann-Whitney U699 0.319
Control400.8690.2020.775<0 .001
Post COVID-19 syndrome, PCS; Standard Deviation, SD; Shapiro Wilk test statistic, W; Degrees of Freedom, df. Note: Hₐ μ Control ≠ μ PCS—The two-tailed alternative hypothesis for this study was that there is a significant difference in the measured parameters between the participants with post COVID-19 syndrome (PCS) and healthy control subjects.
Table 5. Analysis of the thickness (microns) of the macular retinal nerve fibre layer (RNFL) and ganglion cell layer (GCL) in the post COVID-19 syndrome (PCS) group (n = 39) and control group (n = 34).
Shapiro-Wilk TestStatistical TestStatisticdfp < 0.00357
Mean Thickness
(Microns)
Cohort
Category
Mean SD W p
Mean Outer Segment mRNFLPCS36.115.230.9300.018Mann-Whitney U617 0.615
Control35.314.660.9780.698
Mean Inner Segment mRNFLPCS21.712.300.9590.166Student’s t1.100771.00.275
Control21.181.780.9450.085
Foveal (Central) Segment mRNFLPCS8.671.900.9130.005Mann-Whitney U654 0.920
Control8.652.520.9280.027
Mean Outer Segment mGCLPCS30.343.480.9730.454Mann-Whitney U599 0.479
Control31.635.050.706<0.001
Mean Inner Segment mGCLPCS50.425.960.9460.058Mann-Whitney U645 0.842
Control50.955.910.9310.033
Foveal (Central) Segment mGCLPCS19.855.940.865<0.001Mann-Whitney U638 0.786
Control19.355.710.9650.328
Post COVID-19 syndrome, PCS; Macular Retinal Nerve Fibre Layer, mRNFL; Macular Ganglion Cell Layer, mGCL; Standard Deviation, SD; Shapiro Wilk test statistic, W; Degrees of Freedom, df. Note: Hₐ μ Control ≠ μ PCS—The two-tailed alternative hypothesis for this study was that there is a significant difference in the measured parameters between the participants with post COVID-19 syndrome (PCS) and healthy control subjects.
Table 6. Analysis of the thickness (microns) of the macular retinal nerve fibre layer (RNFL) and ganglion cell layer (GCL) in patients with post COVID-19 syndrome (PCS) and neurocognitive symptoms (n = 24) compared to post COVID-19 syndrome patients without neurocognitive symptoms (n = 15).
Shapiro–WilkStatistical TestStatisticdfp < 0.00357
Mean Thickness (Microns) Neurocognitive Symptoms Mean SD W p
Mean Outer mRNFLY36.155.620.8610.003Mann-Whitney U167 0.707
N36.054.740.9390.367
Mean Inner mRNFLY21.792.350.9170.050Student’s t0.272237.00.787
N21.582.280.9570.647
Foveal (Central) mRNFLY8.881.730.9060.029Mann-Whitney U157 0.510
N8.332.160.9260.234
Mean Outer mGCLY30.613.100.9290.091Student’s t0.619337.00.540
N29.904.090.9540.581
Mean Inner mGCLY50.805.470.9350.127Student’s t0.505637.00.616
N49.806.830.9340.315
Foveal (Central) mGCLY20.545.160.8700.005Mann-Whitney U129 0.140
N18.737.060.8230.007
Macular Retinal Nerve Fibre Layer, mRNFL; Macular Ganglion Cell Layer, mGCL; Neurocognitive symptoms present, Y; Neurocognitive symptoms not present, N; Standard Deviation, SD; Shapiro Wilk test statistic, W; Degrees of Freedom, df. Note: Hₐ μ Y ≠ μ N—The two-tailed alternative hypothesis was that there is a significant difference in the measured parameters between the participants with post COVID-19 syndrome (PCS) with neurocognitive symptoms and those without neurocognitive symptoms.
Table 7. Linear regression analysis of independent variables (age, gender, length since initial infection) and dependent variable, mean capillary intensity, measured on 10 × 10 mm optical coherence tomography-angiography (OCT-A) Image.
Model RR2
10.1640.0288
Normality Test (Shapiro–Wilk)Statistic (W)p
0.9280.014
Independent VariablesEstimateSEtp
Intercept ᵃ139.0615.359625.7593<0 .001
Age0.009540.09670.09860.922
Gender:
F—M0.098852.30940.04280.966
Length Since Initial COVID-19 Infection−0.136360.1387−0.98320.332
Correlation between the independent and the dependent variable, R; The proportion of variance in the dependent variable that can be explained by the independent variable, R2; Normality of the dependent variable, Shapiro–Wilk Statistic (W) and p value; Reference Level, Intercept ᵃ; Standard Error, SE; The number of standard errors the estimated coefficient is away from the hypothesised value, t; Determines if there is a significant relationship between an independent and dependent variable in the model, p.
Disclaimer/Publisher’s Note: The statements, opinions and data contained in all publications are solely those of the individual author(s) and contributor(s) and not of MDPI and/or the editor(s). MDPI and/or the editor(s) disclaim responsibility for any injury to people or property resulting from any ideas, methods, instructions or products referred to in the content.

