
EDNC: Ensemble Deep Neural Network for COVID-19 Recognition


Abstract
:1. Introduction
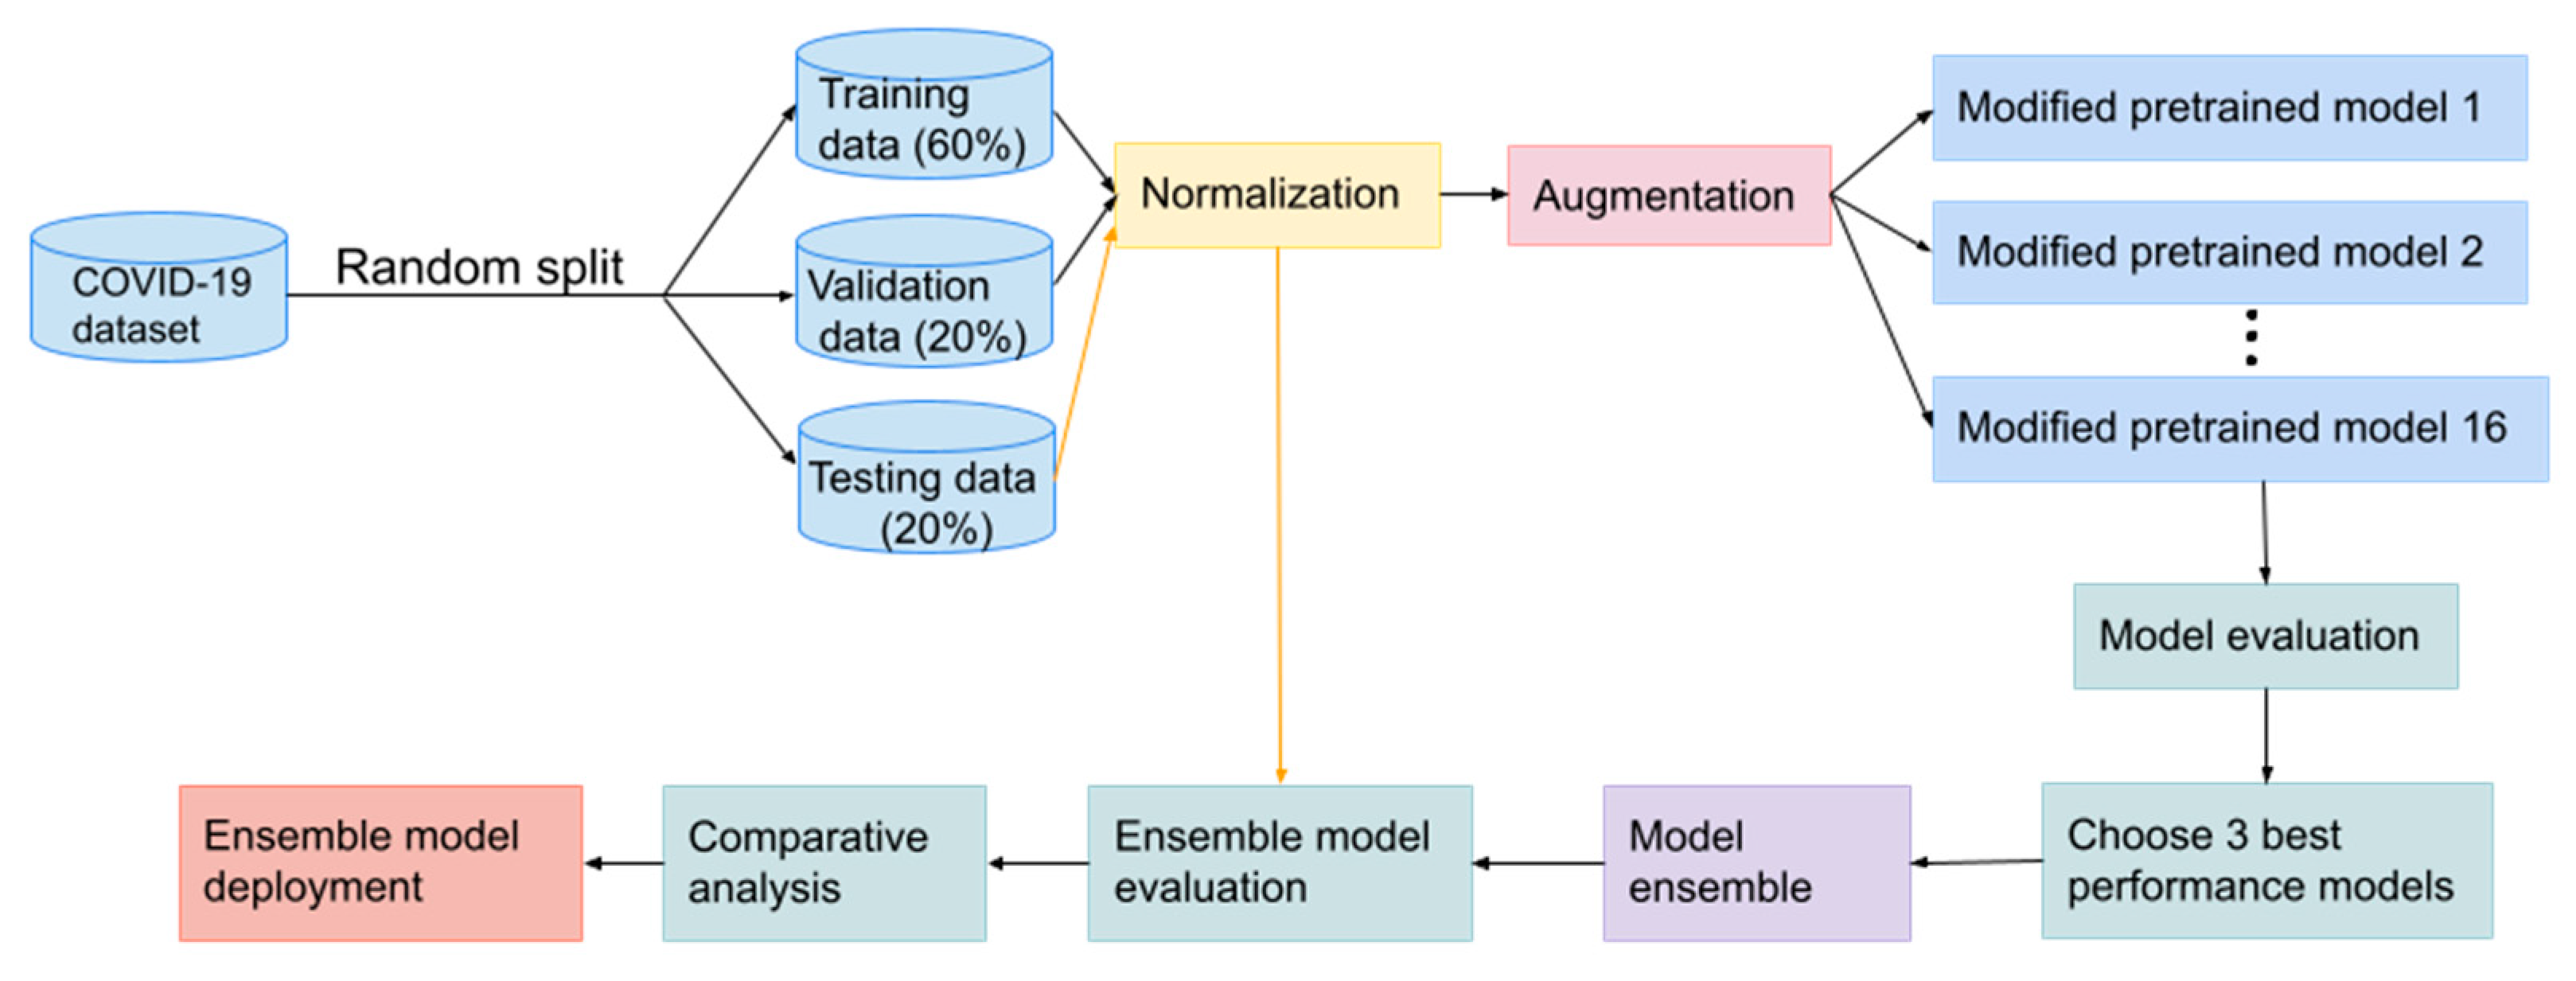
- We propose EDNC (F-EDNC, FC-EDNC, and O-EDNC) ensemble deep neural network for COVID-19 recognition, which helps clinicians rapidly and accurately analyze and recognize COVID-19 lung infections from chest CT scans.
- A deep neural network named CANet has been developed and built from scratch for comparative analysis with EDNC.
- Our proposed F-EDNC has achieved an accuracy of 97.55%, followed by FC-EDNC (97.14%) and O-EDNC (96.32%).
- A web application allows users to use F-EDNC easily.
2. Materials and Methods
2.1. The Dataset
2.1.1. Main Dataset
2.1.2. Alternative Dataset
2.1.3. DICOM Format Dataset
2.2. Data Preprocessing
2.3. Modelling
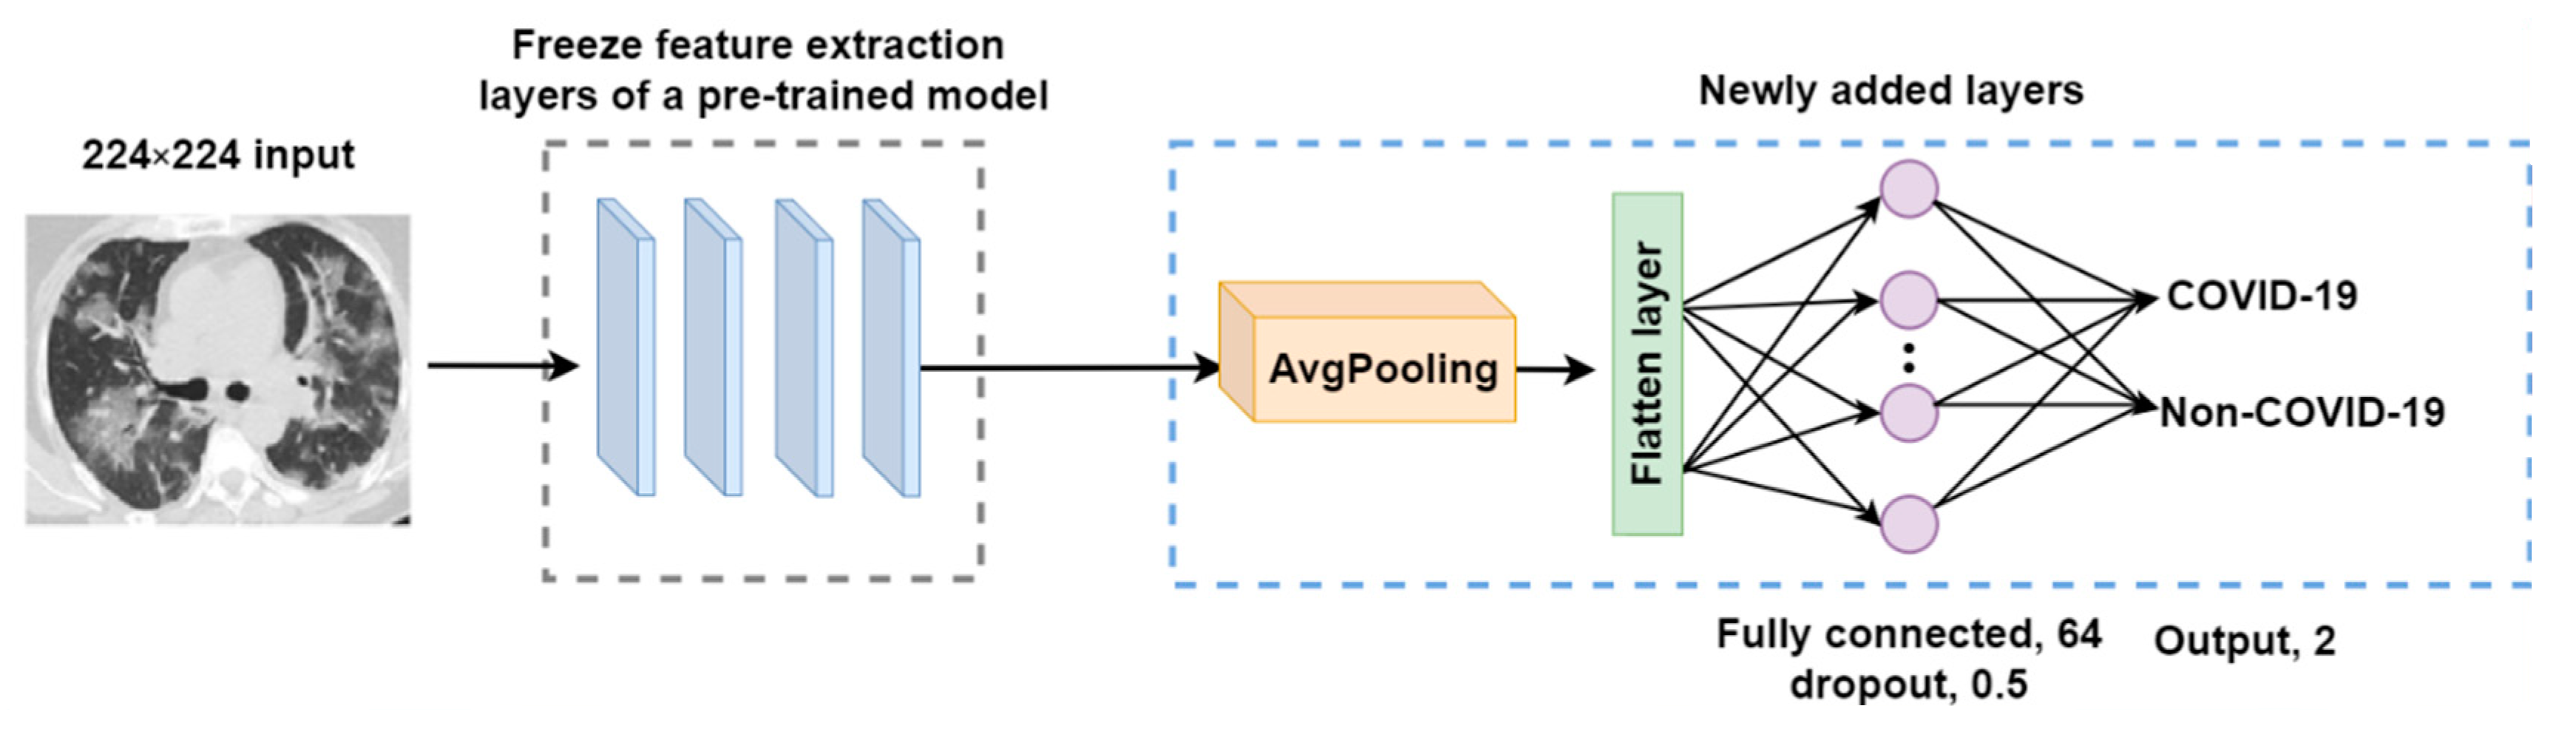
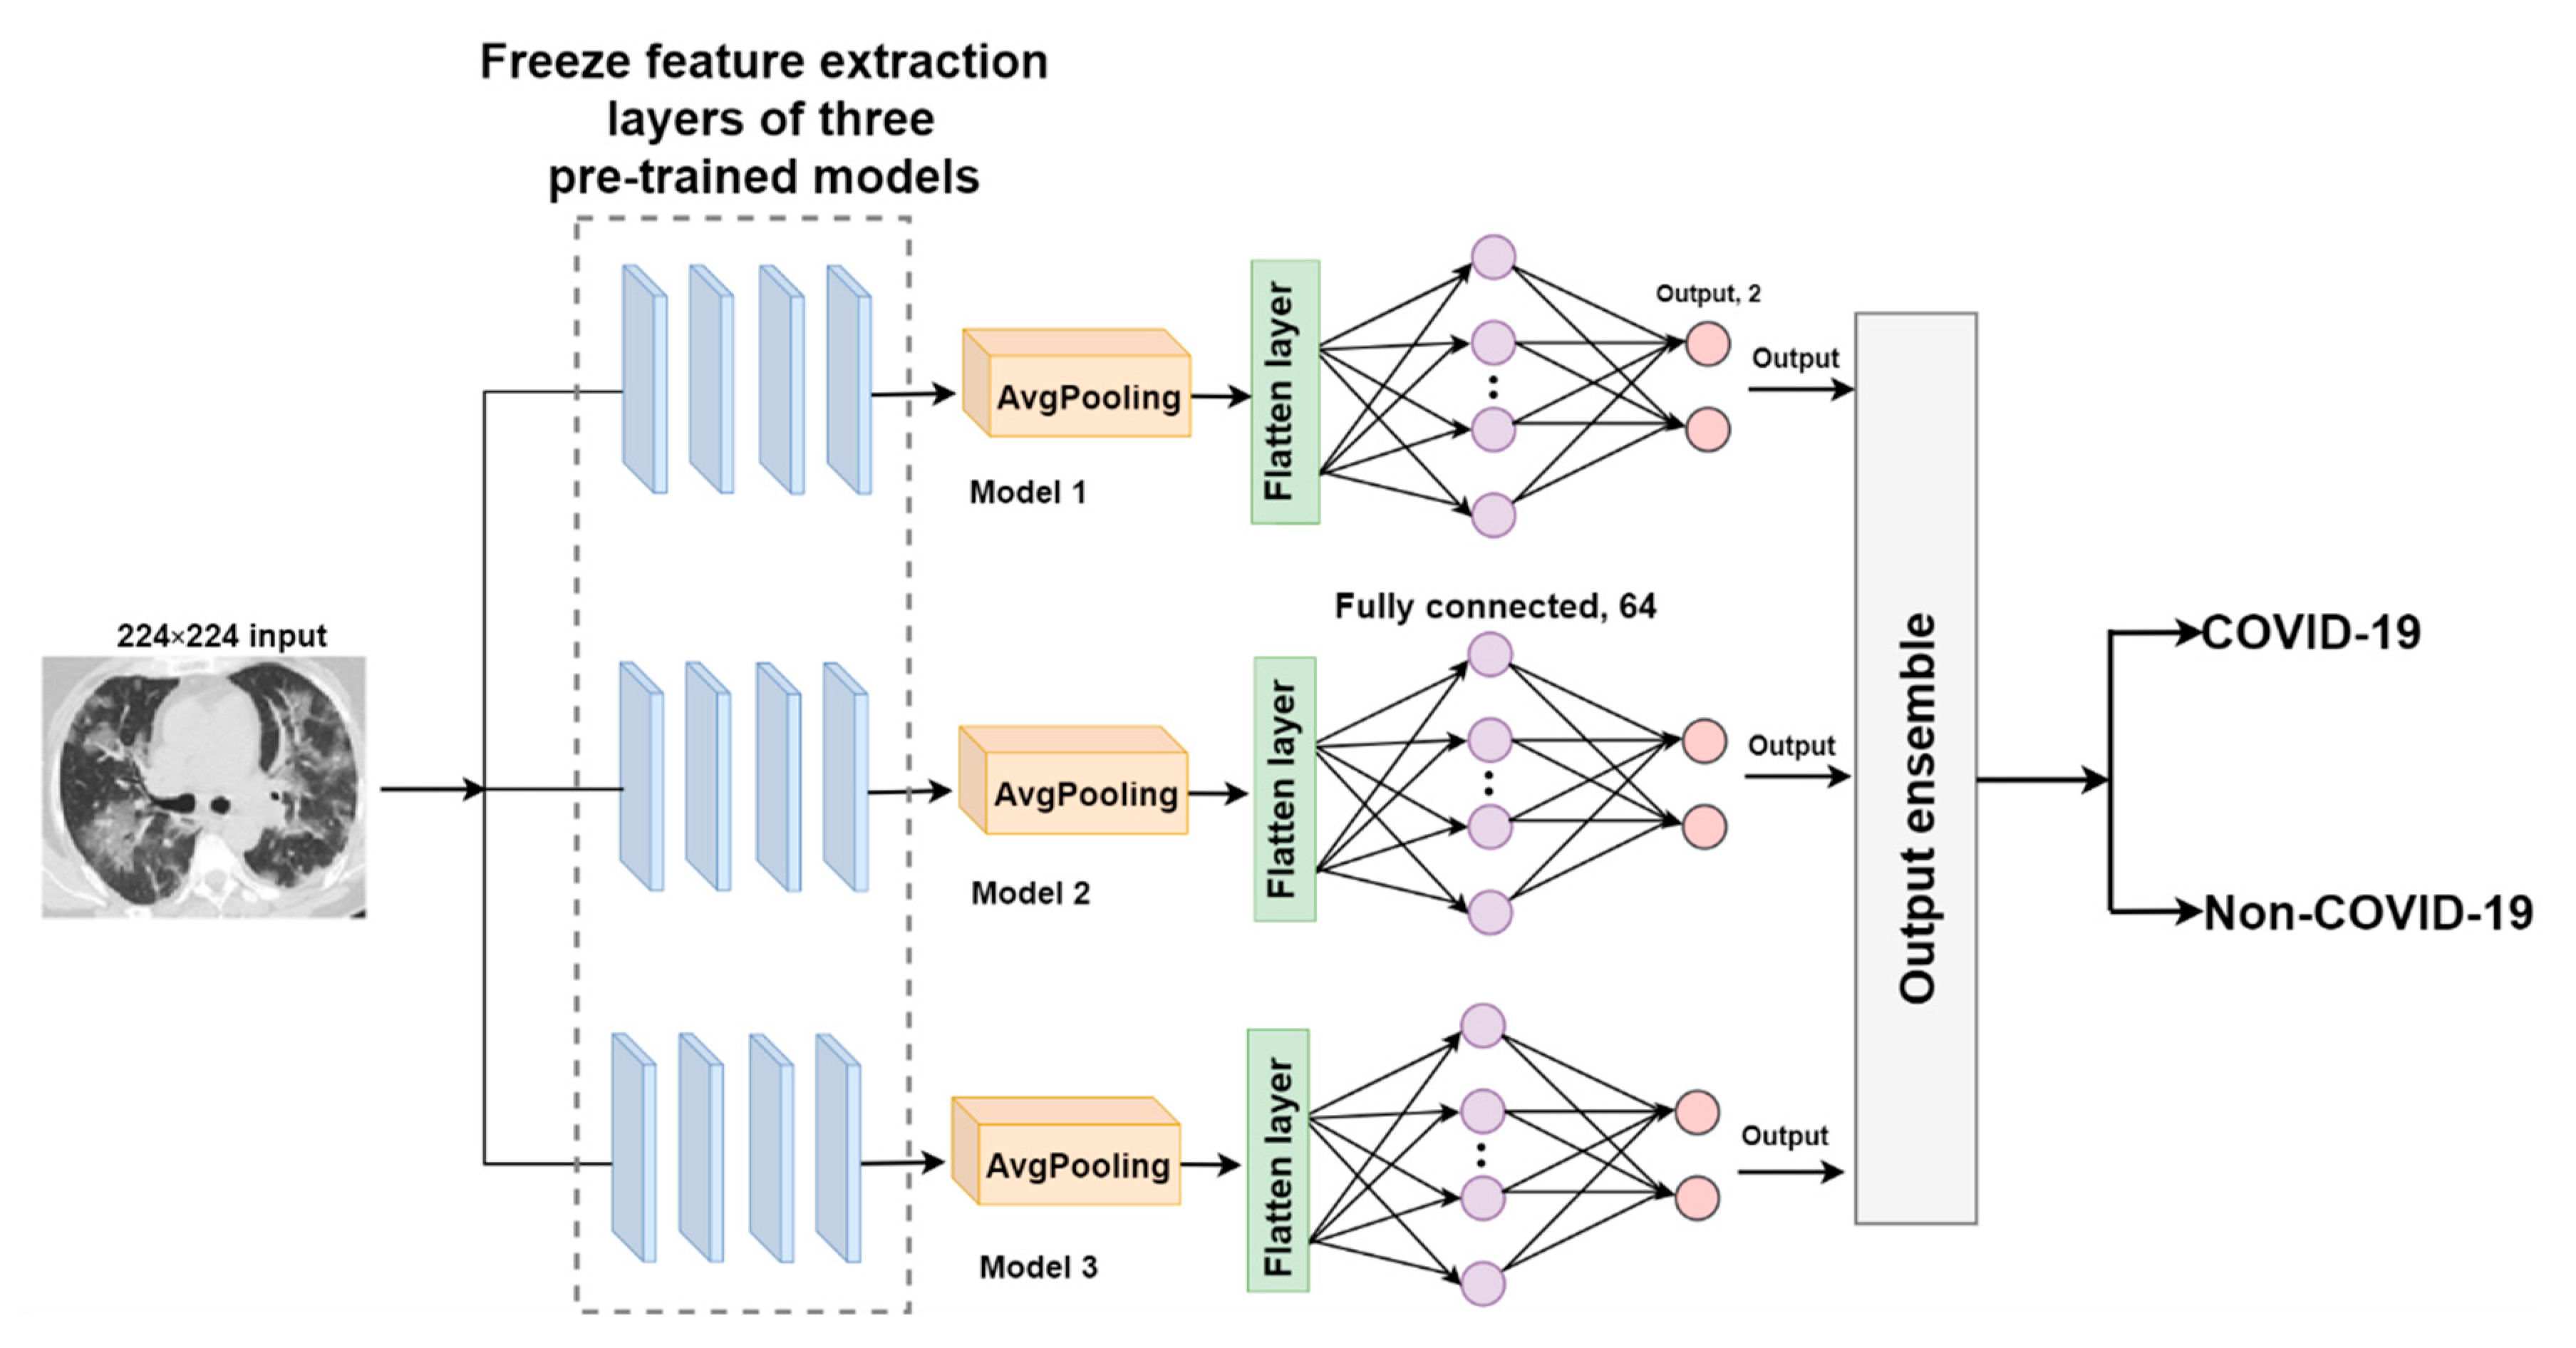
2.3.1. Transfer Learning Models
- An average pooling layer, which produces a down-sampled feature map by averaging the values of all pixels in each batch of the feature map, and the calculating procedure is shown in Figure 4. The output size of the pooling layer is calculated as follows:where represents the input size of the pooling operation. is the size of the pooling filter. is the stride size;
- A flattened layer to convert the down-sampled feature map to a one-dimensional array;
- A fully connected layer with 64 filters and a Rectified Linear Unit (ReLU) activation to connect each neuron in layers before and after. ReLU helps to solve the problem of vanishing gradients. It is calculated using the equation below.
- A dropout layer with a 0.5 dropout ratio to mitigate model overfitting problems;
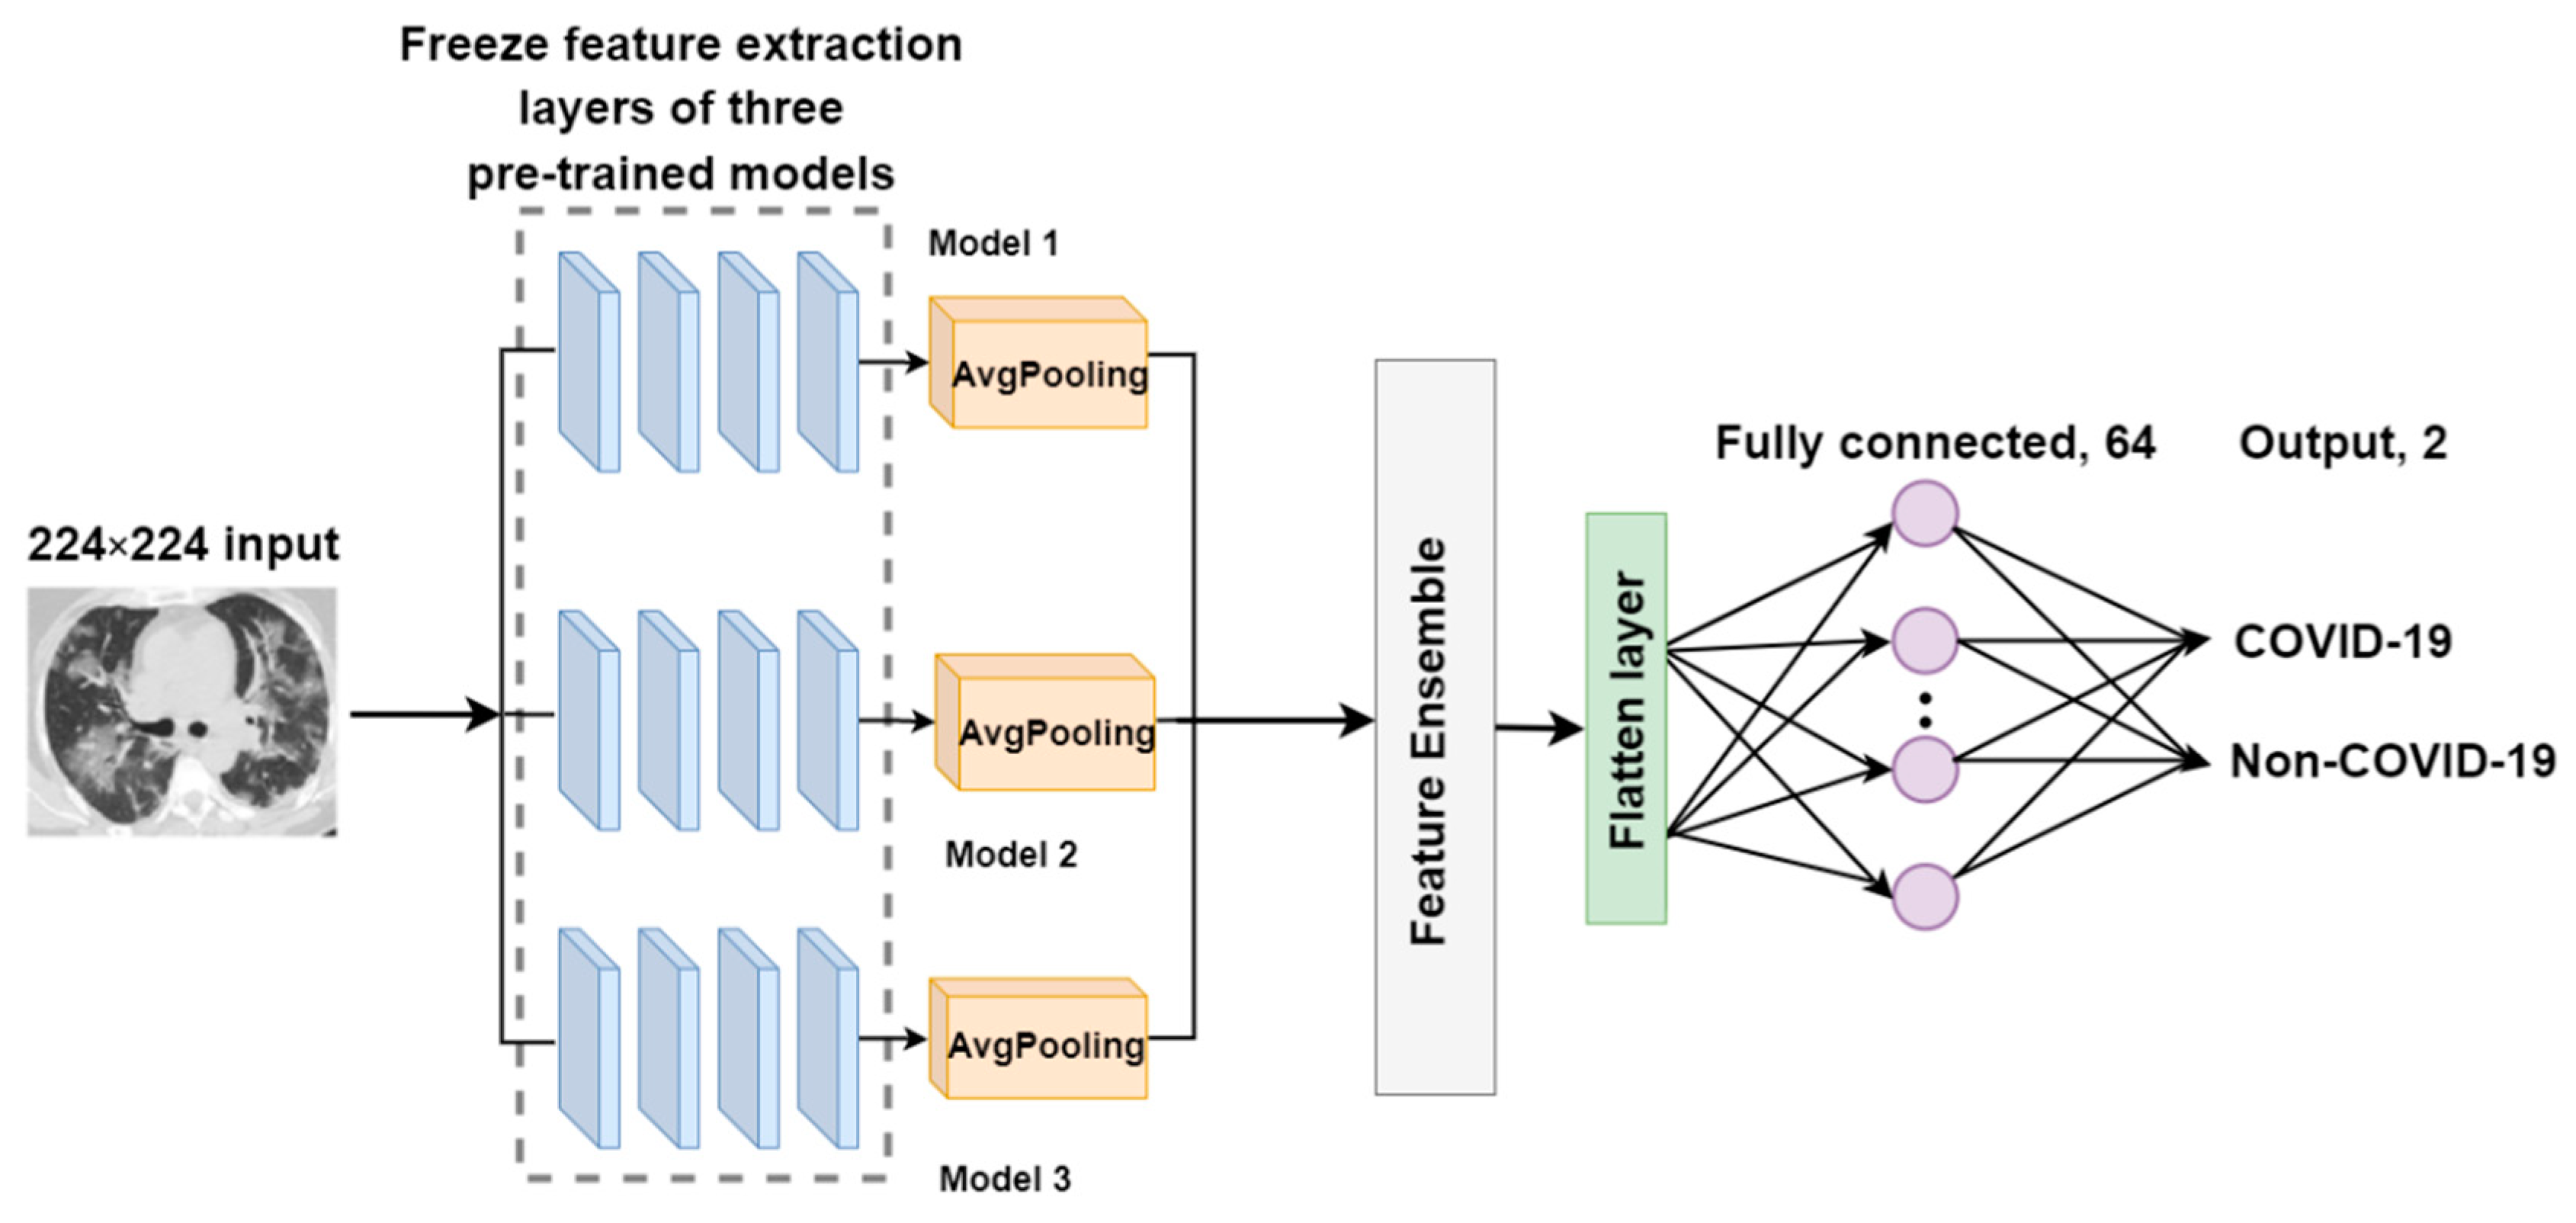
2.3.2. The Proposed EDNC Architectures
F-EDNC
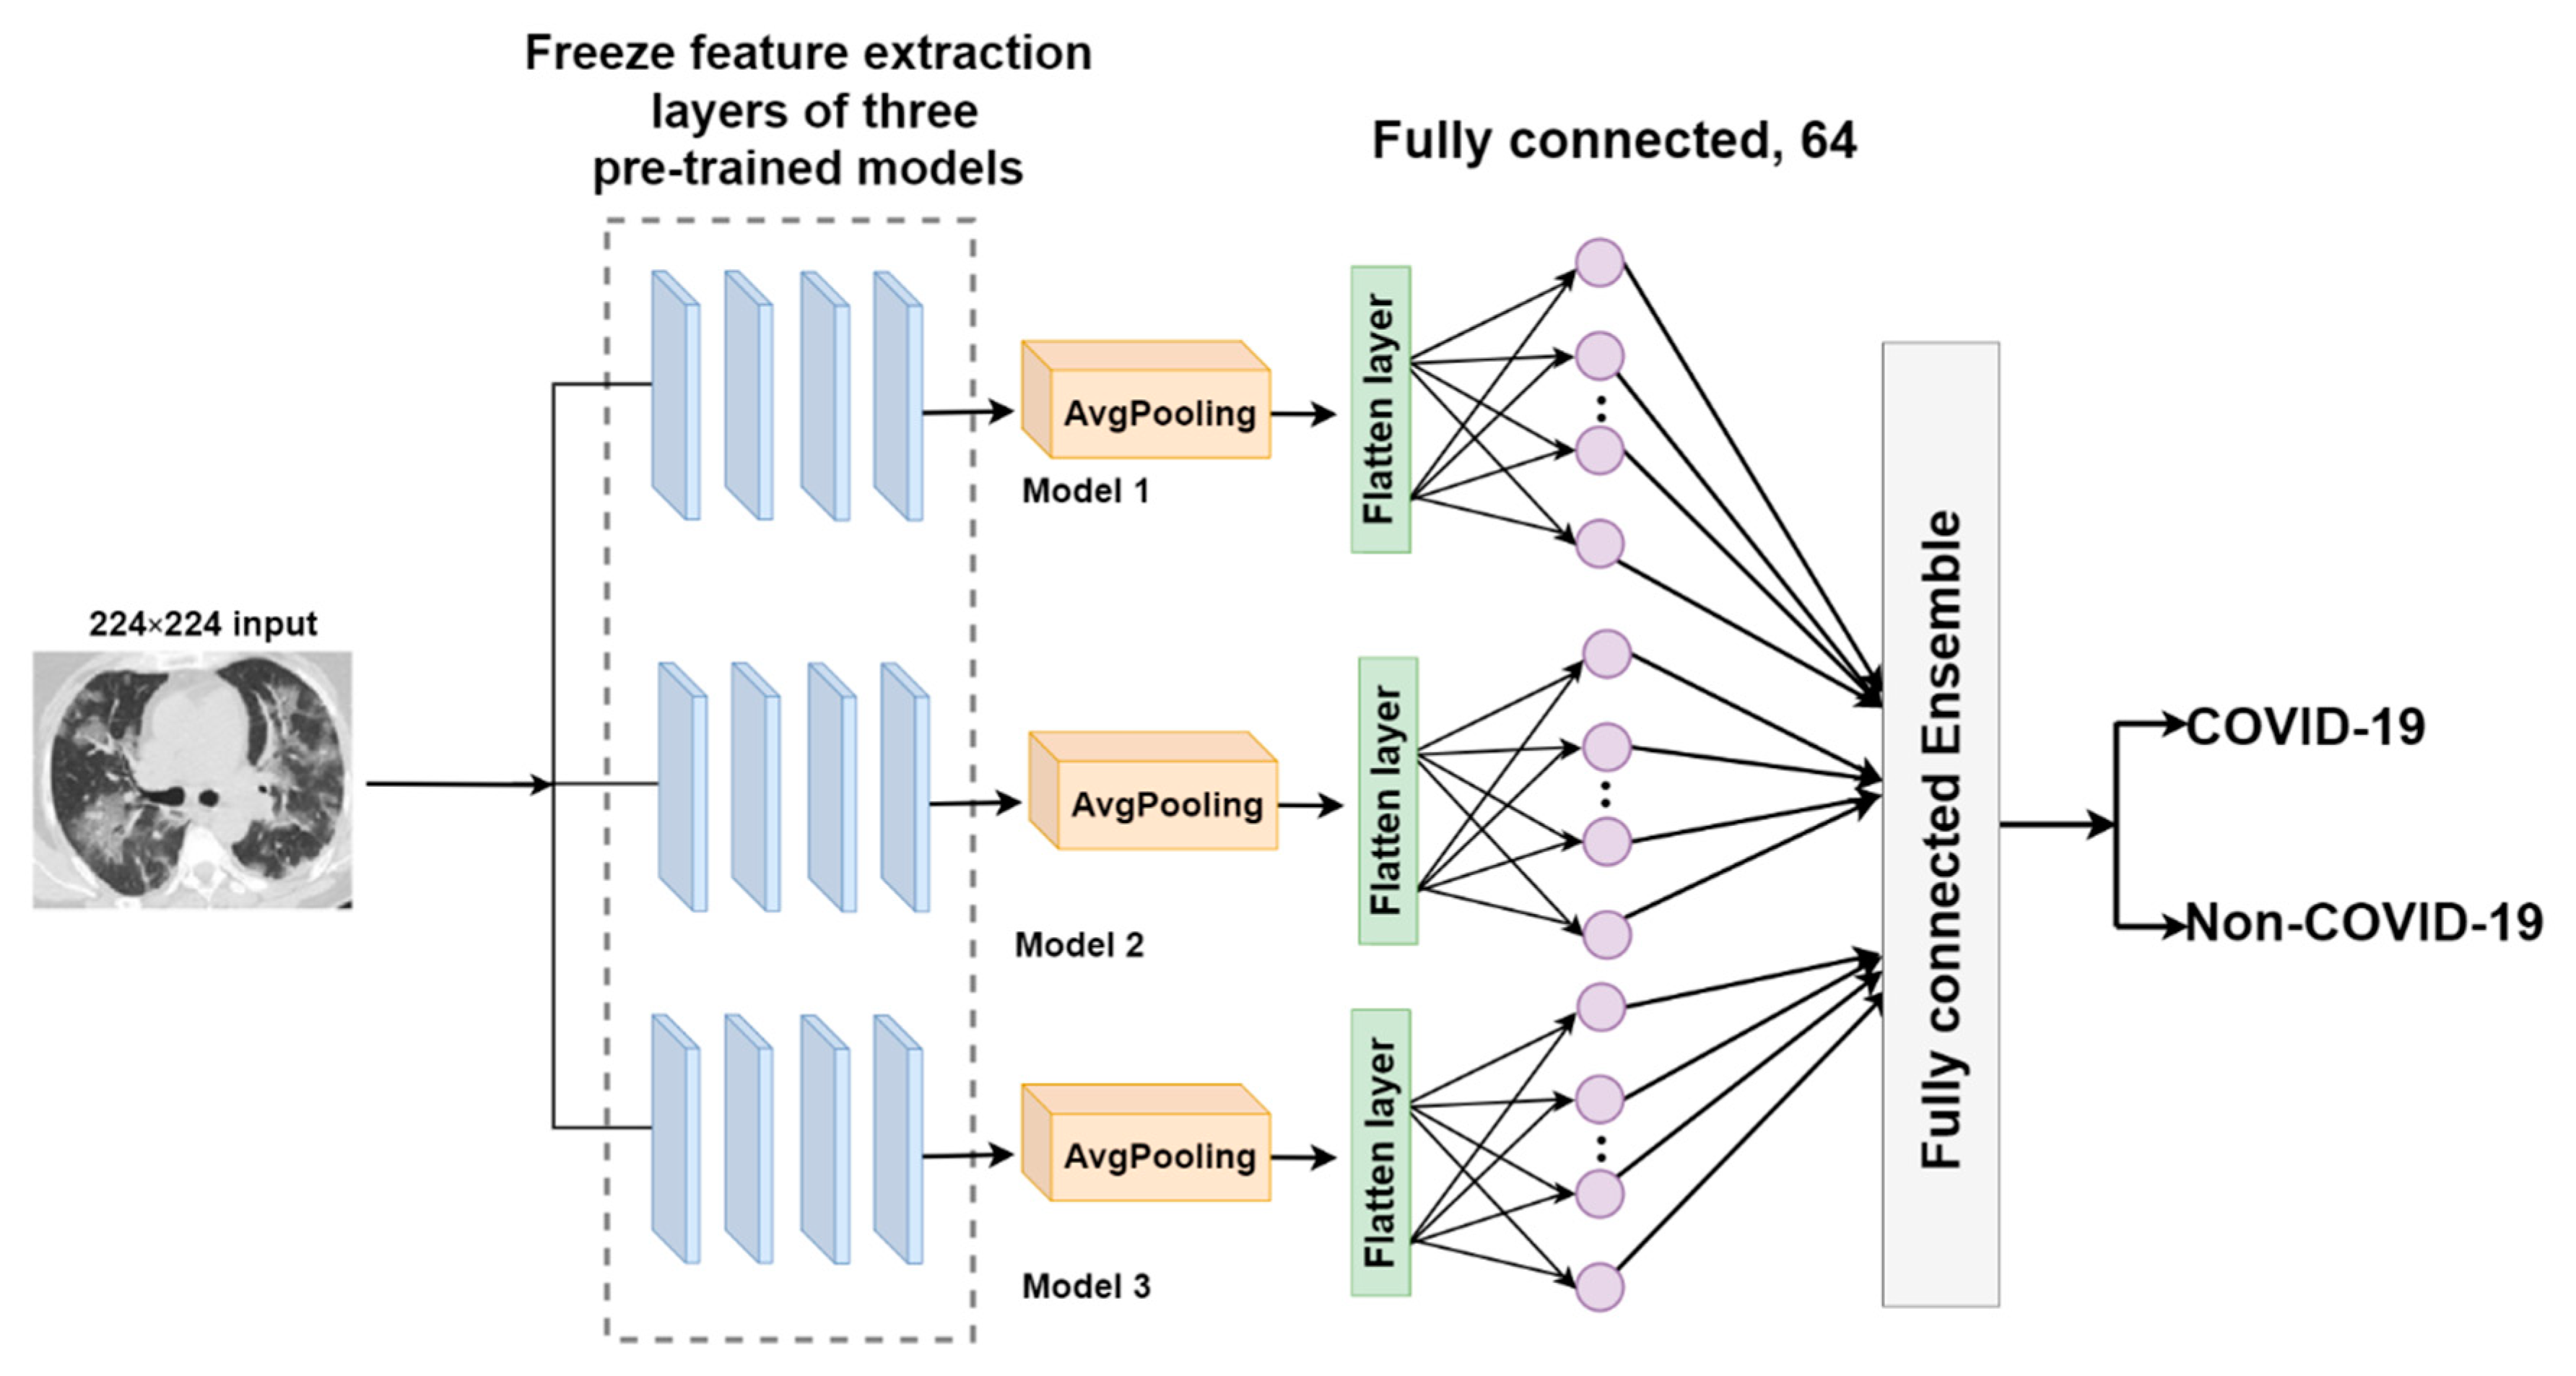
FC-EDNC
O-EDNC
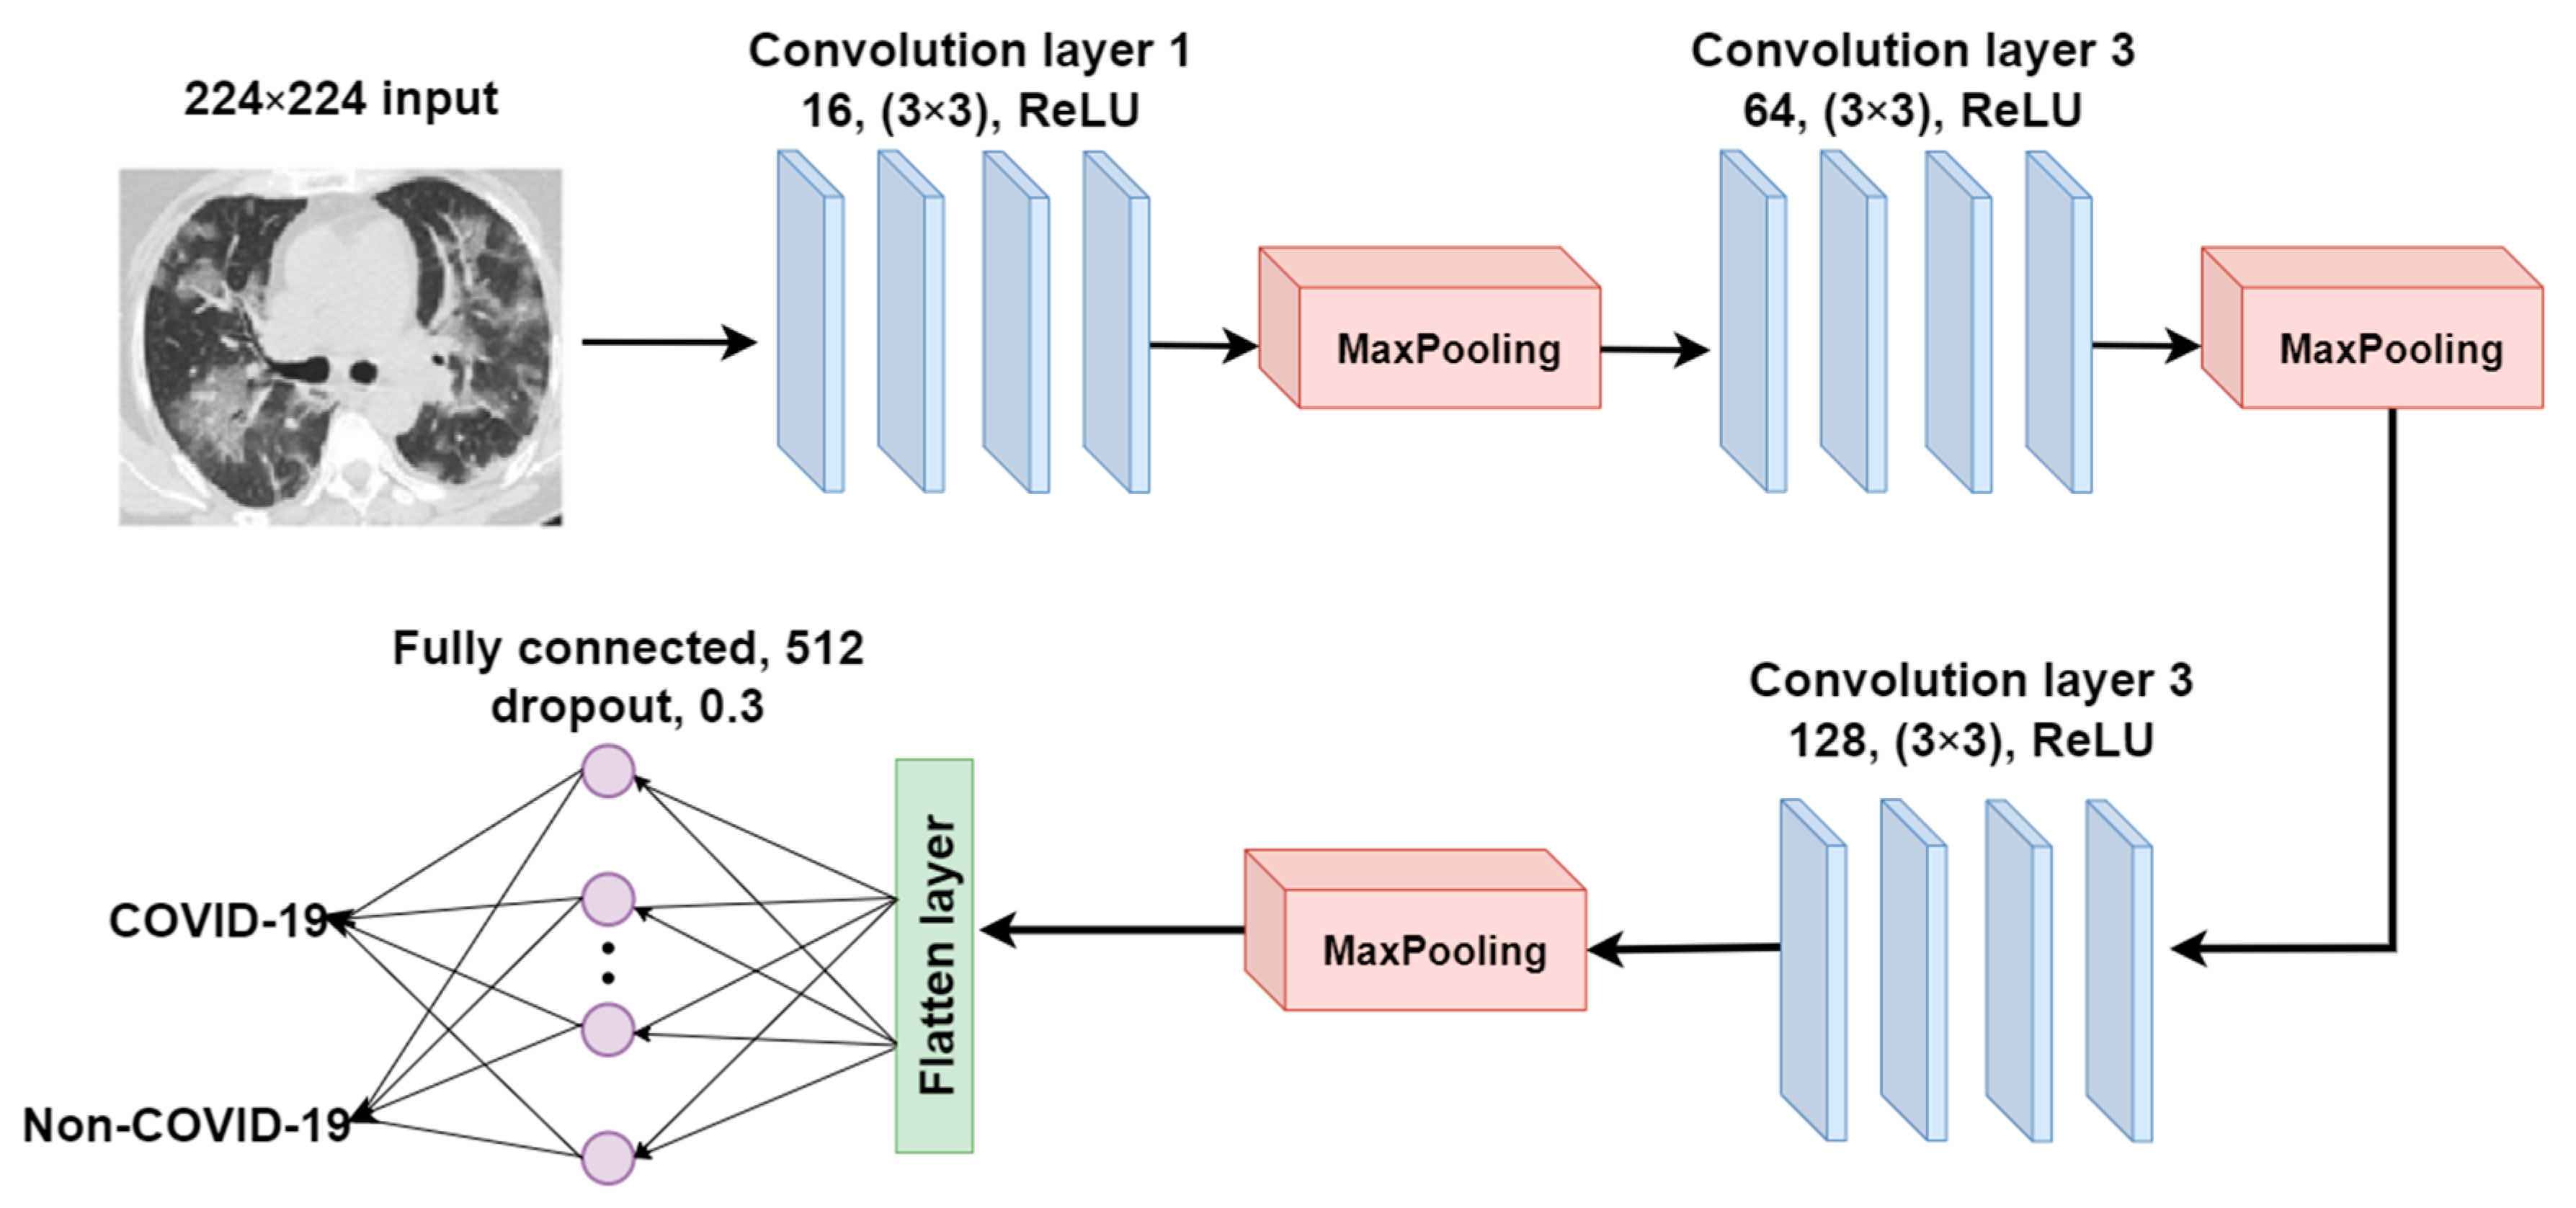
2.3.3. CANet: A Self-Build CNN Model for Comparative Analysis
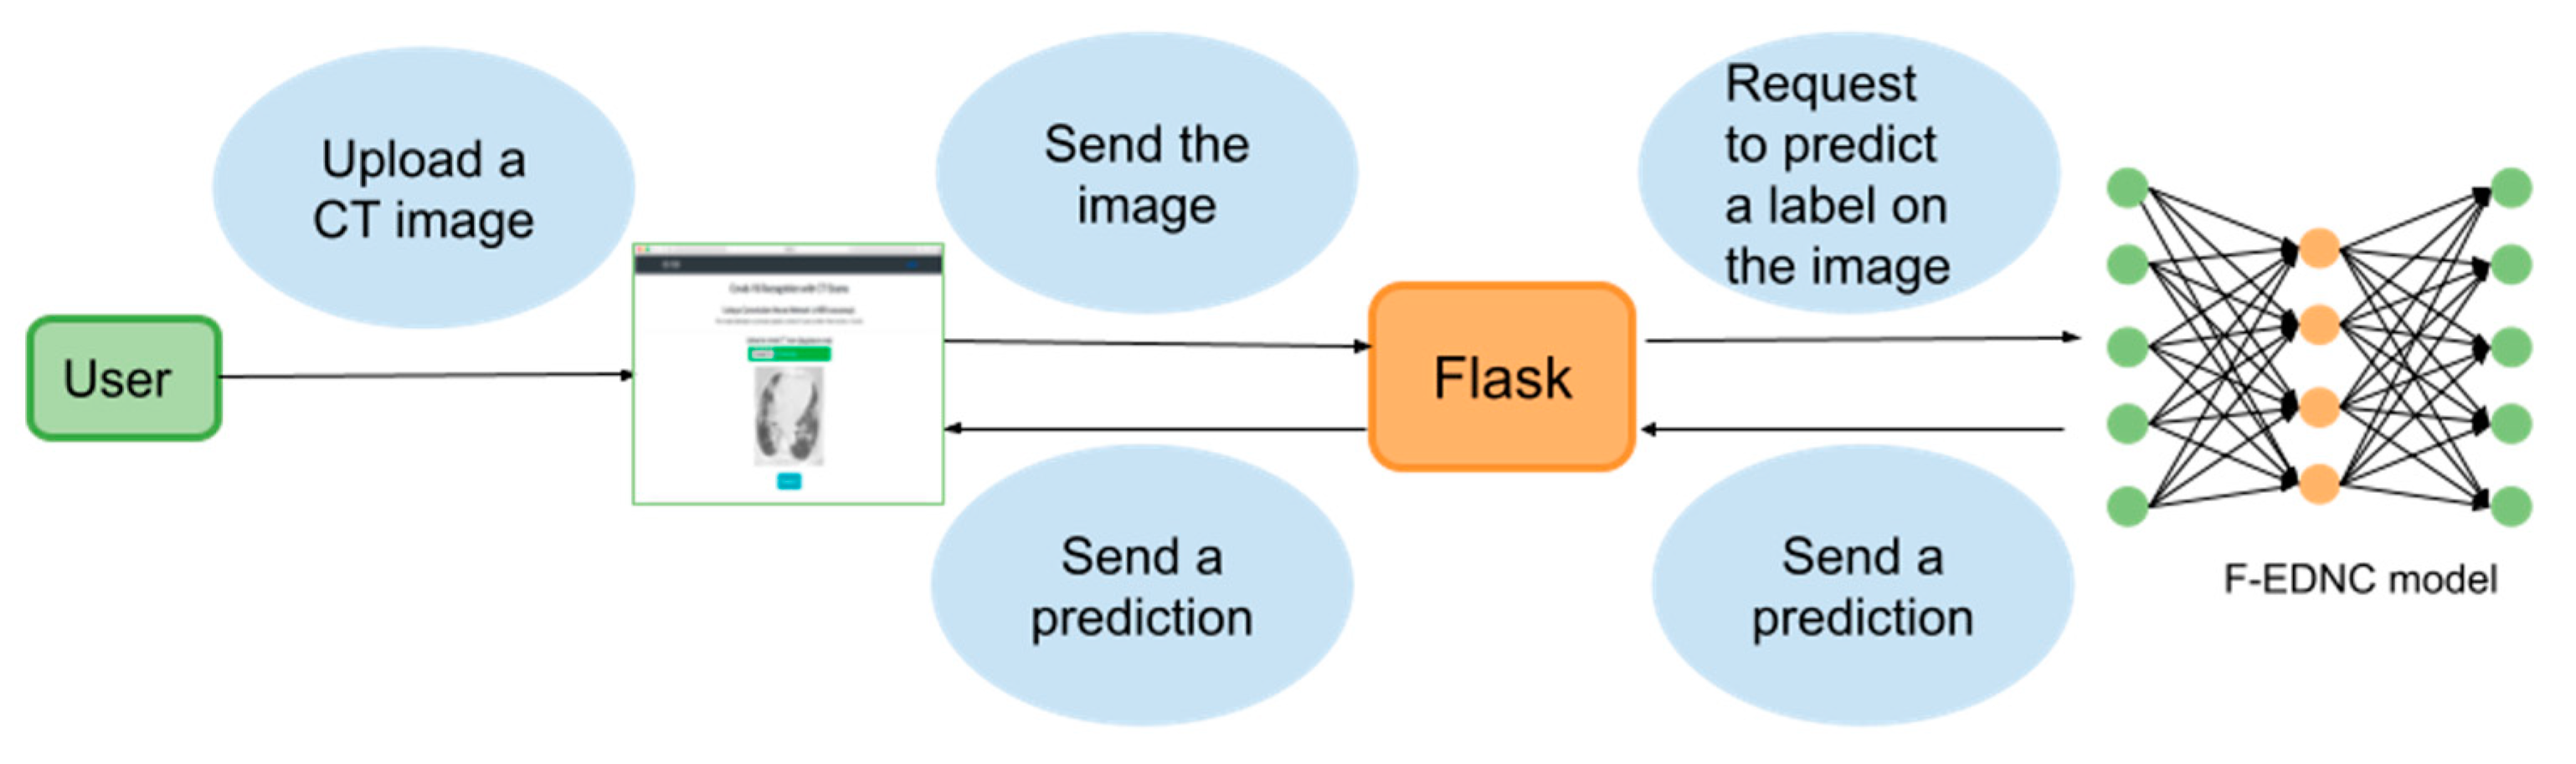
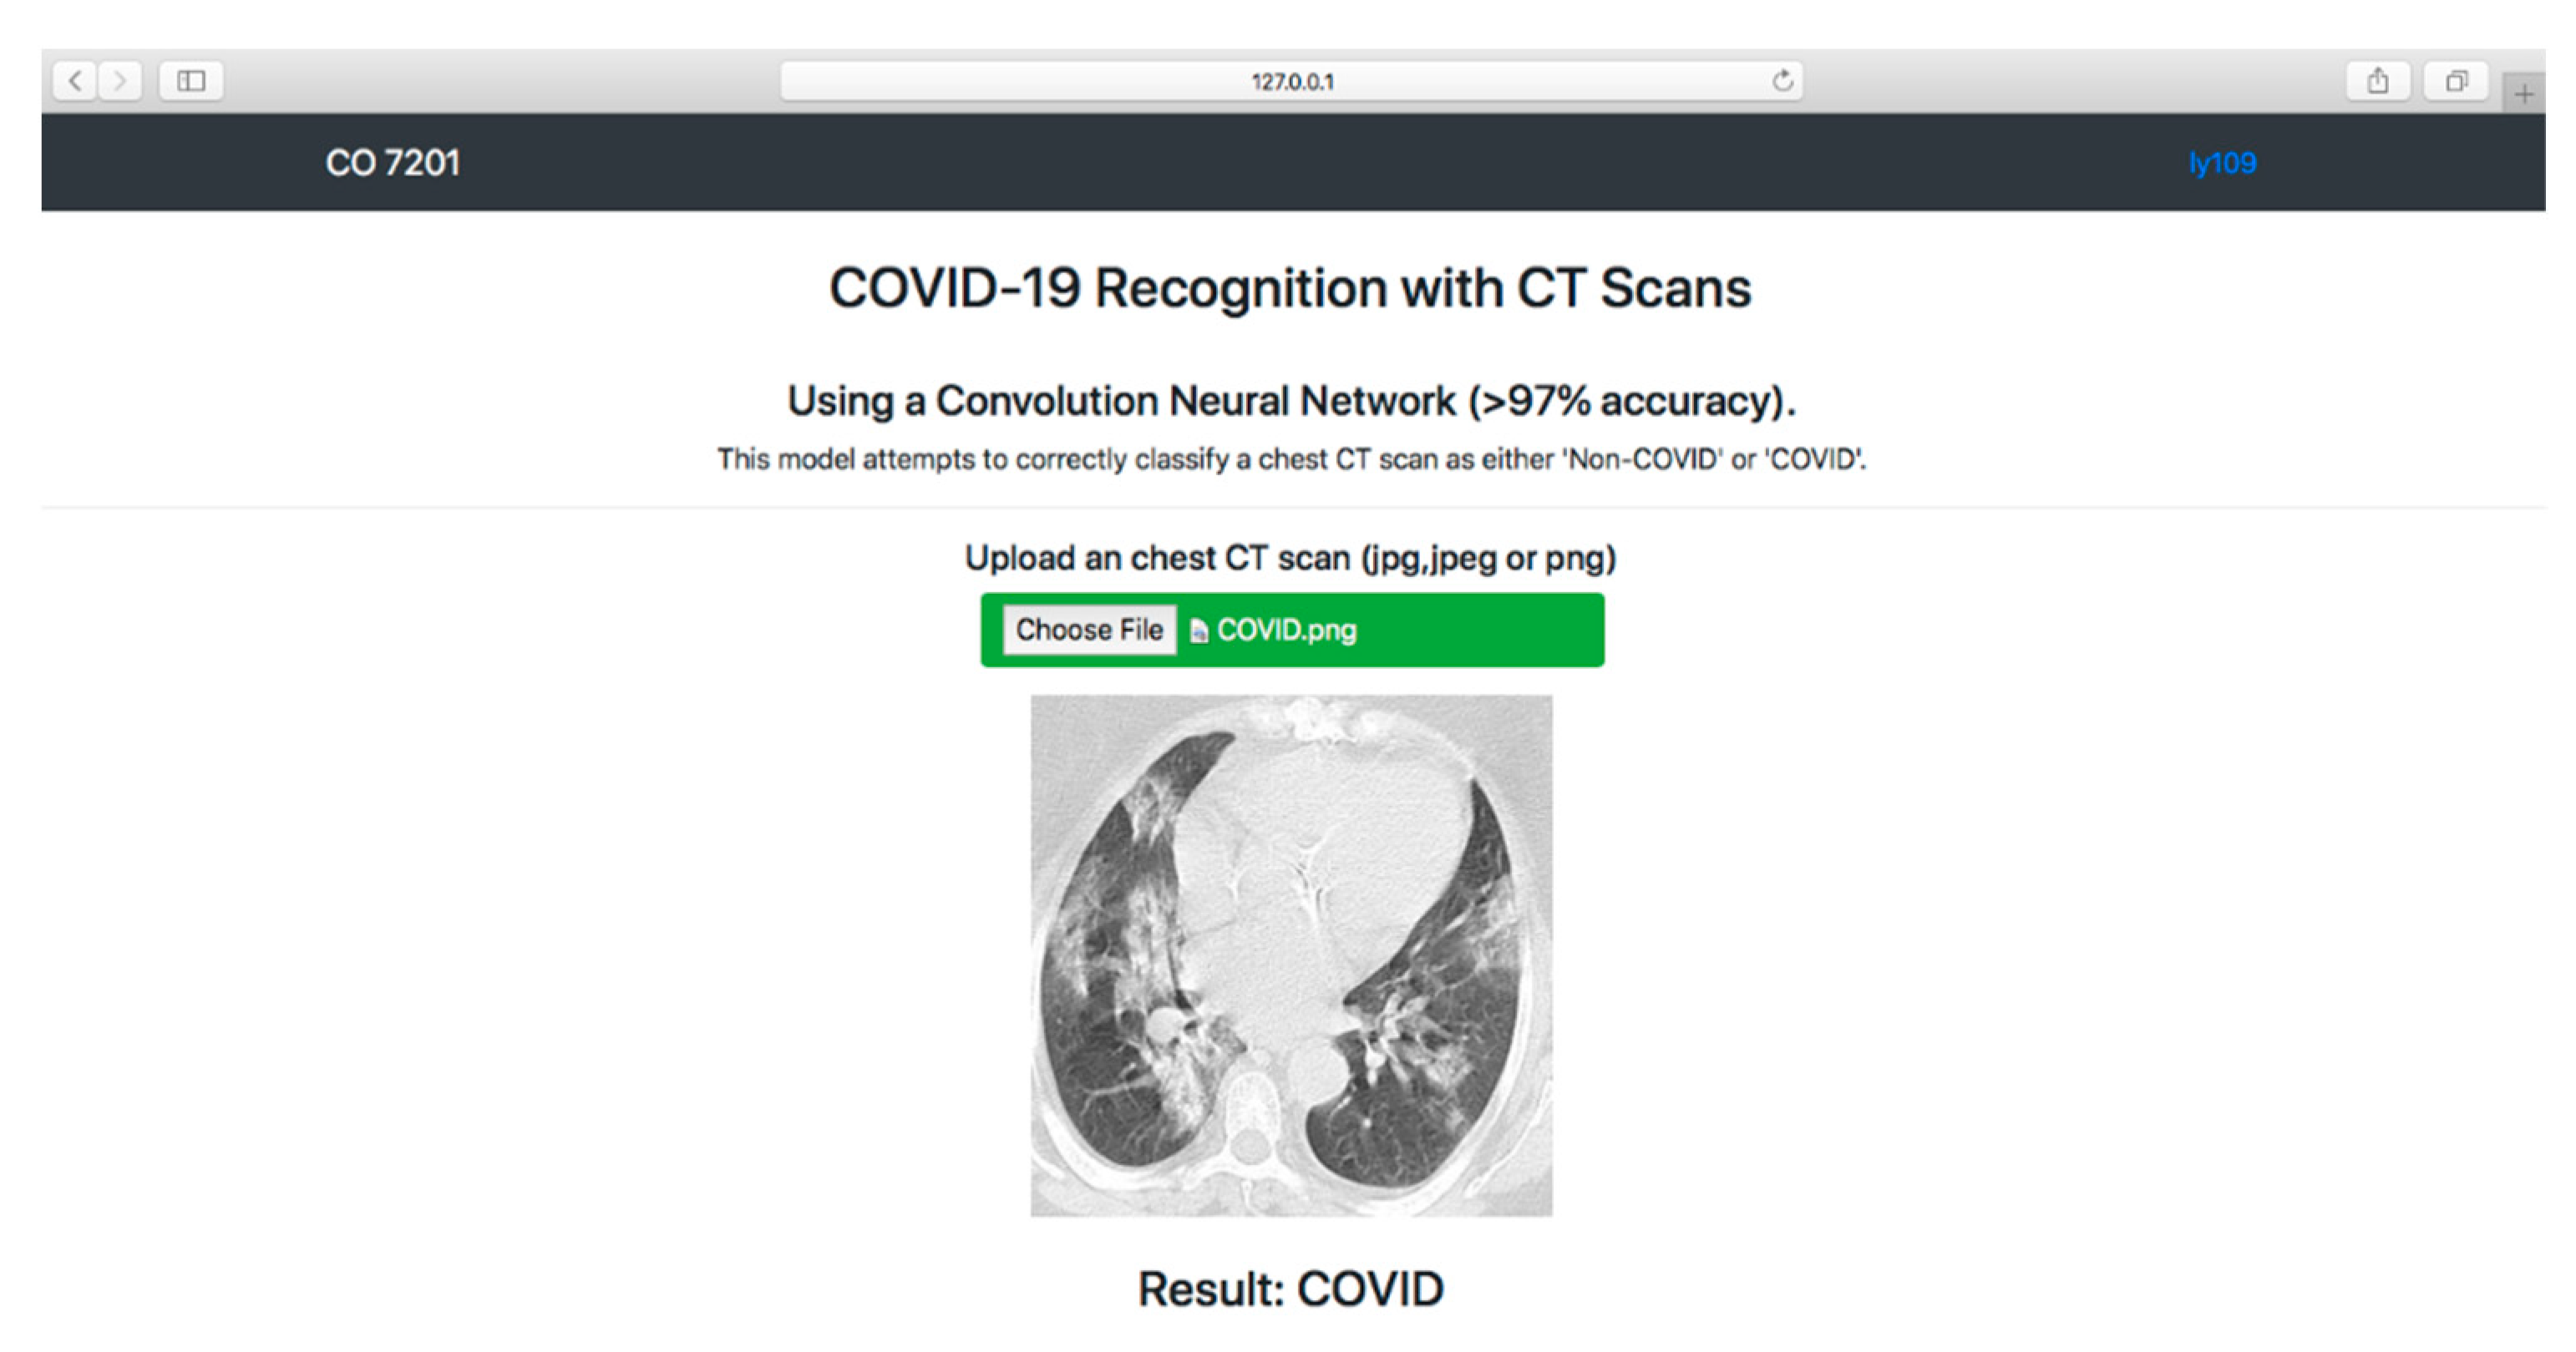
2.4. Localhost Web Application Development
2.4.1. Web Application Workflow
2.4.2. Technology Used in Building the Localhost Web Application
2.5. Model Evaluation
2.5.1. Experimental Setup
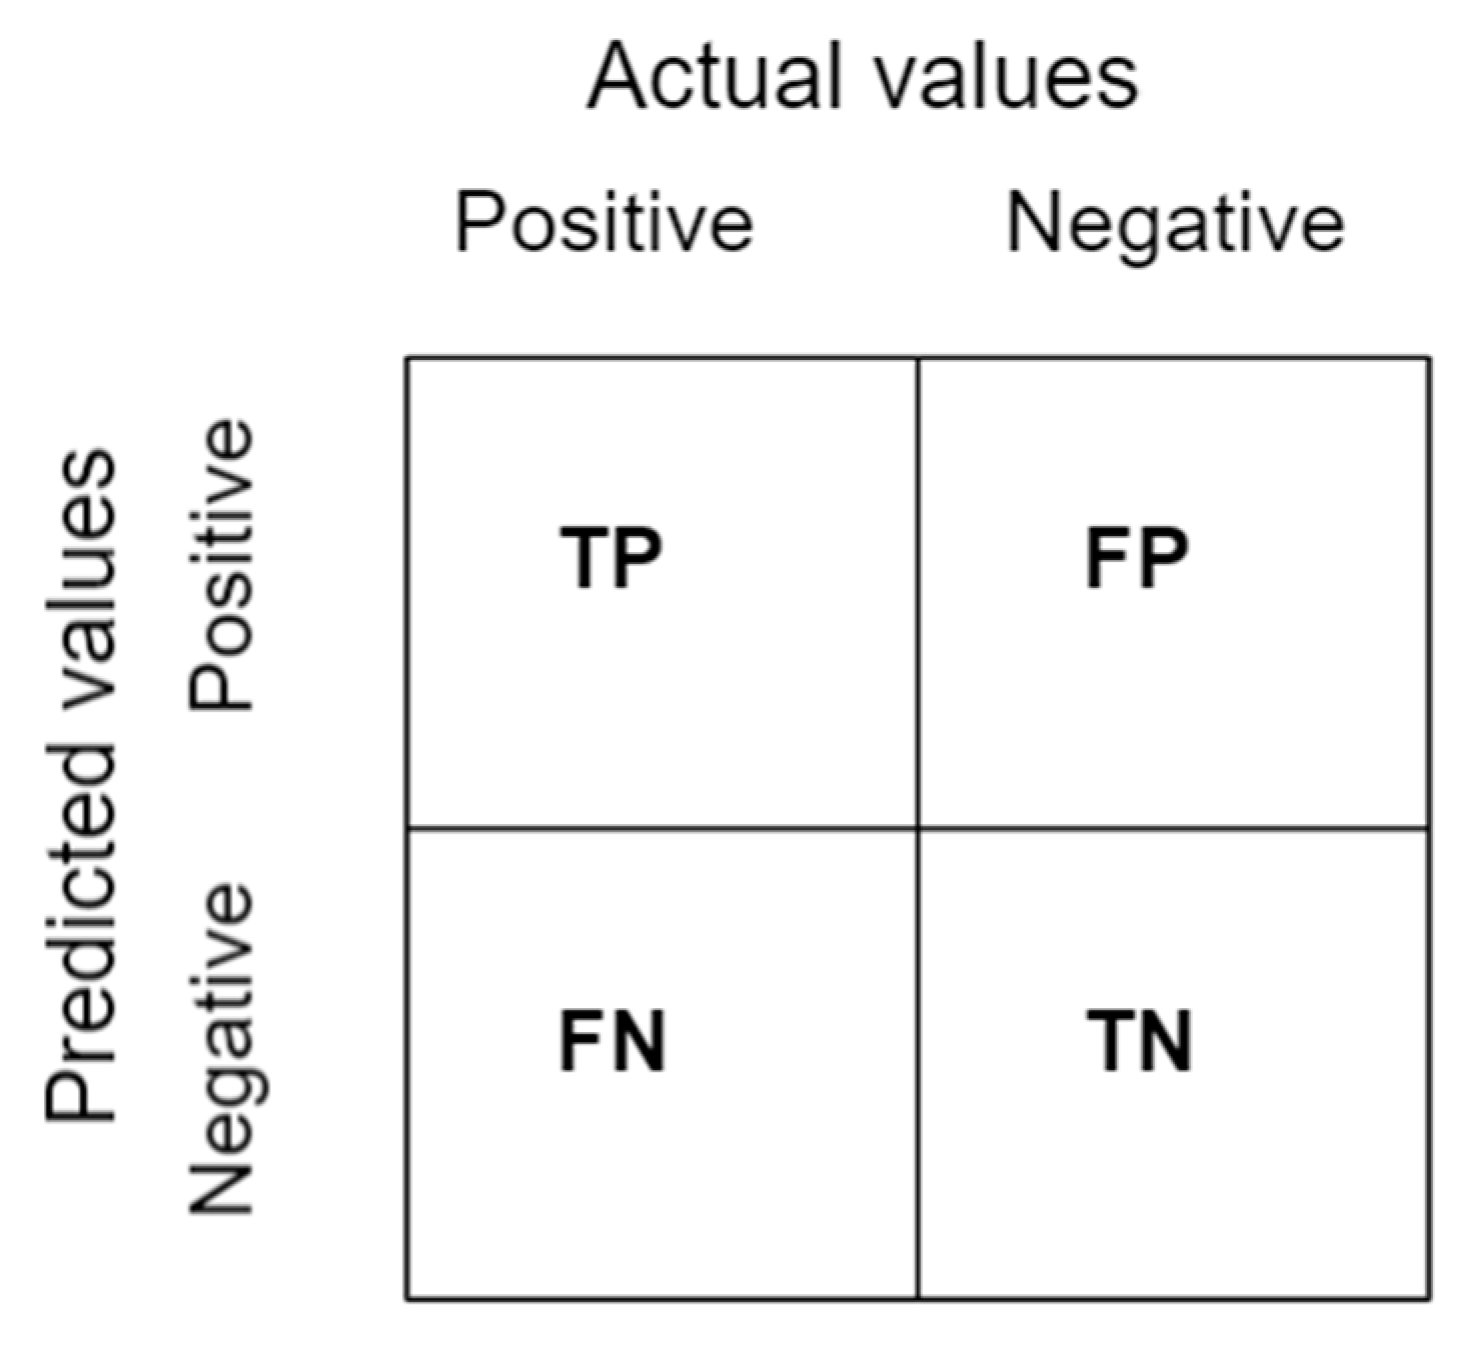
2.5.2. Confusion Matrix
2.5.3. Classification Metrics
3. Results
3.1. Results of Sixteen Modified Pre-Trained Models
3.1.1. Classification Results
3.1.2. Confusion Matrix Results
3.1.3. Learning Curve Results
3.2. Results of EDNC Models
3.2.1. Classification Results
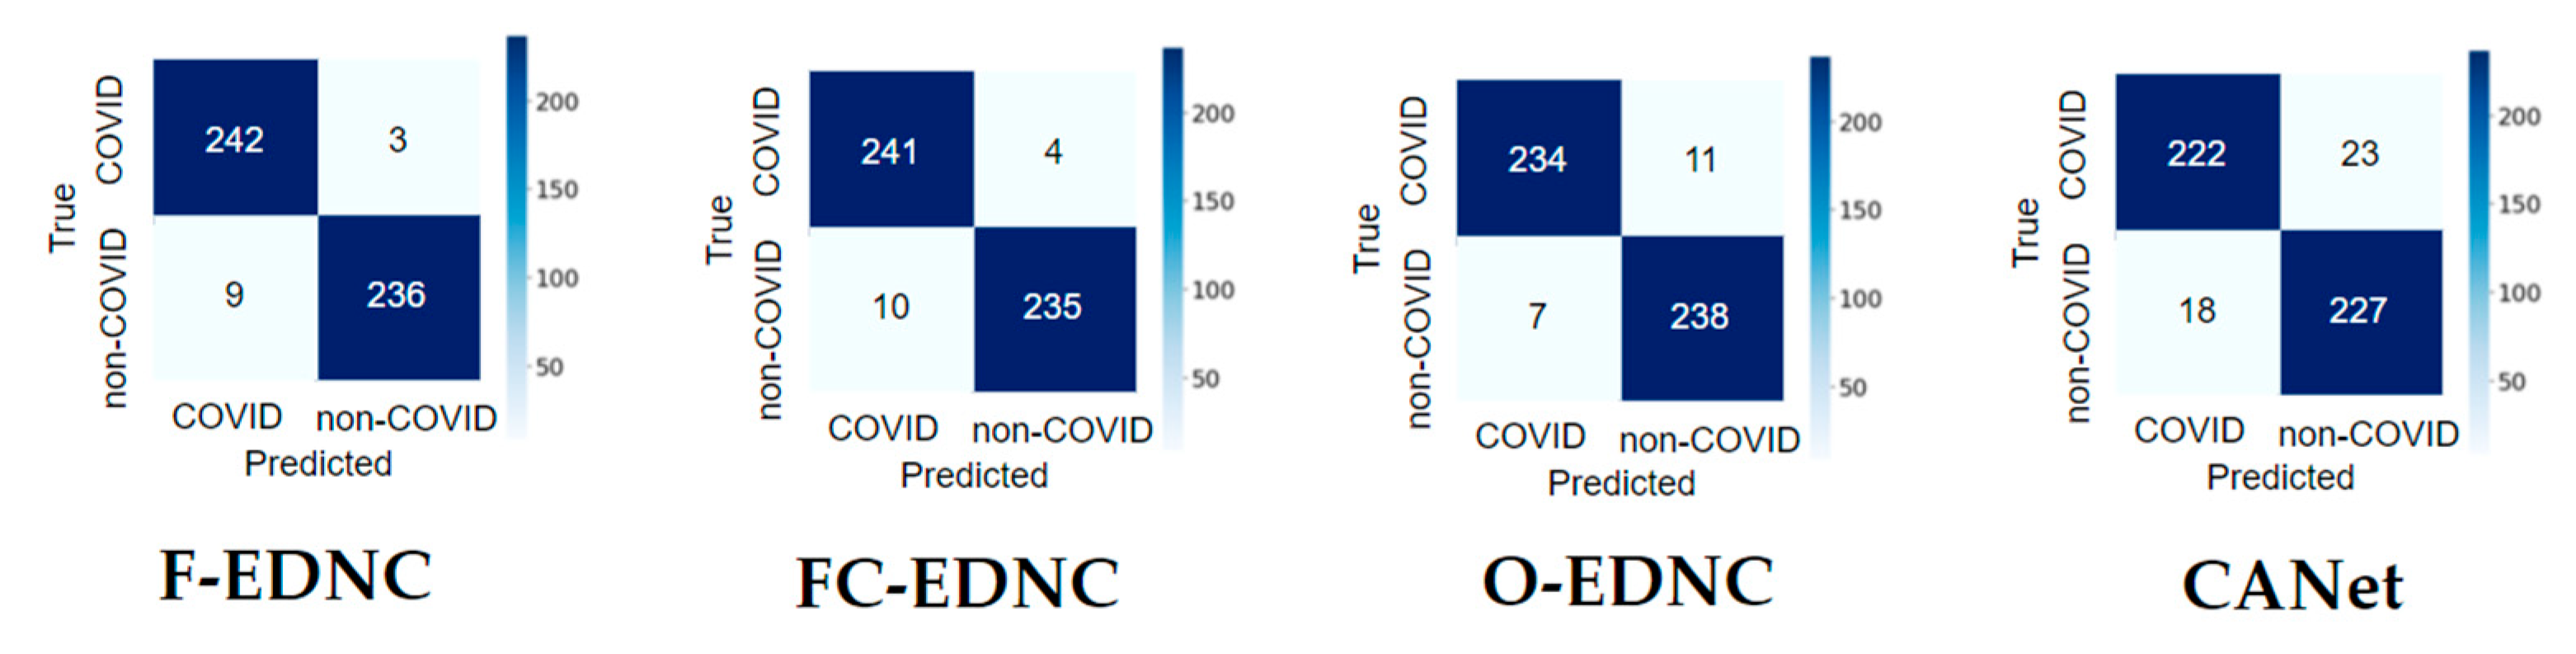
3.2.2. Confusion Matrix Results
3.2.3. False Discovery Rate Results
3.2.4. Learning Curve Results
3.3. Classification Results of Five Runs for Pre-Trained Model and EDNC Model
3.4. Training Time and Model Size Results
3.5. Model Deployment Result
4. Discussion
- The majority of studies utilized a dataset of only a few hundred COVID-19 images, which is inadequate for developing accurate and robust deep learning methods. Insufficient data may affect the performance of proposed methods.
- In most studies, there was a data imbalance problem, with one class having more images than the other. This affects the accuracy of models.
- Additionally, there are still some other pre-trained models that have not been utilized in COVID-19 classification.
- The impact of different ensemble methods has not received adequate attention in COVID-19 research. It should be emphasized that these techniques are beneficial in both improving performances and dealing with uncertainty associated with deep learning models.
- In none of the studies was there a webpage set up for users to upload images and to obtain COVID-19 predictions.
5. Conclusions
Author Contributions
Funding
Institutional Review Board Statement
Informed Consent Statement
Data Availability Statement
Conflicts of Interest
References
- WHO Coronavirus (COVID-19) Dashboard. Available online: https://Covid19.who.int (accessed on 20 August 2021).
- MRT. The WHO Believes That We Have Already Traveled “60% of the Way” in the Fight against COVID-19. Available online: https://marketresearchtelecast.com/the-who-believes-that-we-have-already-traveled-60-of-the-way-in-the-fight-against-COVID-19/175989 (accessed on 11 October 2021).
- Weekly Epidemiological Update on COVID-19-31 August 2021. Available online: https://www.who.int/publications/m/item/weekly-epidemiological-update-on-COVID-19---31-August-2021 (accessed on 1 September 2020).
- Fisman, D.N.; Tuite, A.R. Evaluation of the relative virulence of novel SARS-CoV-2 variants: A retrospective cohort study in Ontario, Canada. CMAJ 2021, 193, E1619–E1625. [Google Scholar] [CrossRef]
- Sanderson, K. COVID Vaccines Protect against Delta, but Their Effectiveness Wanes. Available online: https://www.nature.com/articles/d41586-021-02261-8 (accessed on 11 October 2021).
- Mwai, P. COVID-19 Vaccinations: More Than 50 Nations Have Missed a Target Set by the WHO. Available online: https://www.bbc.com/news/56100076 (accessed on 11 October 2021).
- Schaefer, G.O. Making Vaccines Available to Other Countries before Offering Domestic Booster Vaccinations. 2021. Available online: https://jamanetwork.com/journals/jama/fullarticle/2783234 (accessed on 15 September 2021).
- Bustin, S.A.; Nolan, T. RT-qPCR testing of SARS-CoV-2: A primer. Int. J. Mol. Sci. 2020, 21, 3004. [Google Scholar] [CrossRef] [PubMed]
- Waller, J.V.; Kaur, P.; Tucker, A.; Lin, K.K.; Diaz, M.; Henry, T.S.; Hope, M. Diagnostic tools for coronavirus disease (COVID-19): Comparing CT and RT-PCR viral nucleic acid testing. Am. J. Roentgenol. 2020, 215, 834–838. [Google Scholar] [CrossRef] [PubMed]
- Zhang, J.-F.; Liu, J.; Ma, H.-N.; Feng, K.; Chen, Z.-W.; Yang, L.-S.; Mei, B. RT-PCR combined with CT examination in the diagnosis and prognosis evaluation of COVID-19 patients in Fangcang hospital: A case series. J. Multidiscip. Health 2021, 14, 145–149. [Google Scholar] [CrossRef] [PubMed]
- Wu, J.; Pan, J.; Teng, D.; Xu, X.; Feng, J.; Chen, Y.-C. Interpretation of CT signs of 2019 novel coronavirus (COVID-19) pneumonia. Eur. Radiol. 2020, 30, 5455–5462. [Google Scholar] [CrossRef] [PubMed]
- National Institute of Health. Computed Tomography (CT). Available online: https://www.nibib.nih.gov/science-education/science-topics/computed-tomography-ct (accessed on 11 October 2021).
- Ross, H. What Is a CT Scan? Procedure, Risks, and Results. Available online: www.healthline.com/health/ct-scan (accessed on 21 August 2021).
- Esteva, A.; Chou, K.; Yeung, S.; Naik, N.; Madani, A.; Mottaghi, A.; Liu, Y.; Topol, E.; Dean, J.; Socher, R. Deep learning-enabled medical computer vision. NPJ Digit. Med. 2021, 4, 5. [Google Scholar] [CrossRef]
- Liu, X.; Faes, L.; Kale, A.U.; Wagner, S.K.; Fu, D.J.; Bruynseels, A.; Mahendiran, T.; Moraes, G.; Shamdas, M.; Kern, C.; et al. A comparison of deep learning performance against health-care professionals in detecting diseases from medical imaging: A systematic review and meta-analysis. Lancet Digit. Health 2019, 1, e271–e297. [Google Scholar] [CrossRef]
- Ahuja, A.S. The impact of artificial intelligence in medicine on the future role of the physician. PeerJ 2019, 7, e7702. [Google Scholar] [CrossRef]
- Matsuyama, E. A Deep learning interpretable model for novel coronavirus disease (COVID-19) screening with chest CT images. J. Biomed. Sci. Eng. 2020, 13, 140–152. [Google Scholar] [CrossRef]
- Loey, M.; Manogaran, G.; Khalifa, N.E.M. A deep transfer learning model with classical data augmentation and CGAN to detect COVID-19 from chest CT radiography digital images. Neural Comput. Appl. 2020, 32, 1–13. [Google Scholar] [CrossRef]
- Do, C.M.; Vu, L. An approach for recognizing COVID-19 cases using convolutional neural network applied to CT scan images. In Applications of Digital Image Processing XLIII; International Society for Optics and Photonics: San Diego, CA, USA, 2020; Volume 11510, p. 1151034. [Google Scholar]
- Polsinelli, M.; Cinque, L.; Placidi, G. A light CNN for detecting COVID-19 from CT scans of the chest. Pattern Recognit. Lett. 2020, 140, 95–100. [Google Scholar] [CrossRef] [PubMed]
- Ko, H.; Chung, H.; Kang, W.S.; Kim, K.W.; Shin, Y.; Kang, S.J.; Lee, J.H.; Kim, Y.J.; Kim, N.Y.; Jung, H.; et al. COVID-19 pneumonia diagnosis using a simple 2D deep learning framework with a single chest CT image: Model development and validation. J. Med. Internet Res. 2020, 22, e19569. [Google Scholar] [CrossRef] [PubMed]
- Maghdid, H.S.; Asaad, A.T.; Ghafoor, K.Z.G.; Sadiq, A.S.; Mirjalili, S.; Khan, M.K.K. Diagnosing COVID-19 pneumonia from X-ray and CT images using deep learning and transfer learning algorithms. In Multimodal Image Exploitation and Learning 2021; SPIE: Orlando, FL, USA, 2021; Volume 11734, p. 117340E. [Google Scholar]
- PlamenEduardo. SARS-CoV-2 CT-Scan Dataset. Available online: https://www.kaggle.com/plameneduardo/sarscov2-ctscan-dataset (accessed on 11 October 2021).
- GUNRAJ, H. COVIDx CT. 2021. Available online: https://www.kaggle.com/hgunraj/covidxct (accessed on 4 January 2022).
- Rahimzadeh, M.; Attar, A.; Sakhaei, S.M. A fully automated deep learning-based network for detecting COVID-19 from a new and large lung CT scan dataset. Biomed. Signal Process. Control 2021, 68, 102588. [Google Scholar] [CrossRef] [PubMed]
- Bineeth, K.; Preena, K.P. A review on 2D image representation methods. Int. J. Eng. Res. Technol. 2015, 4, 1075–1081. [Google Scholar]
- Sangaiah, A.K. Deep Learning and Parallel Computing Environment for Bioengineering Systems; Academic Press: Cambridge, MA, USA, 2019. [Google Scholar]
- Wang, S.-H.; Zhang, Y.; Cheng, X.; Zhang, X.; Zhang, Y.-D. PSSPNN: PatchShuffle stochastic pooling neural network for an explainable diagnosis of COVID-19 with multiple-way data augmentation. Comput. Math. Methods Med. 2021, 2021, 6633755. [Google Scholar] [CrossRef]
- Wang, S.-H.; Nayak, D.R.; Guttery, D.S.; Zhang, X.; Zhang, Y.-D. COVID-19 classification by CCSHNet with deep fusion using transfer learning and discriminant correlation analysis. Inf. Fusion 2021, 68, 131–148. [Google Scholar] [CrossRef]
- Wang, S.-H.; Govindaraj, V.V.; Górriz, J.M.; Zhang, X.; Zhang, Y.-D. COVID-19 classification by FGCNet with deep feature fusion from graph convolutional network and convolutional neural network. Inf. Fusion 2021, 67, 208–229. [Google Scholar] [CrossRef]
- Zhang, Y.-D.; Satapathy, S.C.; Zhang, X.; Wang, S.-H. COVID-19 Diagnosis via densenet and optimization of transfer learning setting. Cogn. Comput. 2021, 13, 1–17. [Google Scholar] [CrossRef]
- Shorten, C.; Khoshgoftaar, T.M. A survey on image data augmentation for deep learning. J. Big Data 2019, 6, 60. [Google Scholar] [CrossRef]
- Pan, S.J.; Yang, Q. A Survey on transfer learning. IEEE Trans. Knowl. Data Eng. 2010, 22, 1345–1359. [Google Scholar] [CrossRef]
- Zhuang, F.; Qi, Z.; Duan, K.; Xi, D.; Zhu, Y.; Zhu, H.; Xiong, H.; He, Q. A Comprehensive survey on transfer learning. Proc. IEEE 2021, 109, 43–76. [Google Scholar] [CrossRef]
- Weiss, K.; Khoshgoftaar, T.M.; Wang, D.D. A survey of transfer learning. J. Big Data 2016, 3, 1345–1459. [Google Scholar] [CrossRef] [Green Version]
- Kononenko, I. Machine learning for medical diagnosis: History, state of the art and perspective. Artif. Intell. Med. 2001, 23, 89–109. [Google Scholar] [CrossRef] [Green Version]
- Xu, J.; Xue, K.; Zhang, K. Current status and future trends of clinical diagnoses via image-based deep learning. Theranostics 2019, 9, 7556–7565. [Google Scholar] [CrossRef]
- Lab, S.V. ImageNet. Available online: https://image-net.org (accessed on 11 October 2021).
- Alzubaidi, L.; Zhang, J.; Humaidi, A.J.; Al-Dujaili, A.; Duan, Y.; Al-Shamma, O.; Santamaría, J.; Fadhel, M.A.; Al-Amidie, M.; Farhan, L. Review of deep learning: Concepts, CNN architectures, challenges, applications, future directions. J. Big Data 2021, 8, 53. [Google Scholar] [CrossRef]
- Labach, A.; Salehinejad, H.; Valaee, S. Survey of dropout methods for deep neural networks. arXiv 2019, arXiv:1904.13310. [Google Scholar]
- Li, Z.; Liu, F.; Yang, W.; Peng, S.; Zhou, J. A survey of convolutional neural networks: Analysis, applications, and prospects. IEEE Trans. Neural Netw. Learn. Syst. 2021, 32, 1–21. [Google Scholar] [CrossRef]
- Wang, W.; Yang, Y. Development of convolutional neural network and its application in image classification: A survey. Opt. Eng. 2019, 58, 040901. [Google Scholar] [CrossRef] [Green Version]
- Rajaraman, S.; Siegelman, J.; Alderson, P.O.; Folio, L.S.; Folio, L.R.; Antani, S.K. Iteratively pruned deep learning ensembles for COVID-19 detection in chest X-rays. IEEE Access 2020, 8, 115041–115050. [Google Scholar] [CrossRef]
- Novakovic, J.D. Evaluation of classification models in machine learning. Theory Appl. Math. Comput. Sci. 2017, 7, 39–46. [Google Scholar]
- Panwar, H.; Gupta, P.; Siddiqui, M.K.; Morales-Menendez, R.; Bhardwaj, P.; Singh, V. A deep learning and grad-CAM based color visualization approach for fast detection of COVID-19 cases using chest X-ray and CT-Scan images. Chaos Solitons Fractals 2020, 140, 110190. [Google Scholar] [CrossRef] [PubMed]
- Mishra, A.K.; Das, S.K.; Roy, P.; Bandyopadhyay, S. Identifying COVID19 from chest CT images: A deep convolutional neural networks based approach. J. Health Eng. 2020, 2020, 8843664. [Google Scholar] [CrossRef] [PubMed]
- Arora, V.; Ng, E.Y.-K.; Leekha, R.S.; Darshan, M.; Singh, A. Transfer learning-based approach for detecting COVID-19 ailment in lung CT scan. Comput. Biol. Med. 2021, 135, 104575. [Google Scholar] [CrossRef]
- Alshazly, H.; Linse, C.; Barth, E.; Martinetz, T. Explainable COVID-19 detection using chest CT scans and deep learning. Sensors 2021, 21, 455. [Google Scholar] [CrossRef]
- Yu, Z.; Li, X.; Sun, H.; Wang, J.; Zhao, T.; Chen, H.; Ma, Y.; Zhu, S.; Xie, Z. Rapid identification of COVID-19 severity in CT scans through classification of deep features. Biomed. Eng. Online 2020, 19, 63. [Google Scholar] [CrossRef]
- Jaiswal, A.; Gianchandani, N.; Singh, D.; Kumar, V.; Kaur, M. Classification of the COVID-19 infected patients using DenseNet201 based deep transfer learning. J. Biomol. Struct. Dyn. 2021, 39, 5682–5689. [Google Scholar] [CrossRef]
- Sanagavarapu, S.; Sridhar, S.; Gopal, T. COVID-19 identification in CLAHE enhanced CT scans with class imbalance using ensembled resnets. In Proceedings of the 2021 IEEE International IOT, Electronics and Mechatronics Conference (IEMTRONICS), Toronto, ON, Canada, 21–24 April 2021; pp. 1–7. [Google Scholar]
- Song, J.; Wang, H.; Liu, Y.; Wu, W.; Dai, G.; Wu, Z.; Zhu, P.; Zhang, W.; Yeom, K.W.; Deng, K. End-to-end automatic differentiation of the coronavirus disease 2019 (COVID-19) from viral pneumonia based on chest CT. Eur. J. Pediatr. 2020, 47, 2516–2524. [Google Scholar] [CrossRef]
- Sarker, L.; Islam, M.; Hannan, T.; Ahmed, Z. COVID-DenseNet: A deep learning architecture to detect COVID-19 from chest radiology images. Preprint 2020, 2020050151. [Google Scholar] [CrossRef]
- Shan, F.; Gao, Y.; Wang, J.; Shi, W.; Shi, N.; Han, M.; Xue, Z.; Shen, D.; Shi, Y. Lung infection quantification of COVID-19 in CT images with deep learning. arXiv 2020, arXiv:2003.04655. [Google Scholar]
- Wang, S.; Zha, Y.; Li, W.; Wu, Q.; Li, X.; Niu, M.; Wang, M.; Qiu, X.; Li, H.; Yu, H.; et al. A fully automatic deep learning system for COVID-19 diagnostic and prognostic analysis. Eur. Respir. J. 2020, 56, 2000775. [Google Scholar] [CrossRef]
- Gozes, O.; Frid-Adar, M.; Greenspan, H.; Browning, P.D.; Zhang, H.; Ji, W.; Bernheim, A.; Siegel, E. Rapid AI development cycle for the Coronavirus (COVID-19) pandemic: Initial results for automated detection & patient monitoring using deep learning CT image analysis. arXiv 2020, arXiv:2003.05037. [Google Scholar]
- Wang, S.; Kang, B.; Ma, J.; Zeng, X.; Xiao, M.; Guo, J.; Cai, M.; Yang, J.; Li, Y.; Meng, X.; et al. A deep learning algorithm using CT images to screen for Corona Virus Disease (COVID-19). Eur. Radiol. 2021, 31, 6096–6104. [Google Scholar] [CrossRef] [PubMed]
- Li, L.; Qin, L.; Xu, Z.; Yin, Y.; Wang, X.; Kong, B.; Bai, J.; Lu, Y.; Fang, Z.; Song, Q.; et al. Using artificial intelligence to detect COVID-19 and community-acquired pneumonia based on pulmonary CT: Evaluation of the diagnostic accuracy. Radiology 2020, 296, E65–E71. [Google Scholar] [CrossRef] [PubMed]


| Classes | Numbers of Samples | Format |
|---|---|---|
| COVID-19 | 1229 | PNG |
| Non-COVID-19 | 1229 | PNG |
| Classes | Numbers of Samples | Format |
|---|---|---|
| COVID-19 | 349 | PNG |
| Non-COVID-19 | 349 | PNG |
| Model | Accuracy | Precision | Sensitivity | F1 | Specificity |
|---|---|---|---|---|---|
| DenseNet201 | 0.9347 | 0.9388 | 0.9312 | 0.9350 | 0.9383 |
| VGG16 | 0.8857 | 0.8531 | 0.9127 | 0.8819 | 0.8621 |
| InceptionV3 | 0.8776 | 0.8082 | 0.9384 | 0.8684 | 0.8315 |
| ResNet50 | 0.7265 | 0.7265 | 0.7265 | 0.7265 | 0.7265 |
| ResNet50V2 | 0.9347 | 0.9224 | 0.9456 | 0.9339 | 0.9243 |
| ResNet152V2 | 0.9265 | 0.9102 | 0.9409 | 0.9253 | 0.9170 |
| Xception | 0.8898 | 0.8367 | 0.9361 | 0.8836 | 0.8524 |
| VGG19 | 0.8837 | 0.9020 | 0.8701 | 0.8858 | 0.8983 |
| ResNet101 | 0.7306 | 0.5429 | 0.8693 | 0.6684 | 0.6716 |
| ResNet101V2 | 0.9327 | 0.9143 | 0.9492 | 0.9314 | 0.9173 |
| NASNet | 0.9061 | 0.8694 | 0.9383 | 0.9025 | 0.8783 |
| MobileNetV2 | 0.9265 | 0.9796 | 0.8856 | 0.9302 | 0.9772 |
| MobileNet | 0.9571 | 0.9184 | 0.9956 | 0.9554 | 0.9242 |
| MobileNetV3Small | 0.5000 | 0 | 0 | 0 | 0.5000 |
| InceptionResNetV2 | 0.8959 | 0.8694 | 0.9181 | 0.8931 | 0.8760 |
| EfficientNetB7 | 0.5000 | 1.0000 | 0.5000 | 0.6667 | 0 |
| Model | Accuracy | Precision | Sensitivity | F1 | Specificity |
|---|---|---|---|---|---|
| ResNet50V2 | 0.9347 | 0.9224 | 0.9456 | 0.9339 | 0.9243 |
| DenseNet201 | 0.9347 | 0.9388 | 0.9312 | 0.9350 | 0.9383 |
| MobileNet | 0.9571 | 0.9184 | 0.9956 | 0.9554 | 0.9242 |
| F-EDNC | 0.9755 | 0.9787 | 0.9641 | 0.9713 | 0.9814 |
| O-EDNC | 0.9632 | 0.9551 | 0.9710 | 0.9795 | 0.9630 |
| FC-EDNC | 0.9714 | 0.9837 | 0.9602 | 0.9718 | 0.9833 |
| CANet | 0.9163 | 0.9061 | 0.925 | 0.9155 | 0.908 |
| Model | Accuracy | Precision | Sensitivity | F1 | Specificity |
|---|---|---|---|---|---|
| ResNet50V2 | 0.9565 | 0.9710 | 0.9436 | 0.9571 | 0.9701 |
| ResNet152V2 | 0.9510 | 0.9347 | 0.9347 | 0.9502 | 0.9673 |
| MobileNet | 0.9710 | 0.9420 | 1.0000 | 0.9701 | 0.9452 |
| F-EDNC | 0.9783 | 0.9565 | 1.0000 | 0.9778 | 0.9583 |
| O-EDNC | 0.9710 | 0.9420 | 1.0000 | 0.9701 | 0.9452 |
| FC-EDNC | 0.9783 | 0.9714 | 0.9602 | 0.9734 | 0.9602 |
| CANet | 0.9237 | 0.9168 | 0.9205 | 0.9223 | 0.9115 |
| Model | FDR |
|---|---|
| ResNet50V2 | 0.0775 |
| DenseNet201 | 0.0612 |
| MobileNet | 0.0816 |
| F-EDNC | 0.0122 |
| O-EDNC | 0.0448 |
| FC-EDNC | 0.0163 |
| CANet | 0.0938 |
| Model | Accuracy | Precision | Sensitivity | F1 | Specificity |
|---|---|---|---|---|---|
| DenseNet201 | 0.9388 | 0.9610 | 0.9231 | 0.9412 | 0.9565 |
| VGG16 | 0.8918 | 0.8612 | 0.8792 | 0.8701 | 0.8692 |
| InceptionV3 | 0.8734 | 0.8490 | 0.8489 | 0.8491 | 0.8560 |
| ResNet50 | 0.7285 | 0.7224 | 0.7314 | 0.7269 | 0.7287 |
| ResNet50V2 | 0.9408 | 0.9306 | 0.9502 | 0.9403 | 0.9320 |
| ResNet152V2 | 0.9224 | 0.8980 | 0.9442 | 0.9205 | 0.9027 |
| Xception | 0.8939 | 0.8410 | 0.9406 | 0.8880 | 0.8571 |
| VGG19 | 0.8776 | 0.8980 | 0.8627 | 0.8800 | 0.8936 |
| ResNet101 | 0.7429 | 0.5673 | 0.8742 | 0.6881 | 0.6798 |
| ResNet101V2 | 0.9306 | 0.9061 | 0.9527 | 0.9289 | 0.8764 |
| NASNet | 0.8980 | 0.8530 | 0.9372 | 0.8931 | 0.8652 |
| MobileNetV2 | 0.9020 | 0.9836 | 0.8456 | 0.9094 | 0.9805 |
| MobileNet | 0.9510 | 0.9383 | 0.9661 | 0.9520 | 0.9407 |
| MobileNetV3Small | 0.5000 | 0 | 0 | 0 | 0.5000 |
| InceptionResNetV2 | 0.9020 | 0.8776 | 0.9227 | 0.8996 | 0.8832 |
| EfficientNetB7 | 0.5000 | 1.0000 | 0.5000 | 0.6667 | 0 |
| Model | Accuracy | Precision | Sensitivity | F1 | Specificity |
|---|---|---|---|---|---|
| ResNet50V2 | 0.9408 | 0.9306 | 0.9502 | 0.9403 | 0.9320 |
| DenseNet201 | 0.9388 | 0.9610 | 0.9231 | 0.9412 | 0.9565 |
| MobileNet | 0.9510 | 0.9383 | 0.9661 | 0.9520 | 0.9407 |
| F-EDNC | 0.9775 | 0.9755 | 0.9795 | 0.9775 | 0.9756 |
| O-EDNC | 0.9612 | 0.9592 | 0.9631 | 0.9611 | 0.9593 |
| FC-EDNC | 0.9755 | 0.9836 | 0.9679 | 0.9757 | 0.9834 |
| CANet | 0.9224 | 0.9347 | 0.9124 | 0.9234 | 0.9331 |
| Pre-Trained Model | Accuracy | Training Time (Second/Epoch) | Parameters (MB) |
|---|---|---|---|
| DenseNet201 | 0.9347 | 30 | 84.37 |
| VGG16 | 0.8857 | 26 | 63.08 |
| InceptionV3 | 0.8776 | 26 | 90.01 |
| ResNet50 | 0.7265 | 27 | 103.99 |
| ResNet50V2 | 0.9347 | 26 | 103.9 |
| ResNet152V2 | 0.9265 | 28 | 237.5 |
| Xception | 0.8898 | 27 | 93.48 |
| VGG19 | 0.8837 | 26 | 79.87 |
| ResNet101 | 0.7306 | 28 | 177.19 |
| ResNet101V2 | 0.9327 | 29 | 177.08 |
| NASNet | 0.9061 | 32 | 25.26 |
| MobileNetV2 | 0.9265 | 27 | 17.52 |
| MobileNet | 0.9571 | 25 | 19.33 |
| MobileNetV3Small | 0.5000 | 28 | 13.26 |
| InceptionResNetV2 | 0.8959 | 30 | 213.77 |
| EfficientNetB7 | 0.5000 | 34 | 263.42 |
| F-EDNC (Ours) | 0.9755 | 31 | 377.2 |
| O-EDNC (Ours) | 0.9632 | 31 | 337.24 |
| FC-EDNC (Ours) | 0.9714 | 31 | 348 |
| CANet (Ours) | 0.9163 | 26 | 338.7 |
| Author | Architecture | Accuracy | F1 | Recall | Precision |
|---|---|---|---|---|---|
| Matsuyama, E. [17] | ResNet50 + wavelet coefficients | 92.2% | 91.5% | 90.4% | / |
| Loey, M. [18] | ResNet50 + augumentation + CGAN | 82.91% | / | 77.66% | / |
| Do, C. [19] | Modified DenseNet201 | 85% | / | 79% | 91% |
| Polsinelli, M. [20] | Modified SqueezeNet | 85.03% | 86.20% | 87.55% | 85.01% |
| Panwar, H. [45] | Modified VGG19 | 94.04 | |||
| Mishra, A. [46] | Modified DenseNet121, ResNet50, VGG16, InceptionV3 and DenseNet201 | 88.3% | 86.7% | 90.15% | |
| Ko, H. [21] | Modified VGG16, ResNet-50, Inception-v3, and Xception | 96.97% | |||
| Maghdid, H. [22] | Modified Alexnet, A self-build CNN | 94.1% | 100% | ||
| Arora, V. [47] | Modified MobileNet, DenseNet121, ResNet50, VGG16, InceptionV3 and XceptionNet | 94.12% | 96.11% | 96.11% | 96.11% |
| Alshazly. H. [48] | CovidResNet and CovidDenseNet | 93.87% | 95.70 | 92.49 | 99.13% |
| Yu, Z. [49] | Modified InceptionV3, ResNet50, ResNet-101, DenseNet201 | 95.34% | |||
| Jaiswal, A. [50] | Modified DenseNet201 | 96.25% | 96.29% | 96.29% | 96.29% |
| Sanagavarapu, S. [51] | Ensembled ResNets | 87% | 84% | 81% | 91% |
| Song, J. [52] | A large-scale bi-directional generative adversarial network | 92% | |||
| Sarker, L [53] | Modified Densenet121 | 96.49% | 96% | 96% | 96% |
| Shan, F. [54] | VB-Net | 91.6% | |||
| Wang, S. [55] | Modified DenseNet | 85% | 90% | 79% | |
| Gozes, O. [56] | Modified ResNet50 | 94% | |||
| Wang, S. [57] | Modified Inception | 79.3% | 63% | 83% | |
| Li, L. [58] | Modified RestNet50 | 90% | |||
| Proposed | EDNC | 97.75% | 97.75% | 97.95% | 97.55% |
Publisher’s Note: MDPI stays neutral with regard to jurisdictional claims in published maps and institutional affiliations. |
© 2022 by the authors. Licensee MDPI, Basel, Switzerland. This article is an open access article distributed under the terms and conditions of the Creative Commons Attribution (CC BY) license (https://creativecommons.org/licenses/by/4.0/).
Share and Cite
Yang, L.; Wang, S.-H.; Zhang, Y.-D. EDNC: Ensemble Deep Neural Network for COVID-19 Recognition. Tomography 2022, 8, 869-890. https://doi.org/10.3390/tomography8020071
Yang L, Wang S-H, Zhang Y-D. EDNC: Ensemble Deep Neural Network for COVID-19 Recognition. Tomography. 2022; 8(2):869-890. https://doi.org/10.3390/tomography8020071
Chicago/Turabian StyleYang, Lin, Shui-Hua Wang, and Yu-Dong Zhang. 2022. "EDNC: Ensemble Deep Neural Network for COVID-19 Recognition" Tomography 8, no. 2: 869-890. https://doi.org/10.3390/tomography8020071
APA StyleYang, L., Wang, S.-H., & Zhang, Y.-D. (2022). EDNC: Ensemble Deep Neural Network for COVID-19 Recognition. Tomography, 8(2), 869-890. https://doi.org/10.3390/tomography8020071