Validation of a Fast, Robust, Inexpensive, Two-Tiered Neonatal Screening Test algorithm on Dried Blood Spots for Spinal Muscular Atrophy


Abstract
:1. Introduction
2. Materials and Methods
2.1. Samples
2.2. Extraction
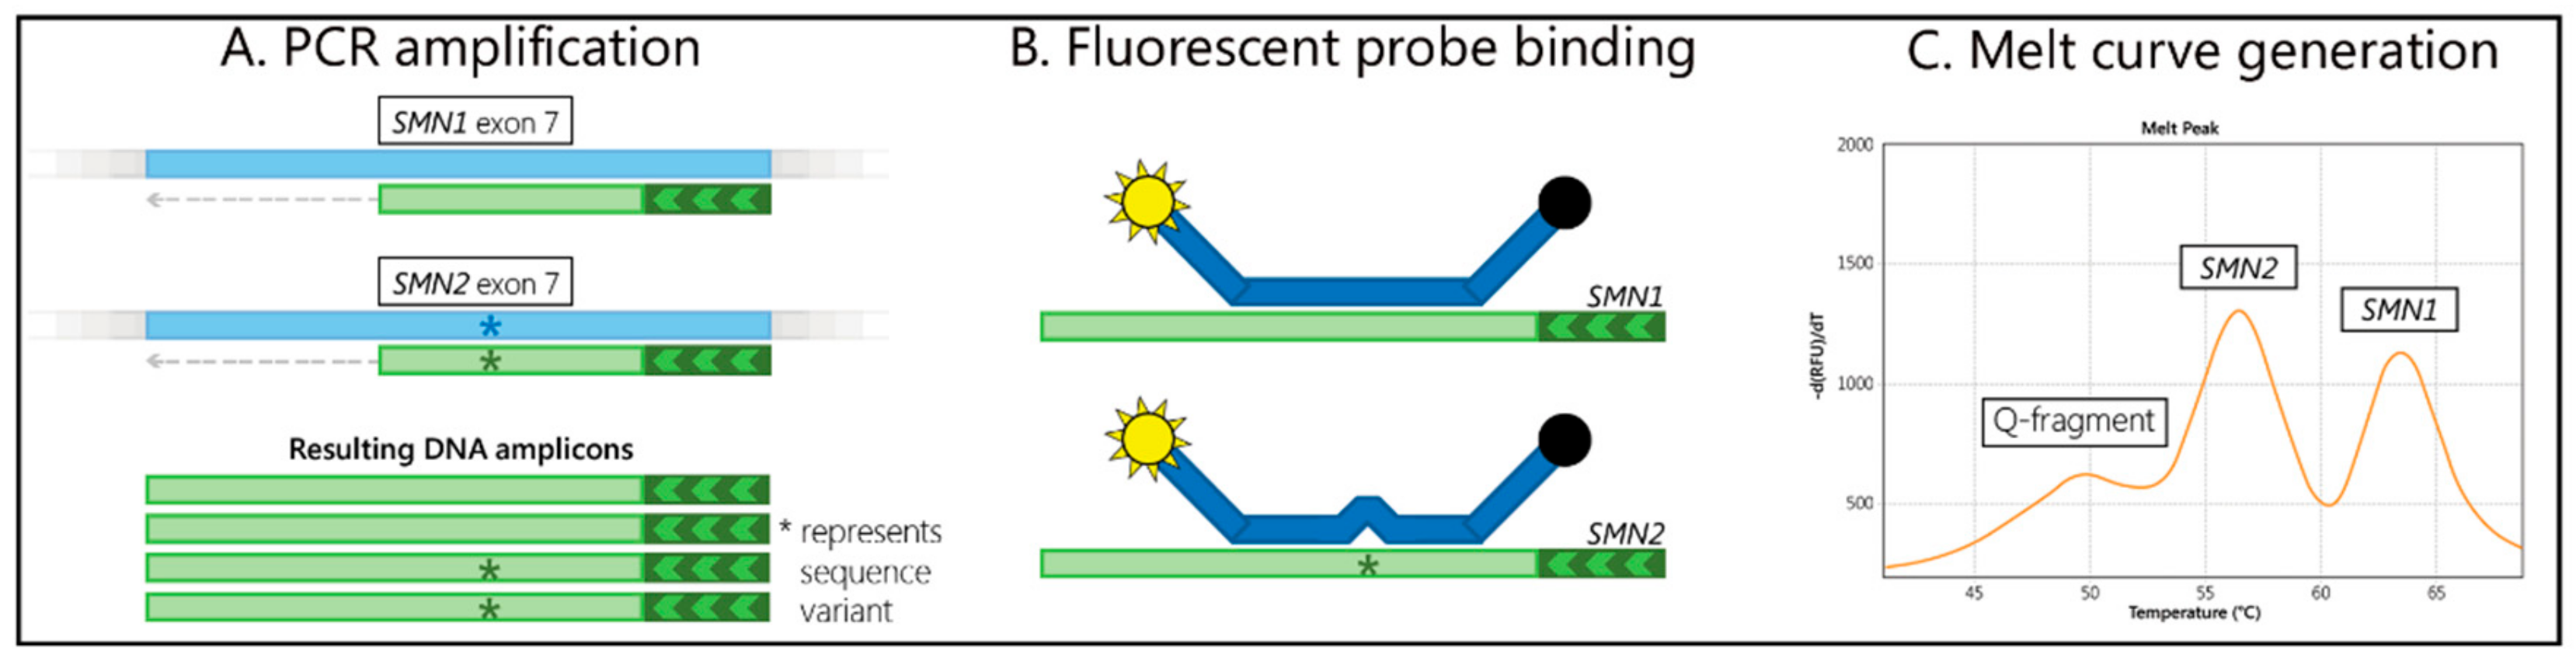
2.3. Screening
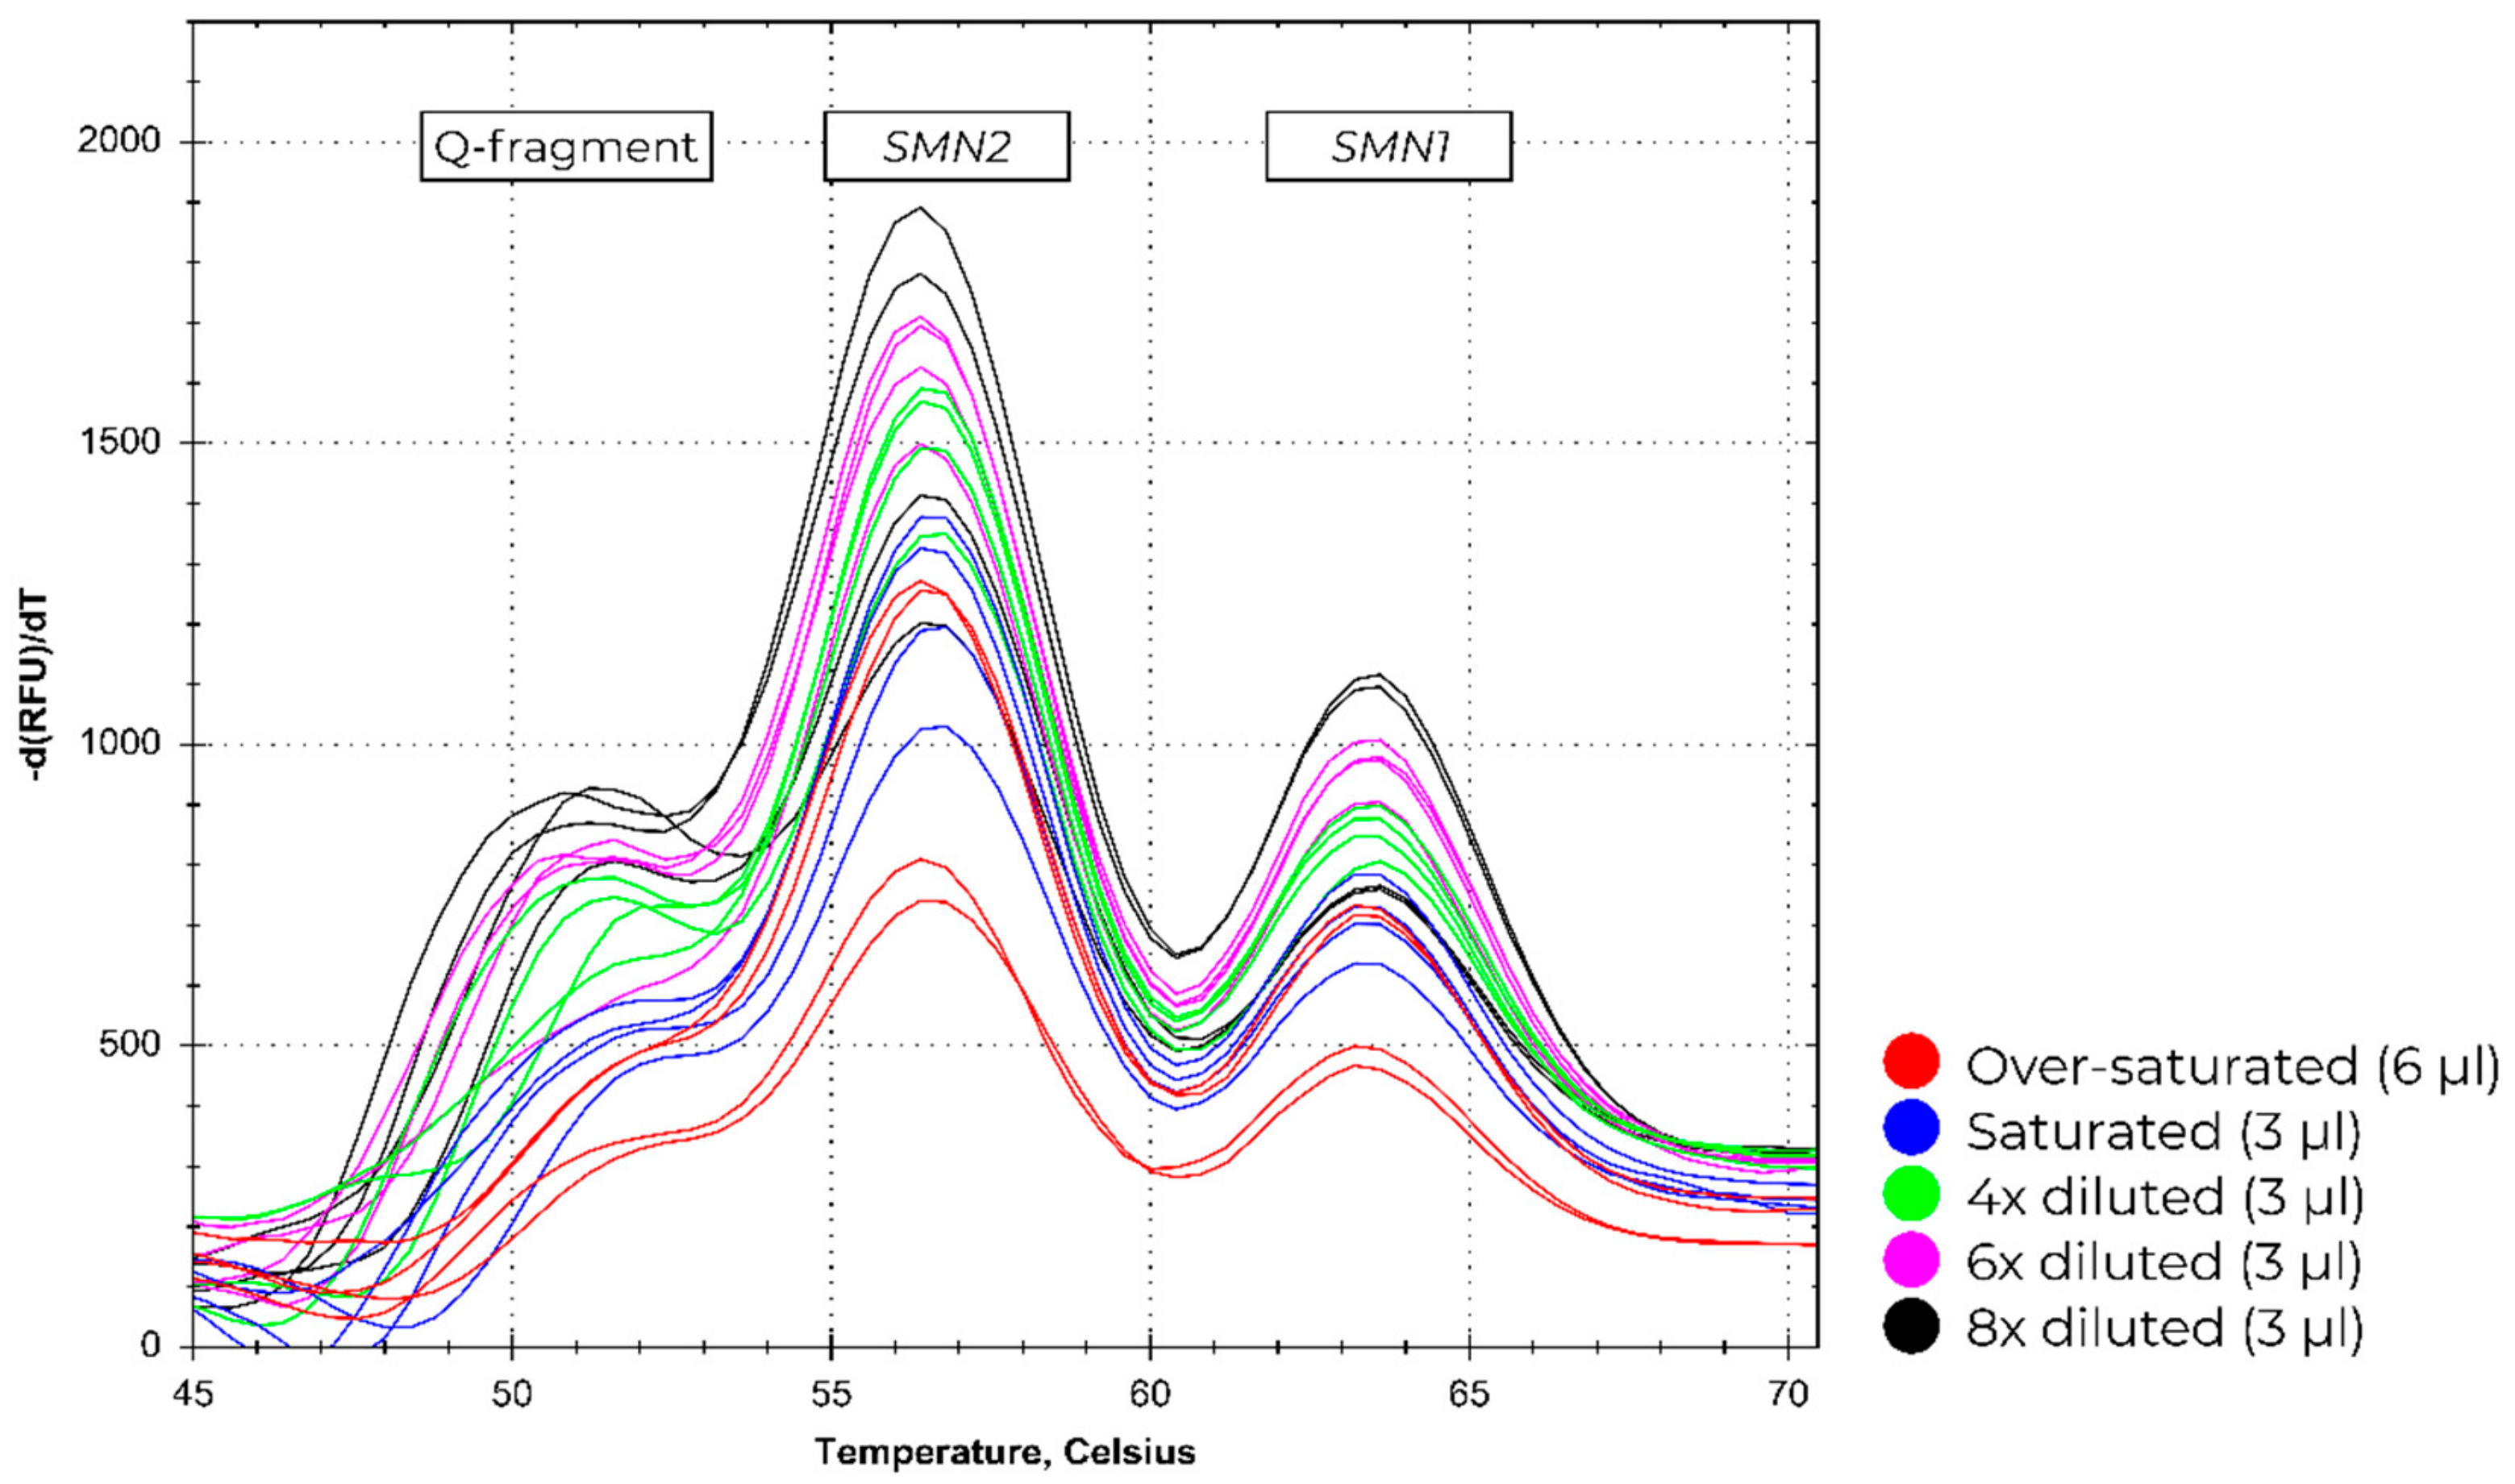
2.4. Input Range
2.5. Data Analysis
3. Results
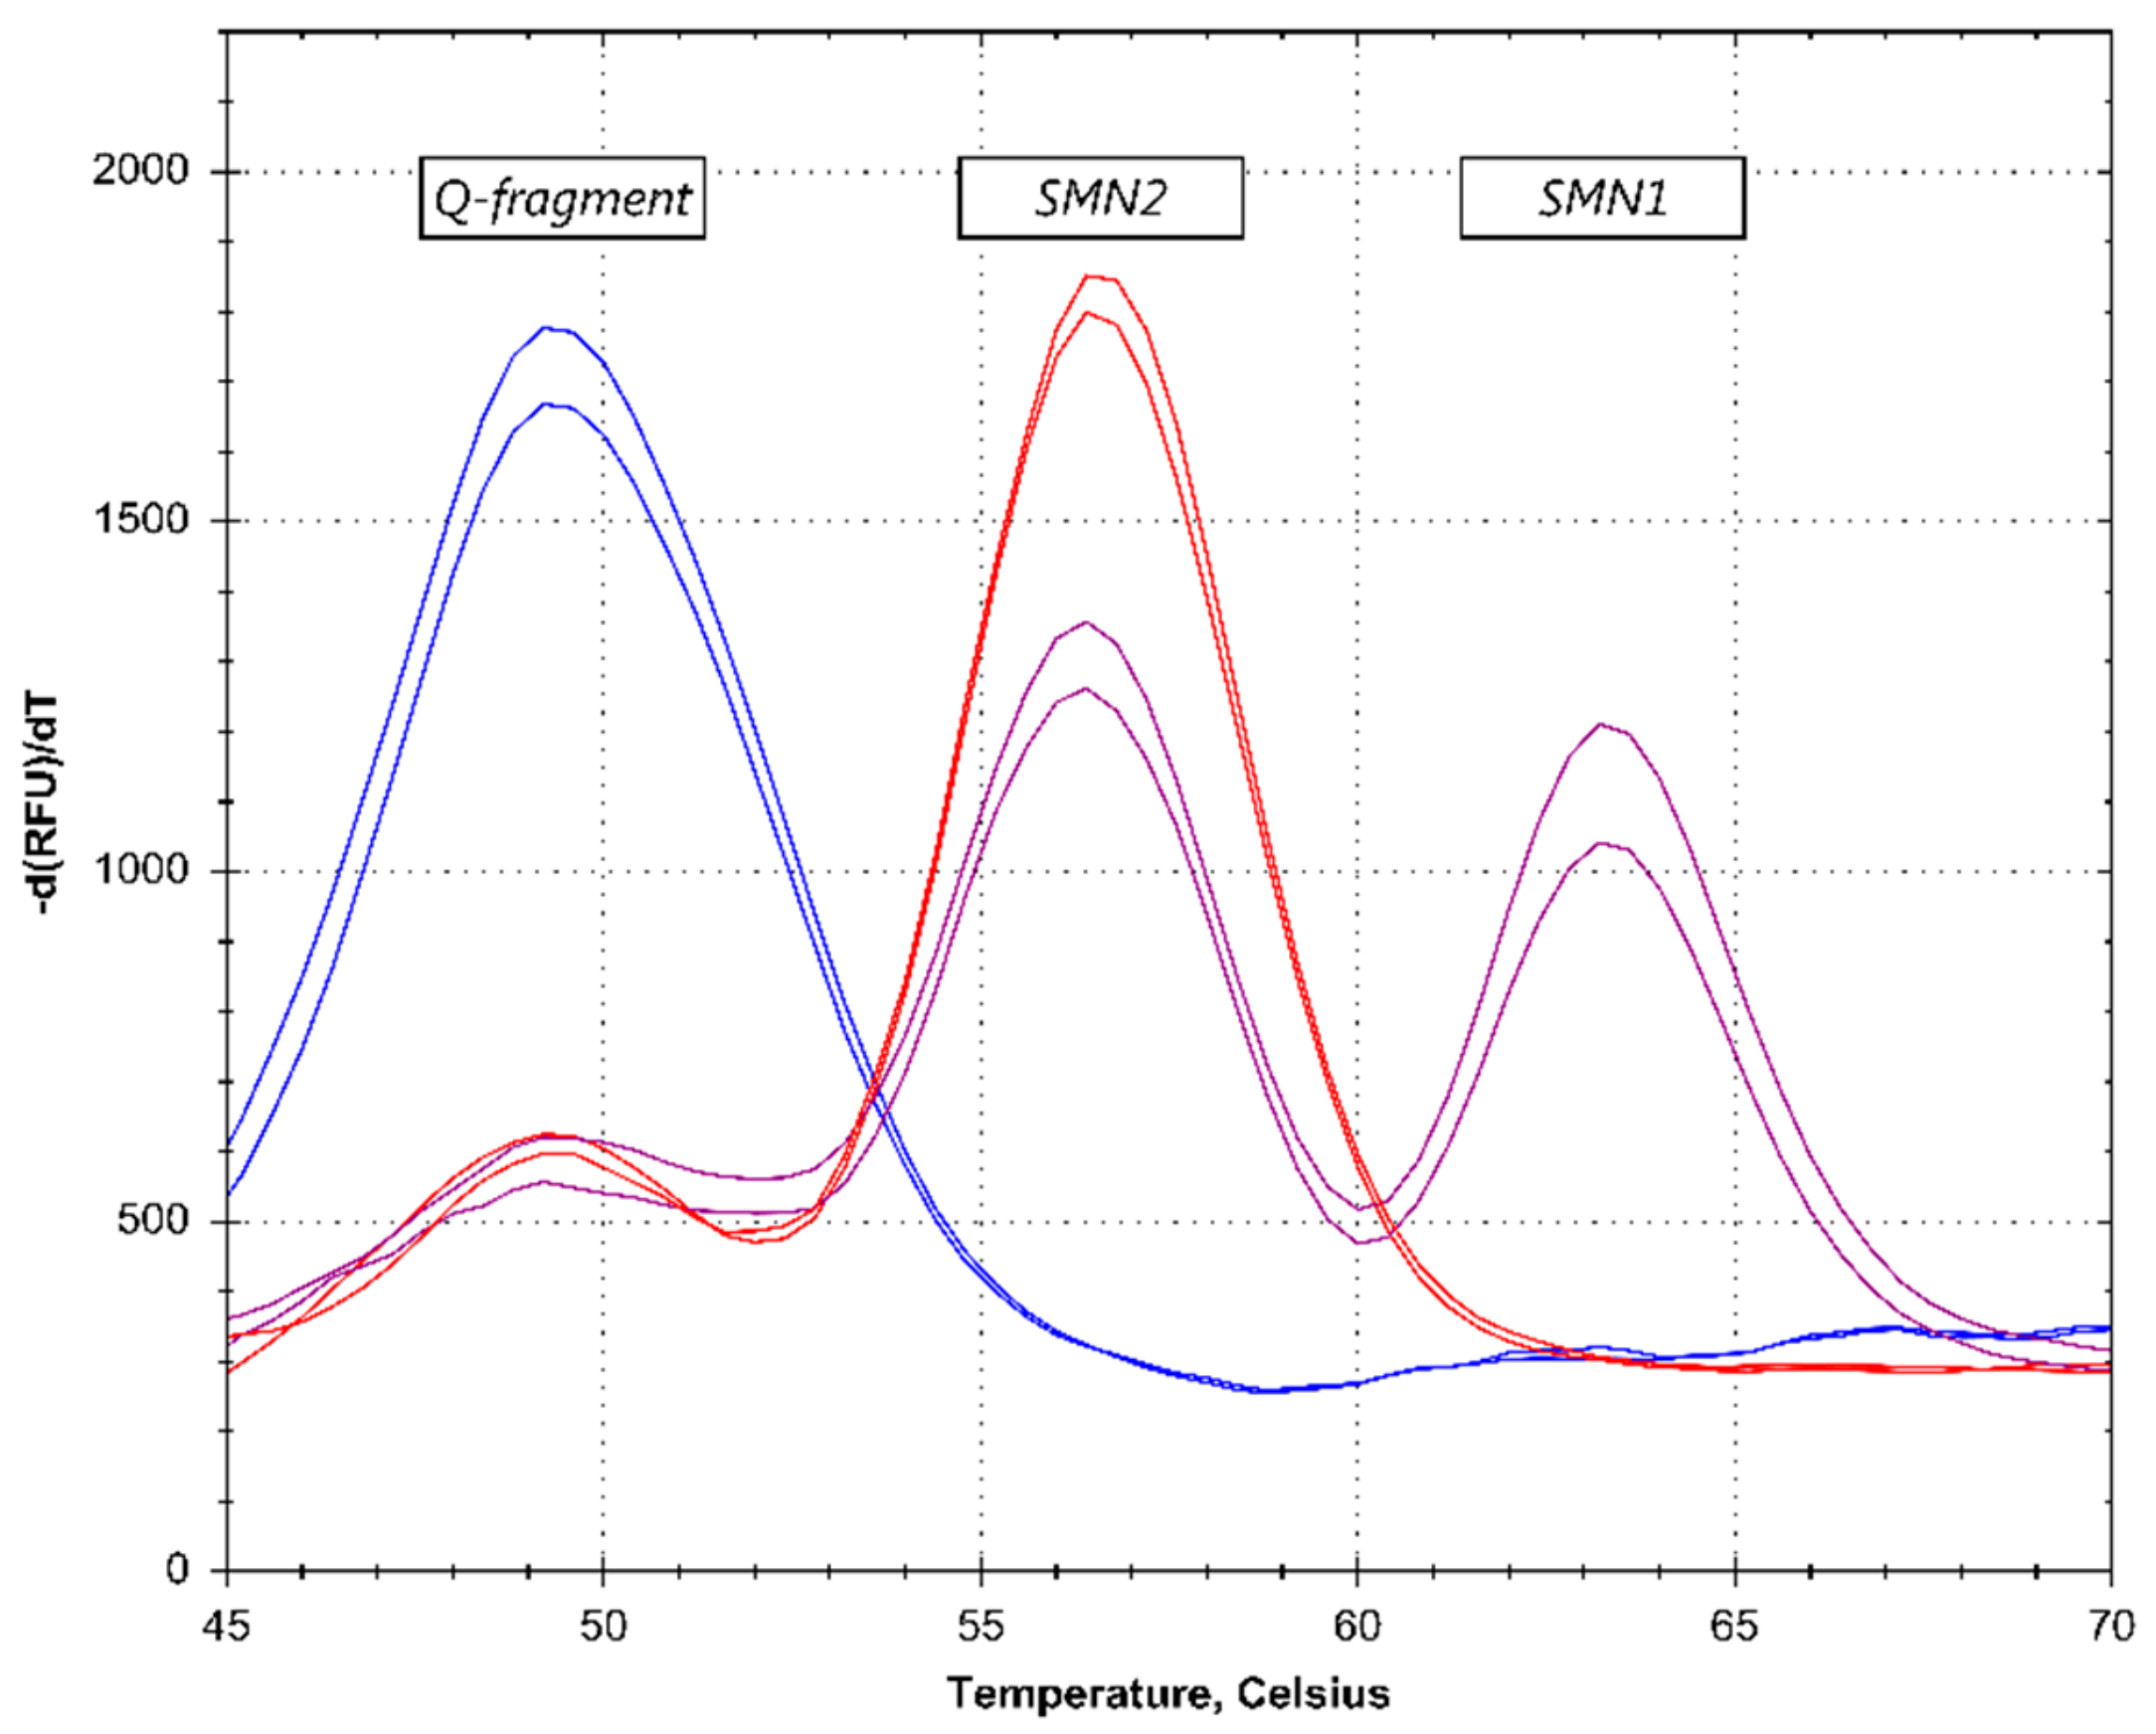
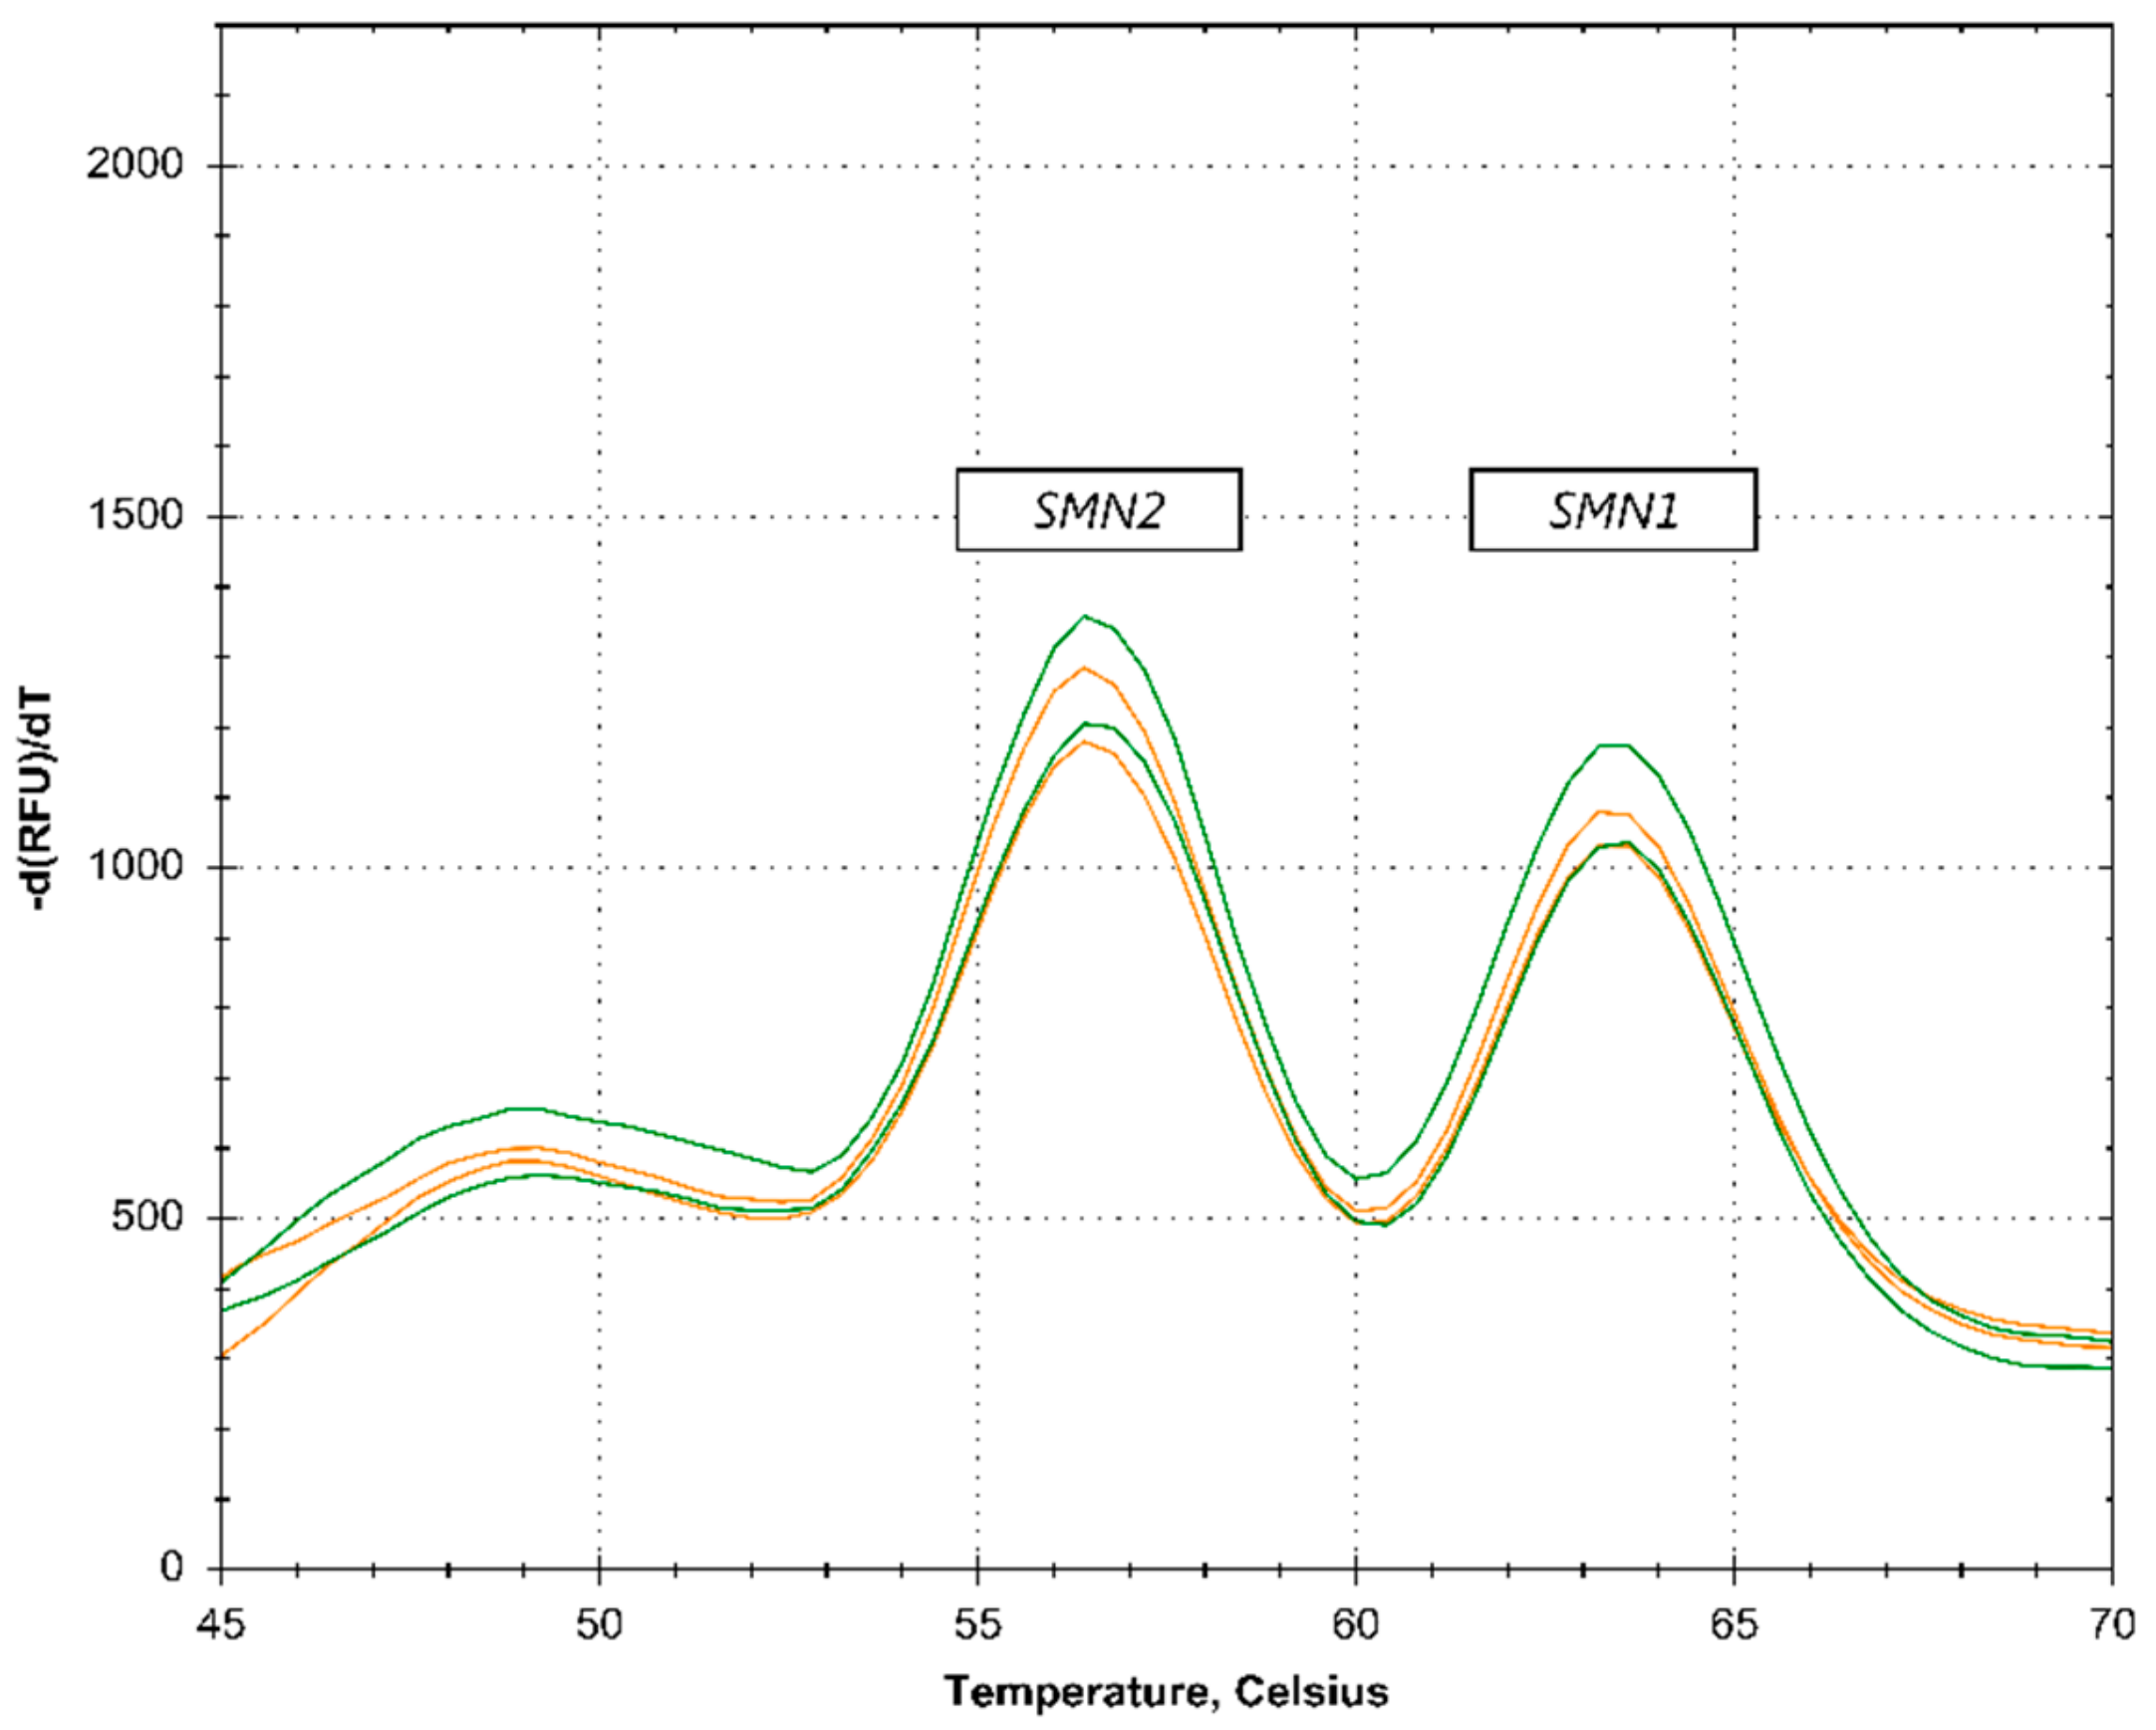
3.1. Melt Curve Assay Screening Data
3.2. Input Range
3.3. SMN2 Copy Number Determination
4. Discussion
5. Conclusions
Author Contributions
Funding
Acknowledgments
Conflicts of Interest
References
- Darras, B.T. Spinal muscular atrophies. Pediatr. Clin. N. Am. 2015, 62, 743–766. [Google Scholar]
- Kolb, S.J.; Kissel, J.T. Spinal Muscular Atrophy. Neurol. Clin. 2015, 33, 831–846. [Google Scholar]
- Lefebvre, S.; Burglen, L.; Reboullet, S.; Clermont, O.; Burlet, P.; Viollet, L.; Benichou, B.; Cruaud, C.; Millasseau, P.; Zeviani, M.; et al. Identification and characterization of a spinal muscular atrophy-determining gene. Cell 1995, 80, 155–165. [Google Scholar]
- Verhaart, I.E.C.; Robertson, A.; Leary, R.; McMacken, G.; Konig, K.; Kirschner, J.; Jones, C.C.; Cook, S.F.; Lochmuller, H. A multi-source approach to determine SMA incidence and research ready population. J. Neurol. 2017, 264, 1465–1473. [Google Scholar]
- Singh, R.N.; Singh, N.N. Mechanism of Splicing Regulation of Spinal Muscular Atrophy Genes. Adv. Neurobiol. 2018, 20, 31–61. [Google Scholar]
- Lorson, C.L.; Hahnen, E.; Androphy, E.J.; Wirth, B. A single nucleotide in the SMN gene regulates splicing and is responsible for spinal muscular atrophy. Proc. Natl. Acad. Sci. USA 1999, 96, 6307–6311. [Google Scholar]
- Monani, U.R.; Lorson, C.L.; Parsons, D.W.; Prior, T.W.; Androphy, E.J.; Burghes, A.H.; McPherson, J.D. A single nucleotide difference that alters splicing patterns distinguishes the SMA gene SMN1 from the copy gene SMN2. Hum. Mol. Genet. 1999, 8, 1177–1183. [Google Scholar]
- Burnett, B.G.; Munoz, E.; Tandon, A.; Kwon, D.Y.; Sumner, C.J.; Fischbeck, K.H. Regulation of SMN protein stability. Mol. Cell. Biol. 2009, 29, 1107–1115. [Google Scholar]
- Cartegni, L.; Hastings, M.L.; Calarco, J.A.; de Stanchina, E.; Krainer, A.R. Determinants of exon 7 splicing in the spinal muscular atrophy genes, SMN1 and SMN2. Am. J. Hum. Genet. 2006, 78, 63–77. [Google Scholar]
- Mailman, M.D.; Heinz, J.W.; Papp, A.C.; Snyder, P.J.; Sedra, M.S.; Wirth, B.; Burghes, A.H.; Prior, T.W. Molecular analysis of spinal muscular atrophy and modification of the phenotype by SMN2. Genet. Med. 2002, 4, 20–26. [Google Scholar]
- Zanetta, C.; Riboldi, G.; Nizzardo, M.; Simone, C.; Faravelli, I.; Bresolin, N.; Comi, G.P.; Corti, S. Molecular, genetic and stem cell-mediated therapeutic strategies for spinal muscular atrophy (SMA). J. Cell. Mol. Med. 2014, 18, 187–196. [Google Scholar]
- Finkel, R.S.; Chiriboga, C.A.; Vajsar, J.; Day, J.W.; Montes, J.; De Vivo, D.C.; Yamashita, M.; Rigo, F.; Hung, G.; Schneider, E.; et al. Treatment of infantile-onset spinal muscular atrophy with nusinersen: A phase 2, open-label, dose-escalation study. Lancet 2016, 388, 3017–3026. [Google Scholar]
- Finkel, R.S.; Mercuri, E.; Darras, B.T.; Connolly, A.M.; Kuntz, N.L.; Kirschner, J.; Chiriboga, C.A.; Saito, K.; Servais, L.; Tizzano, E.; et al. Nusinersen versus Sham Control in Infantile-Onset Spinal Muscular Atrophy. N. Engl. J. Med. 2017, 377, 1723–1732. [Google Scholar]
- Glascock, J.; Sampson, J.; Haidet-Phillips, A.; Connolly, A.; Darras, B.; Day, J.; Finkel, R.; Howell, R.R.; Klinger, K.; Kuntz, N.; et al. Treatment Algorithm for Infants Diagnosed with Spinal Muscular Atrophy through Newborn Screening. J. Neuromuscular Dis. 2018, 5, 145–158. [Google Scholar]
- Arkblad, E.L.; Darin, N.; Berg, K.; Kimber, E.; Brandberg, G.; Lindberg, C.; Holmberg, E.; Tulinius, M.; Nordling, M. Multiplex ligation-dependent probe amplification improves diagnostics in spinal muscular atrophy. Neuromuscular Disord. 2006, 16, 830–838. [Google Scholar]
- Bai, J.; Qu, Y.; Cao, Y.; Yang, L.; Ge, L.; Jin, Y.; Wang, H.; Song, F. The SMN1 common variant c.22 dupA in Chinese patients causes spinal muscular atrophy by nonsense-mediated mRNA decay in humans. Gene 2018, 644, 49–55. [Google Scholar]
- Wadman, R.I.; Stam, M.; Jansen, M.D.; van der Weegen, Y.; Wijngaarde, C.A.; Harschnitz, O.; Sodaar, P.; Braun, K.P.; Dooijes, D.; Lemmink, H.H.; et al. A Comparative Study of SMN Protein and mRNA in Blood and Fibroblasts in Patients with Spinal Muscular Atrophy and Healthy Controls. PLoS ONE 2016, 11, e0167087. [Google Scholar]
- Lefterova, M.I.; Shen, P.; Odegaard, J.I.; Fung, E.; Chiang, T.; Peng, G.; Davis, R.W.; Wang, W.; Kharrazi, M.; Schrijver, I.; et al. Next-Generation Molecular Testing of Newborn Dried Blood Spots for Cystic Fibrosis. J. Mol. Diagn. 2016, 18, 267–282. [Google Scholar]
- Health Council of the Netherlands. Neonatal Screening: New Recommendations. Available online: https://www.healthcouncil.nl/documents/advisory-reports/2015/04 (accessed on 10 April 2019).
- Parsons, E.P.; Bradley, D.M. Psychosocial issues in newborn screening for cystic fibrosis. Paediatr. Respir. Rev. 2003, 4, 285–292. [Google Scholar] [CrossRef]
- Taylor, J.L.; Lee, F.K.; Yazdanpanah, G.K.; Staropoli, J.F.; Liu, M.; Carulli, J.P.; Sun, C.; Dobrowolski, S.F.; Hannon, W.H.; Vogt, R.F. Newborn blood spot screening test using multiplexed real-time PCR to simultaneously screen for spinal muscular atrophy and severe combined immunodeficiency. Clin. Chem. 2015, 61, 412–419. [Google Scholar]
- Chien, Y.H.; Chiang, S.C.; Weng, W.C.; Lee, N.C.; Lin, C.J.; Hsieh, W.S.; Lee, W.T.; Jong, Y.J.; Ko, T.M.; Hwu, W.L. Presymptomatic Diagnosis of Spinal Muscular Atrophy Through Newborn Screening. J. Pediatr. 2017, 190, 124–129. [Google Scholar]
- Vidal-Folch, N.; Gavrilov, D.; Raymond, K.; Rinaldo, P.; Tortorelli, S.; Matern, D.; Oglesbee, D. Multiplex Droplet Digital PCR Method Applicable to Newborn Screening, Carrier Status, and Assessment of Spinal Muscular Atrophy. Clin. Chem. 2018, 64, 1753–1761. [Google Scholar]
- Ar Rochmah, M.; Harahap, N.I.F.; Niba, E.T.E.; Nakanishi, K.; Awano, H.; Morioka, I.; Iijima, K.; Saito, T.; Saito, K.; Lai, P.S.; et al. Genetic screening of spinal muscular atrophy using a real-time modified COP-PCR technique with dried blood-spot DNA. Brain Dev. 2017, 39, 774–782. [Google Scholar]
- Kato, N.; Sa’Adah, N.; Ar Rochmah, M.; Harahap, N.I.; Nurputra, D.K.; Sato, H.; Sadewa, A.H.; Astuti, I.; Haryana, S.M.; Saito, T.; et al. SMA screening system using dried blood spots on filter paper: application of COP-PCR to the SMN1 deletion test. Kobe J. Med. Sci. 2015, 60, E78–E85. [Google Scholar]
- Kraszewski, J.N.; Kay, D.M.; Stevens, C.F.; Koval, C.; Haser, B.; Ortiz, V.; Albertorio, A.; Cohen, L.L.; Jain, R.; Andrew, S.P.; et al. Pilot study of population-based newborn screening for spinal muscular atrophy in New York state. Genet. Med. Off. J. Am. Coll. Med. Genet. 2018, 20, 608–613. [Google Scholar]


| Year of Birth | SMA Patients | Negative Controls |
|---|---|---|
| 2012 | 12 | 75 |
| 2013 | 13 | 50 |
| 2014 | 6 | 50 |
| 2015 | 7 | 50 |
| 2016 | 4 | 50 |
| 2017 | 3 | 50 |
| 2018 | 2 | 50 |
| Total: | 47 | 375 |
| Sample Count | MC—LightCycler 480 | MC—CFX96 Touch | MC—QuantStudio 5 | MLPA—P021 | |
|---|---|---|---|---|---|
| SMA positive samples | 47 | 47 | 47 | 47 | 47 |
| Negative controls | 375 | 375 | 375 | 375 | 375 |
| Retested samples | 5 (1.2%) | 2 (0.5%) | 1 (0.2%) | 17 (4.0%) |
| SMN2 exon7 | |||||||
|---|---|---|---|---|---|---|---|
| 0 | 1 | 2 | 3 | 4 | Total | ||
| SMN1exon7 | 0 | 0 | 1 | 13 | 27 | 6 | 47 |
| 1 | 0 | 3 | 2 | 4 | 0 | 9 | |
| 2 | 24 | 135 | 165 | 7 | 1 | 332 | |
| 3 | 3 | 14 | 12 | 1 | 0 | 30 | |
| 4 | 2 | 1 | 1 | 0 | 0 | 4 | |
| Total | 29 | 154 | 193 | 39 | 7 | 422 | |
© 2019 by the authors. Licensee MDPI, Basel, Switzerland. This article is an open access article distributed under the terms and conditions of the Creative Commons Attribution (CC BY) license (http://creativecommons.org/licenses/by/4.0/).
Share and Cite
Strunk, A.; Abbes, A.; Stuitje, A.R.; Hettinga, C.; Sepers, E.M.; Snetselaar, R.; Schouten, J.; Asselman, F.-L.; Cuppen, I.; Lemmink, H.; et al. Validation of a Fast, Robust, Inexpensive, Two-Tiered Neonatal Screening Test algorithm on Dried Blood Spots for Spinal Muscular Atrophy. Int. J. Neonatal Screen. 2019, 5, 21. https://doi.org/10.3390/ijns5020021
Strunk A, Abbes A, Stuitje AR, Hettinga C, Sepers EM, Snetselaar R, Schouten J, Asselman F-L, Cuppen I, Lemmink H, et al. Validation of a Fast, Robust, Inexpensive, Two-Tiered Neonatal Screening Test algorithm on Dried Blood Spots for Spinal Muscular Atrophy. International Journal of Neonatal Screening. 2019; 5(2):21. https://doi.org/10.3390/ijns5020021
Chicago/Turabian StyleStrunk, Annuska, Andre Abbes, Antoine R. Stuitje, Chris Hettinga, Eline M. Sepers, Reinier Snetselaar, Jan Schouten, Fay-Lynn Asselman, Inge Cuppen, Henny Lemmink, and et al. 2019. "Validation of a Fast, Robust, Inexpensive, Two-Tiered Neonatal Screening Test algorithm on Dried Blood Spots for Spinal Muscular Atrophy" International Journal of Neonatal Screening 5, no. 2: 21. https://doi.org/10.3390/ijns5020021