Identification of Milling Status Using Vibration Feature Extraction Techniques and Support Vector Machine Classifier


Department of Mechanical Engineering, National Chung Hsing University, Taichung City 40227, Taiwan
*
Author to whom correspondence should be addressed.
Inventions 2018, 3(2), 25; https://doi.org/10.3390/inventions3020025
Submission received: 11 February 2018
/
Revised: 5 April 2018
/
Accepted: 11 April 2018
/
Published: 17 April 2018
(This article belongs to the Special Issue Selected Papers from ICI2017 and Spintech Thesis Awards)
Abstract
:The objective of this study is to use the vibration signal features of spindles during the cutting processing to identify the different milling statuses in cases of diverse tooling parameter combinations. Accelerometers were placed on a spindle to measure vibration behaviors, and the milling status could be divided into idle cutting, initial feeding, and stable cutting. Vibration signal processing and analysis were conducted in the time domain, as well as in the frequency domain. The original vibration measurements were separated using empirical mode decomposition (EMD) in the time domain, so that the signal features could be extracted in certain frequency bands and the useless signal components and trends could be removed. Multi-scale entropy (MSE) and root mean square (RMS) were computed to extract the time domain features. In the frequency domain, the specific intrinsic mode functions (IMFs) that were decomposed using the EMD method were analyzed by fast fourier transform (FFT) and a frequency normalization technique to extract the features of apparent physical representations. The Fisher scores (FS) of the extracted features are calculated to select the high-priority signal features. The selected high-priority signal features are utilized to identify the different milling statuses through a support vector machine (SVM). The results show that an identification accuracy of 98.21% could be obtained at the Z axis, and the average accuracy would be 95.91% for the three axes combination.
1. Introduction
In the machine tool industry, smart machine tool technology is an important goal in increasing product value. Most machine tool products are nowadays restricted to a specific structural stability, stiffness, as well as precision. In order to promote these products to high-level markets, advanced design analyses and intelligent techniques must be introduced to increase product value.
The intelligent processing of machine tools usually needs precise information about tooling conditions to make accurate determinations, as well as responses and decisions. For instance, the predictions of chattering, cutter wearing, and the residual life of bearings need precise information regarding the tooling status. If the status information is lacking, the system may be misled into an incorrect determination and decision, and, thus, result in functional errors. Therefore, accurate real-time identification of tooling status is an important technique in smart machining and intelligent manufacturing.
Few studies related to milling status identification can be found in the literature, even though this technology is essential in smart machining. In order to enhance the accuracy of condition monitoring in smart machines, relevant methods are employed to develop techniques for milling status identification. As stated in information theory, entropy can be quantified to represent the system dynamic characteristics in measurements. Costa et al. [1,2] proposed the multi-scale entropy (MSE) concept and their study indicated that the sample entropy (SE), which is applied for only one scale, cannot effectively identify the clinical physiological signals among healthy humans and pathological patients. Therefore, they proposed a coarse-grain process to convert measured signals to different scales, and then determined the SE values in different scales to construct the MSE. Their studies revealed that the identification accuracy of physiological signals could be improved. Their studies also demonstrated the effectiveness of separating human heartbeat time series among healthy persons and patients with atrial fibrillation or congestive heart failure. Apparently, their data analysis method can be employed for vibration signal analysis in machining applications. Madzarov et al. [3] summarized the advantages and disadvantages of different support vector machine (SVM) algorithms for separating multi-class purposes, and thus the enhanced SVM is eligible to utilized in milling status classification. Furthermore, the combinations of the Hilbert-Huang Transform (HHT) and SVMs were used, in recent years, to conduct research on malfunction diagnostics in rotating machinery. Yang et al. [4] employed HHT combined with SVM to classify normal bearing and bearings with defective inner and outer races. The diagnosis of different bearing faults was studied by Seryasat et al. [5] using the empirical mode decomposition (EMD) method [6] and multi-class SVM. In addition, the research showed that the features of multi-faults in bearings could be extracted from specific intrinsic mode functions (IMFs) through envelope analysis [7]. Furthermore, the EMD method was also applied to estimate loads during milling processes [8].
Based on the research results of the aforementioned researchers, the relevant signal feature extraction techniques and group separation methods were employed in milling status identification to fulfil one of the steps for smart machining. In this study, the spindle vibration signals of machine tools were measured. The signals were then separated using the EMD method to synthesize the signal components of certain frequency ranges. The features in the time domain and frequency domain were calculated. The Fisher score (FS) was calculated to evaluate the significance of the extracted features. SVM was used to identify the different milling statuses within a short period of time. The results show that the proposed approach is capable of identifying different milling statuses with a very high accuracy. All the experiment data can be downloaded from the website of research data collection at Dynamics Analysis and Control Laboratory of National Chung-Hsing University [9], and can be used for further reference and verification.
2. Theory and Method
2.1. Empirical Mode Decomposition
The complicated measurements normally contain the components of different frequency bands, including the physical quantities that we wish to measure as well as the external intermittent noises [10]. Signal separation methods are usually used to decompose complicated signals into several independent components. The EMD method is able to separate a signal into a number of IMFs of different frequencies as the bases. This process assumes that any complicated signal, X(t), is composed of a limited number of IMF components. The EMD process can be simply expressed as:
where Cn(t) represents the n-th IMF and r(t) represents the signal residue or signal trend.
2.2. Fisher Score
The objective of feature selection through Fisher score evaluation is to select the most relevant features from the original features, and, thus, the selected features can be used to achieve accurate identification with a high efficiency. The feature selection process can, not only reduce the computation efforts of the classifier, but can also help us to understand the causality among the selected features and the tooling status. In this study, we used FS to select significant features that are highly related to milling status. FS mainly represents the distance between groups, and, hence, the calculated FS values are not absolute. The features are selected based on the FS comparison [11].
Assume that we want to use FS to evaluate the distinction of the k-th features between the i-th and j-th classes: The k-th feature of the i-th class has a set {vik(1), vik(2),...,vik(Ni)}. The mean and standard deviation of the k-th feature in the i-th class are formulated as:
The FS of the k-th features between the i-th and j-th classes is determined as:
The greater FS value represents that the k-th feature has more significance in classification between the i-th and j-th classes.
2.3. Support Vector Machine
The SVM algorithm is broadly utilized to classify different classes of features according to the characteristics of known cluster labels. For a given group of already-classified data, the SVM model can be built through a training process. The trained SVM model can be then used to classify the data sets and predict the cluster labels. Basically, the SVM algorithm is able to solve for the classification problem of data sets for two classes. In cases of data sets with more than two classes, the classification problem can be resolved by using different SVM structures, such as one-against-one SVM, one-against-rest SVM, and hierarchical SVM. A previous study [3] showed that the one-against-one SVM can achieve more accurate and reliable classification results than the other two types of SVM structures.
3. Experiment Setup and Process
In this experiment, the tapping center that was developed by the Industrial Technology Research Institute (ITRI) was utilized as the test bed. During the milling process, the accelerometers were installed to measure the vibration accelerations of the spindle along the three axes directions, as shown in Figure 1. Figure 2 shows the milling sequence and direction. The vibration signals of the spindle were recorded on a computer via the data-acquisition device for analyses. All the experiment data sets can be downloaded from the website of research data collection at Dynamics Analysis and Control Laboratory of National Chung-Hsing University [8] for further reference and verification.
The milling statuses consist of idle cutting, initial feeding, and stable cutting in this experiment. The status of idle cutting is defined as the process before the turning tool contacts the work piece. The status of initial feeding is defined as the process where the tool contacts the work piece until the tool enters into the work piece entirely. The status of stable cutting is defined as the process when the tool cuts entirely into the work piece.
The flowchart of the signal processing and analysis in this experiment is shown in Figure 3. The vibration accelerations of the spindle along the directions of the three axes were measured, and then the features in the time and frequency domains were extracted every 0.5 s. In the time domain analysis, EMD was first utilized to separate the vibration measurements and reconstruct the signals by adding the IMFs of certain frequency bands. MSE, root-mean-square (RMS), kurtosis, and skewness values of the reconstructed signals were calculated as the time domain features. On the other hand, fast fourier transform (FFT) was employed to determine the spectral features of the reconstructed signals in the frequency domain. The spindle rotation speeds in this experiment were set to 900, 1000, 1800, 1900, 2000, 2100, 2700, and 3000 rpm. The feed rates were set to 228, 240, 252, 320, 400, 420, 532, 560, and 588 mm/min. The cutting depths were 0.5–1.0, with increments of 0.1 mm. In order to extract the rotation speed-related features, the frequency domain features need to be normalized to obtain the features in the order domain [12]. As shown in Figure 4, For example, Figure 4 shows the FFT spectrum of vibration signal under rotating speed of 3000 rpm. The FFT spectrum is normalized by a rotation speed of 3000 rpm to obtain its corresponding order distribution, as shown in Figure 5. The frequency domain features also consist of the ones not related to rotation speed, which may be attributed to natural structural vibration or external noise, and hence they should be removed to enhance the accuracy of identification.
4. Experiment Result and Analysis
4.1. Fisher Score Feature Selection
FS was utilized to evaluate the significance of features extracted in the time domain, as well as in the frequency domain. The FS value could estimate the deviation of data in each class and the distances between the different classes. Therefore, FS was able to quantify the distinction among the different classes of milling statuses, such as idle cutting, initial feeding, and stable cutting. The features were selected according to their high FS values from among the three classes. As shown in Table 1, the features of the 4× and 8× rotation speeds were capable of distinguishing the three classes of milling statuses, and hence were selected as significant features in the frequency domain.
4.2. Time Domain Signal Analysis
Figure 6 and Figure 7 show the MSE of the vibration acceleration at the Z axis under different rotation speeds. Regardless of the spindle rotation speed, the entropy values in idle cutting, initial feeding, and stable cutting were all significantly different in some scales. This indicated that the complexities of the vibration signals of the three statuses had obvious distinctions [13,14].
4.3. Frequency Domain Signal Analysis
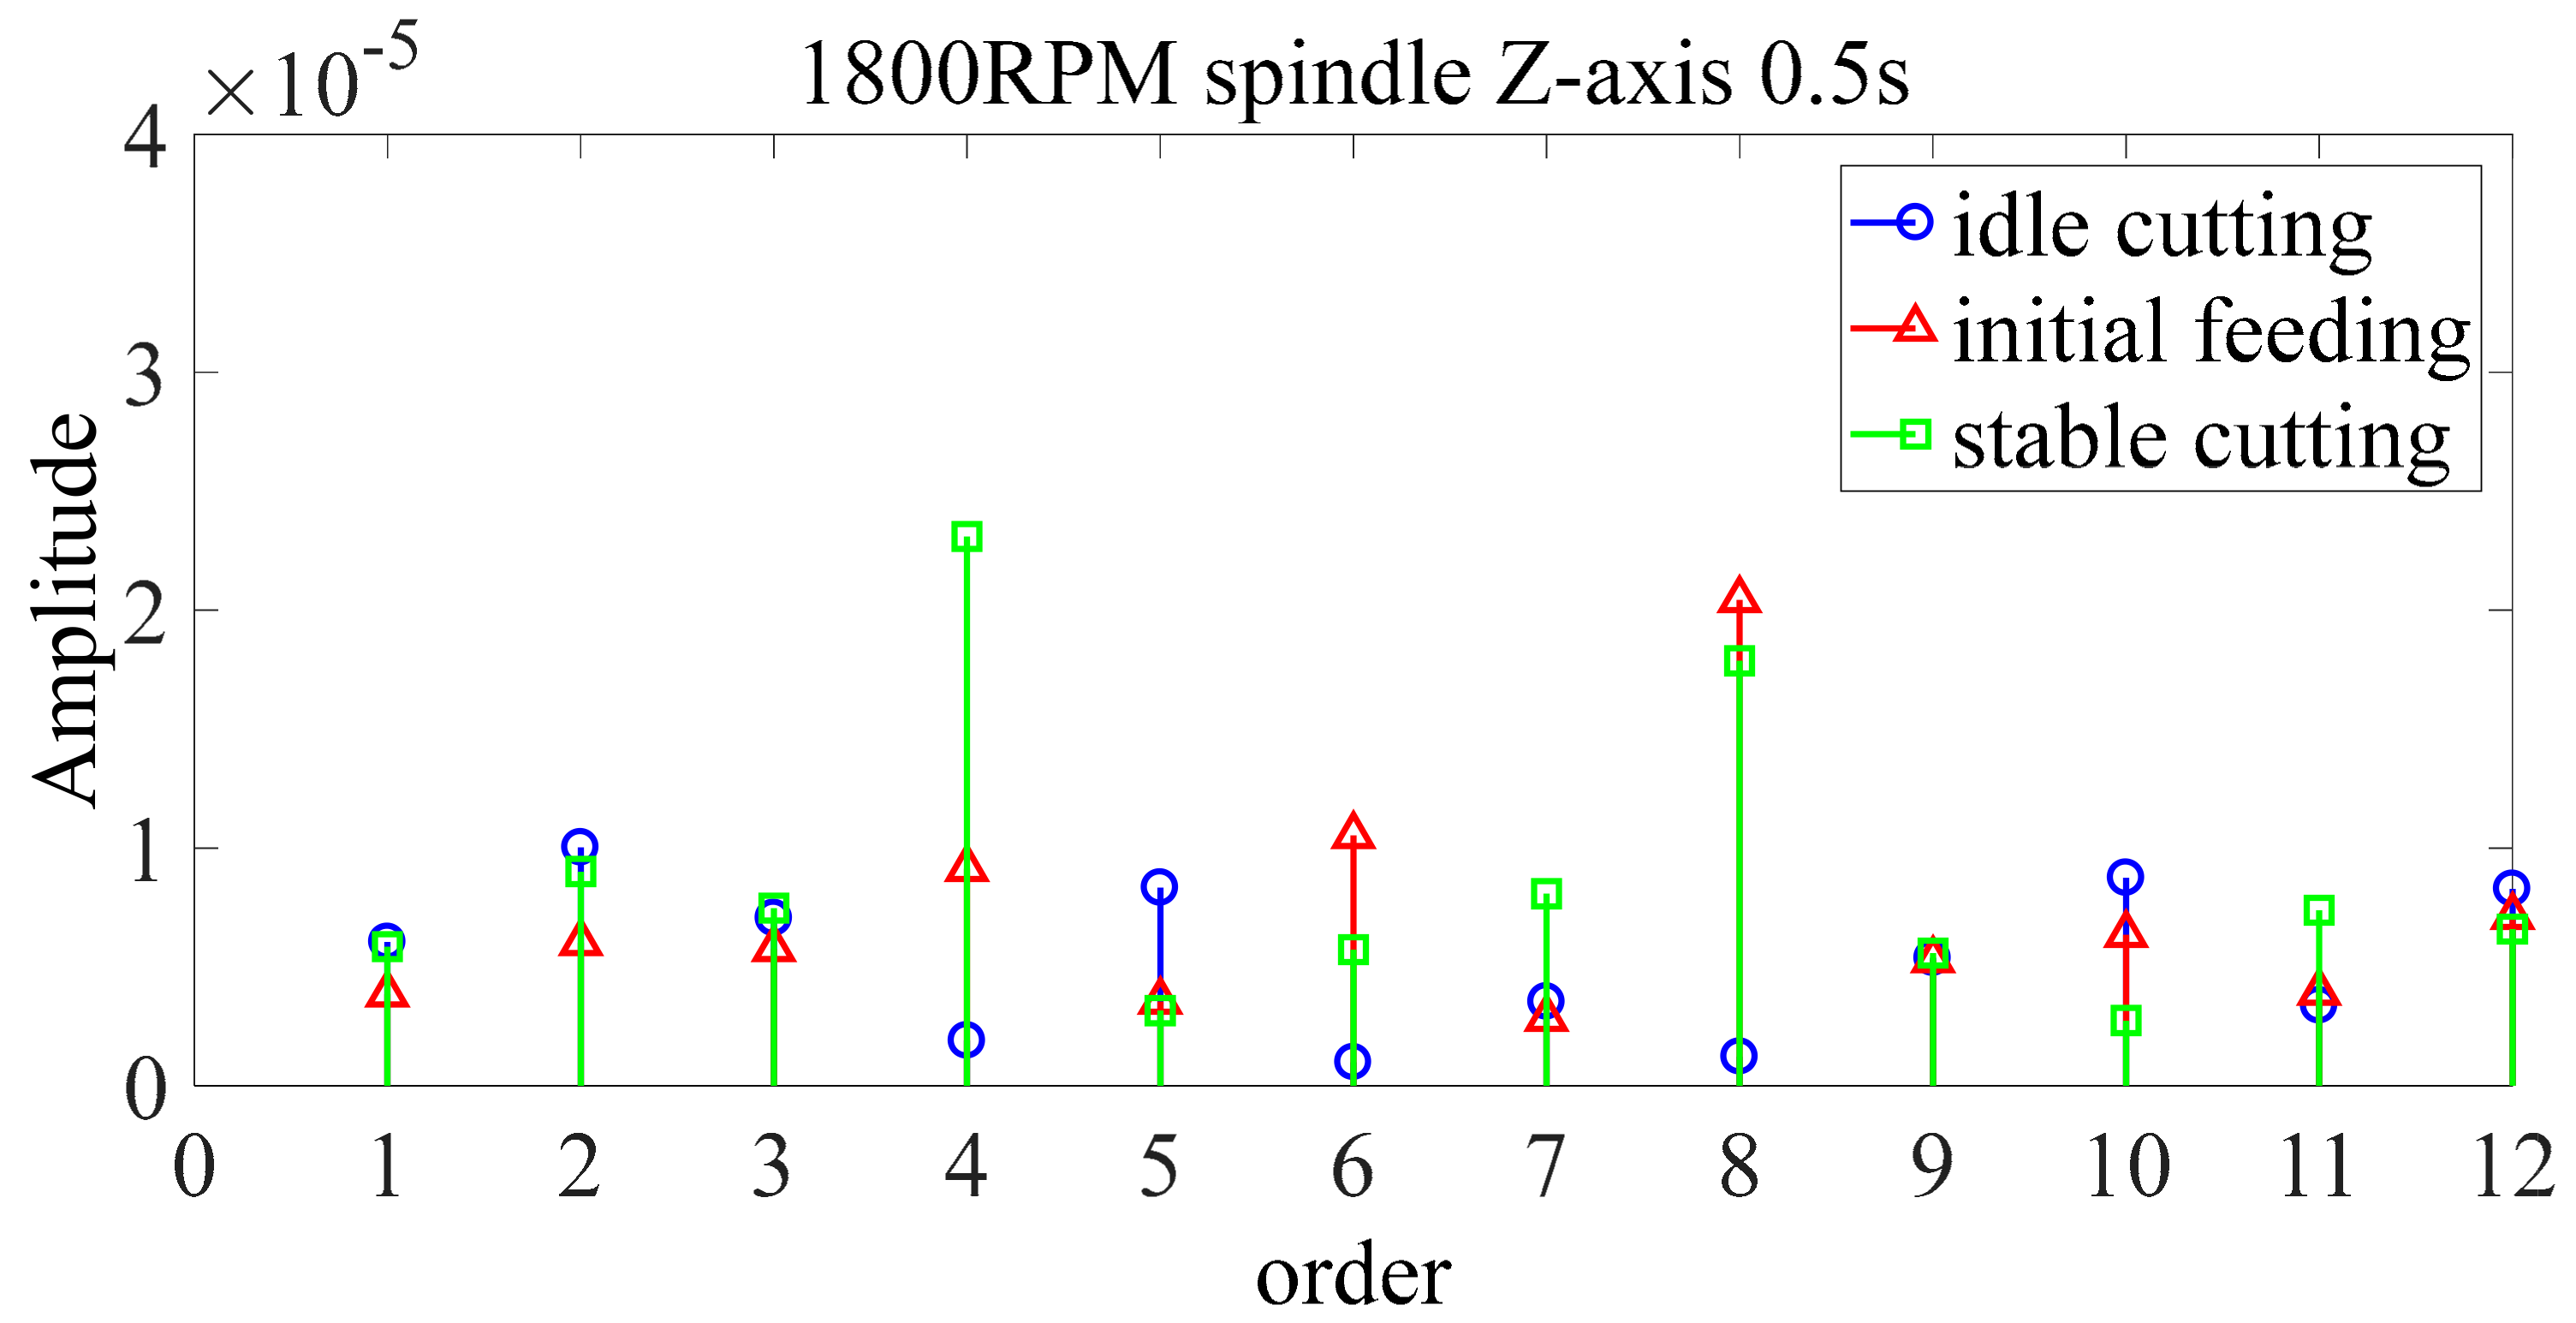
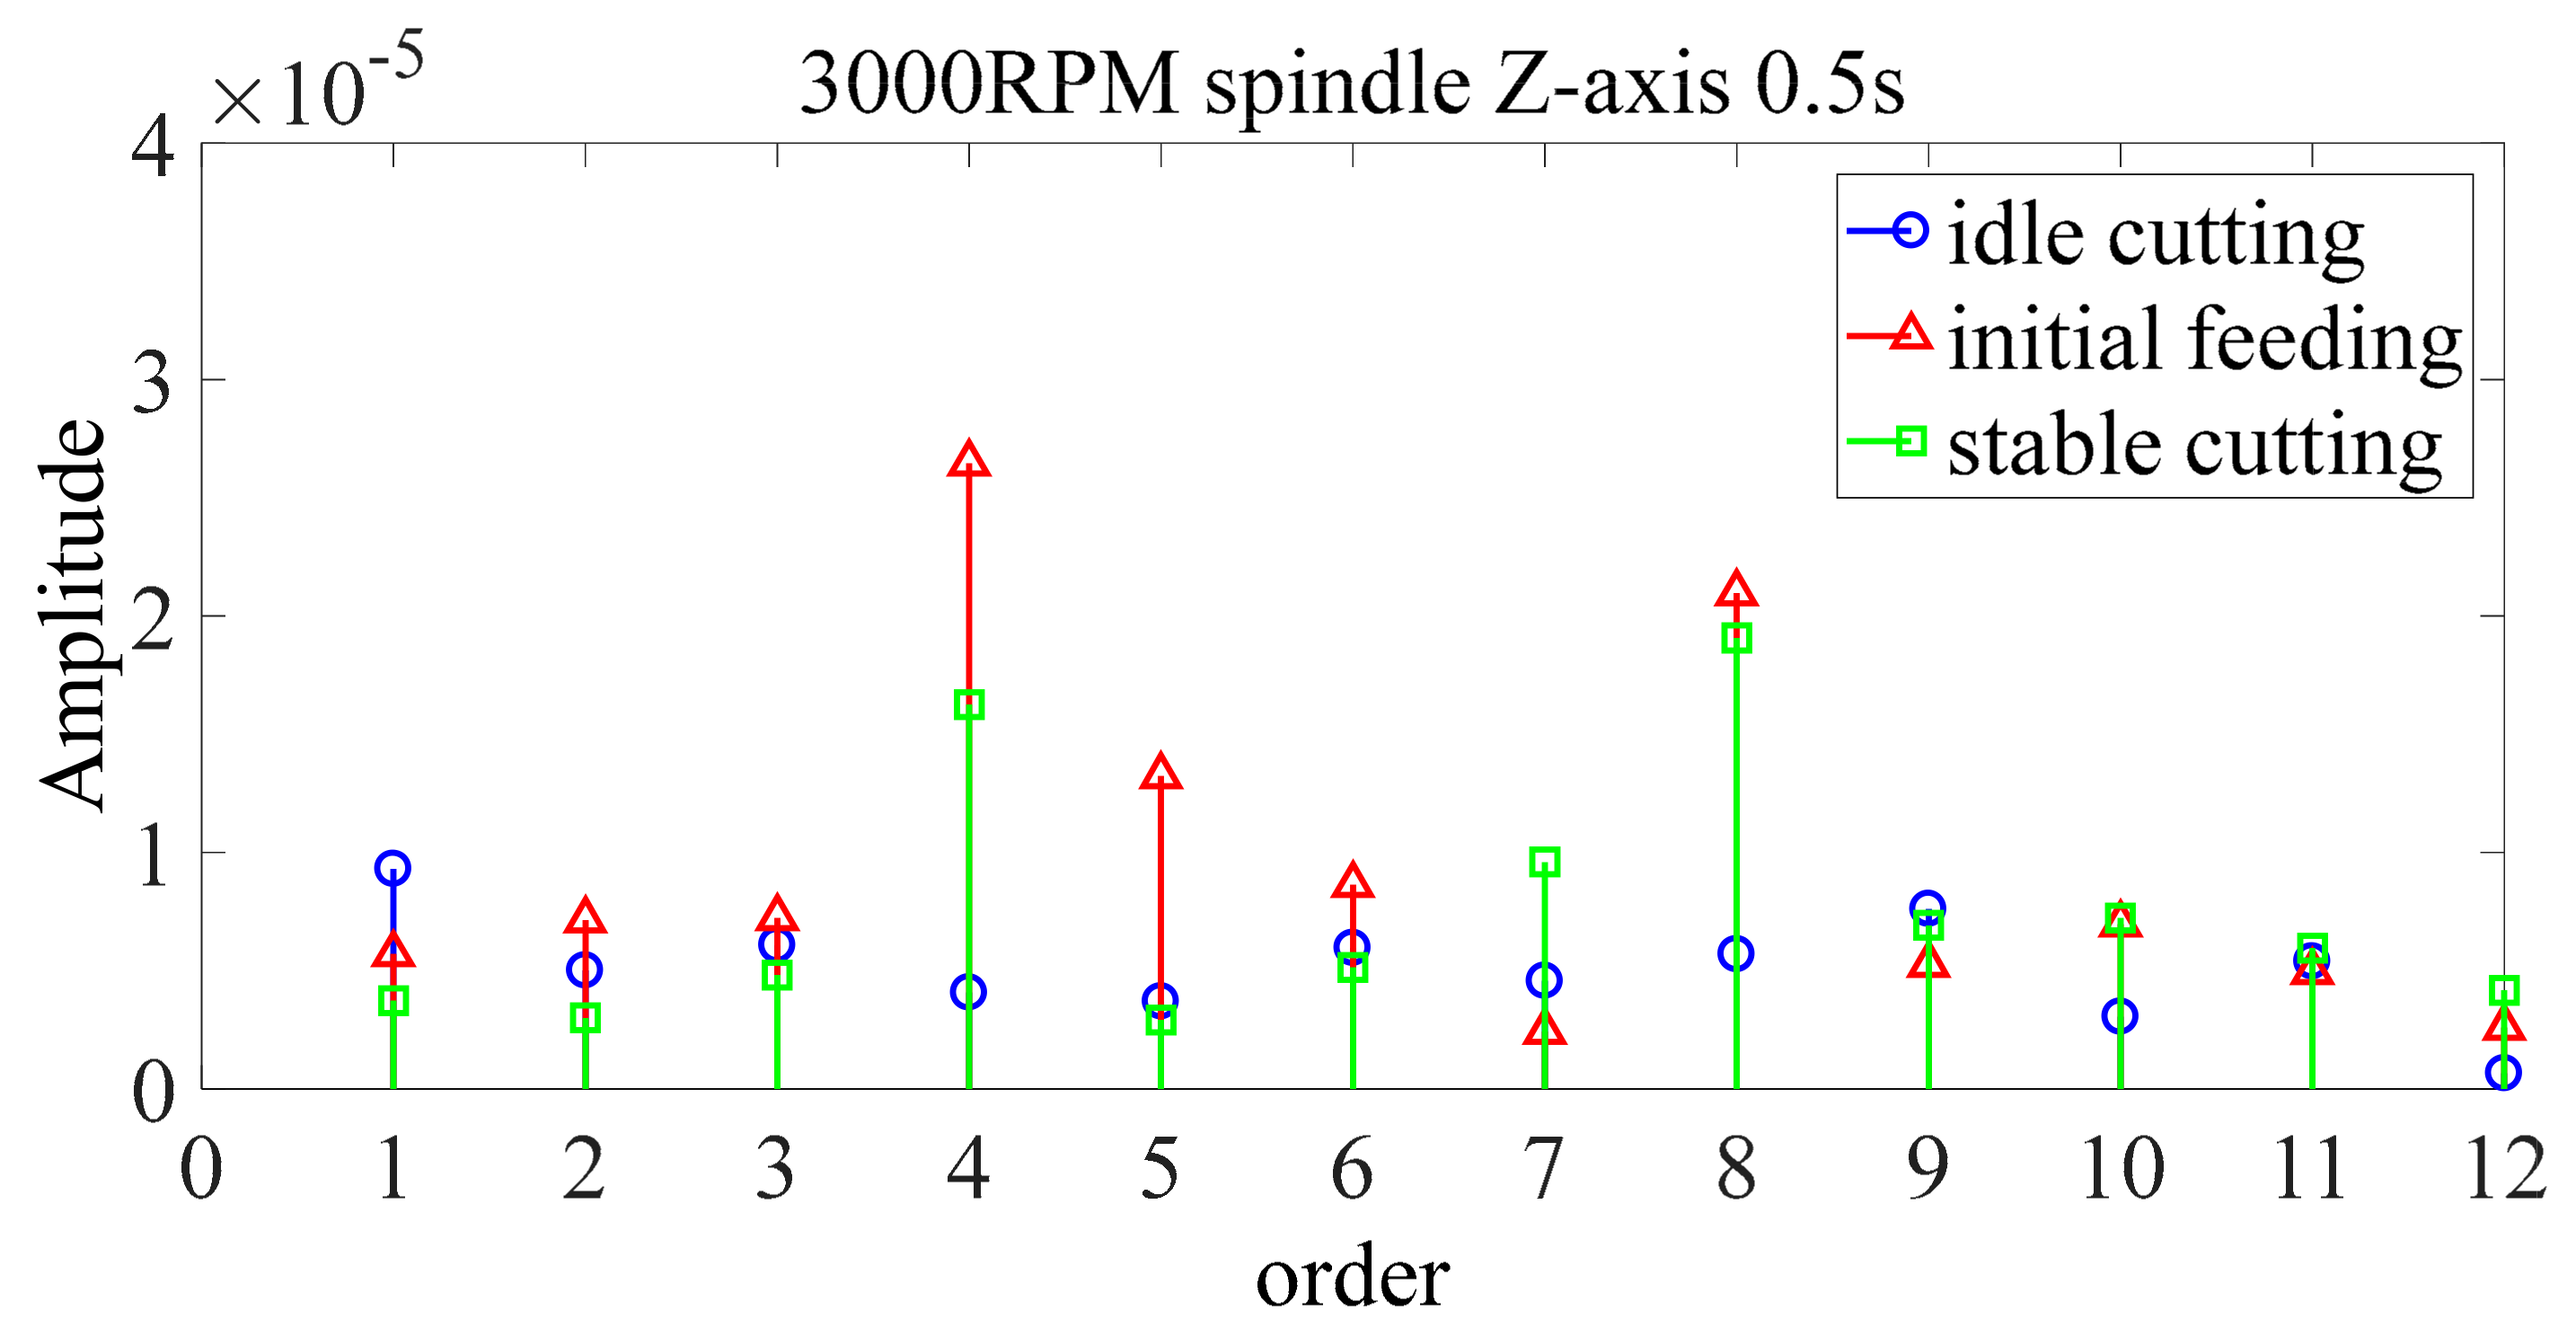
As stated in the previous section, the frequency domain features consisted of those related to the spindle speed (such as characteristic frequencies of rotating machinery) and those not related to spindle speed (such as the structural resonant frequencies). When observing the order spectrum, the features that are not related to the rotation speed may be found around the orders in which the rotation speed-related features are also located. These order features may interfere with each othre and cause misunderstanding. The order spectral distributions under 3000 rpm are shown in Figure 8 (entire vibration signal) and Figure 9 (with removal of the order features not related to the rotation speed). It was noted that the order distribution had obvious changes at the sixth and eighth orders after removing the features that were not related to rotation speed. Namely, the major orders affected by the rotation-speed-unrelated features were the 6× and 8× rotation speeds. Figure 10 (entire vibration signal) and Figure 11 (with removal of the order features not related to rotation speed) showed the order spectra under 1800 rpm. As observed in the figures, the apparent differences between the order distributions could be found at the sixth and tenth orders. This means that the major orders that were affected by the features were not related to rotation speed were the 6× and 10× orders. It was also observed in Figure 9 and Figure 11 that the energy at the 4× and 8× orders had an apparent distinction between the classes of idle cutting and initial feeding. The main reason was that the tool we used had four blades, and, hence, the cutting frequency on the surface of the work piece could be found at the 4× and 8× orders. Therefore, the features at these orders were capable of identifying the milling statuses of idle cutting and initial feeding.
4.4. Support Vector Machine Classification
The selected features in the time and frequency domains represent the ones of high distinctions among the different milling statuses. SVM was then employed to identify the features in idle cutting, initial feeding, and stable cutting. This validates the identification results of different milling statuses. Fifty percent of the features from the data of idle cutting, initial feeding, and stable cutting were randomly selected for the training model. The remaining fifty percent of the data were used for testing.
Table 2 shows the SVM result identifying the milling statuses by using all the features at the three axes, including the features not related to rotation speed. Table 3 shows the SVM result of identifying the milling statuses through using the selected features at the three axes according to the FS values and removing the features not related to rotation speed. As observed in the two tables, the identification accuracy could be enhanced by screening the features according to their FS values and by removing the features that were not related to rotation speed. On the other hand, it can also be noted that the features at the Z axis had more impacts on identifying the milling statuses than at the other two axes.
5. Conclusions
The rotation speed normalization technique was utilized in this research to resolve the problem of frequency domain feature variations under different rotation speeds, and, thereafter, the difficulty of milling status identification. FS was used to evaluate the significance of extracted features, and thus the selected features could enhance the identification accuracy of SVM for milling statuses. The study also demonstrated the improvement in identification accuracy by removing the frequency domain features that were not related to rotation speed.
Acknowledgments
The research is partially supported by the Ministry of Science and Technology in Taiwan, Republic of China, under the Project Number MOST 105-2221-E-005-025-MY3 and MOST 106-2218-E-194-002.
Author Contributions
Tian-Yau Wu was in charge of the supervision in this research, including initiating the research project, conducting the experiment setup, advising the data analysis methods and final manuscript writing. Che-Yuan Chang was in charge of the experiment implementation, vibration signal acquisition and signal analysis. All authors have read and approved the final manuscript.
Conflicts of Interest
The authors declare no conflicts of interest.
References
- Costa, M.; Goldberger, A.L.; Peng, C.K. Multi-scale entropy analysis of complex physiologic time series. Phys. Rev. Lett. 2002, 89, 068102. [Google Scholar] [CrossRef] [PubMed]
- Costa, M.; Goldberger, A.L.; Peng, C.K. Multi-scale entropy analysis of biological signals. Phys. Rev. E 2005, 71, 021906. [Google Scholar] [CrossRef] [PubMed]
- Madzarov, G.; Gjorgjevikj, D.; Chorbev, I. A Multi-class SVM Classifier Utilizing Binary Decision Tree. Informatica 2009, 33, 233–241. [Google Scholar]
- Yang, Y.; Yu, D.J.; Cheng, J.S. A fault diagnosis approach for roller bearing based on IMF envelope spectrum and SVM. Measurement 2007, 40, 943–950. [Google Scholar] [CrossRef]
- Seryasat, O.R.; Shoorehdeli, M.A.; Honarvar, F.; Rahmani, A.; Haddadnia, J. Multi-fault diagnosis of ball bearing using intrinsic mode functions, Hilbert marginal spectrum and multi-class support vector machine. In Proceedings of the International Conference on Mechanical and Electronics Engineering, Taiyuan, China, 1–3 August 2010; Volume 2, pp. 145–149. [Google Scholar]
- Huang, N.E.; Shen, Z.; Long, S.R.; Wu, M.L.C.; Shih, H.H.; Zheng, Q.N.; Yen, N.C.; Tung, C.C.; Liu, H.H. The empirical mode decomposition and the Hilbert spectrum for nonlinear and non-stationary time series analysis. Math. Phys. Eng. Sci. 1998, 454, 903–995. [Google Scholar] [CrossRef]
- Pan, M.C.; Tsao, W.C. Using appropriate IMFs for envelope analysis in multiple fault diagnosis of ball bearings. Int. J. Mech. Sci. 2013, 69, 114–124. [Google Scholar] [CrossRef]
- Liu, Z.; Chai, T.Y.; Yu, W.; Tang, J. Multi-frequency signal modeling using empirical mode decomposition and PCA with application to mill load estimation. Neurocomputing 2015, 169, 392–402. [Google Scholar] [CrossRef]
- Identification of Milling Status Using Vibration Feature Extraction Techniques and Support Vector Machine Classifier. Available online: http://web.nchu.edu.tw/~tianyauwu/data/milling_status/milling_status.htm (accessed on 17 April 2018).
- Wu, Z.; Huang, N.E. Ensemble empirical mode decomposition: A noise assisted data analysis method. Adv. Adapt. Data Anal. 2009, 1, 1–41. [Google Scholar] [CrossRef]
- Song, Q.; Jiang, H.; Liu, J. Feature selection based on FDA and F-score for multi-class classification. Expert Syst. Appl. 2017, 81, 22–27. [Google Scholar] [CrossRef]
- Wu, T.Y.; Chen, J.C.; Wang, C.C. Characterization of gear faults in variable rotating speed using hilbert-huang transform and instantaneous dimensionless frequency normalization. Mech. Syst. Signal Process. 2012, 30, 103–122. [Google Scholar] [CrossRef]
- Wu, S.D.; Wu, C.W.; Wu, T.Y.; Wang, C.C. Multi-scale analysis based ball bearing defect diagnostics using mahalanobis distance and support vector machine. Entropy 2013, 15, 416–433. [Google Scholar] [CrossRef]
- Wu, T.Y.; Yu, C.L.; Liu, D.C. On multi-scale entropy analysis of order-tracking measurement for bearing fault diagnosis under variable speed. Entropy 2016, 18, 292. [Google Scholar] [CrossRef]
Figure 1.
Installation locations of accelerometers at the spindle.
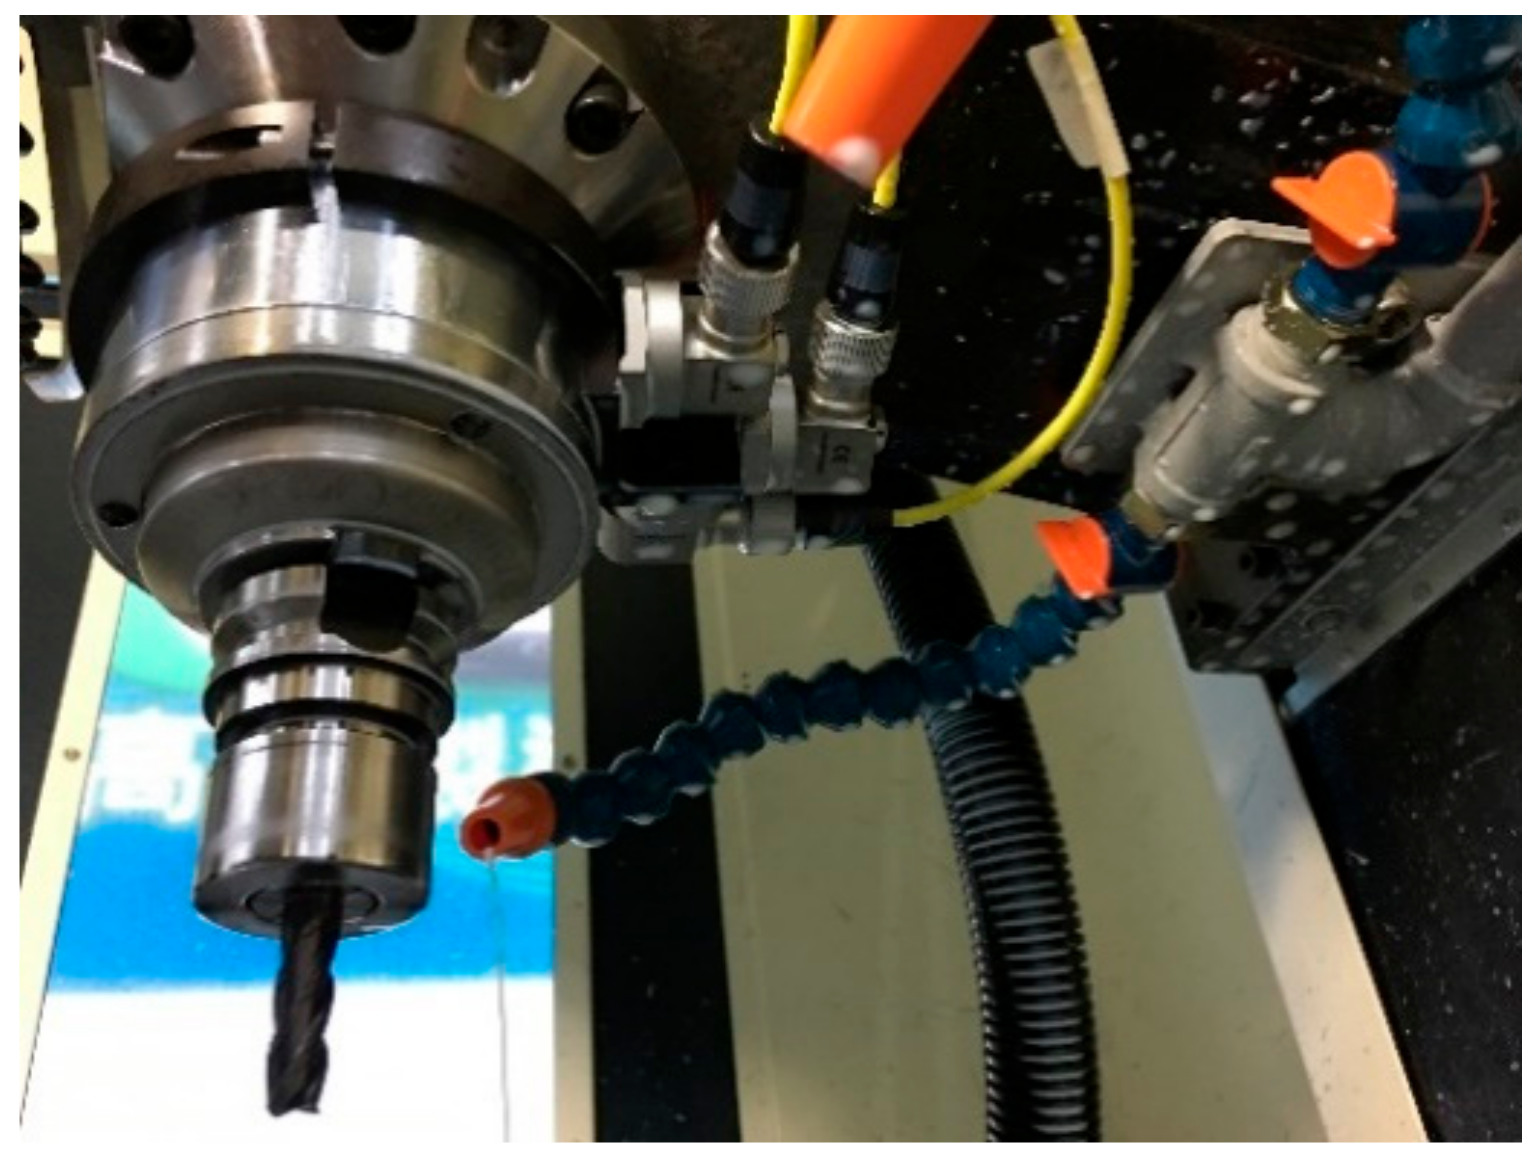
Figure 2.
Milling sequence and direction on work piece (yellow number: milling sequence; red arrow: milling direction).
Figure 2.
Milling sequence and direction on work piece (yellow number: milling sequence; red arrow: milling direction).
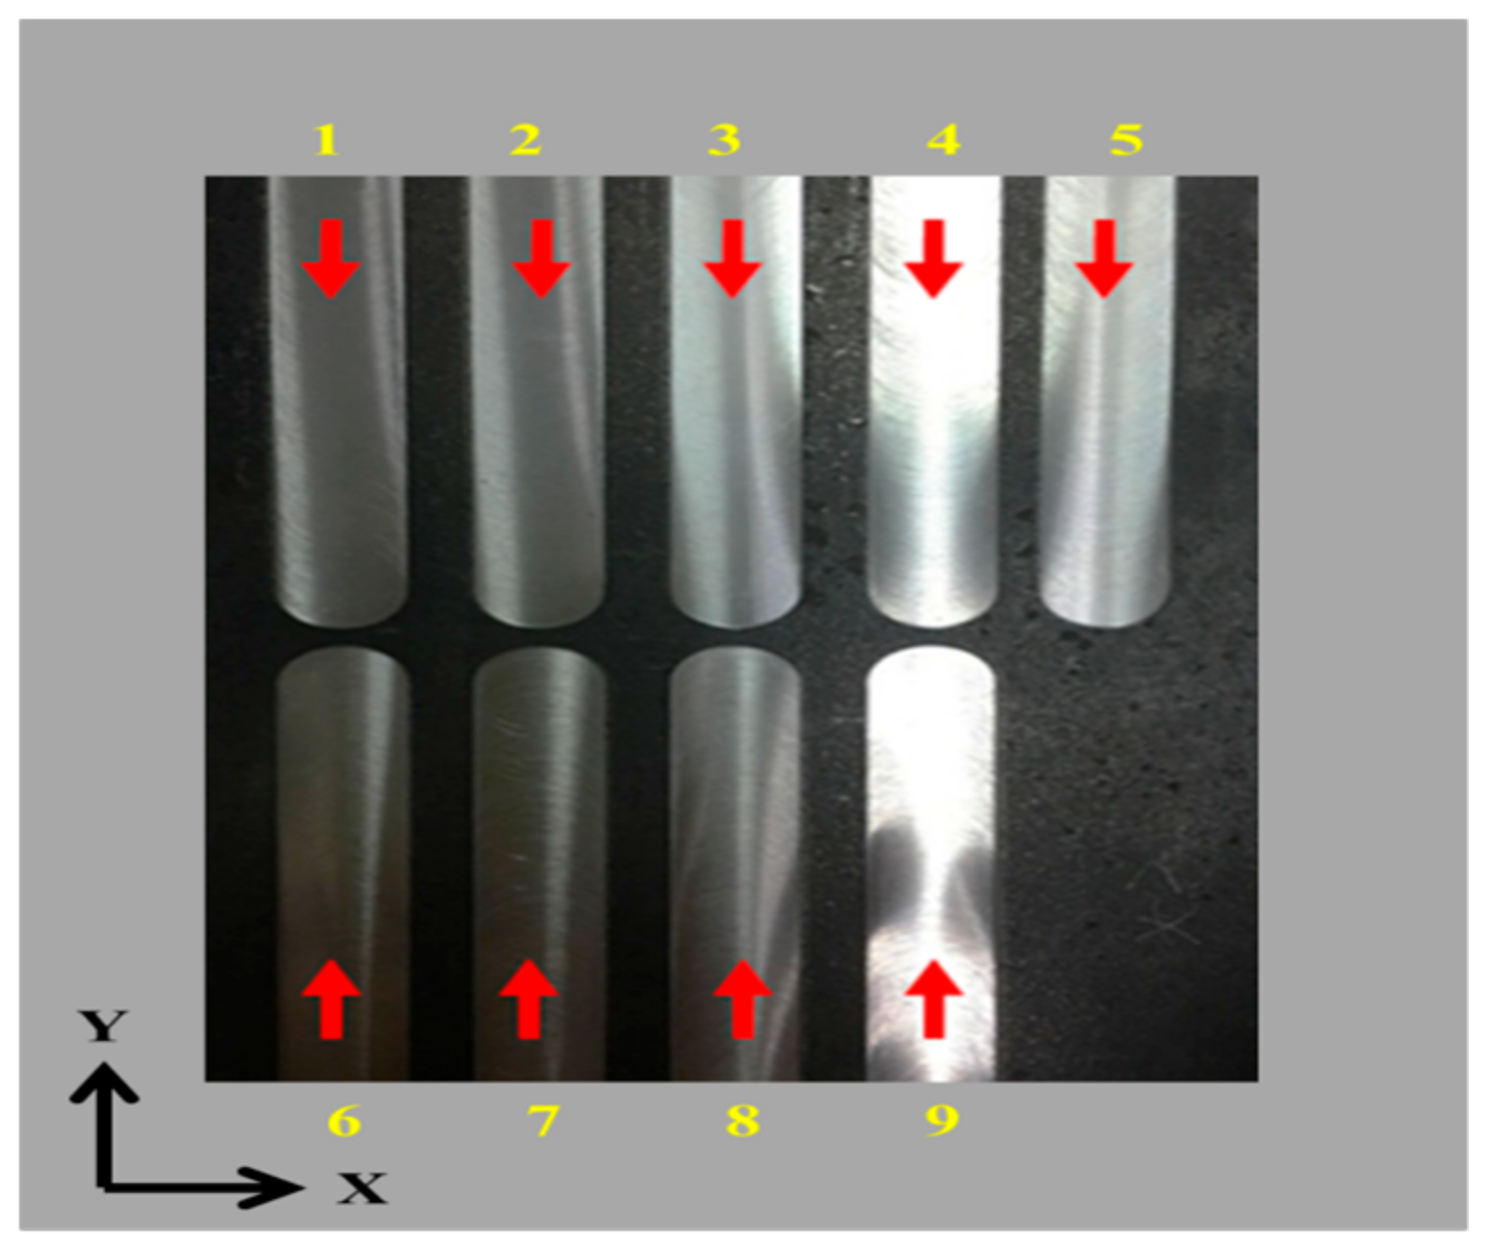
Figure 3.
Signal processing and analysis procedures.
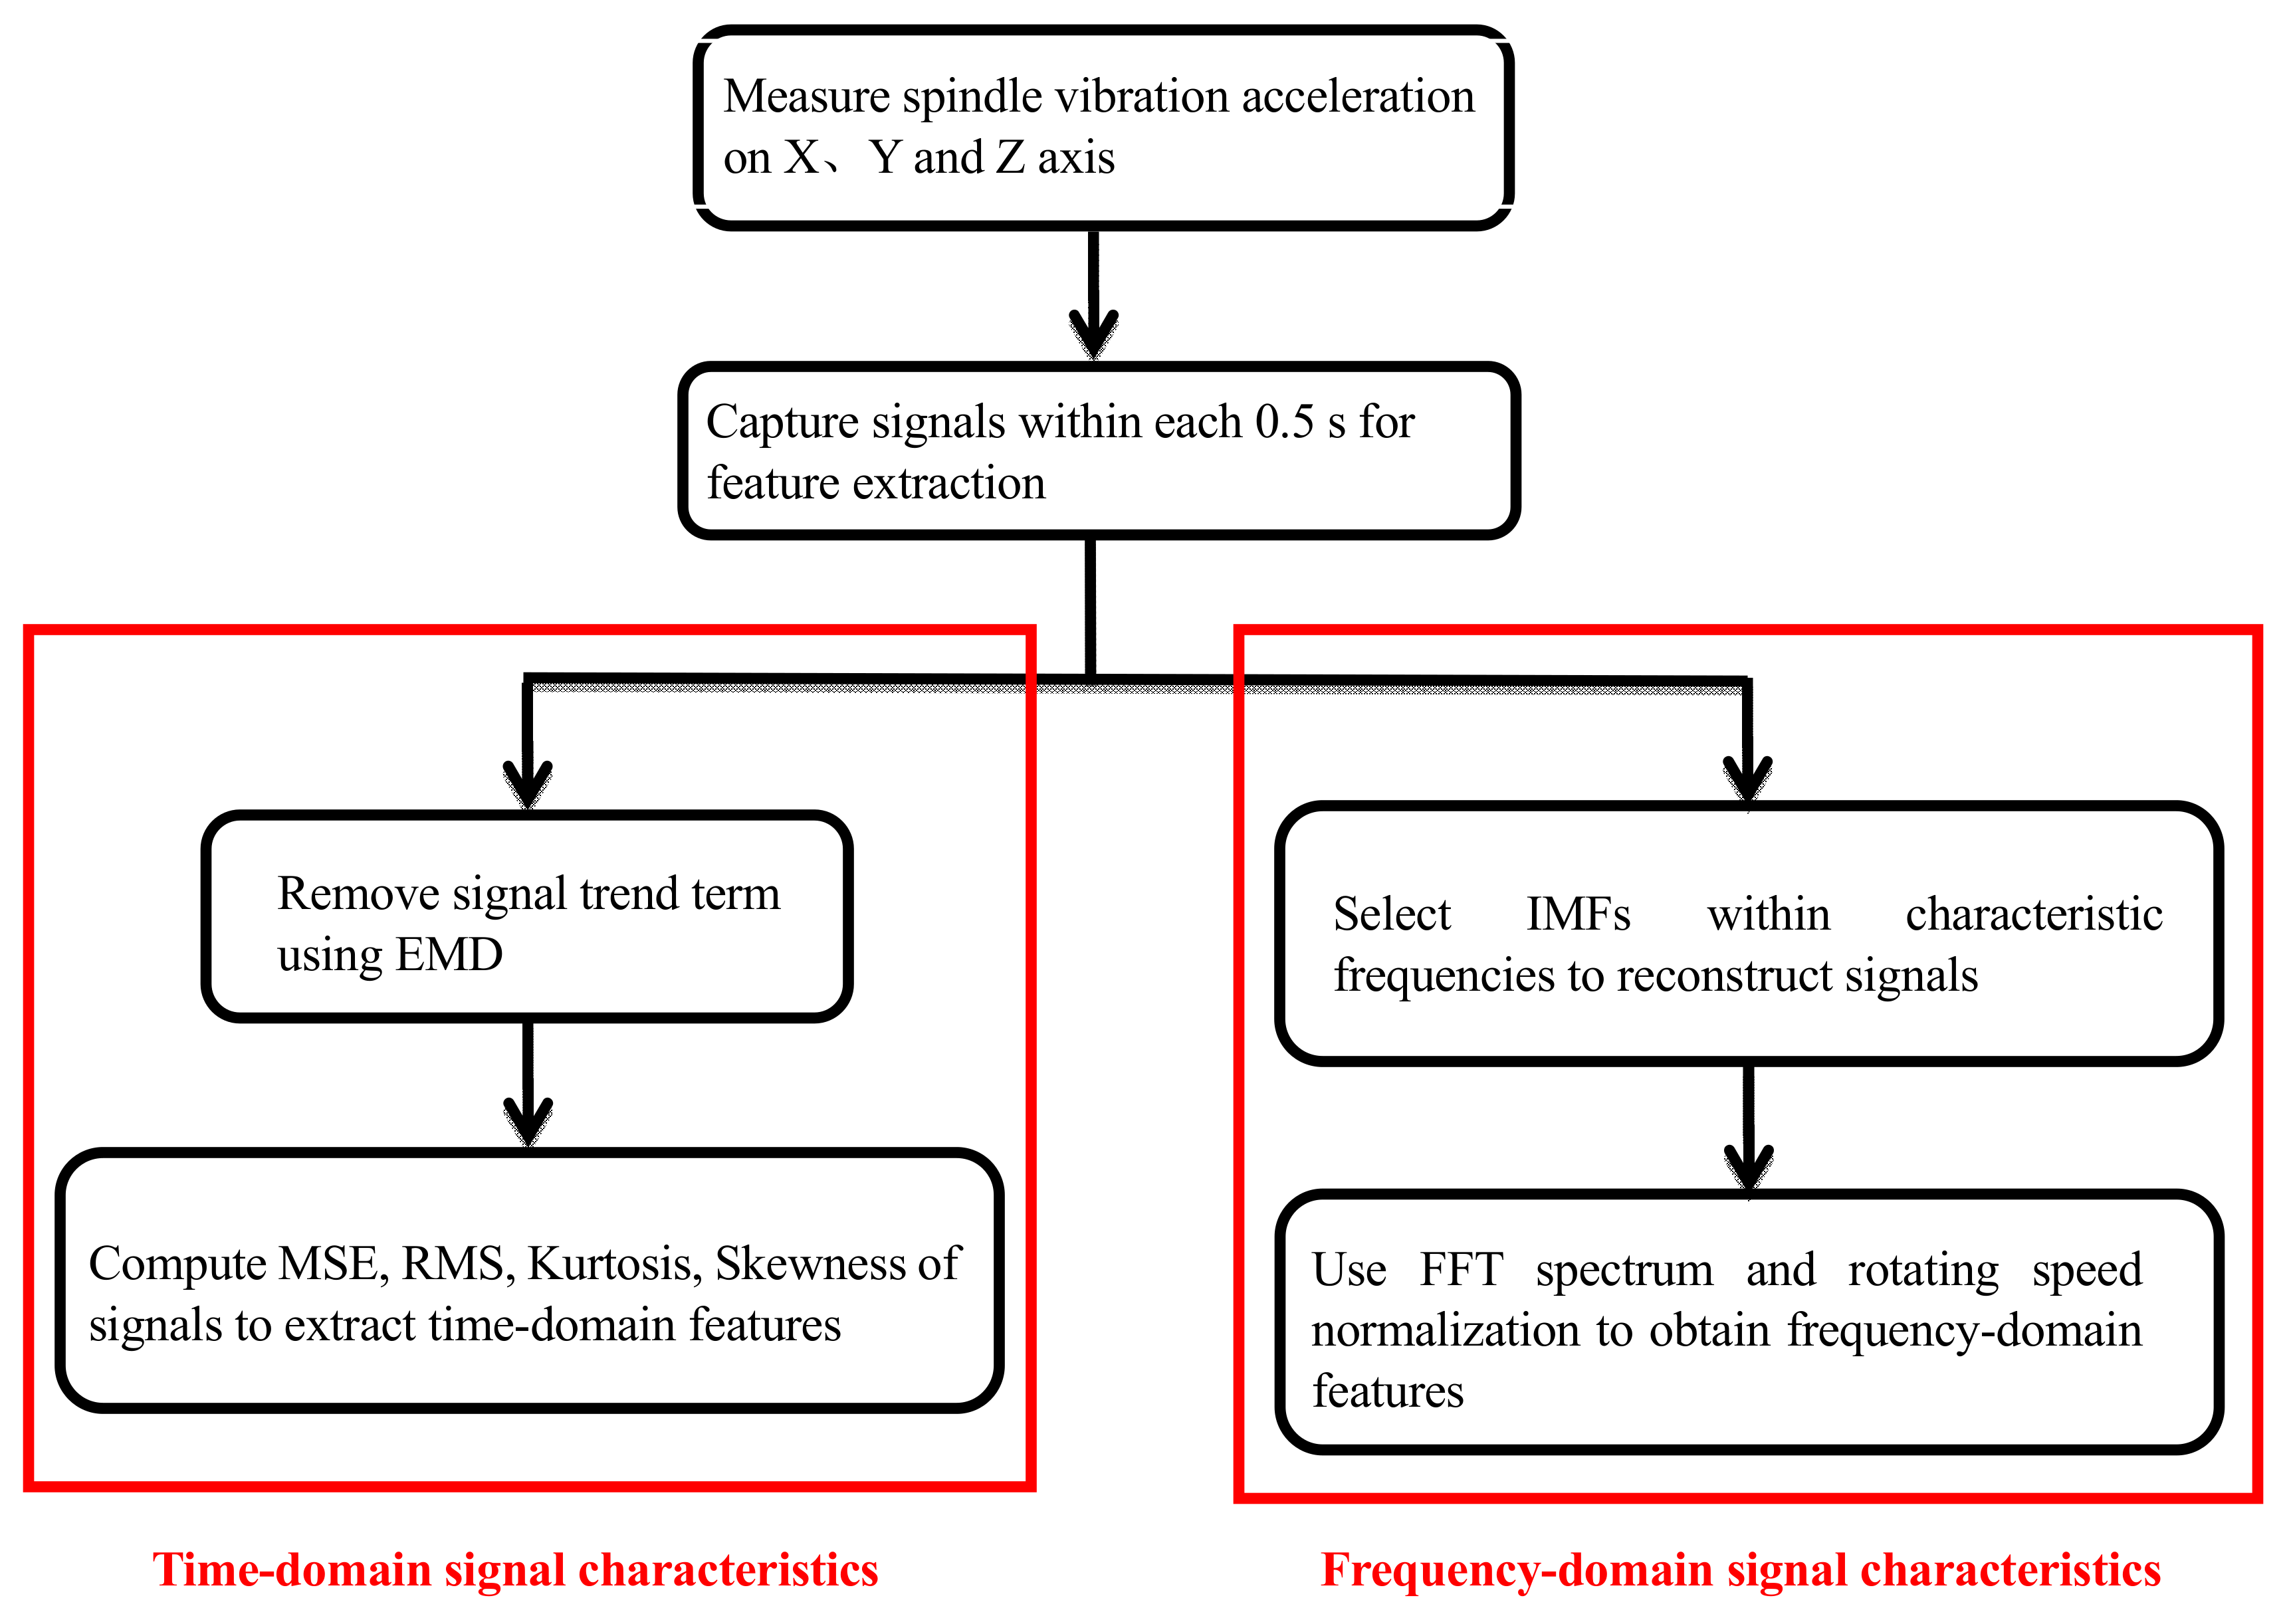
Figure 4.
Fast fourier transform (FFT) spectrum of the vibration signal (using a rotation speed of 3000 rpm as an example).
Figure 4.
Fast fourier transform (FFT) spectrum of the vibration signal (using a rotation speed of 3000 rpm as an example).
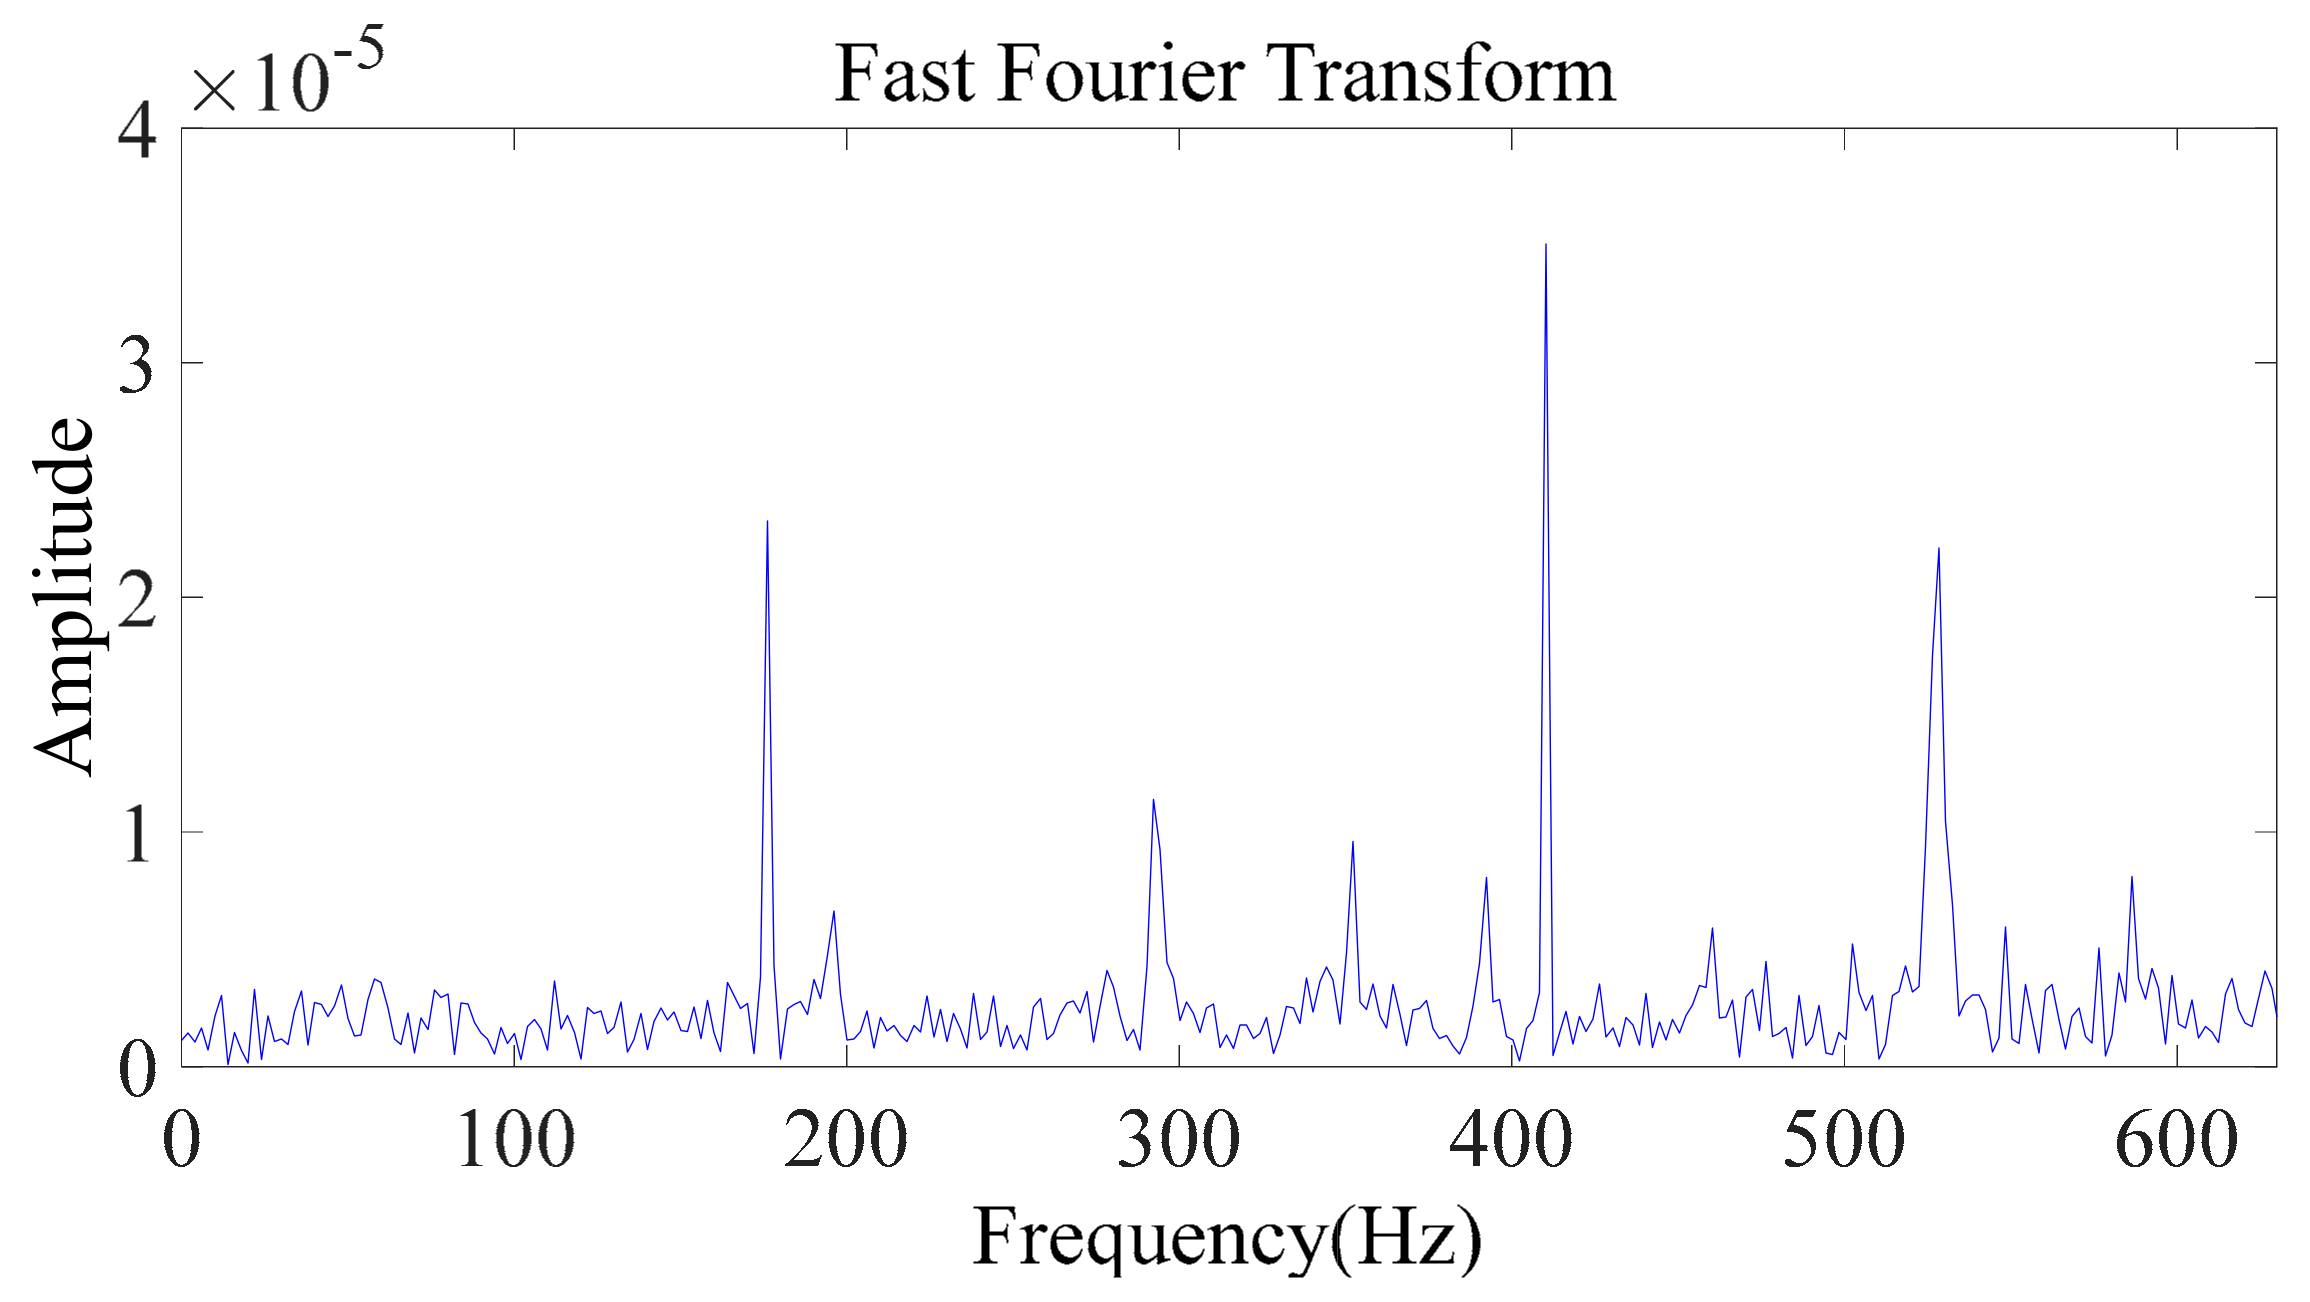
Figure 5.
Order distribution after speed normalization (using a rotation speed of 3000 rpm as an example).
Figure 5.
Order distribution after speed normalization (using a rotation speed of 3000 rpm as an example).
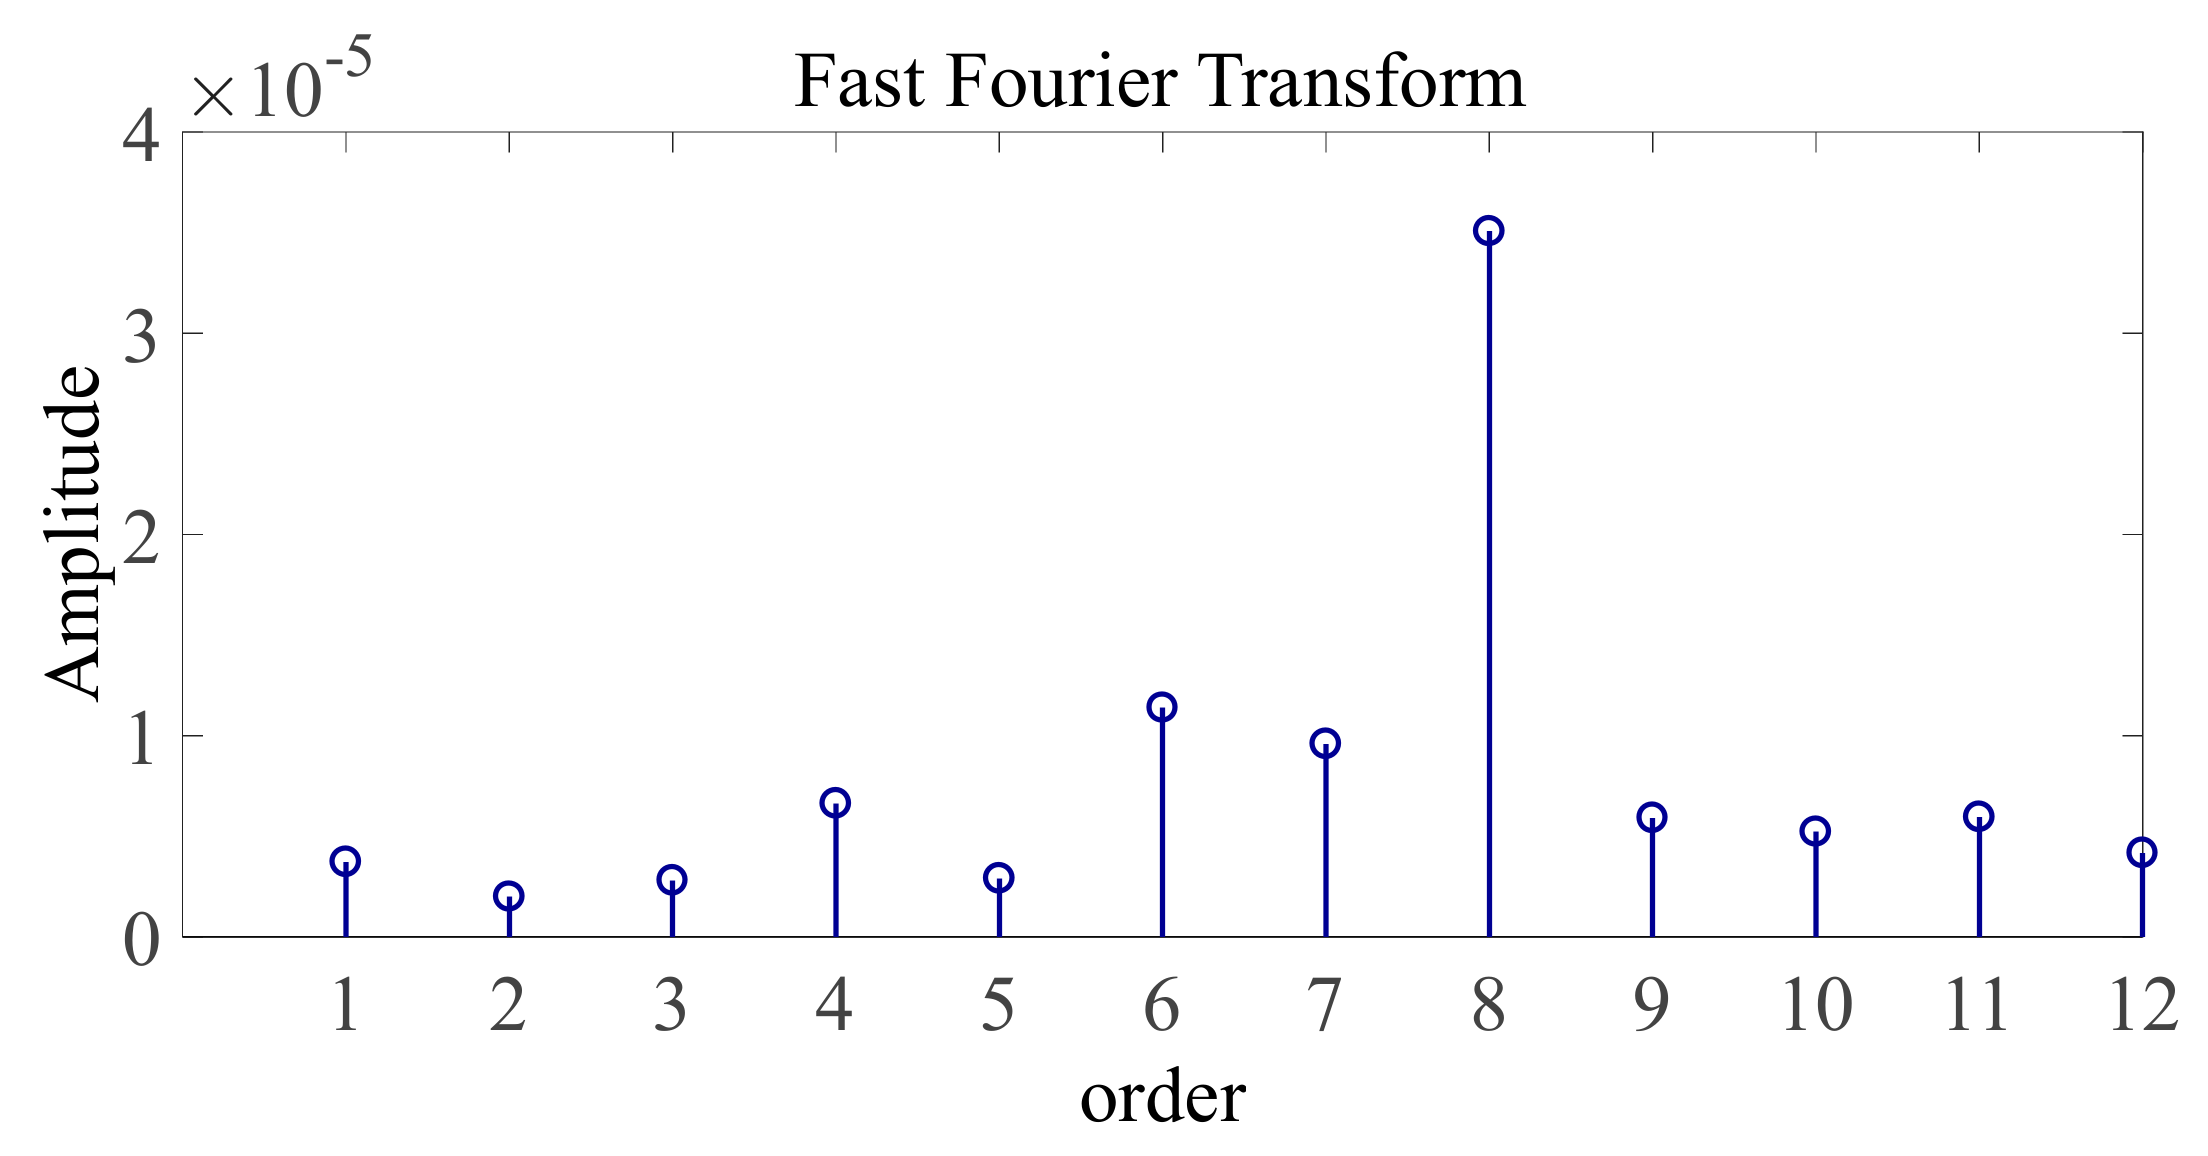
Figure 6.
Multi-scale entropy (MSE) distribution of vibration signal at Z axis at 3000 rpm.
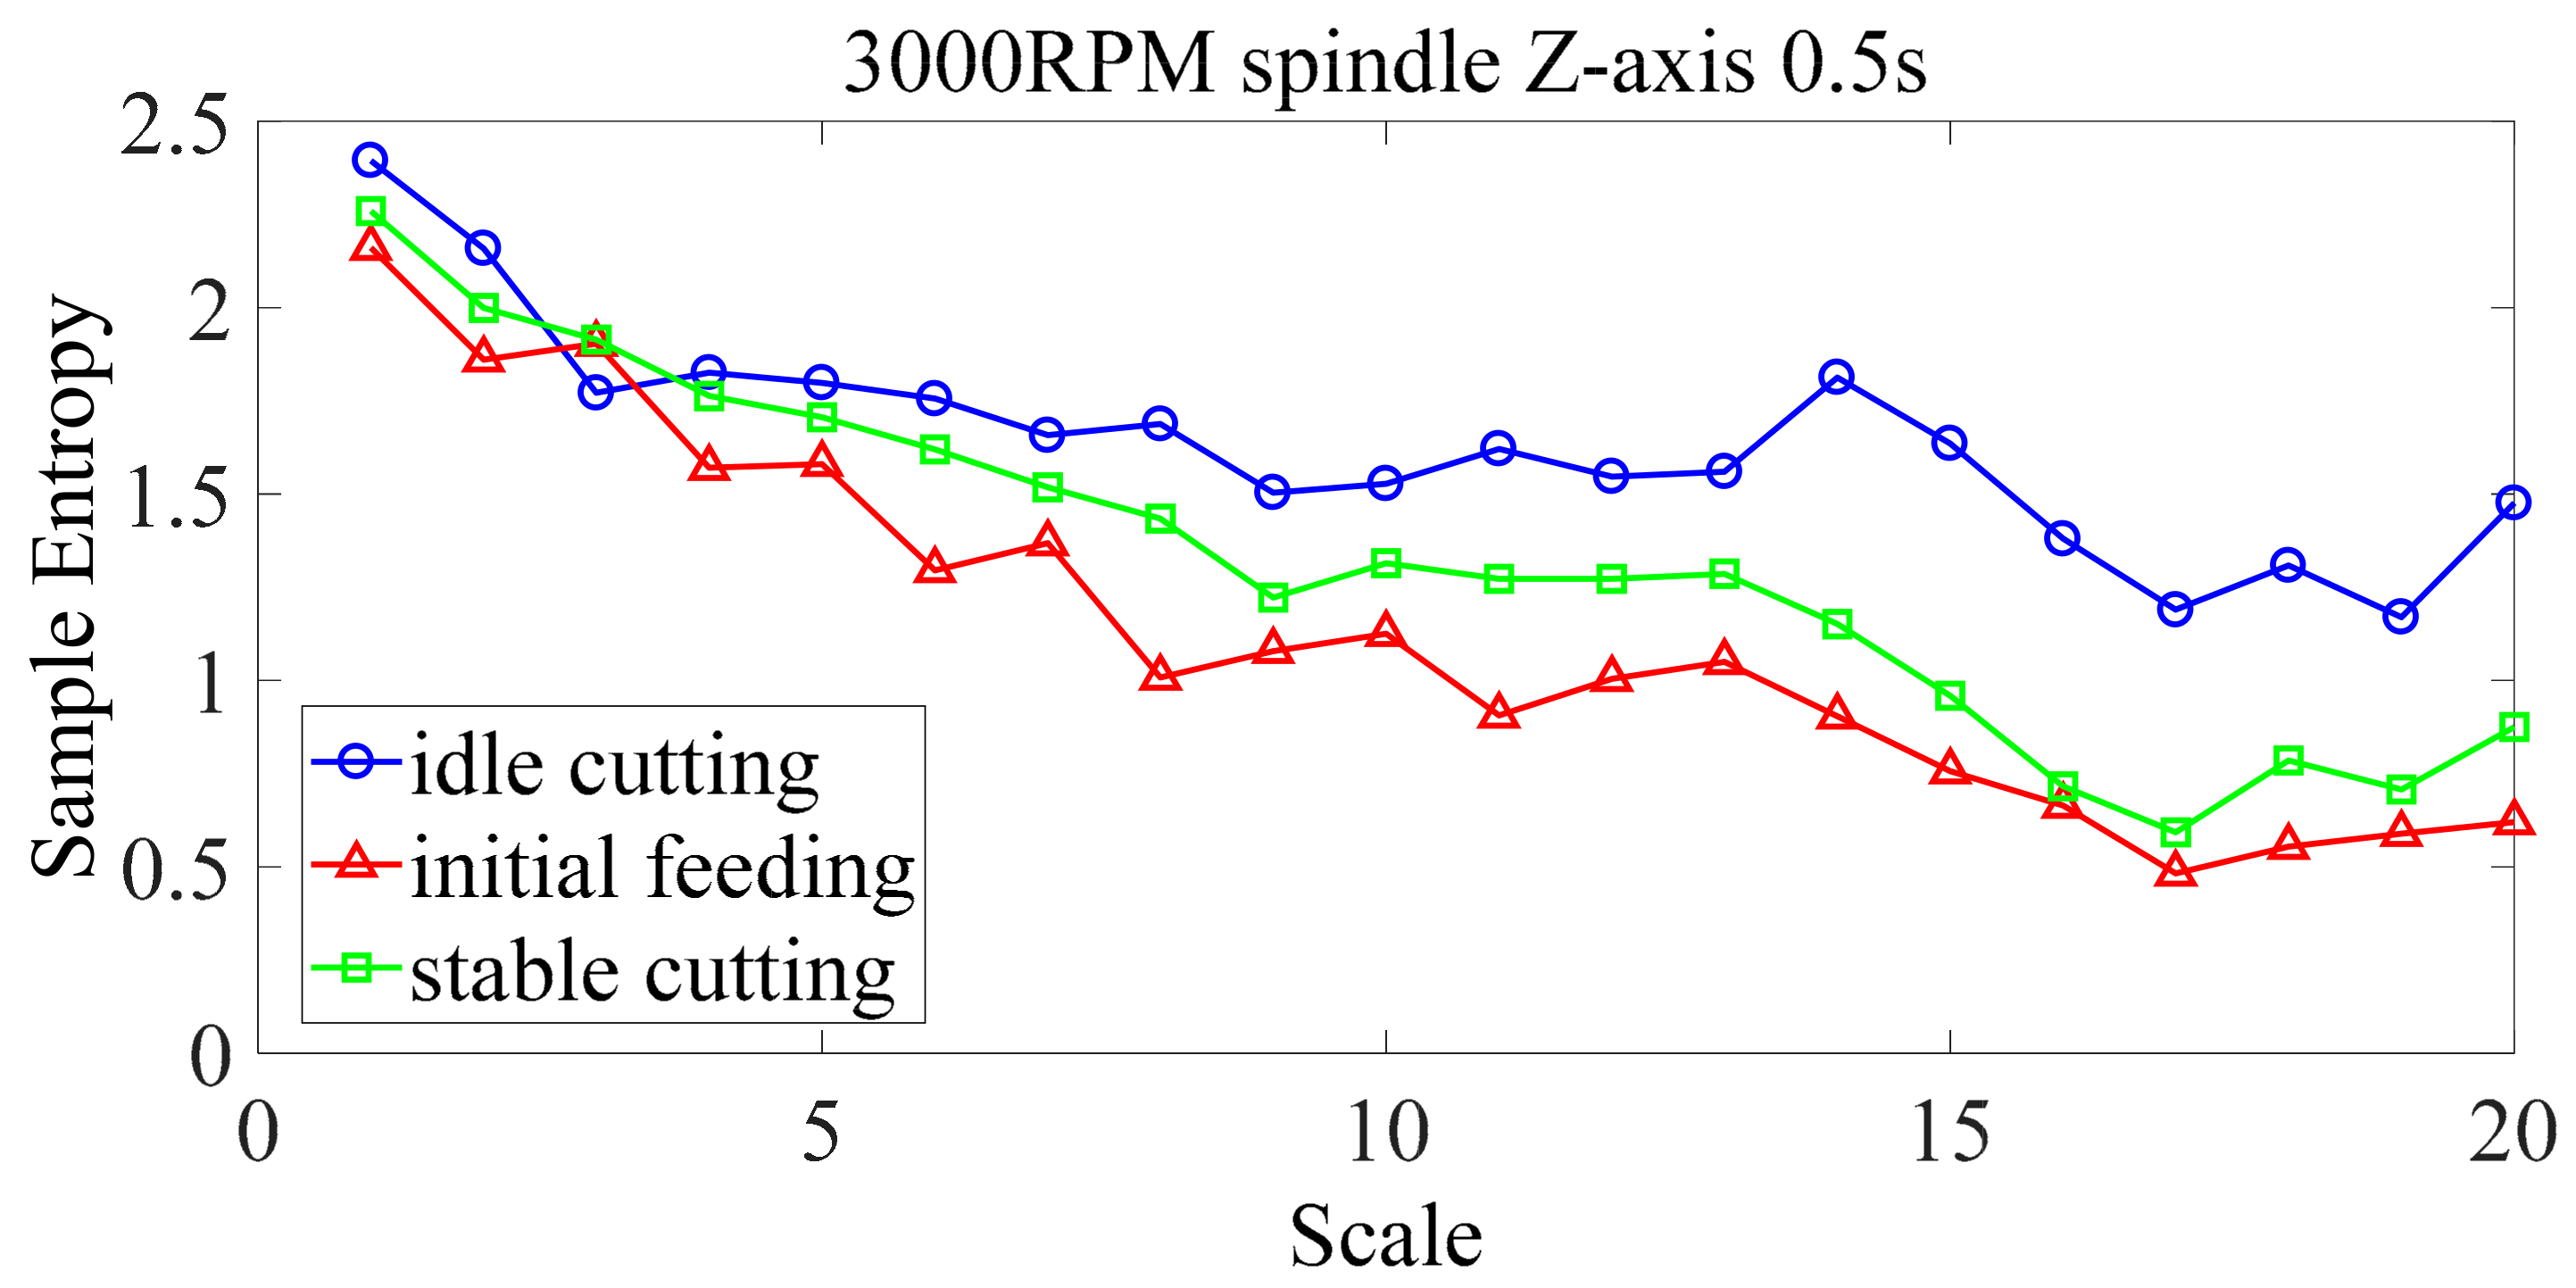
Figure 7.
MSE distribution of vibration signal at Z axis at 1000 rpm.
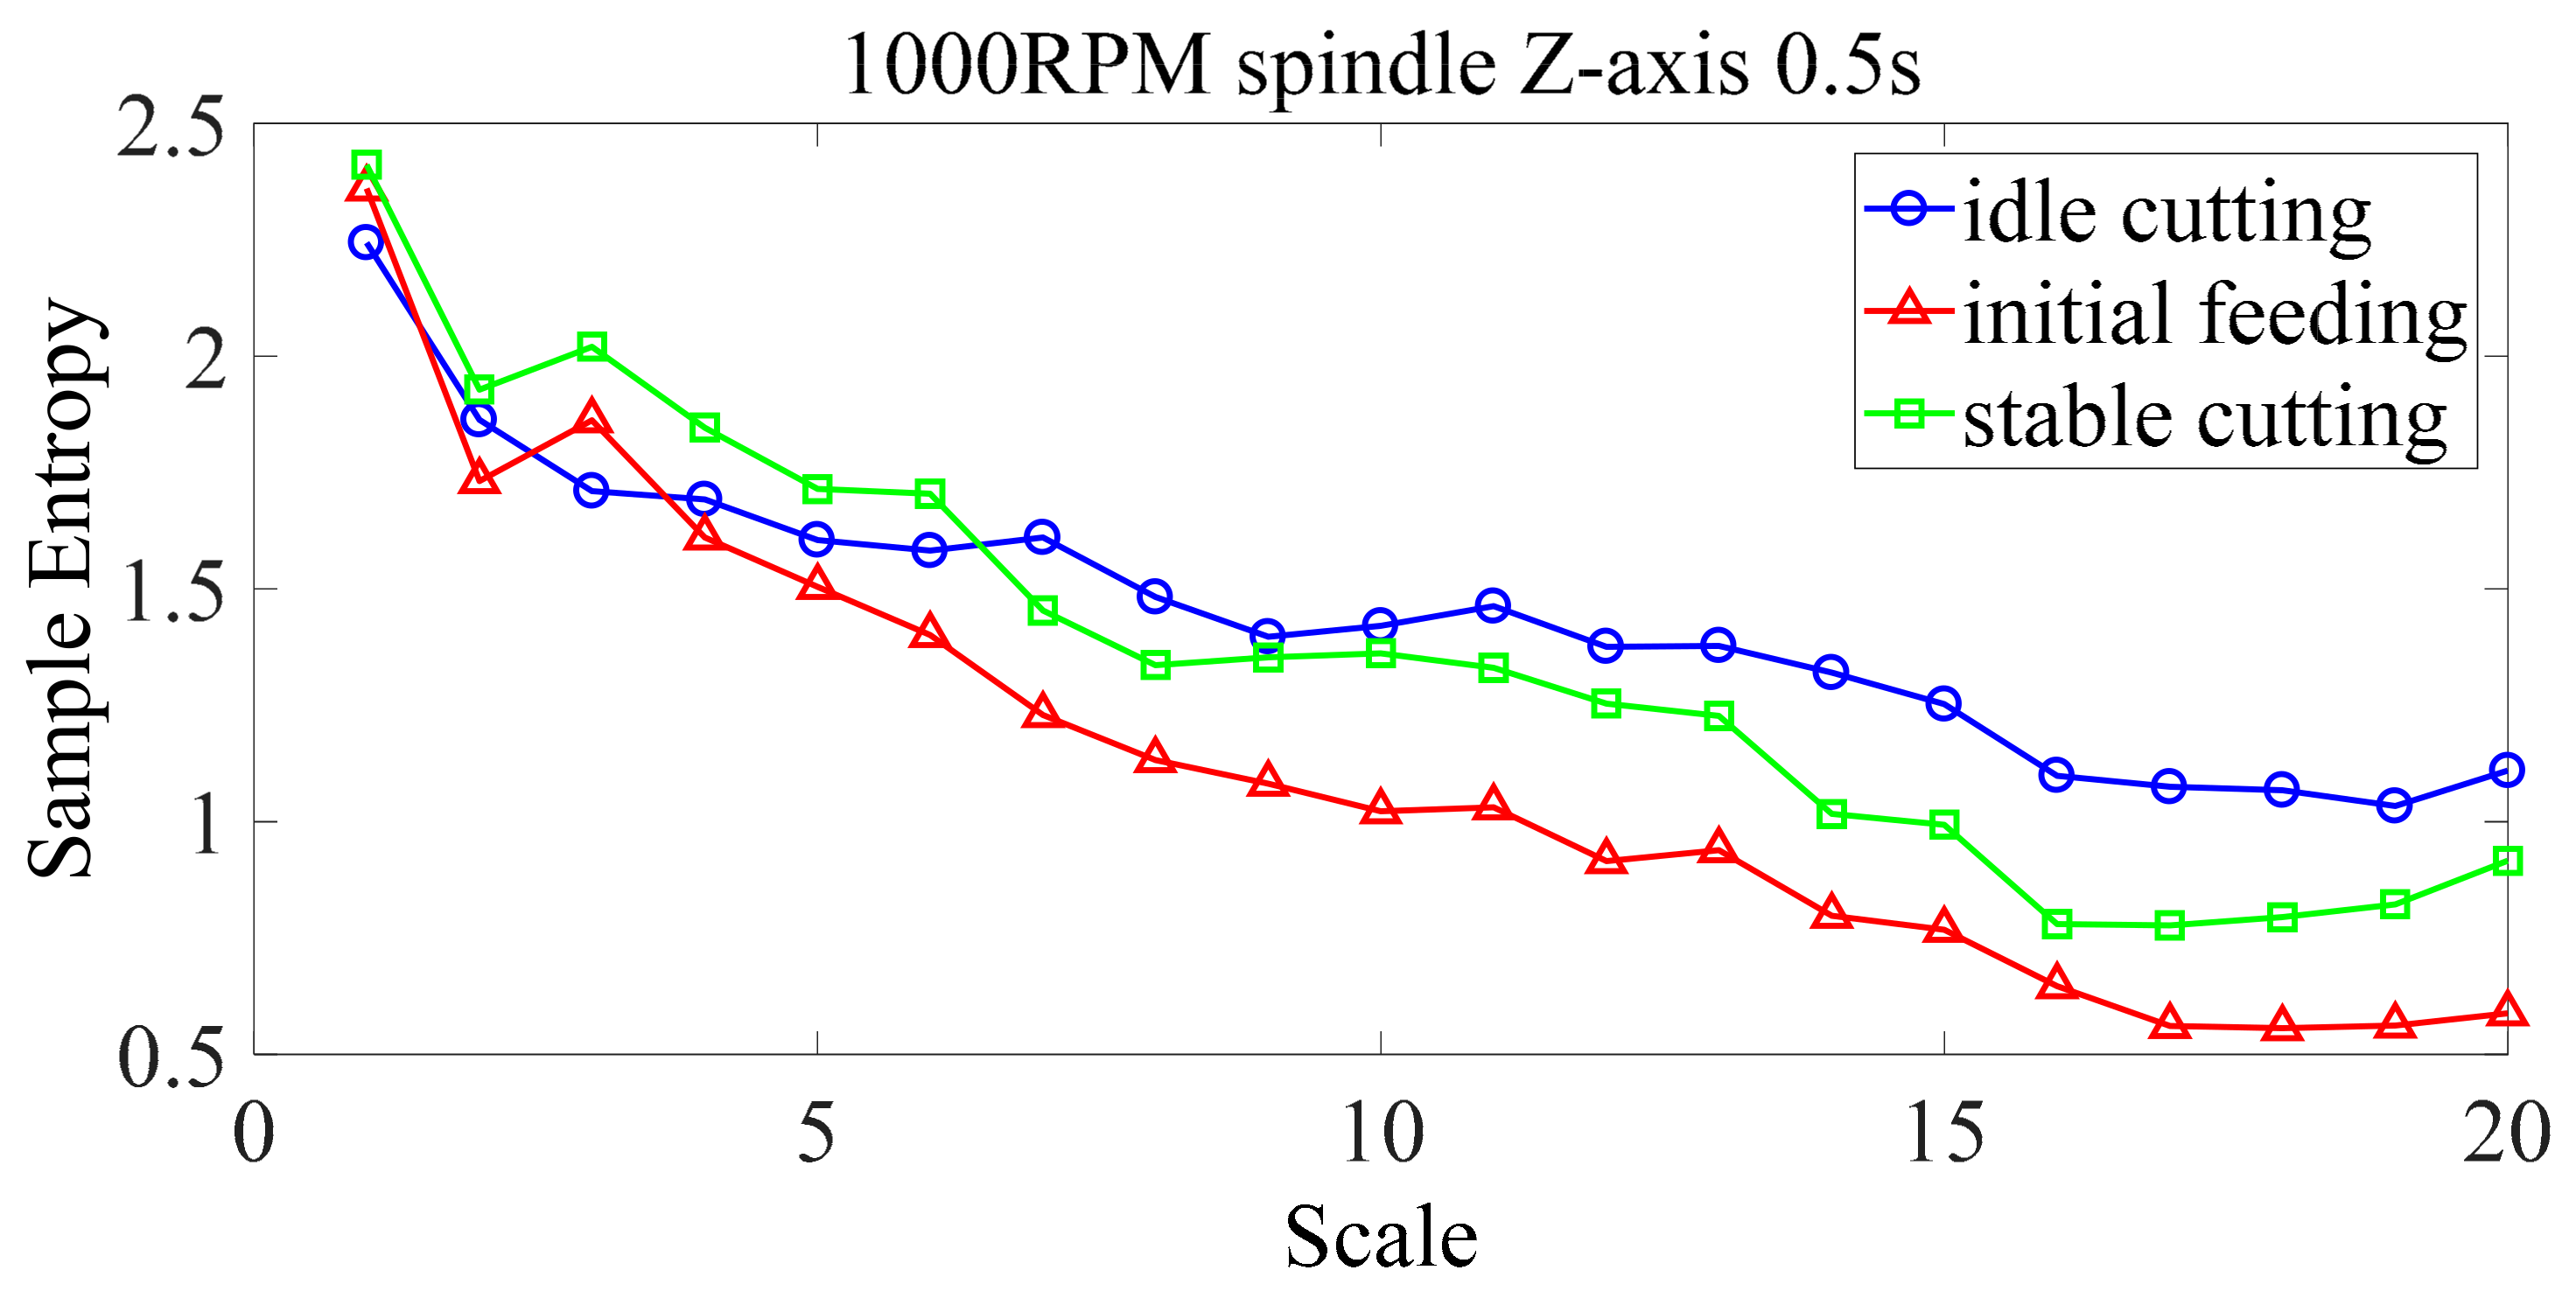
Figure 8.
Order spectrum at Z axis at 3000 rpm; complete vibration.
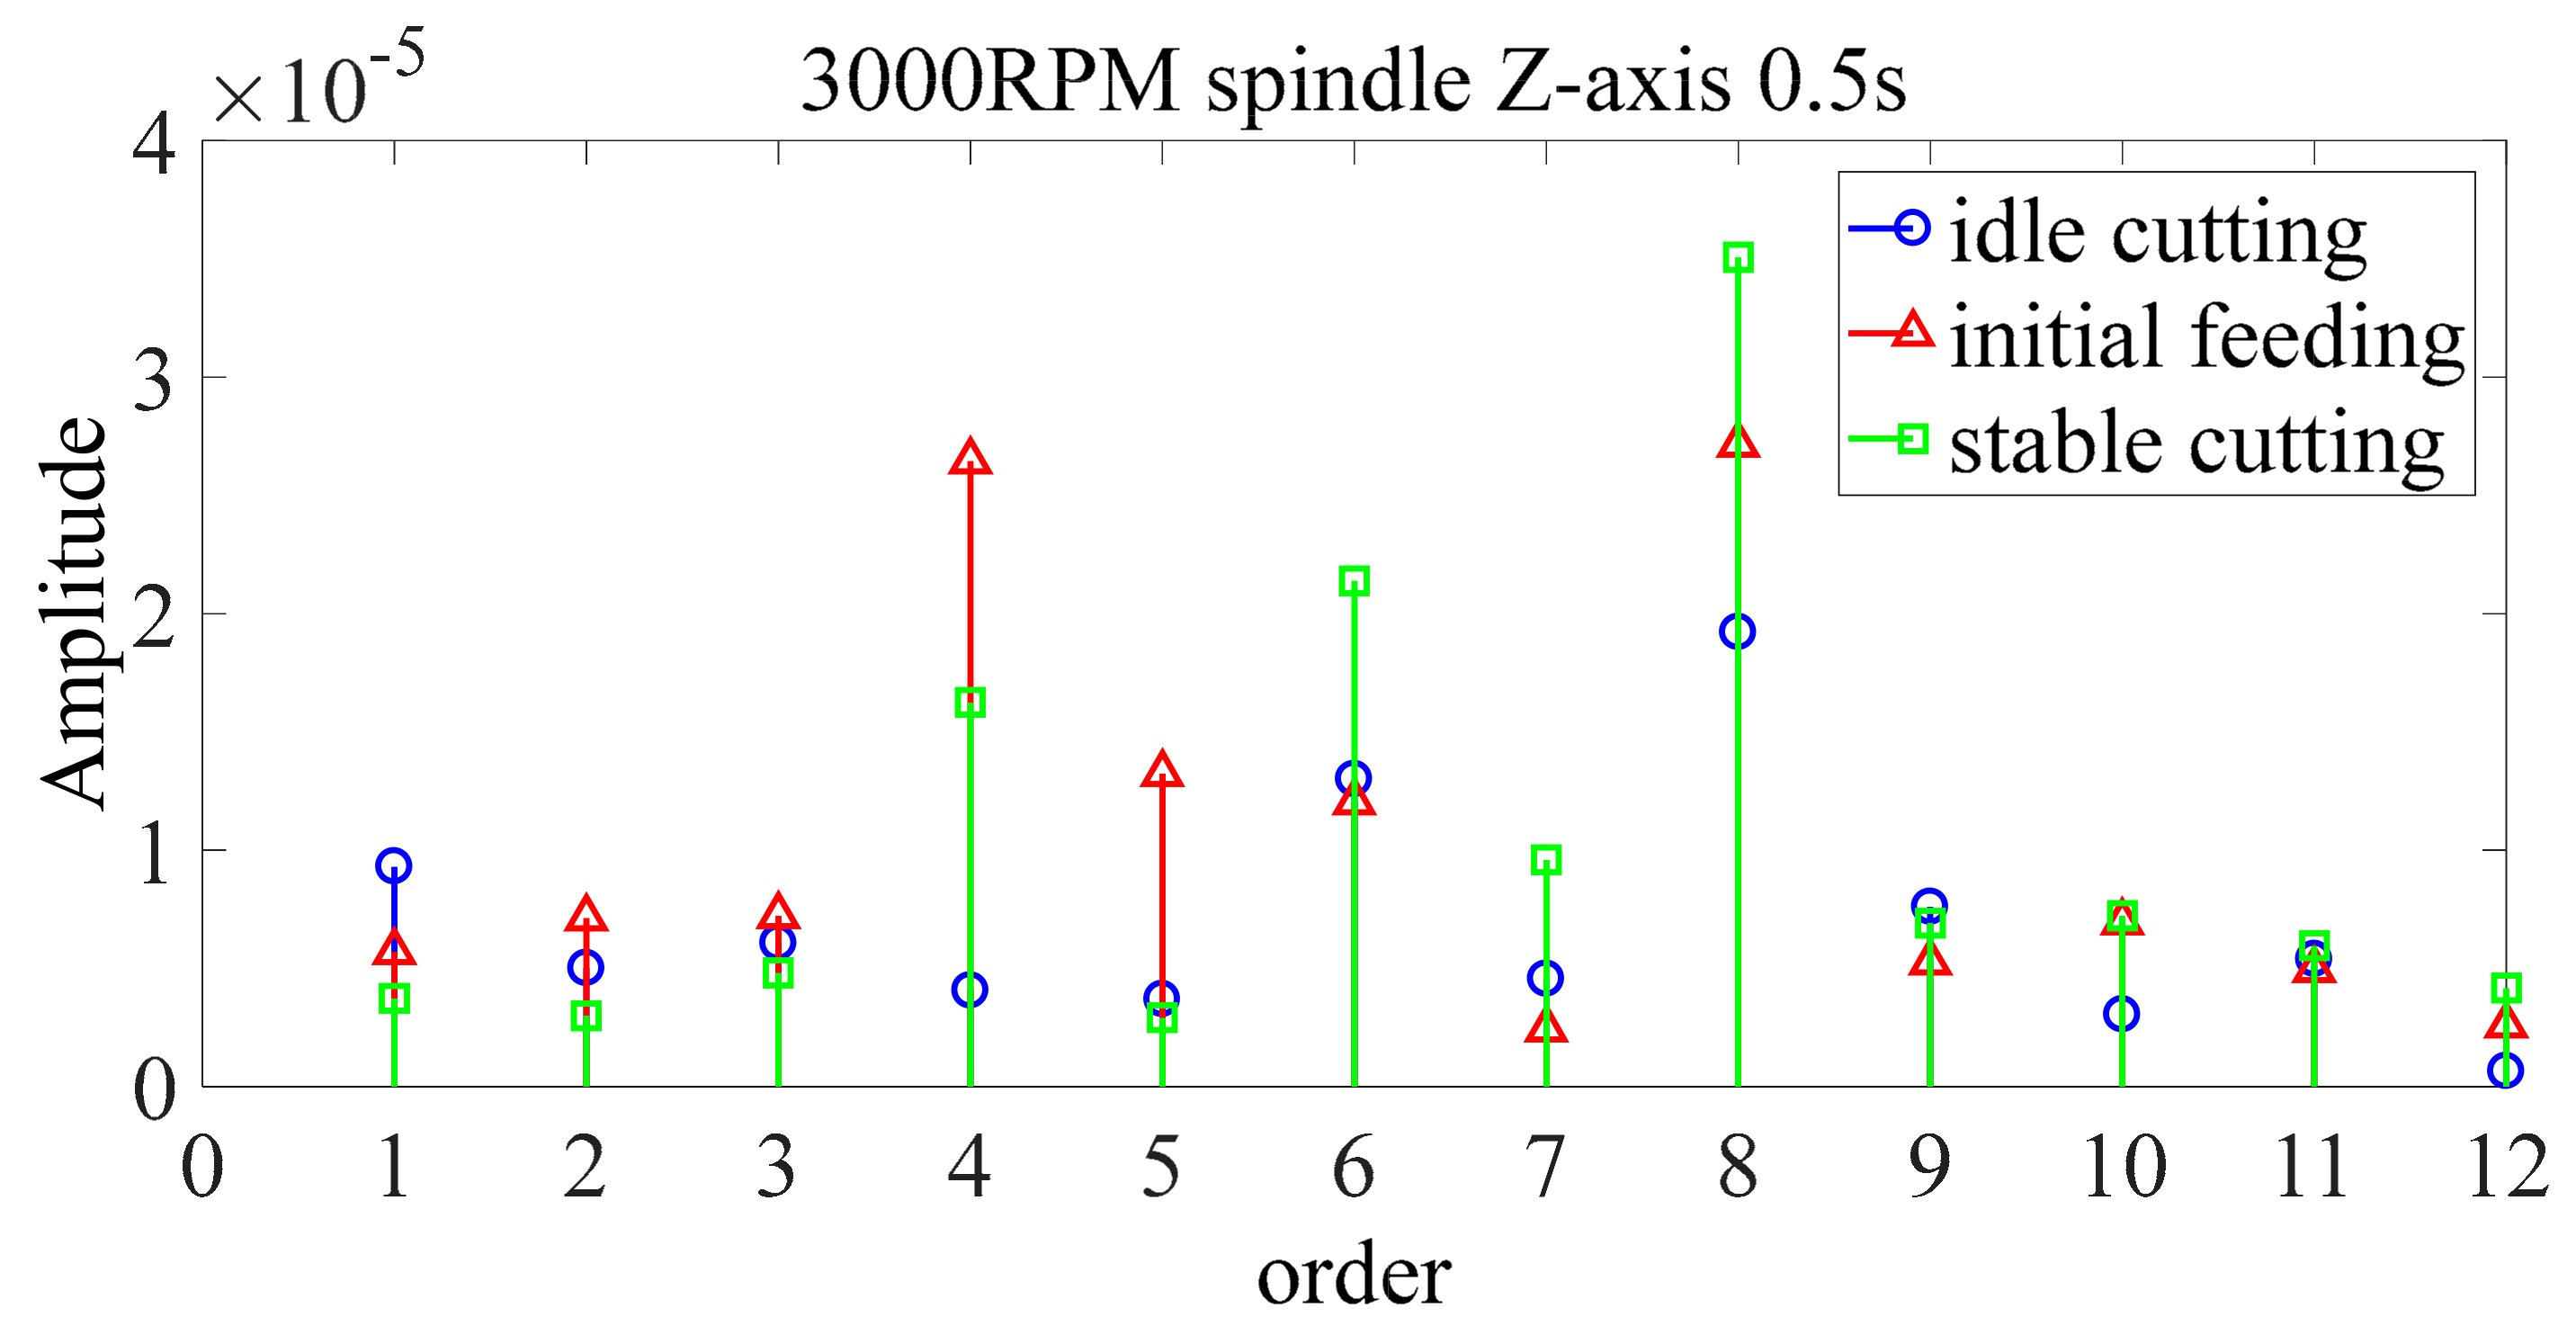
Figure 9.
Order spectrum at Z axis at 3000 rpm; removing features not related to rotation speed.

Figure 10.
Order spectrum at Z axis at 1800 rpm; complete vibration.
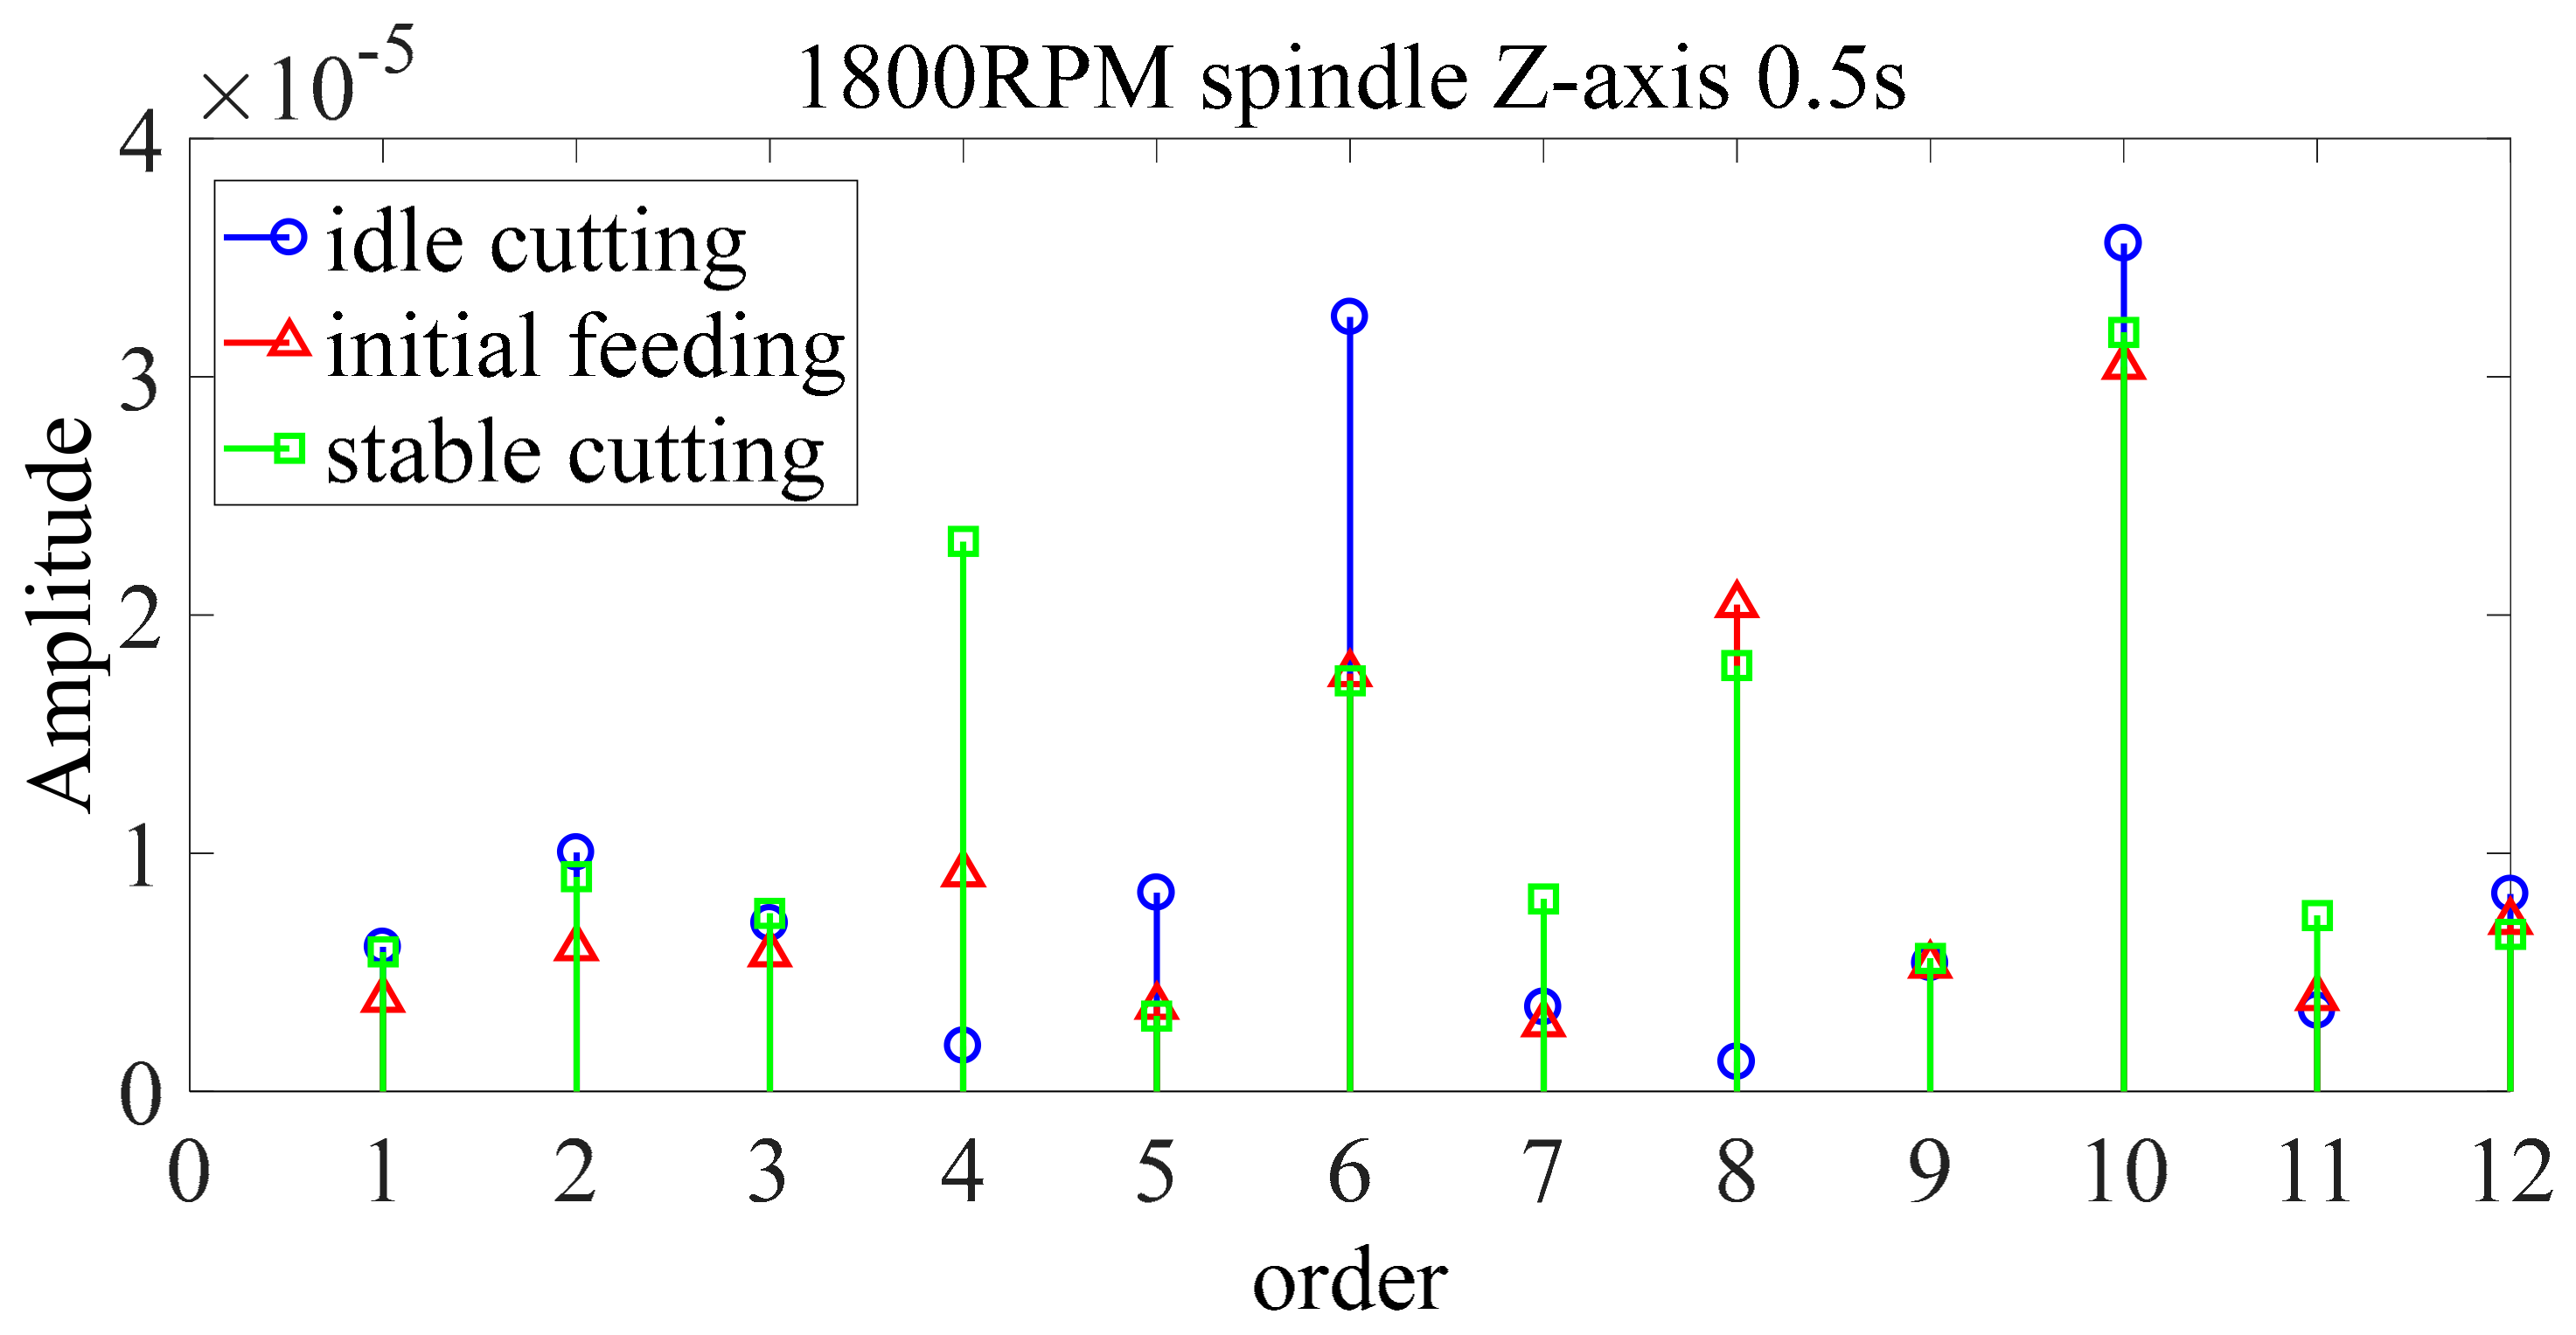
Figure 11.
Order spectrum at Z axis at 1800 rpm; removing features not related to rotation speed.

Table 1.
Fisher scores (FS) results (using frequency domain features as an example).
| Category | Idle Cutting and Initial Feeding | Idle Cutting and Stable Cutting | Initial Feeding and Stable Cutting | |
|---|---|---|---|---|
| Feature | ||||
| 1× speed frequency | 0.9175 | 0.5875 | 1.1004 | |
| 2× speed frequency | 0.0336 | 1.9790 | 0.2264 | |
| 3× speed frequency | 0.0432 | 0.1954 | 0.2365 | |
| 4× speed frequency | 2.5395 | 2.5379 | 2.0486 | |
| 5× speed frequency | 0.6767 | 0.1845 | 0.1019 | |
| 6× speed frequency | 0.0674 | 0.6964 | 5.7447 | |
| 7× speed frequency | 0.3298 | 0.7133 | 0.0005 | |
| 8× speed frequency | 2.0440 | 3.1098 | 1.483 | |
Table 2.
Identification result using all features, including features not related to rotation speed.
Table 2.
Identification result using all features, including features not related to rotation speed.
| Signal Feature | X Axis | Y Axis | Z Axis | 3 Axes Combination | |
|---|---|---|---|---|---|
| Milling Status | |||||
| Idling cutting | 60.34% | 60.21% | 67.14% | 38.24% | |
| Initial feeding | 44.56% | 41.32% | 40.54% | 33.68% | |
| Stable cutting | 59.32% | 65.28% | 67.42% | 40.38% | |
| Average accuracy | 58.07% | 62.64% | 64.95% | 39.58% | |
Table 3.
Identification result using FS screening features and removing features not related to rotation speed.
Table 3.
Identification result using FS screening features and removing features not related to rotation speed.
| Signal Feature | X Axis | Y Axis | Z Axis | 3 Axes Combination | |
|---|---|---|---|---|---|
| Milling Status | |||||
| Idling cutting | 94.75% | 94.89% | 96.63% | 93.73% | |
| Initial feeding | 90.33% | 92.65% | 94.91% | 91.15% | |
| Stable cutting | 97.38% | 96.94% | 98.75% | 96.68% | |
| Average accuracy | 96.50% | 96.36% | 98.21% | 95.91% | |
© 2018 by the authors. Licensee MDPI, Basel, Switzerland. This article is an open access article distributed under the terms and conditions of the Creative Commons Attribution (CC BY) license (http://creativecommons.org/licenses/by/4.0/).
Share and Cite
MDPI and ACS Style
Chang, C.-Y.; Wu, T.-Y. Identification of Milling Status Using Vibration Feature Extraction Techniques and Support Vector Machine Classifier. Inventions 2018, 3, 25. https://doi.org/10.3390/inventions3020025
AMA Style
Chang C-Y, Wu T-Y. Identification of Milling Status Using Vibration Feature Extraction Techniques and Support Vector Machine Classifier. Inventions. 2018; 3(2):25. https://doi.org/10.3390/inventions3020025
Chicago/Turabian StyleChang, Che-Yuan, and Tian-Yau Wu. 2018. "Identification of Milling Status Using Vibration Feature Extraction Techniques and Support Vector Machine Classifier" Inventions 3, no. 2: 25. https://doi.org/10.3390/inventions3020025