Development of New Hybrid Acrylic/Epoxy DLP-3D Printable Materials
by
 , , and
Simone Lantean
1, 
Ignazio Roppolo
1,2,
Marco Sangermano
1 ,
,
Candido Fabrizio Pirri
1,2 and
Annalisa Chiappone
1,2,* 1
Department of Applied Science and Technology, Politecnico di Torino, Corso Duca degli Abruzzi 24, 10129 Torino, Italy
2
Center for Sustainable Future Technologies, Istituto Italiano di Tecnologia, Corso Trento 21, 10129 Torino, Italy
*
Author to whom correspondence should be addressed.
Inventions 2018, 3(2), 29; https://doi.org/10.3390/inventions3020029
Submission received: 7 May 2018
/
Revised: 7 May 2018
/
Accepted: 15 May 2018
/
Published: 17 May 2018
(This article belongs to the Special Issue Innovations in 3-D Printing)
Abstract
:Light induced three dimensional (3D) printing techniques generally use printable formulations that are based on acrylic monomers because of their fast reactivity, which is balanced with their good final properties. However, the possibility to enlarge the palette of 3D printable materials is a challenging target. In this work, hybrid printable formulations that are based on acrylic and epoxy resins are presented and their printability on DLP (Digital Light Processing) machines is demonstrated. Hexanediol diacrylate (HDDA) and an epoxy resin—3,4-Epoxycylohexylmethyl-3′,4′-epoxycyxlohexane carboxylate (CE)—in different ratios are used and the influence of a bridging agent, Glycidyl methacrylate (GMA), is also investigated. The reactivity of the different active species during irradiation is evaluated and the mechanical properties, including the impact toughness, the thermo-mechanical properties, and the volumetric shrinkage, are studied on printed samples.
1. Introduction
Three dimensional (3D) printing, which is also known as additive manufacturing, is a fabrication process that enables the layer-by-layer construction of 3D objects from computer-aided design (CAD) data [1]. The basic difference between additive manufacturing (AM) and traditional manufacturing techniques, which are subtractive techniques, is that the final product is obtained by the union of multiple subunits instead of by removing material. This concept difference brings about a lower consumption of raw materials and the chance to produce artifacts with a complex shape [2].
Nowadays, AM is becoming more and more popular and developed thanks to its advantages: generally, these processes are time saving, involve reduced costs and human interaction as well as allowing being engender to almost any shape [3]. Even if, in recent years, it has been possible to also process metallic and ceramic materials, polymers and composite polymeric materials are still the most processed [4].
Three dimensional (3D) printing is gaining more and more interest in different industrial fields (aerospace and automotive [5], biomedical [6,7,8], electronics [9,10,11], etc.), not only as a rapid prototyping technique, but also as a proper production technique. The most important effort that is necessary to develop 3D printing, in terms of the industrial manufacturing technique, is to extend the available polymers, and in particular, to give the chance to process high performance materials [12,13,14].
On the market it is possible to find several kinds of 3D printing machines that differ from each other regarding the working principle behind the printing process and for the materials that are used. Among the different printers, the digital light processing (DLP) apparatus are very promising. DLP printers can be considered as a modification of the stereolithography (SL) ones, because they are both based on the vat polymerization and exploit the photopolymerization processes [15]. In the DLP machines, the growing platform is suspended over the resin vat and the light source is not a laser beam, as in SL, however a digital light projector is located under the vat. This implies some requirements for the resin, which has to be transparent enough to assure the light penetration avoiding, at the same time, an excessive light diffusion that could lead to a loss of resolution. Such a system allows an entire layer curing control, in fact, it projects on the resin a two-dimensional pixel pattern, which controls the entire layer and solidifies it at once. In this way the production time is largely reduced with respect to the SL process, where the use of the laser requires a point-by-point scanning [15].
Generally, what is meant by the term photopolymerization, is a polymerization process that is initiated by the absorption of a light radiation. Through the interaction between the light and some elements in the formulation, active species (radicals or cations) are generated and new chemical bonds are formed [16].
One of the fundamental elements of the photopolymerization processes are the phoinitiators, which are molecules that absorb the light radiation (typically between 250–450 nm) generating reactive species, such as free radicals or cations, that start the polymerization reaction [16]. According to the reactive species that are generated, it is possible to differentiate between radical and cationic polymerization. Using radical polymerization, (meth)acrylates polymers are commonly processed. These monomers have high polymerization rates. Radical photoinitiators that are active in the visible-light region are available, making them suitable for DLP technology. Methacrylates and acrylates, however, suffer from oxygen inhibition, high volumetric shrinkage, and fragility. Cationic polymerization shows many advantages compared with the radical one, namely, the absence of oxygen inhibition, very low shrinkage, and good mechanical and thermal properties of the final artifacts. Furthermore, cationic polymerization also shows some drawbacks. First of all, cationic photoinitiators are usually only able to absorb in the Ultraviolet(UV)-region. Moreover, the polymerization reactions are slower and the conversions are lower as well. Typically, using cationic polymerization epoxies, the vinyl ethers and propenyl ethers are processed [17].
The possibility of enlarging the range of the DLP 3D printable materials, going beyond the common acrylic-based formulations, could open the way for a broader range of applications. In this work, hybrid formulations that are based on acrylic and epoxy monomers, are investigated. The aim of working with hybrid formulations, is to overcome the main drawbacks of the radical and cationic polymerization. The most studied hybrid formulations are based on an acrylic-epoxy system and a methacrylic-epoxy system [18,19,20]. Nowadays, such hybrid systems have a strong commercial interest and they have already been proposed on the market for stereolithography (e.g., SL 5170 resin, which was commercialized by CIBA in the 90’s). They are commonly meant to be used for prototyping, while being able to assure models with lower internal stresses and characteristics that are more similar to those of the objects that are being studied, and will be produced in a larger scale. Nevertheless, their possible application could be extended to all of the objects that require combinations of complex shapes with an impact tolerance and/or thermal resistance.
Common DLP processes implies a visible light-induced polymerization that can be followed by a UV, post process. This requires particular attention in the study of the polymerization process of the hybrid formulations. In general, the hybrid systems are, of course, more complex than the normal systems because of the presence of the two different photoinitiating systems (one radical and one cationic), nevertheless, by carefully balancing the components of the reactive mixture, it is also possible to modify the kinetics of the polymerization reactions and have a tailor-made approach to the physical and mechanical properties of the final polymer.
In this work, the modifications in glass transition temperature, Young’s module, and impact toughness were studied as well as the influence of a bridging agent. A bridging agent, or hybrid monomer, is a monomer that contains both the functionalities that are present in the system (acrylic and epoxy), because of its capability for bonding with both monomers, it promotes the formation of a hybrid polymer network which achieves better final properties [21].
2. Materials and Methods
2.1. Materials
Two bifunctional monomers were used, namely, a Hexanedioldiacrylate (HDDA) and 3,4-epoxycyclohexylmethyl-3′,4′-epoxycyclohexyl carboxylate (CE), both of which were purchased from Aldrich, St. Louis, MO, USA. Glycidyl methacrylate (GMA) was also purchased from Aldrich. Irgacure 819 by BASF was used as a radical photoinitiator (PIr), while the cationic photoinitiator (PIc) was Irgacure 250 (BASF, Ludwigshafen, Germany). Reactive-Orange 16 (Aldrich) was also added.
2.2. Samples Preparation
Six formulations were prepared (Table 1), which increased the amount of CE in HDDA from 0 to 60 CE % mol (Table 1). In all of the formulations, photoinitiators (PIs) were added at 2% wt and were each compared to the corresponding monomer, while the red dye was added at 0.2% wt. In order to improve the dispersion of the PIs, they were first dissolved in few drops of acetone and then added to the formulation. Before being processed or tested, each formulation was sonicated for 15 min. The role of GMA as a bridging agent was investigated in the 75HDDA25CE formulations, where GMA was added at 5 and 10% mol.
Solid samples for each formulation were produced via the Digital Light Projector (DLP) 3D-printing technique. According to the characterization technique, samples of different shapes and dimensions were printed. The “3DLPrinter-HD 2.0” by Robot Factory (Robot Factory, Mirano, Italy) was used. The DLP printer had a projector that emitted between 400 nm and 780 nm of the electromagnetic spectrum, and the intensity of the radiation was about 12 mW/cm2. The resolution on the x and y plane was 50 µm, and the layer thickness could be varied from 100 µm to 10 µm. In the present case, the layer thickness was settled to 30 µm and the irradiation time was varied from 1.3 to 1.8 s per layer (Table 1).
Once the objects were obtained, a post curing was made under the UV static-light oven, which was equipped with high-pressure Hg lamps (Helios Italquartz, Milan, Italy), for 5 min with an intensity of 100 mW/cm2.
2.3. Characterization Methods
The Fourier Transform InfraRed (FT-IR) spectroscopy had been performed using a Bruker Tensor 27. The samples were coated on a silicon wafer. The samples were irradiate for 15 and 30 s under visible light using a fiber (Hamamatsu LC8, Hamamatsu Optics, Hamamatsu, Japan, equipped with a filter below 400 nm) that was emitted in the visible region, with an intensity of 10 mW/cm2. The samples’ irradiation was performed under inert gas flux (N2). A first spectrum was collected before irradiation. Another two analyses were made after 15 s and 30 s of irradiation. In order to investigate the conversion ratio of the acrylic groups, the decrease of absorbance in the acrylic groups region, during the time that it was studied, monitored the profile of the double bond peak between 1595–1631 cm−1, using the carbonyl peak between 1693–1762 cm−1 as a reference.
Subsequently, real time FT-IR was performed on the same samples that were previously exposed to visible light, so as to investigate the reaction kinetic of the epoxy groups under UV irradiation during the post curing process. The samples were irradiated using an UV fiber for 300 s, with an intensity of 100 mW/cm2. The conversion versus irradiation time profiles were obtained. The epoxy groups’ conversion was monitored by analyzing the absorbance peak decrease in the epoxy groups in the 739–760 cm−1 region.
Differential scanning calorimetry (DSC) was used to investigate the glass transition temperature and, eventually, the post-polymerization and degradation of the samples. The analyses were performed with Netzsch DSC 204 F1 (Netzsch GmbH, Selb, Germany). Two different samples for each formulation were studied. One without UV post-curing and the other one was after the UV post-curing, which aimed to compare the data and understand if the UV-curing had been effective. The DSC samples were obtained from printed specimens.
Dynamic mechanical thermal analysis (DMTA) was performed with a frequency of 1 Hz and a ramp rate of 3 °C/min (from 25 to 200 °C). The DMTA specimens were 3D printed, as discussed above.
Izod impact tests and stress strain tests were performed, and the plastic-elastic fracture toughness (JIC) and elastic module (E) were obtained for each formulation. The Izod test was performed with a 2 joule hammer. The samples had a parallelepiped shape, and their dimensions were 5 × 10 × 120 mm. The impact velocity was about 5–7 m/s. Six samples per formulation were tested.
Field Emission Scanning Electron Microscopy (FESEM) was performed in order to investigate the fractured surfaces of the Izod tested specimens (FESEM Supra 40 manufactured by Zeiss, Oberkochen, Germany). The samples were not sputter-coated with metal, in order to avoid artifacts.
Stress-strain analyses were also performed on the printed samples, the load rate that was applied was 1 N/min (load control), the maximum load was 10 N, and the data sampling was 0.1 s. All of the measurements were conducted at room temperature (25 °C). Three samples for each formulation were investigated.
Shrinkage measurements were obtained by measuring the volume of the parallelepipeds that were produced by the 3D-printing. The design project that was used consisted of nine different parallelepipeds, with dimensions of 15 × 10 × 3 mm. The volume of the produced samples was calculated after the post curing and was compared with the nominal volume (from CAD project), in order to determine the volumetric shrinkage.
3. Results and Discussion
Six hybrid formulations were prepared, by varying the amount of epoxy monomer, 3,4-epoxycyclohexylmethyl-3′,4′-epoxycyclohexyl carboxylate (CE), in the acrylic one (HDDA) from 0 to 60% mol (from 100HDDA to 40HDDA_60CE (see the Materials and Methods section). In all of the formulations, a radical photoinitiator (PIr) absorbing in the visible range was used and, when the epoxy monomer was added, a cationic photonitiator (PIc), which was active in the UV range, was also added. In all of the formulations, a dye was also used in order to limit the light diffusion during printing, which aimed to obtain a good resolution of the final 3D object. The role of glycidyl methacrylate (GMA), which presented both an acrylic and an epoxy group, was also investigated in the 75HDDA25CE formulations, where GMA was added at 5 and 10% mol.
The reactivity of the studied formulations were investigated by infrared spectroscopy (FT-IR). In aiming to mimic the printing process, the films (40 µm) were coated on a silicon substrate and firstly irradiated with a visible light (broad range between 400 and 780 nm) under an inert atmosphere. The FT-IR spectra were collected after different irradiation times and, for each HDDA-CE formulation, the conversion of the acrylic groups was followed by the decrease of the area of the peak, which was centered at 1620 cm−1. The conversion data are reported in Table 2 and in the Supplementary Materials (Figures S1–S5).
In all of the formulations, a fast polymerization kinetic was shown. In fact, after only 15 s of irradiation, the acrylic double bond conversion was of approximately 80%, and the conversions reached about 90% after 30 s of irradiation (Table 2). The pure acrylic formulation (100HDDA) showed a lower conversion degree when compared with the hybrid formulations. This phenomenon had already been reported in other investigations about the HDDA-CE systems [18], and it was commonly explained as a viscosity effect. In fact, it should be taken into account that most of the epoxy groups remained unreacted during the visible irradiation, so the presence of a liquid phase in the forming cross-linked network caused a delay of the gelation point, which led to higher conversions.
The bridging-agent GMA did not seem to have a strong influence over the acrylic polymerization kinetic. In fact, the conversion profiles of 75HDDA25CE, 75HDDA25CE + 5GMA, and 75HDDA25CE + 10GMA were comparable. Additionally, the increase of the epoxy resin amount in the system did not bring significant changes to the conversion profiles.
Considering the studied systems, it was expected that, under visible irradiation, the radical initiator that was used, which was absorbed in the visible range, would react and bring forth the formation of a network that was composed by HDDA chains. While the cationic photoinitiator, which had its characteristic absorption in the UV range, was expected to react during the UV post process (light emission centered at 365 nm), which would be brought to a subsequent formation of an epoxy-based network. Nevertheless, after a careful analysis of the obtained FT-IR spectra, it was seen that Radical Induced Cationic Polymerization (RICP) was present in some of the samples during the visible irradiation. The representative FT-IR spectra are reported in the Supplementary Materials, Figure S2). In all of the cases, the variation of the peak at 900 cm−1 was followed by the samples that contained a lower amount of CE, which showed a decrease of the peak, which meant that the epoxy groups had already start reacting during it, and that the RICP mechanism was then promoted. In fact, when a low amount of CE was considered, a higher quantity of the acrylic groups and radical initiator were used, which led to the formation of a larger number of radicals and to the production of more heating, because of the exothermicity of the curing reaction. For this reason, the opening of the present epoxy groups was facilitated, with respect to the other samples. The samples that contained higher amounts of CE, instead, didn’t show any variation of the peak (Table 2).
In order to fully study the polymerization process, real-time FT-IR analyses were then performed on the same cured films, while they were exposed to UV irradiation, since, in this case, the oxygen inhibition did not affect the cationic polymerization. By decreasing the amount of CE, the conversion of the unreacted epoxy groups decreased as well, probably because a large amount of epoxy groups remained trapped in the glassy network that was formed during the visible irradiation (see Table 2). The formulations that contained 50% mol of CE reached about 90% of the conversion after 5 min of irradiation, while those with 60% mol of CE reach almost 100% conversion, already, after 30 s of UV-irradiation. Nevertheless, it must be remembered that the unreacted epoxy groups could continue to react during the samples’ storage, even in the dark, because of the living nature of the cationic polymerization (see Supplementary Materials, Figures S6–S8).
Furthermore, the conversion of the residual acrylic double bond was evaluated and reported as a percentage of the initial amount (Table 2). The analysis showed that the post curing process also helped to reach an almost complete conversion of the acrylic groups. When increasing the CE amount in the formulations, both the acrylic and the epoxy groups’ conversions were higher, so the 50HDDA50CE and 40HDDA60CE formulations looked very promising. Additionally, thanks to real time FT-IR, the acrylic groups’ conversion was followed during the UV-curing, which observed that when increasing the CE amount in the formulations, the conversion of the acrylic groups was higher. This phenomenon was as a result of the higher mobility of the acrylic groups, which was ensured by the liquid CE monomers.
Once the reactivity of the formulations was investigated, 3D printing was carried out. The printing parameters were empirically settled with a layer thickness that was chosen to be 30 µm, while the irradiation time ranged from 1.3 to 1.8 s per layer, according to the formulation.
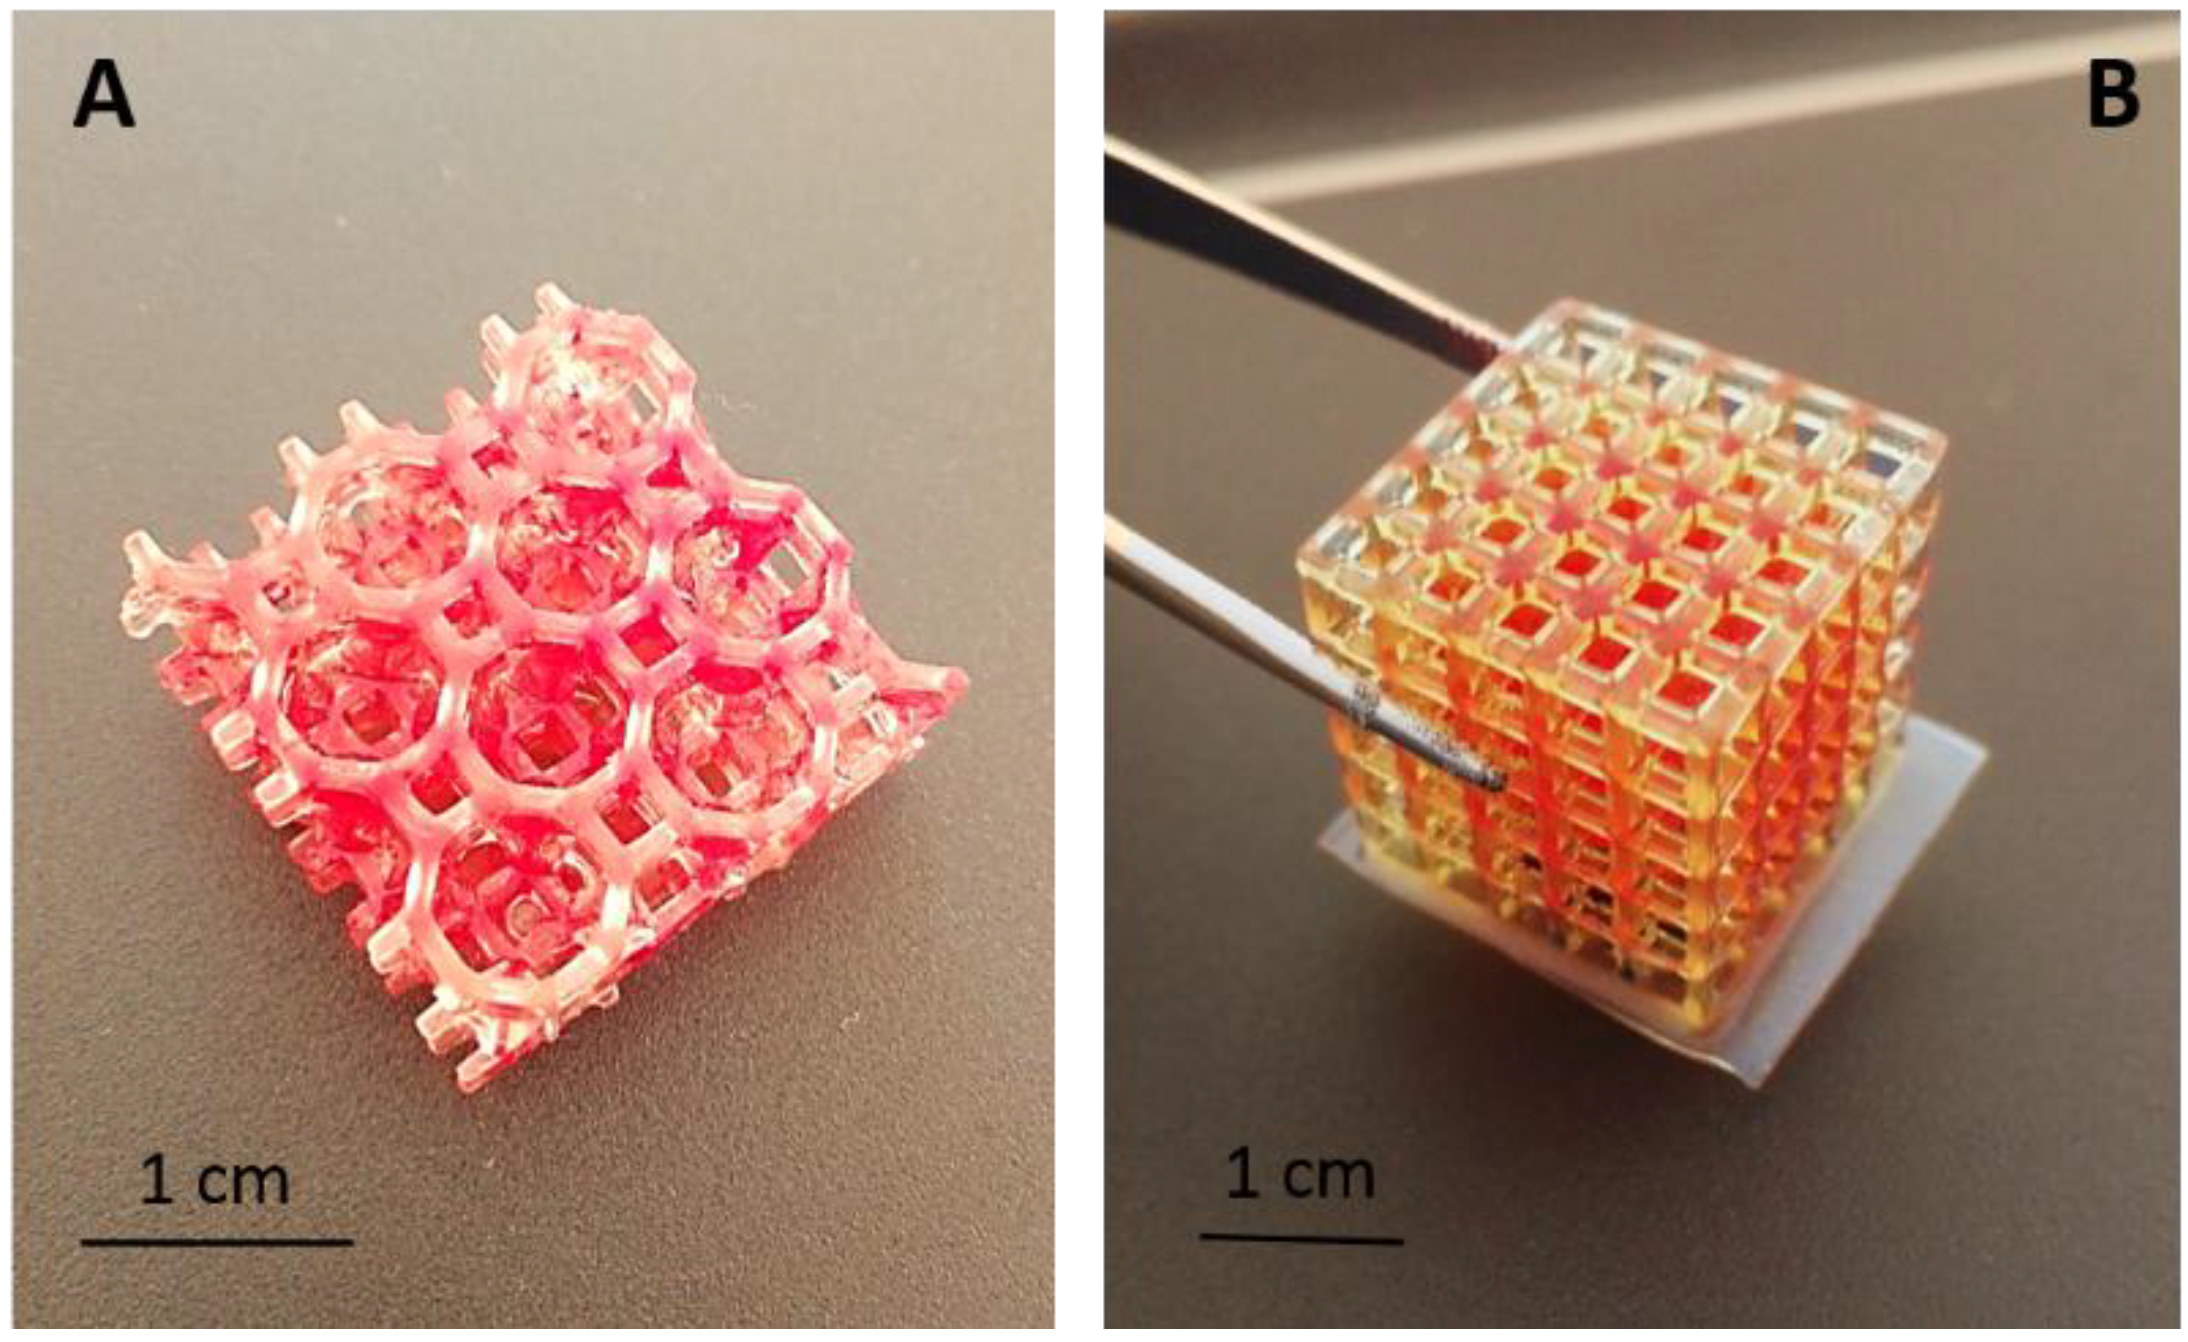
Different samples were produced from simple specimens for dynamic mechanical thermal analysis (DMTA) and Izod tests (impact test for the evaluation of a plastic-elastic fracture toughness module) to geometries that were more complex (Figure 1). The 3D printing gave the possibility of building complex shapes, and the printing tests showed that the DLP allowed them to obtain a very good resolution, as well as with such hybrid materials.
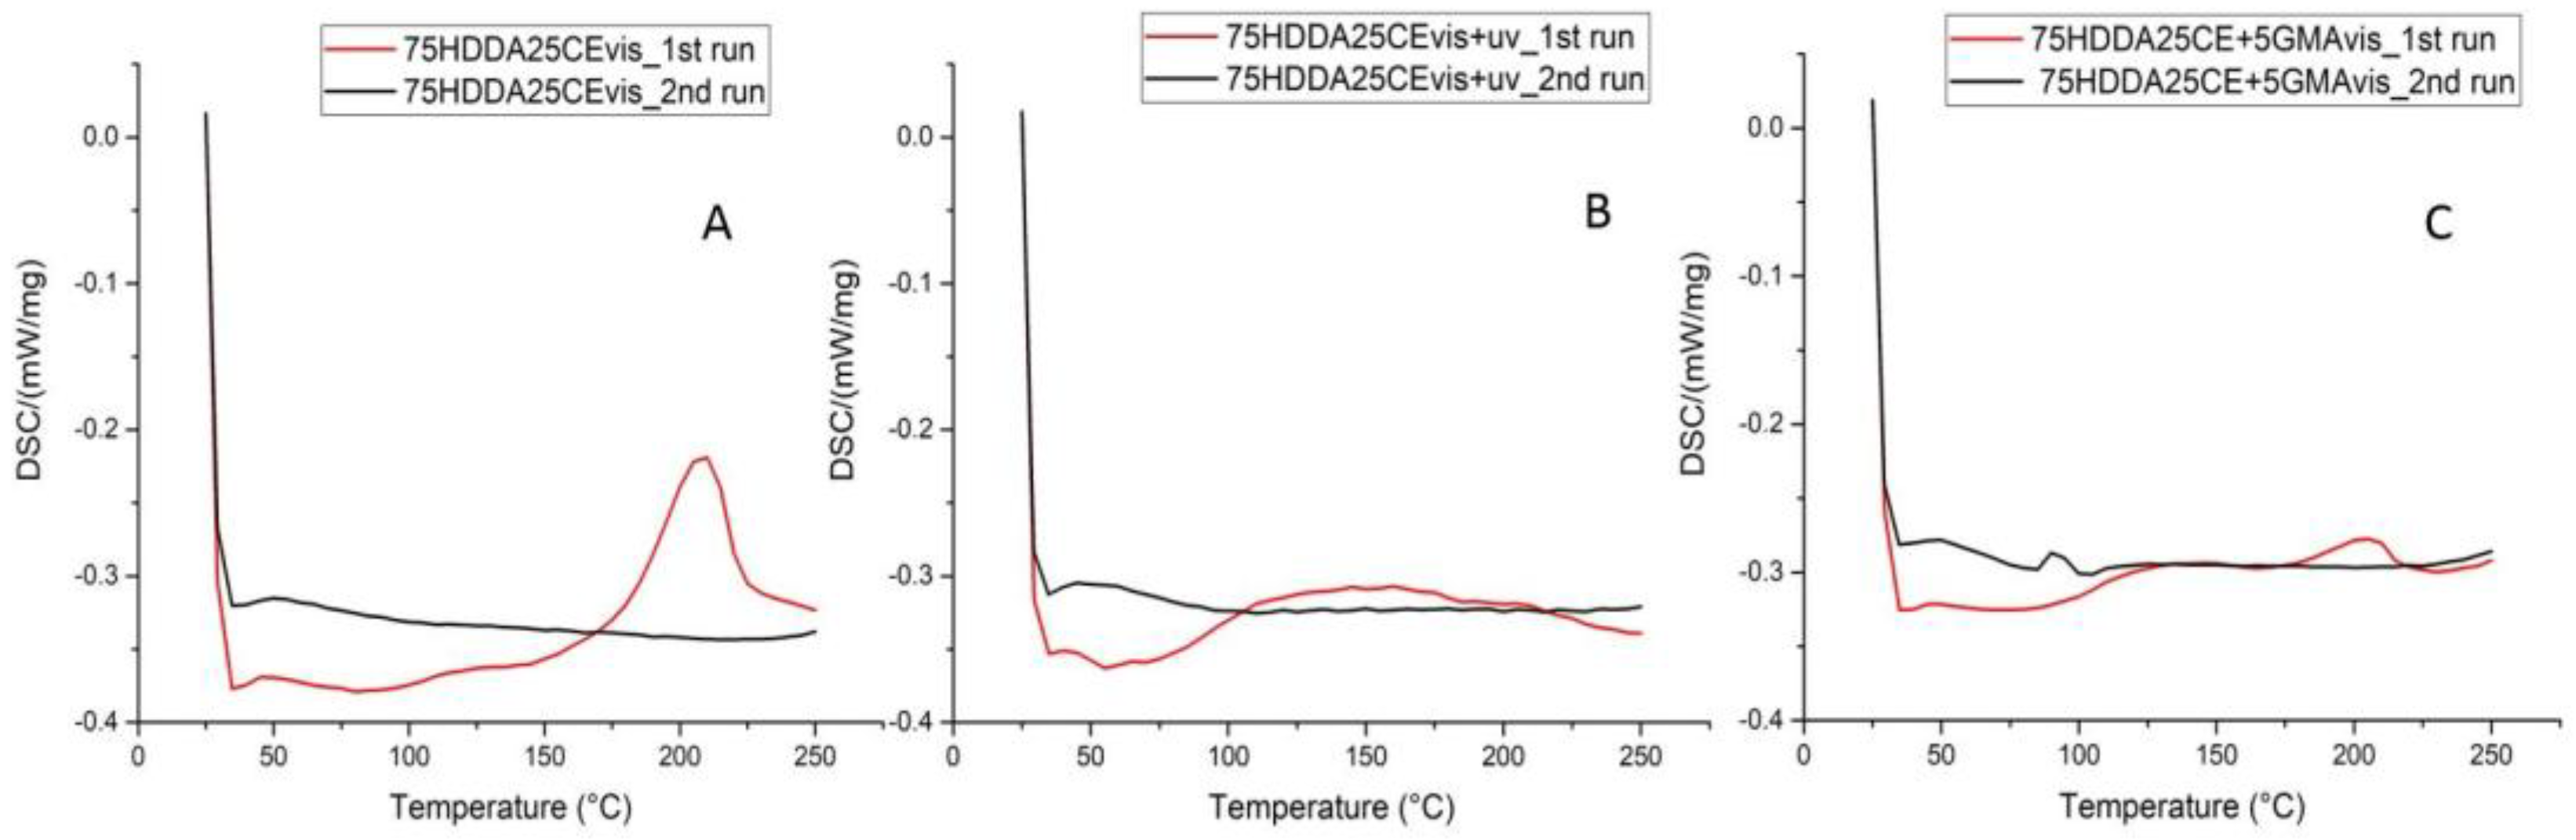
The differential scanning calorimetry (DSC) measurements were performed on the printed samples before and after the UV-curing treatment, for 5 min. Figure 2A reports the curve that was obtained from sample 75HDDA25CE, as it was representative for all of the samples that contained CE. These samples, before the UV light irradiation, showed an exothermal peak in the temperature, which ranged between 180 and 220 °C, which could have been related to a temperature-induced opening of the epoxy rings. It was important to observe the evidence that the higher the concentration of the epoxy resin in formulations, the higher was the peak area; this was so for the polymerization energy (see Supplementary Materials, Figure S9). The UV post-cured samples (Figure 2B), instead, did not show a polymerization peak, which confirmed that the UV-curing allowed for full polymerization of CE. In the post-cured samples it was also possible to see a sort of very broad and low peak (100–180 °C), which had not been detected in the previous test. This peak probably originated from the dye’s degradation, by opening the melting pot that contained the sample at the end of measurements, the polymer was almost transparent, which was a sign that the dye was degraded, as we had expected. In the not cured samples, this area was not detected, probably because it was covered by the polymerization peak.
The acrylic glass transition temperature (Tg) was detected between the range of 50 and 60 °C (Table 2), but nevertheless, in all of the samples, the Tg looked very broad and probably covered the range between the acrylic and epoxy polymers. This was evidence that the whole material was actually an interphase material, as it was reported in literature [18]. In order to obtain more precise details over the formulations of the Tgs, DMTA tests were also performed and will be discussed below.
After analyzing the 75HDDA25CE, 75HDDA25CE + GMA, and 75HDDA25CE + 10GMA DSC profiles, the peak areas of the not UV-cured samples that contained the GMA were very low, lower than the peak area of 75HDDA25CE (Figure 2C). It should have meant that, in the formulations that contained GMA as the bridging agent, there were less unreacted epoxy groups than in the 75HDDA25CE formulation. Since the acrylic groups’ conversion rate was not modified by the presence of GMA (Table 2), the decrease of the peak area could only have been related to the epoxy groups’ reactivity. GMA could improve the epoxy groups conversion, because it also acted as a HDDA chain terminator, decreasing the crosslinking density, and giving more mobility to the CE monomer, which could have reacted more easily between each other, and formed the epoxy network.
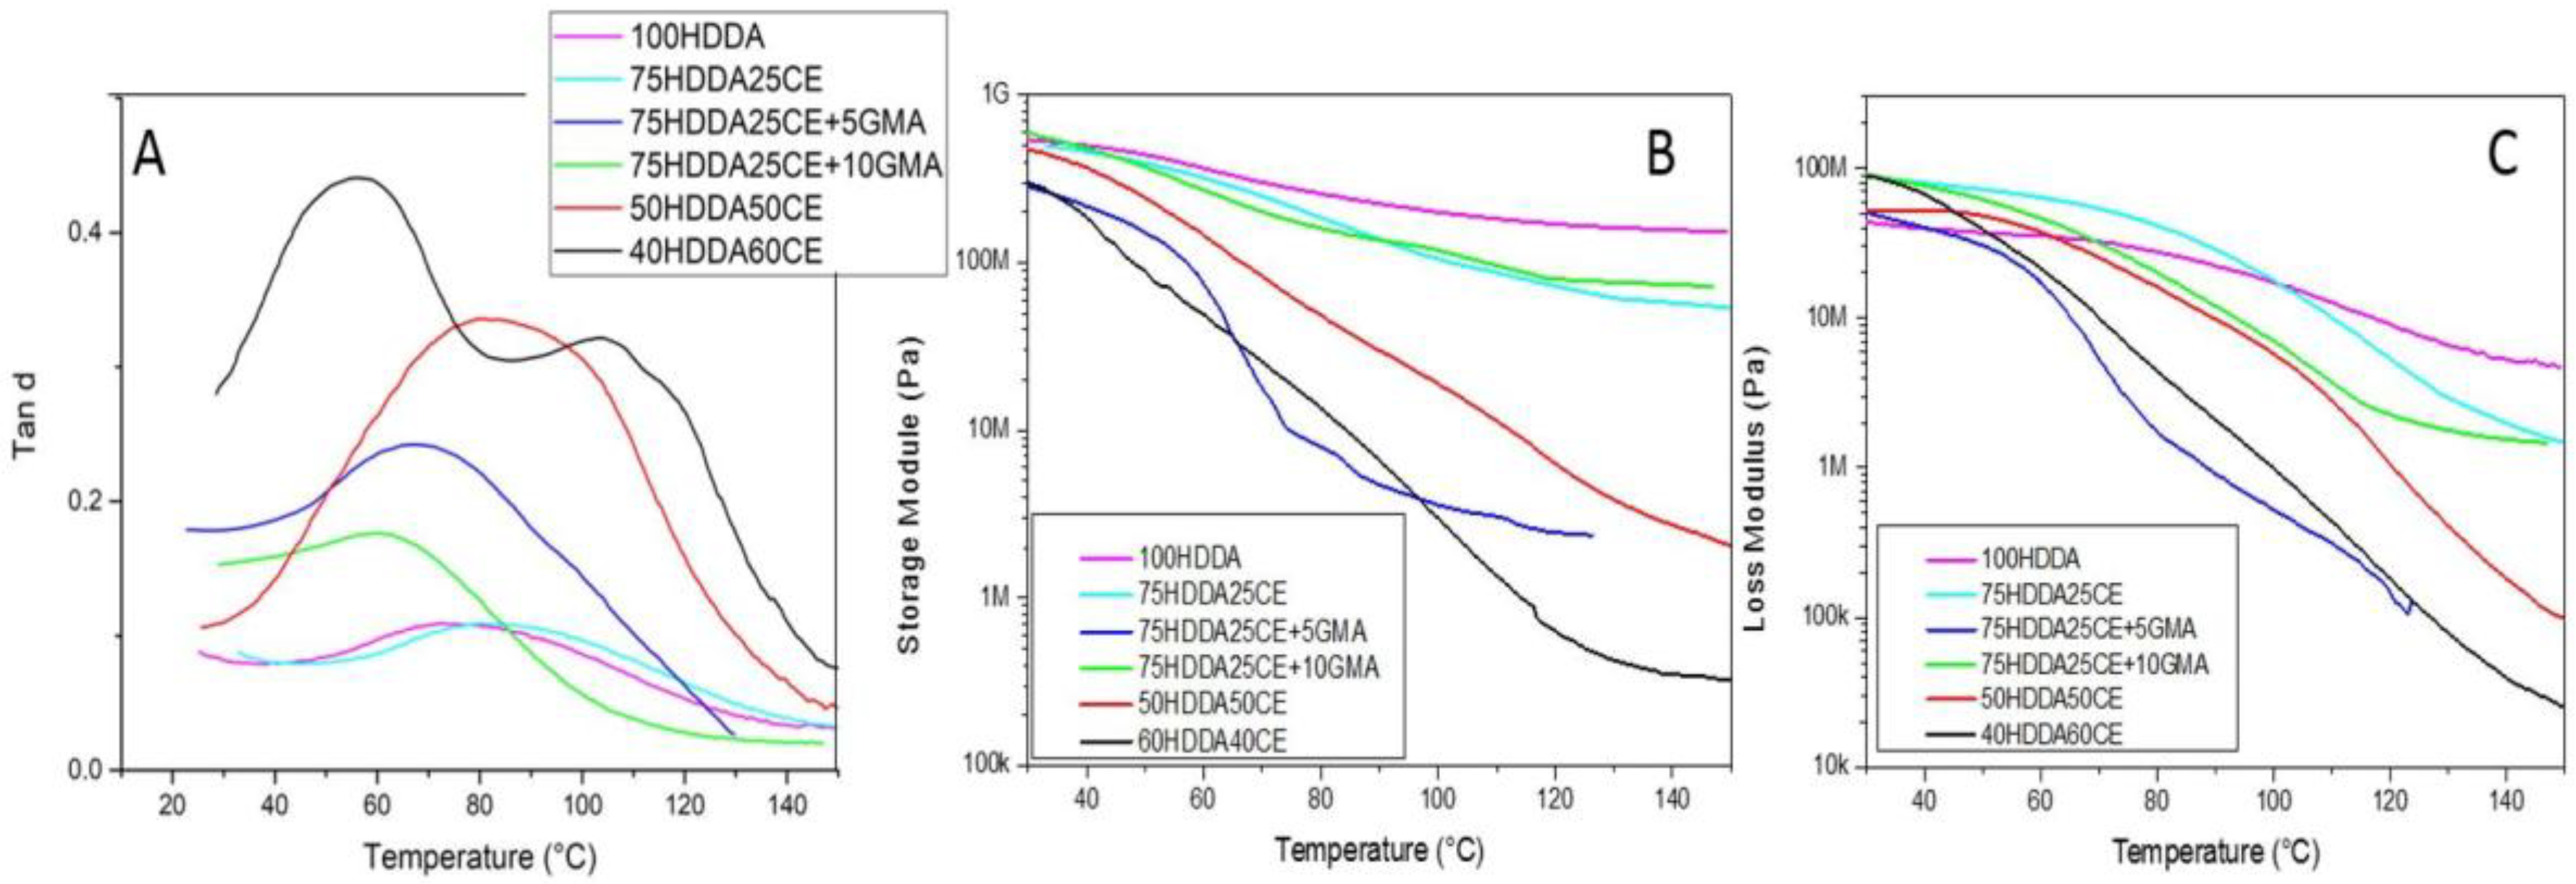
DMTA characterization was then performed, as seen in Figure 3A, and the Tan δ vs. temperature are reported for each sample, while Table 2 reported the most important parameters that were obtained from this analysis. In 75HDDA25CE, 75HDDA25CE + 5GMA, and 75HDDA25CE + 10GMA, the Tan δ curves were very broad. This could have been consistent with the formation of an Interpenetrated Polymeric Network (IPN) [18].
At the higher CE contents in the formulations (50HDDA50CE and 40HDDA60CE), the Tan δ curves’ result was significantly different. In the 50HDDA50CE sample, the very broad Tan δ curve could be seen as the sum of two distinct peaks, which were clearly evident in the 40HDDA60CE Tan δ curve. These peaks could have been attributed to an acrylic (the one at lower temperature) and an epoxy (at higher temperature) domain, which meant that the two monomers formed two distinct networks. This was typical of biphasic materials [18]. The maxima of the peaks that were associated to the acrylic phase were located at lower temperatures than the pure HDDA sample, which meant that the Tgs of the acrylic domains were lower, because a lower crosslinking density was achieved. This seemed in contrast with the evaluation of the conversion that was previously discussed, which showed that, when increasing the epoxy resin amount in the formulation, the double bonds conversion of the acrylic groups increased. However, this did not mean that the acrylic network cross-linking density increased as well, because during the polymerization step, there was a higher content of CE, which was still liquid during the forming network. Thus, in the 50HDDA50CE and 40HDDA60CE formulations, the HDDA cross-linked in a solvent medium (very diluted), which implied a higher conversion but lower cross-linking density, which led to a lower glass transition temperature than the pure HDDA.
As we expected, the 75HDDA25CE sample showed a Tg that was higher than 100HDDA. In fact, when increasing the epoxy content in the formulation, an increase in the glass transition temperature was expected, because CE had a higher Tg than HDDA (Tg HDDA = 75.5 °C, Tg CE = 154 °C).
The formulations that contained GMA even showed a Tg that was lower than the pure HDDA sample (Tg 75HDDA25CE + 5GMA = 66.5 °C and Tg 75HDDA25CE + 10GMA = 57.3 °C). This phenomenon could have originated from a crosslinking density decrease, as a result of the presence of GMA, which produced a steric obstruction and acted as an HDDA chain terminator.
Mechanical damping represented the internal friction in a viscoelastic system, and it was the measure of the energy that was lost expressed in terms of the recoverable energy. The damping values that are reported in the Table 2 correspond to the numerical value of the Tan δ peaks (dimensionless number) [22].
There was no difference in terms of the damping between the 100HDDA and 75HDDA25CE samples, but by adding a low amount of GMA in the system, the damping increased. The 50HDDA50CE and 40HDDA60CE samples showed the highest damping. This could be explained when considering the height of the Tan δ curve (and so the damping), which could be directly related to the different values of E, below and above the glass transition range. The more a network was cross-linked, the higher the modulus in the rubbery region was, and so, the damping was lower. In this case, we obtained highly cross-linked networks in the 100HDDA and 75HDDA25CE samples. GMA, being a hybrid monomer, reacted with growing radical macromolecules, which induced a decrease of the cross-linking density, which resulted in an increase of damping.
In the case of the 50HDDA50CE and 40HDDA60CE, a different effect should have been taken into account. As previously mentioned, a good assumption could be that during the 3D printing process, as it was mimicked during the FT-IR experiments, only the HDDA was polymerized, while CE liquid monomers remain trapped in the gelled network. The resulting structure could be seen as the polymerization of a swollen network (CE acts as a solvent), which was well known to have produced a looser network, with a higher damping. Moreover, during the UV-curing, a cationic polymerization occurred in an already cross-linked medium, which reduced the mobility of the growing macromolecules and led to lower cross-linked epoxy domains.
It was possible to observe that the decrease of the moduli during the glass transition was more marked in the hybrid samples than in the 100HDDA samples. The 50HDDA50CE and 40HDDA60CE samples, which were discussed before being presented as two distinct Tgs, also showed this biphasic nature during the flex of the moduli, which, in fact, seemed to have happened in two different stages. The strong decrease of the moduli of the 50HDDA50CE and 40HDDA60CE samples was also evidence of a weak cross-linked network.
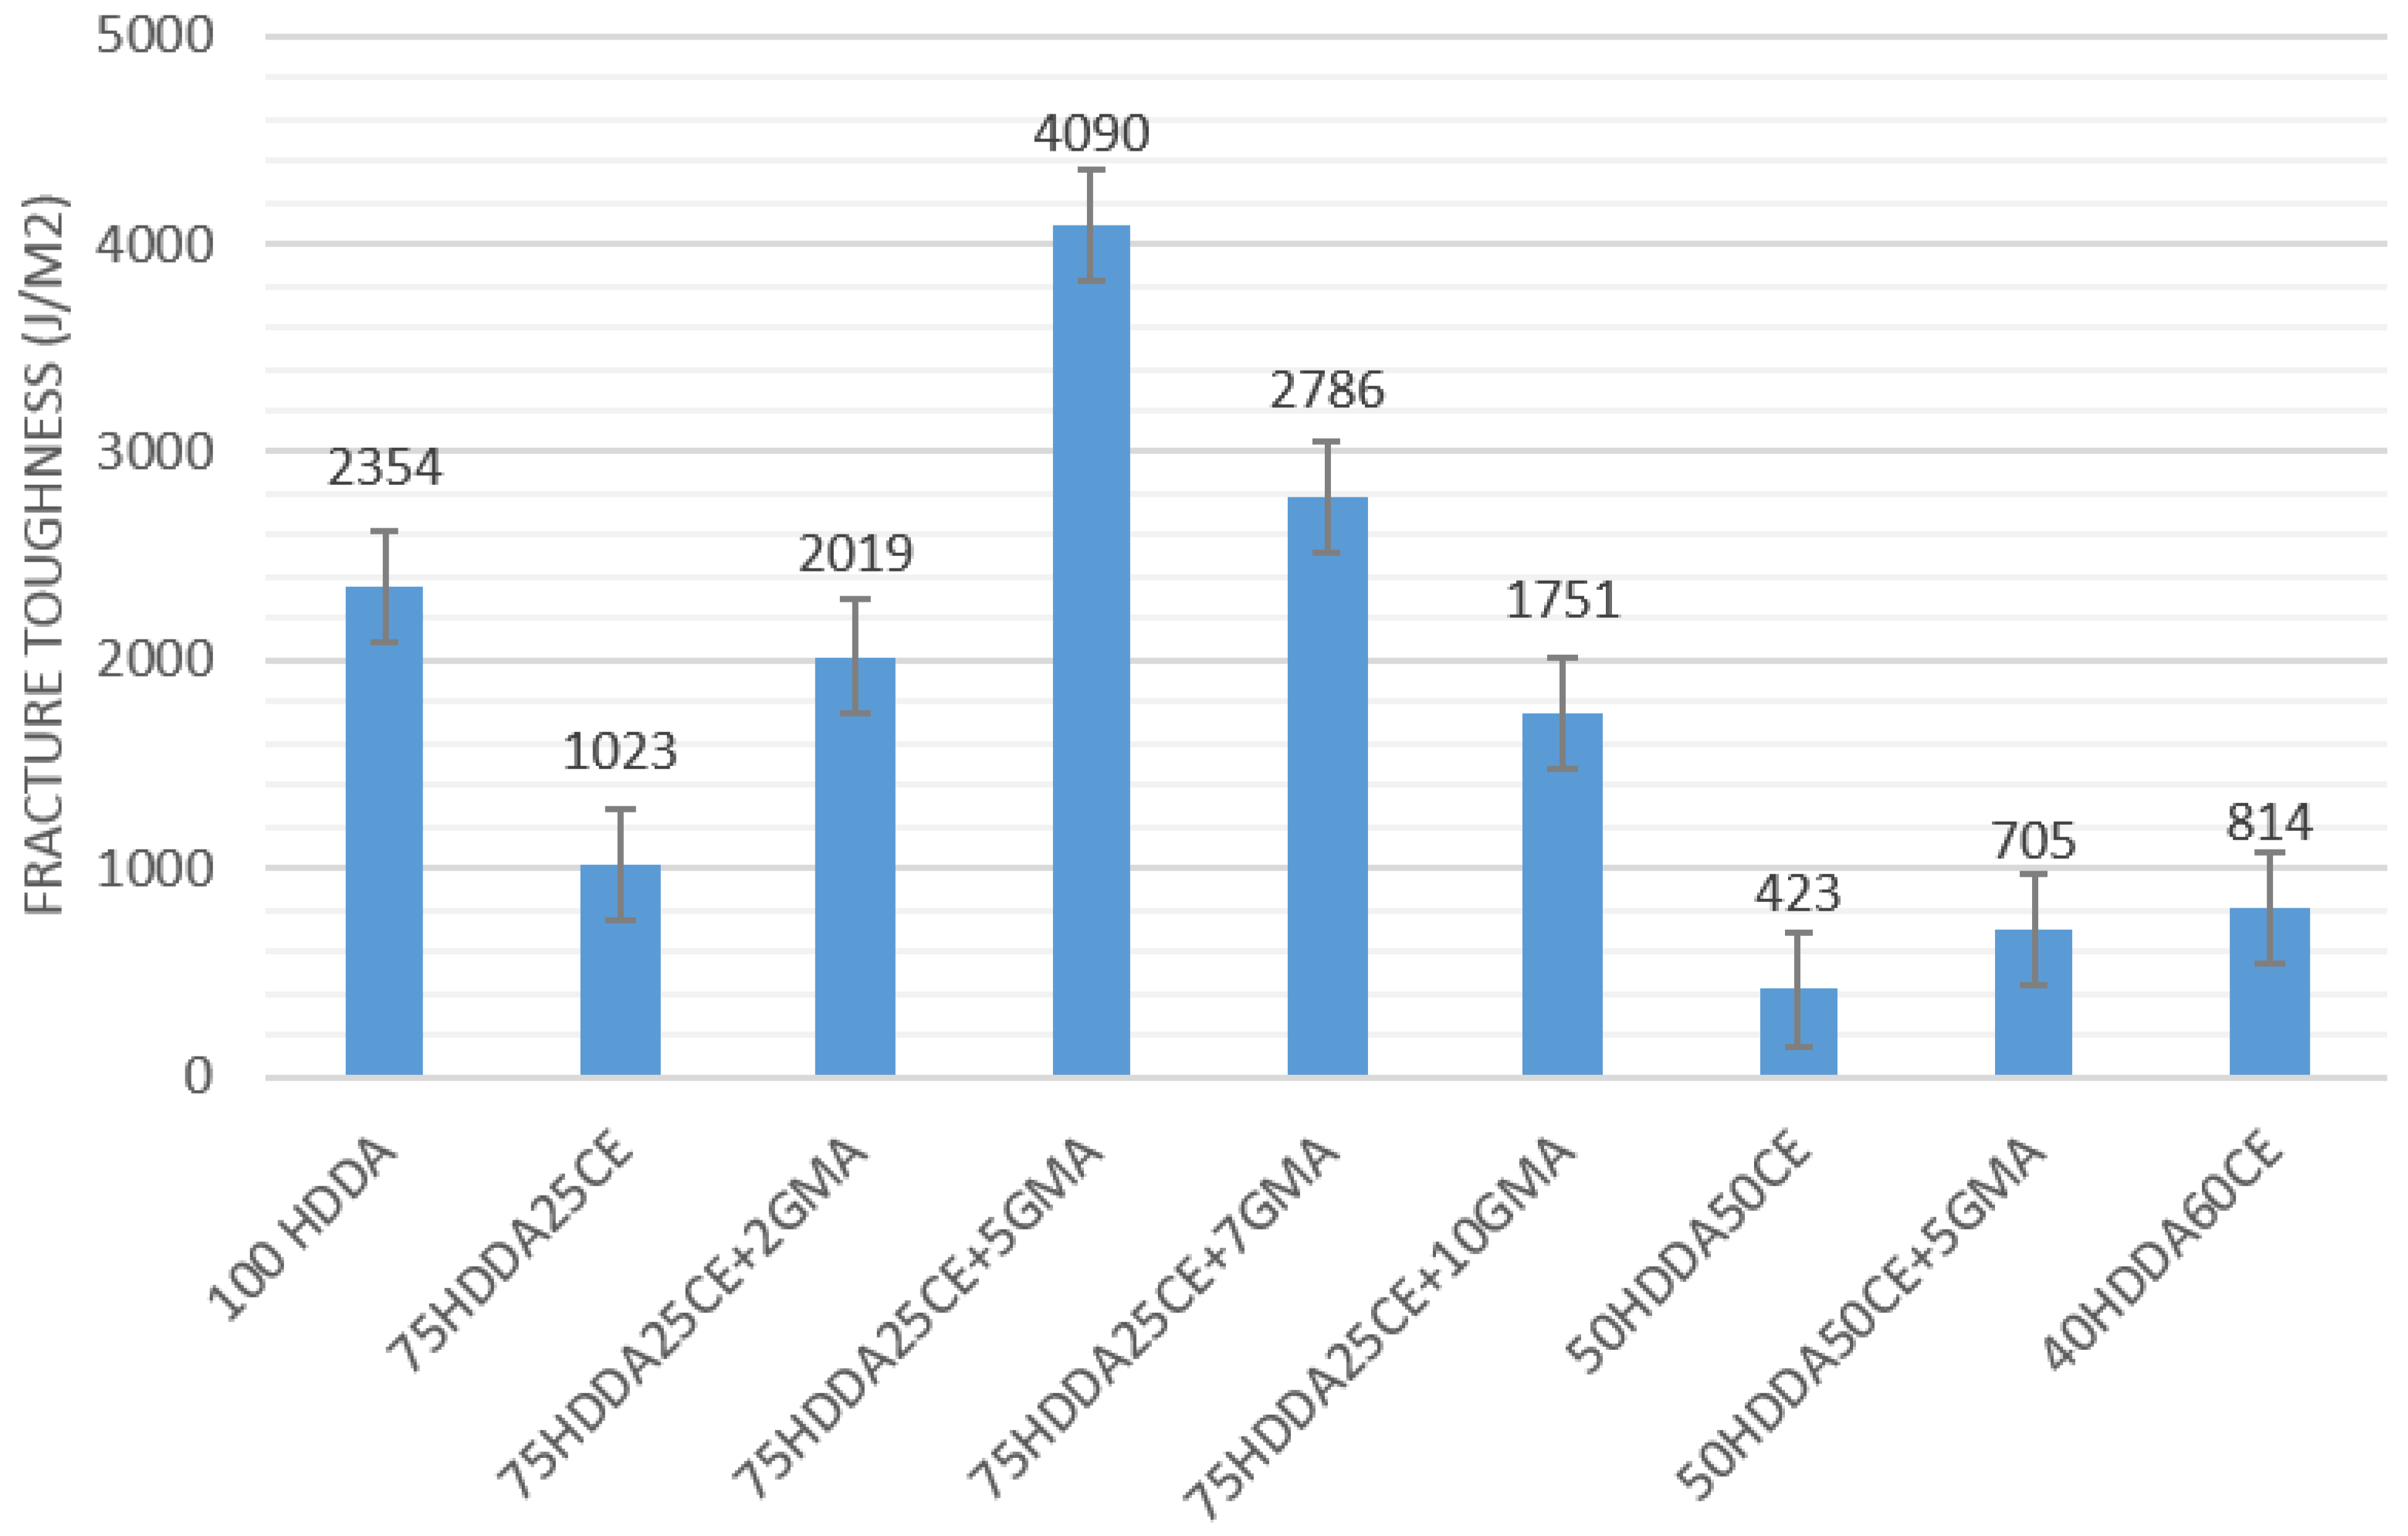
When comparing the behavior of the samples that contained GMA with the corresponding 75HDDA25CE samples, it was possible to observe that the moduli’s trend of the 75HDDA25CE and 75HDDA25CE + 10GMA samples was very similar in both of the cases (storage module and loss module), while the behavior of the 75HDDA25CE + 5GMA was radically different, and the decrease of the moduli during the glass transition was very remarked. These results suggested that the GMA effect had changed according to its concentration in the system. This phenomenon was also observed during the Izod impact tests, which were performed in order to examine how the fracture toughness changed depending on the epoxy content in the formulation and the influence of GMA in the mechanical properties. As expected, when increasing the epoxy resin amount in the formulation, the fracture toughness decreased (Figure 4). In fact, as has already been discussed in the introduction, one of the major drawbacks of the epoxy resins was their very fragile behavior.
Considering the samples without GMA, the presence of CE in the HDDA network generally decreased the impact toughness. Perhaps the presence of a second phase, as was observed during the DMTA experiments, induced weakness in the samples. On the other hand, the influence of GMA on the impact test was very interesting. The samples with the same concentration of HDDA and CE, but a different concentration of GMA, showed a completely different fracture toughness. In order to investigate this behavior in detail, the 75HDDA25CE + 2GMA and 75HDDA25CE + 7GMA samples were produced and tested. It was possible to observe that, in samples that contained GMA, there was a bell-shaped trend of fracture toughness that was centered in the 75HDDA25CE + 5GMA samples.
In order to understand this behavior, two effects should have been taken into account. On the one hand, GMA decreased the network density of the HDDA, which weakened it. On the other, the presence of epoxy groups led to a hybrid material, in which the acrylate and epoxy networks were chemically bonded, which increased the mechanical behavior.
Tests that were performed with different amounts of GMA showed a bell-shaped trend and the best performances were obtained from the samples containing 5% of GMA, which was the best concentration, in order to compensate for the effects that have been described above.
It is important to notice that the 75HDDA25CE + 5GMA samples showed a toughness that was four times higher than the corresponding sample, without GMA, and almost double the values when compared with the pure HDDA samples.
The great effect of GMA on impact toughness in the HDDA-CE system was also confirmed for other formulations, as was witnessed by the 50HDDA50CE + 5GMA formulation. Additionally, in this case, the impact toughness value was almost double that of the corresponding 50HDDA50CE. The same principles that had been written before, in order to describe the relationship between GMA concentration and final mechanical properties, were valid for all of the other formulation.
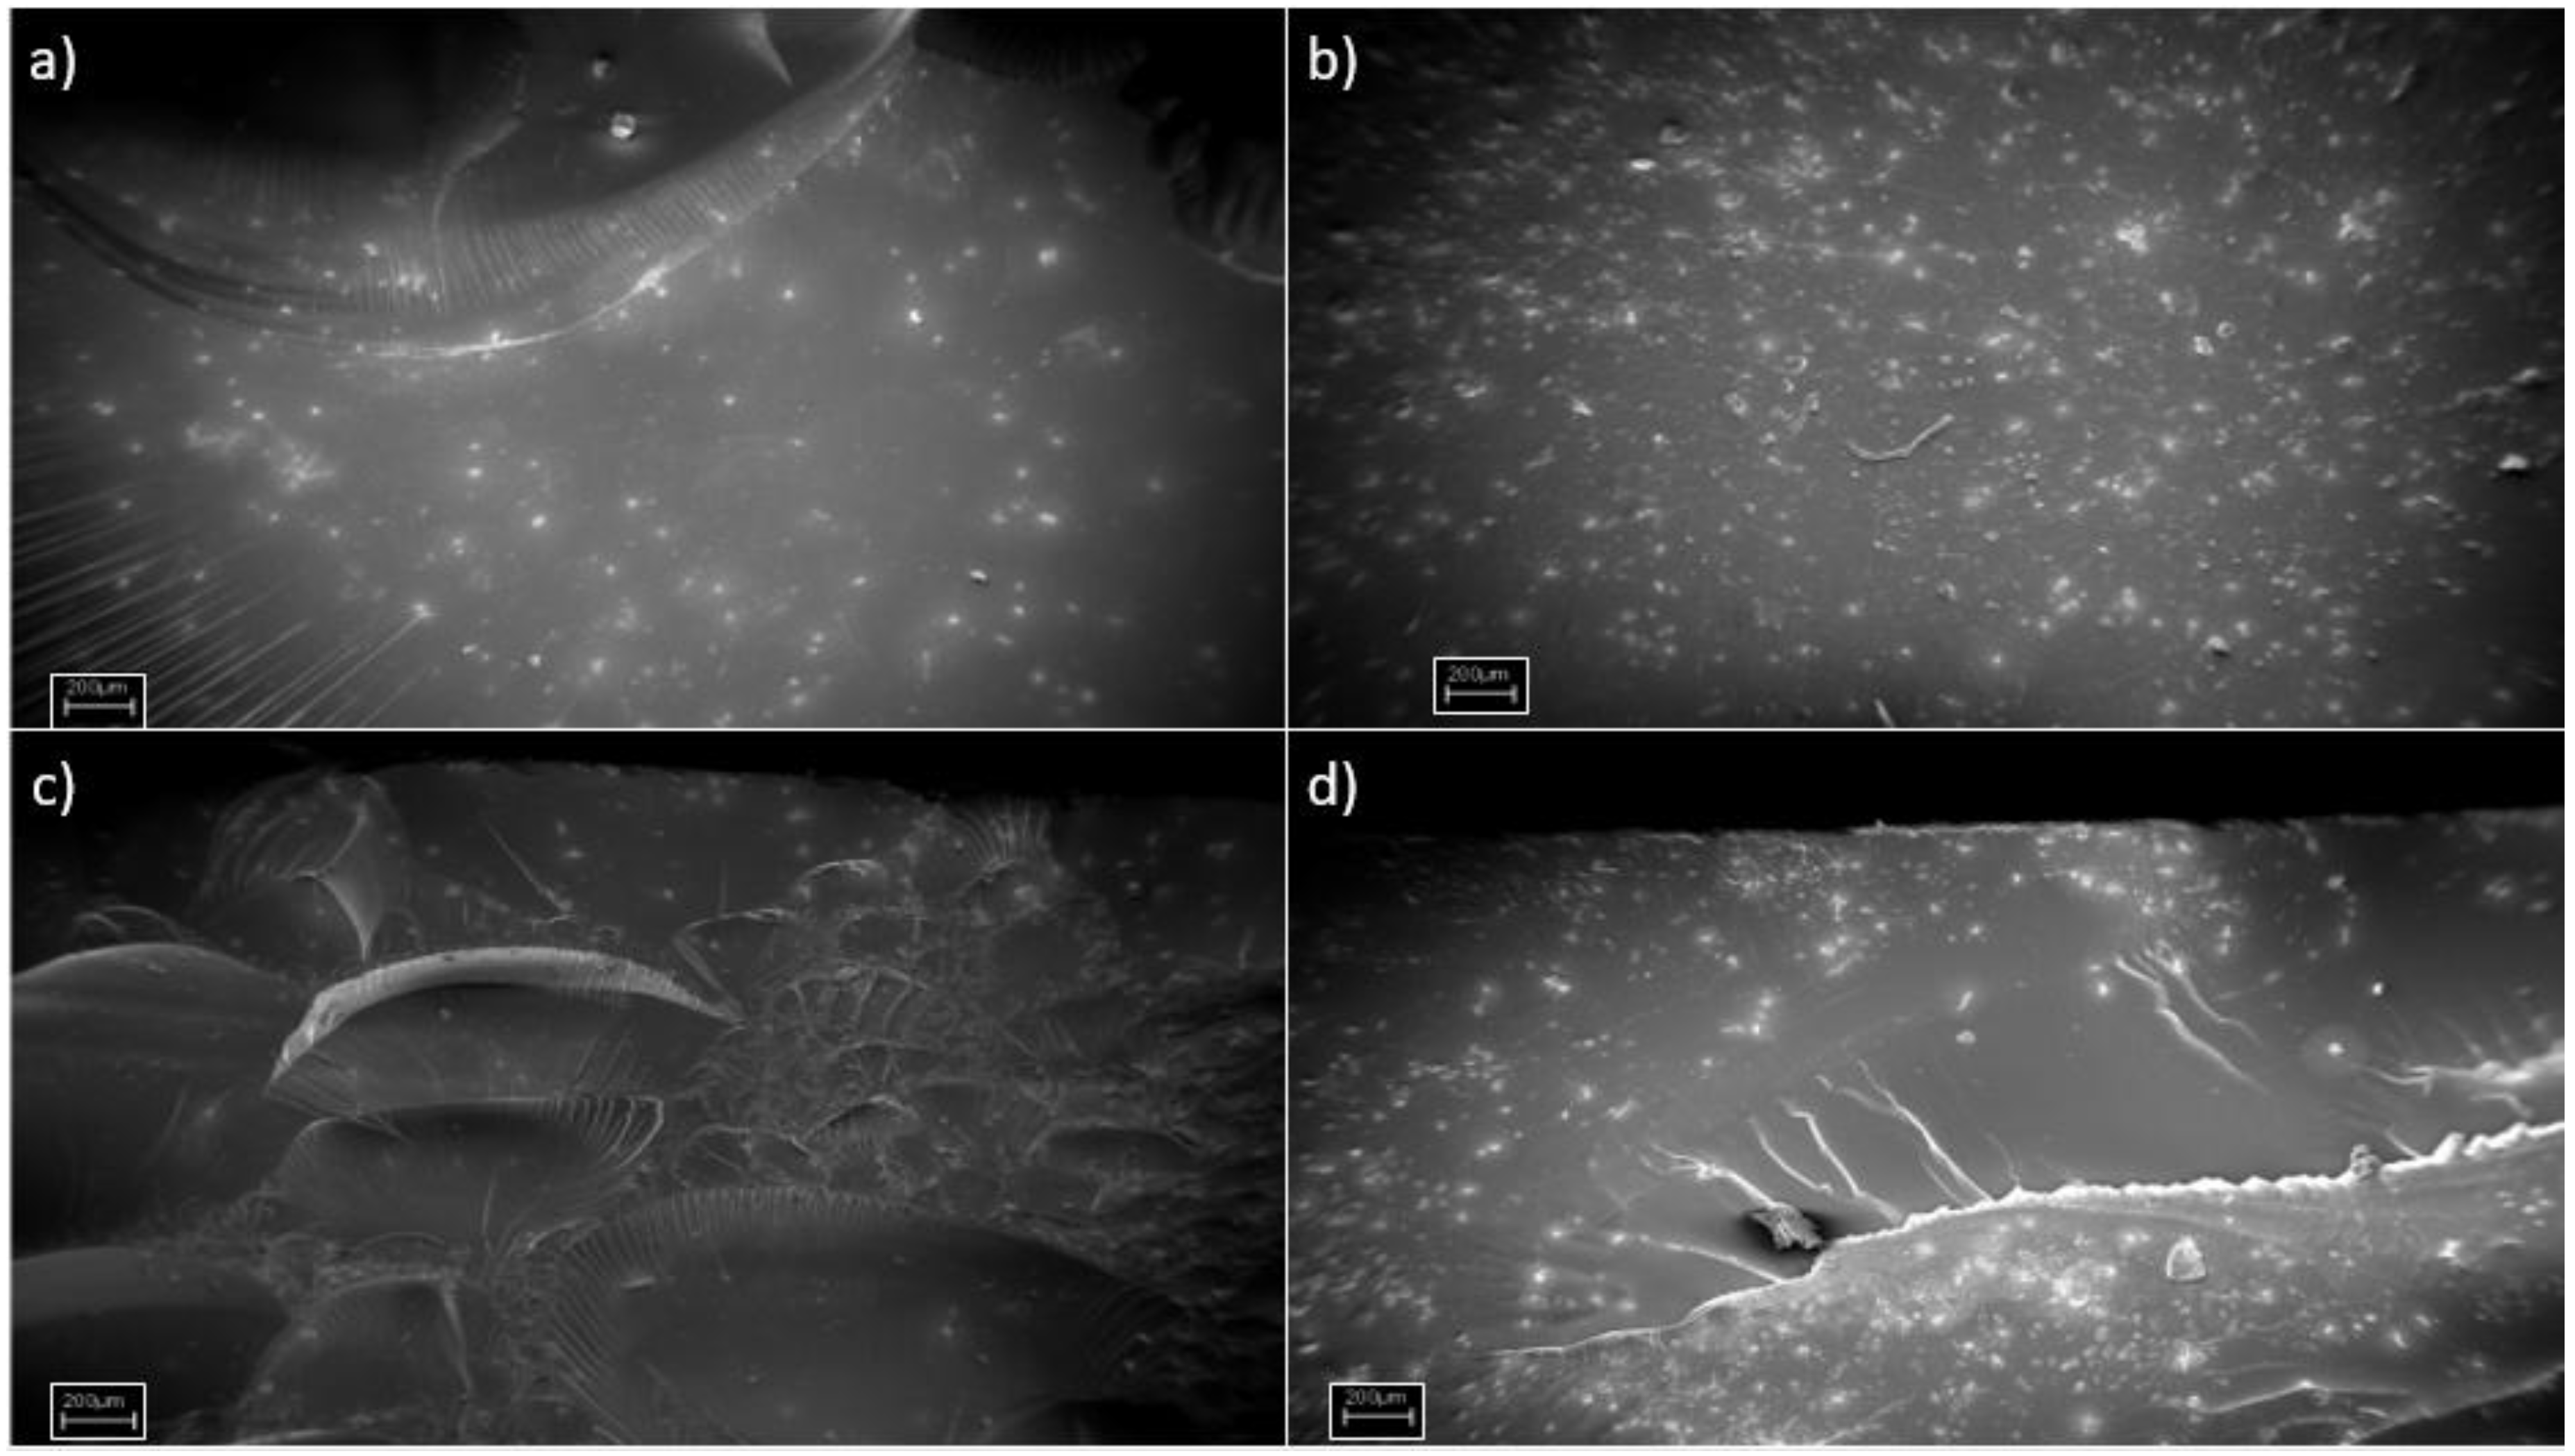
In order to deeply investigate the response of the samples at the impact tests, Field Emission Scanning Electron Microscopy (FESEM) pictures of several of the fracture surfaces were taken (Figure 5a). The images that were acquired confirmed the fracture toughening trends that were previously described. The 100HDDA surface showed several “river lines”, which were characteristic of a brittle material that presented some ductility [23]. After adding CE in the formulation, the resulted materials turned out to be very fragile and the fracture surfaces were rather smooth (Figure 5b,d). The 75HDDA25CE + 5GMA sample was instead completely different. Here, as in agreement with the Izod impact tests, a toughening mechanism was present, which resulted in a complex fracture surface, with structures that were typical of toughened materials [24]. Unfortunately, it was not possible from the FESEM images to distinguish between the different polymeric networks that were evidenced in the DMTA measurements for the 40HDDA60CE sample.
Aiming to fully characterize the mechanical properties of the 3D printed materials, tensile tests were performed and the elastic module (E) for each formulation was obtained (Table 2 and Supplementary Materials, Figure S10). The results were similar to those of the impact test. When increasing the epoxy resin content in the formulations, a strong decrease in the Young module occurred. Unfortunately, GMA did not have the same strong influence on E as it did on Jic (plastic-elastic fracture toughness measured by Izod tests). Even if the samples with GMA showed better mechanical properties than the 75HDDA-25CE samples, the elastic module was not higher than the pure HDDA sample. Furthermore, the influence of GMA seemed different from that seen for Jic, namely, the higher the GMA amount was, the higher is the Young module was.
The obtained curves (see Supplementary Materials, Figure S10) showed a typical fragile behavior and plastic deformation did not occur. The decrease of the tensile resistance was much more accentuated in the hybrid samples.
A reason for the weak mechanical properties of the 50HDDA50CE and 40HDDA60CE systems could be found on the inner structures of the material. In this case, a not interpenetrated hybrid polymer was achieved and the boundaries between the acrylic and epoxy regions could have been wider and contained more defects that brought a lower mechanical resistance of the material
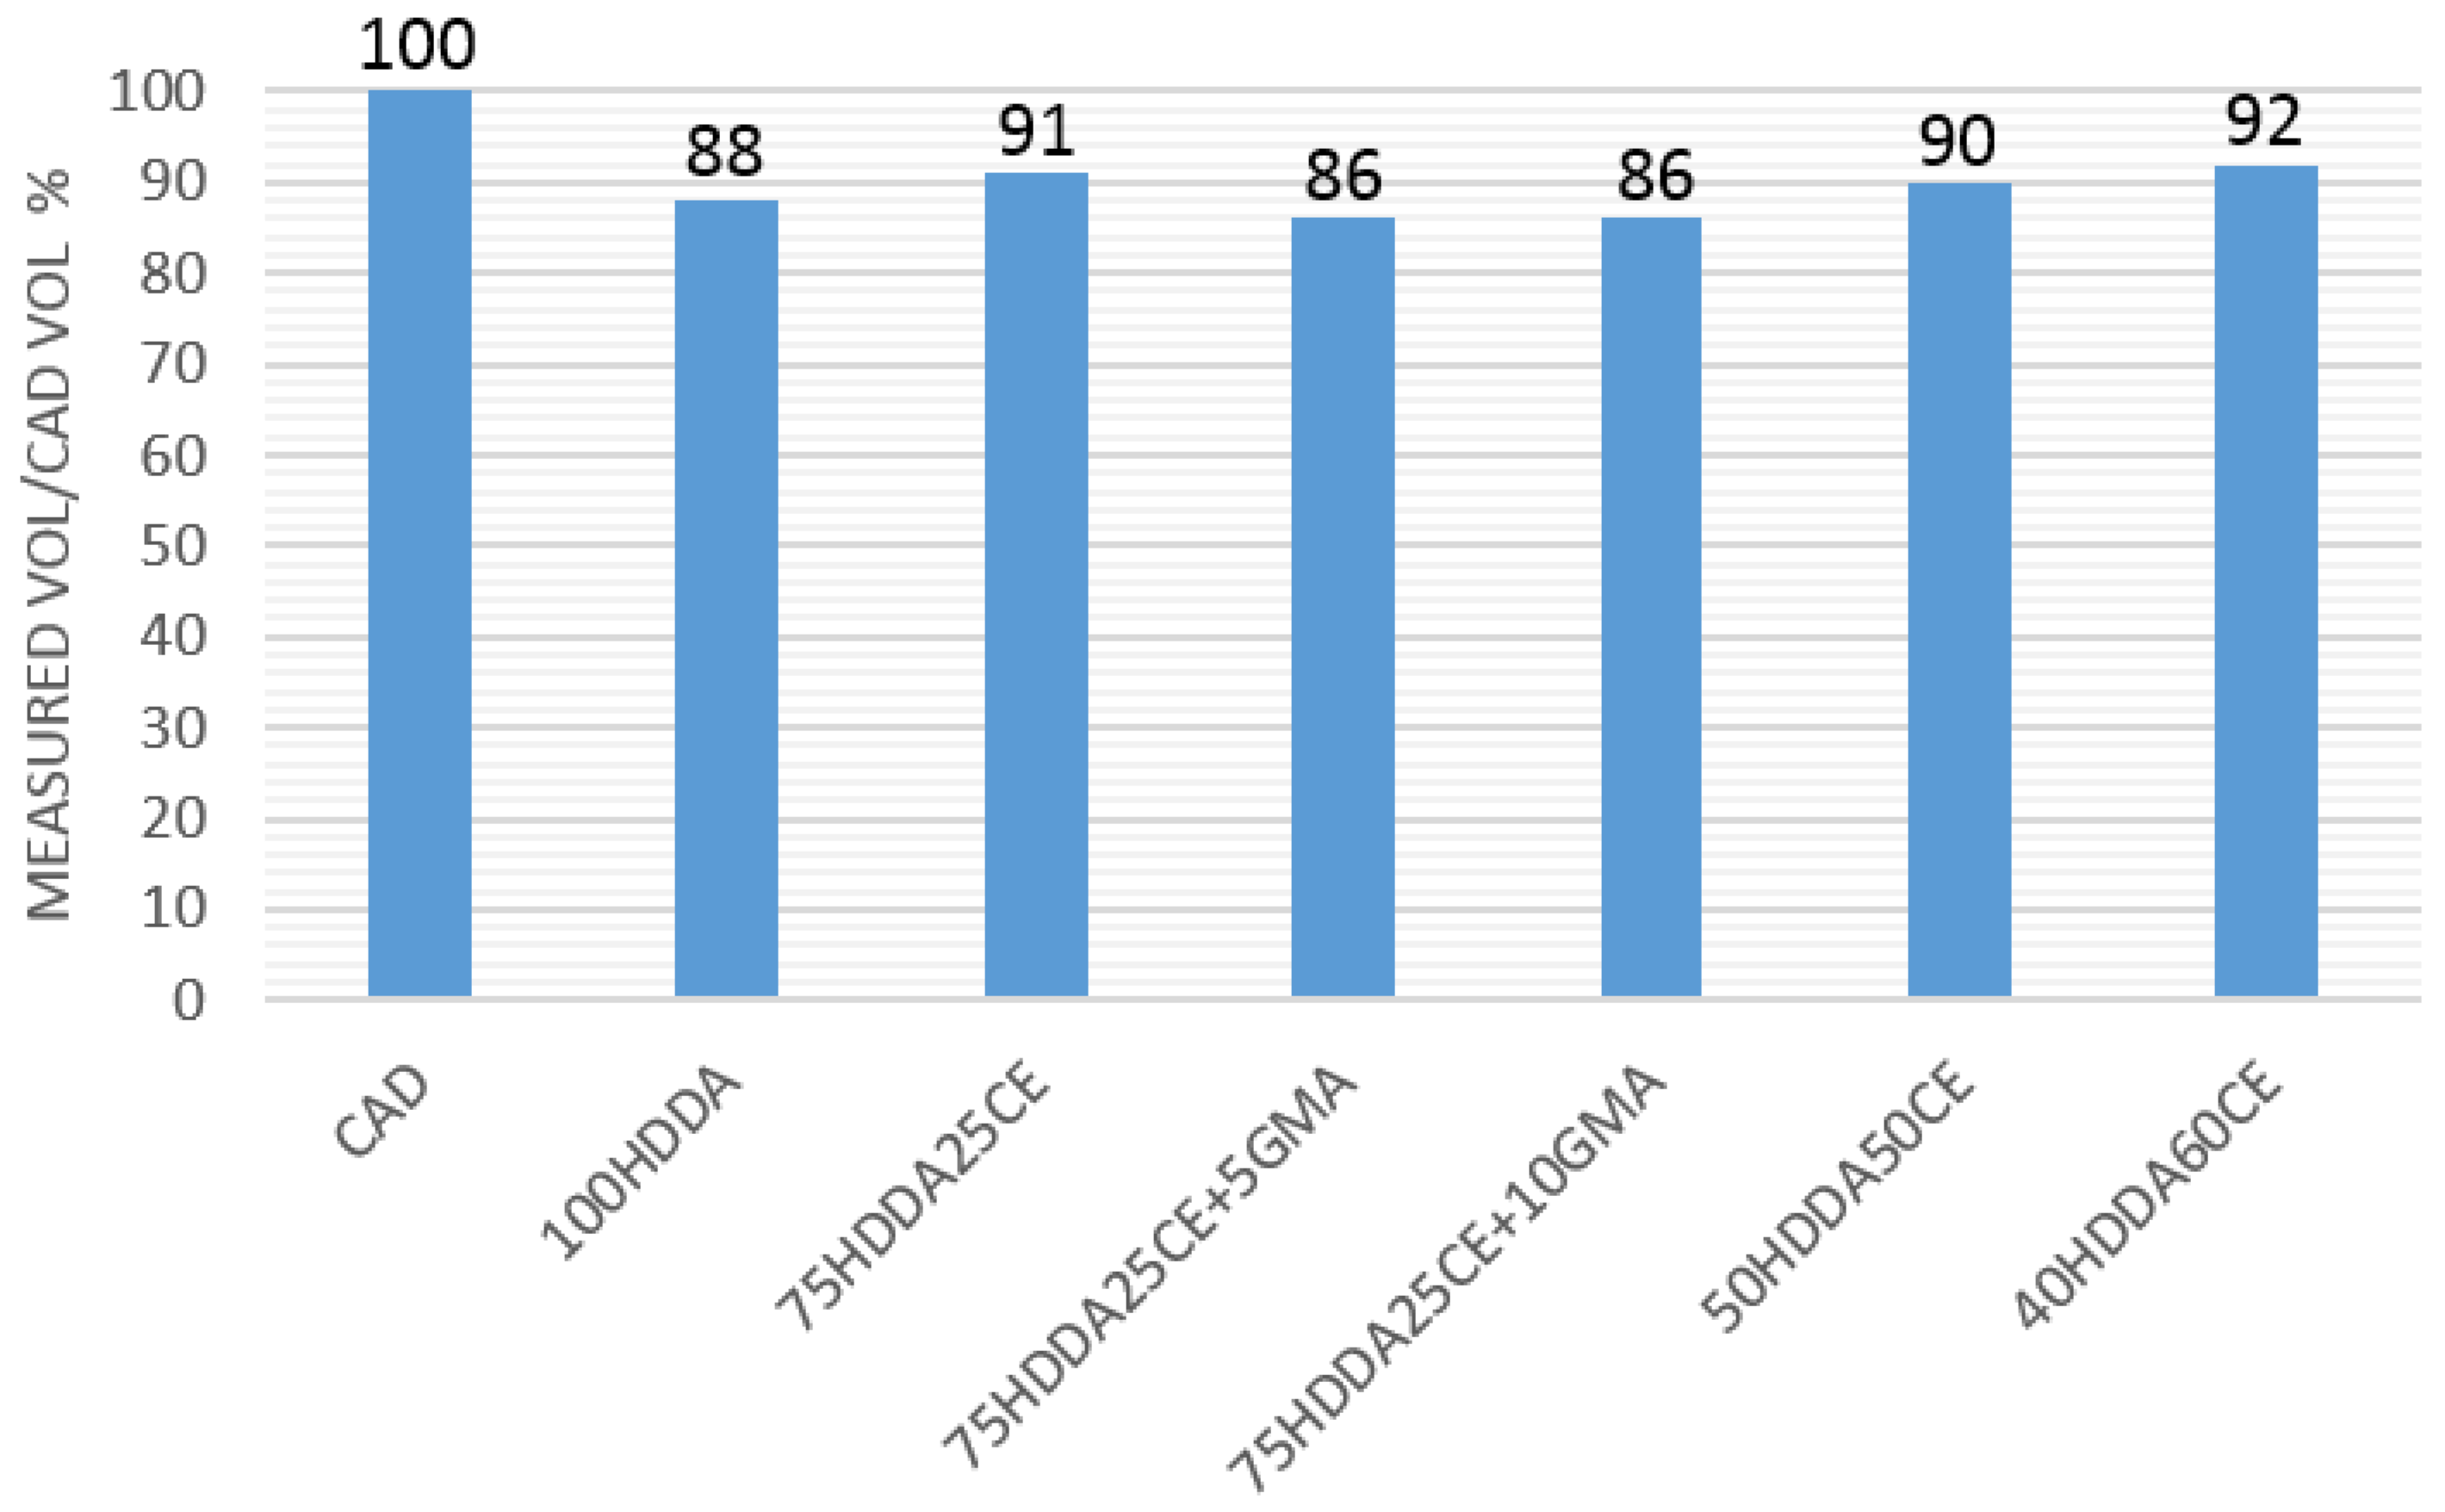
The presence of an epoxy resin in an acrylate formulation was expected to have led to a decrease of volumetric shrinkage. To evaluate this effect, the volume of the 3D printed parallelepiped samples were calculated after printing and were compared to the theoretical volume of the CAD model. As expected, by increasing the CE amount in the formulations, a decrease of the shrinkage was achieved, while the addition of the bridging agent had caused an increase of the shrinkage, with respect to the pure acrylic sample (Figure 6).
4. Conclusions
The formulations that were based on the HDDA-CE system were easily 3D printed by the DLP technique, giving an Interpenetrated Polymeric Network (IPNs) for the concentration of CE that did not exceed 25 mol %. The addition of CE in the system produced an increase of the acrylic groups’ conversion and a reduction of the shrinkage, but the samples that obtained resulted were very brittle. GMA, added as a coupling agent, assured the formation of the chemical bonds between the acrylic and epoxy networks that had formed, which led to a higher impact and tensile resistances. The presence of GMA in the system also induced a decrease of cross-linking density, which provoked a shift of the glass transition temperature to lower temperatures. No hybrid formulation had resulted in having higher elastic modules than the 100HDDA samples, but the 75HDDA25CE + 5GMA and 75HDDA25CE + 7GMA samples showed a remarkable increase in the impact toughness, with respect to the 100HDDA formulation.
Supplementary Materials
The following are available online at https://www.mdpi.com/2411-5134/3/2/29/s1, Conversion vs. time of the acrylic groups during visible light irradiation (Figure S1). FT-IR spectra representative for all of the samples at different irradiation times under visible light (Figures S2–S5). Epoxy groups conversion vs. time profile representative for the different formulations (Figures S6–S8). DSC plots obtained for the samples with increasing amount of CE after printing, showing the different specific heat measured during the first heating cycle (Figure S9). Stress-strain curves (Figure S10).
Author Contributions
I.R., M.S., and C.F.P. conceived and designed the experiments; S.L. performed the experiments; I.R., S.L., and A.C. analyzed the data; and A.C. wrote the paper.
Conflicts of Interest
The authors declare no conflict of interest.
References
- Gross, B.C.; Erkal, J.L.; Lockwood, S.Y.; Chen, C.; Spence, D.M. Evaluation of 3D Printing and Its Potential Impact on Biotechnology and the Chemical Sciences. Anal. Chem. 2014, 86, 3240–3253. [Google Scholar] [CrossRef] [PubMed]
- Hofmann, M. 3D Printing Gets a Boost and Opportunities with Polymer Materials. ACS Macro Lett. 2014, 3, 382–386. [Google Scholar] [CrossRef]
- Wong, K.V.; Hernandez, A. A Review of Additive Manufacturing. ISRN Mech. Eng. 2012, 2012, 10. [Google Scholar] [CrossRef]
- Wang, X.; Jiang, M.; Zhou, Z.; Gou, J.; Hui, D. 3D printing of polymer matrix composites: A review and prospective. Compos. Part B Eng. 2017, 110, 442–458. [Google Scholar] [CrossRef]
- Petrovic, V.; Vicente Haro Gonzalez, J.; Jordá Ferrando, O.; Delgado Gordillo, J.; Ramón Blasco Puchades, J.; Portolés Griñan, L. Additive layered manufacturing: Sectors of industrial application shown through case studies. Int. J. Prod. Res. 2011, 49, 1061–1079. [Google Scholar] [CrossRef]
- Au, A.K.; Huynh, W.; Horowitz, L.F.; Folch, A. 3D-Printed Microfluidics. Angew. Chem. Int. Ed. 2016, 55, 3862–3881. [Google Scholar] [CrossRef] [PubMed]
- Skardal, A.; Atala, A. Biomaterials for Integration with 3-D Bioprinting. Ann. Biomed. Eng. 2015, 43, 730–746. [Google Scholar] [CrossRef] [PubMed]
- Stassi, S.; Fantino, E.; Calmo, R.; Chiappone, A.; Gillono, M.; Scaiola, D.; Pirri, C.F.; Ricciardi, C.; Chiadò, A.; Roppolo, I. Polymeric 3D Printed Functional Microcantilevers for Biosensing Applications. ACS Appl. Mater. Interfaces 2017, 9, 19193–19201. [Google Scholar] [CrossRef] [PubMed]
- Ladd, C.; So, J.-H.; Muth, J.; Dickey, M.D. 3D Printing of Free Standing Liquid Metal Microstructures. Adv. Mater. 2013, 25, 5081–5085. [Google Scholar] [CrossRef] [PubMed]
- Ready, S.; Endicott, F.; Whiting, G.L.; Ng, T.N.; Chow, E.M.; Lu, J. 3D Printed Electronics. NIP Digit. Fabr. Conf. 2013, 2013, 9–12. [Google Scholar]
- Fantino, E.; Chiappone, A.; Roppolo, I.; Manfredi, D.; Bongiovanni, R.; Pirri, C.F.; Calignano, F. 3D Printing of Conductive Complex Structures with in Situ Generation of Silver Nanoparticles. Adv. Mater. 2016, 28, 3712–3717. [Google Scholar] [CrossRef] [PubMed]
- Roppolo, I.; Chiappone, A.; Angelini, A.; Stassi, S.; Frascella, F.; Pirri, C.; Ricciardi, C.; Descrovi, E. 3D printable light-responsive polymers. Mater. Horiz. 2017, 4, 396–401. [Google Scholar] [CrossRef]
- Chiappone, A.; Fantino, E.; Roppolo, I.; Lorusso, M.; Manfredi, D.; Fino, P.; Pirri, C.F.; Calignano, F. 3D Printed PEG-Based Hybrid Nanocomposites Obtained by Sol-Gel Technique. ACS Appl. Mater. Interfaces 2016, 8, 5627–5633. [Google Scholar] [CrossRef] [PubMed]
- Khoo, Z.X.; Teoh, J.E.M.; Liu, Y.; Chua, C.K.; Yang, S.; An, J.; Leong, K.F.; Yeong, W.Y. 3D printing of smart materials: A review on recent progresses in 4D printing. Virtual Phys. Prototyp. 2015, 10, 103–122. [Google Scholar] [CrossRef]
- Melchels, F.P.W.; Feijen, J.; Grijpma, D.W. A review on stereolithography and its applications in biomedical engineering. Biomaterials 2010, 31, 6121–6130. [Google Scholar] [CrossRef] [PubMed] [Green Version]
- Kaur, M.; Srivastava, A.K. Photopolymerization: A review. J. Macromol. Sci. Part C 2002, 42, 481–512. [Google Scholar] [CrossRef]
- Sangermano, M. Advances in cationic photopolymerization. Pure Appl. Chem. 2012, 84, 2089. [Google Scholar] [CrossRef]
- Sangermano, M.; Carbonaro, W.; Malucelli, G.; Priola, A. UV-Cured Interpenetrating Acrylic-Epoxy Polymer Networks: Preparation and Characterization. Macromol. Mater. Eng. 2008, 293, 515–520. [Google Scholar] [CrossRef]
- Chen, F.; Cook, W.D. Curing kinetics and morphology of IPNs from a flexible dimethacrylate and a rigid epoxy via sequential photo and thermal polymerization. Eur. Polym. J. 2008, 44, 1796–1813. [Google Scholar] [CrossRef]
- Sangermano, M.; Carbonaro, W.; Bongiovanni, R.; Thomas, R.R.; Kausch, C.M. Interpenetrating Polymer Networks of Hydrocarbon and Fluorocarbon Polymers: Epoxy/Fluorinated Acrylic Macromonomers. Macromol. Mater. Eng. 2010, 295, 469–475. [Google Scholar] [CrossRef]
- Naguib, M.; Sangermano, M.; Capozzi, L.C.; Pospiech, D.; Sahre, K.; Jehnichen, D.; Scheibner, H.; Voit, B. Non-reactive and reactive block copolymers for toughening of UV-cured epoxy coating. Prog. Org. Coat. 2015, 85 (Suppl. C), 178–188. [Google Scholar] [CrossRef]
- Gabbott, P. Principles and Applications of Thermal Analysis; John Wiley & Sons: Hoboken, NJ, USA, 2008. [Google Scholar]
- Karger-Kocsis, J.; Gryshchuk, O.; Jost, N. Toughness response of vinylester/epoxy-based thermosets of interpenetrating network structure as a function of the epoxy resin formulation: Effects of the cyclohexylene linkage. J. Appl. Polym. Sci. 2003, 88, 2124–2131. [Google Scholar] [CrossRef]
- Fu, J.F.; Shi, L.Y.; Yuan, S.; Zhong, Q.D.; Zhang, D.S.; Chen, Y.; Wu, J. Morphology, toughness mechanism, and thermal properties of hyperbranched epoxy modified diglycidyl ether of bisphenol A (DGEBA) interpenetrating polymer networks. Polym. Adv. Technol. 2008, 19, 1597–1607. [Google Scholar] [CrossRef]
Figure 1.
(A,B) Three dimensional (3D) printed complex samples of the Hexanediol diacrylate 3,4-epoxycyclohexylmethyl-3′,4′-epoxycyclohexyl carboxylate (HDDA-CE) system.
Figure 1.
(A,B) Three dimensional (3D) printed complex samples of the Hexanediol diacrylate 3,4-epoxycyclohexylmethyl-3′,4′-epoxycyclohexyl carboxylate (HDDA-CE) system.

Figure 2.
The differential scanning calorimetry (DSC) plots were obtained from the following samples: sample 75HDDA25CE after visible irradiation (A), sample 75HDDA25CE after UV irradiation (B), and for sample 75HDDA25CE + Glycidyl methacrylate (GMA) after visible irradiation (C). Every sample was submitted to two temperature ramps (from 25 to 250 °C). During the first run, the post-curing was evaluated, while the second run resulted in the Tg being detected.

Figure 3.
(A) Tan Delta dynamic mechanical thermal analysis (DMTA) curves, (B) storage modulus measured by DMTA, and (C) loss modulus.
Figure 3.
(A) Tan Delta dynamic mechanical thermal analysis (DMTA) curves, (B) storage modulus measured by DMTA, and (C) loss modulus.

Figure 4.
Results of Izod impact tests performed on HDDA-CE system samples.

Figure 5.
Field Emission Scanning Electron Microscopy (FESEM) images of fracture surfaces of: (a) 100HDDA, (b) 75HDDA25CE, (c) 75HDDA25CE + 5GMA, and (d) 40HDDA60CE. Scale bar is 200 μm.
Figure 5.
Field Emission Scanning Electron Microscopy (FESEM) images of fracture surfaces of: (a) 100HDDA, (b) 75HDDA25CE, (c) 75HDDA25CE + 5GMA, and (d) 40HDDA60CE. Scale bar is 200 μm.

Figure 6.
Comparison of the shrinkage of the different HDDA-CE formulations after UV-curing.


Table 1.
Composition of HDDA-CE formulations and object irradiation times.
| HDDA-CE Formulations | HDDA (% mol) | CE (% mol) | GMA (% mol) | PIr (% wt of the Acrylates) | PIc (% wt of the Epoxyde) | Dye (% wt) | Irradiation Time (s/layer) |
|---|---|---|---|---|---|---|---|
| 100HDDA | 100 | 0 | 0 | 2 | 2 | 0.2 | 1.3 |
| 75HDDA25CE | 75 | 25 | 0 | 2 | 2 | 0.2 | 1.3 |
| 75HDDA25CE + 5GMA | 75 | 25 | 5 | 2 | 2 | 0.2 | 1.8 |
| 75HDDA25CE + 10GMA | 75 | 25 | 10 | 2 | 2 | 0.2 | 1.8 |
| 50HDDA50CE | 50 | 50 | 0 | 2 | 2 | 0.2 | 1.5 |
| 40HDDA60CE | 40 | 60 | 0 | 2 | 2 | 0.2 | 1.5 |
Table 2.
Table resuming the results that were obtained from different tests. Infrared spectroscopy (FT-IR) analysis: acrylic and epoxy conversion after visible and visible + UV irradiation; dynamic mechanical thermal analyses (DMTAs: glass transition temperature (Tg) set as maximum of tanδ curve, full width at half maximum of tanδ curve (FWMH), damping of tanδ curve); and Young’s modulus from tensile tests.
| Formulations | Visible Light (30 s) | UV Light (5 min) | DMTA Tests | Tensile Test | |||||||
|---|---|---|---|---|---|---|---|---|---|---|---|
| Acrylic Conv. (%) | Epoxy Conv. (%) | Acrylic Conv. (%) | Epoxy Conv. (%) | Tg (°C) | FWHM (%) | Damping | Young’s Modulus (MPa) | ||||
| 100HDDA | 76 | / | 97 | / | 75.5 | 71.7 | 0.08 | 490 | |||
| 75HDDA25CE | 91 | 45 | 93.5 | 73 | 82.6 | 72.1 | 0.08 | 103 | |||
| 75HDDA25CE + 5GMA | 88 | 36 | 93.7 | 69 | 66.5 | 81.3 | 0.26 | 109 | |||
| 75HDDA25CE + 10GMA | 89 | 37 | 90.8 | 75 | 57.3 | 59.3 | 0.16 | 136 | |||
| 50HDDA50CE | 89 | 0 | 99.9 | 90 | 65 | 100 | 47.7 | 42 | 0.21 | 0.2 | 45 |
| 40HDDA60CE | 91 | 0 | 99.6 | 99.9 | 53.7 | 108.6 | 53.1 | 41.8 | 0.38 | 0.24 | 57 |
© 2018 by the authors. Licensee MDPI, Basel, Switzerland. This article is an open access article distributed under the terms and conditions of the Creative Commons Attribution (CC BY) license (http://creativecommons.org/licenses/by/4.0/).
Share and Cite
MDPI and ACS Style
Lantean, S.; Roppolo, I.; Sangermano, M.; Pirri, C.F.; Chiappone, A. Development of New Hybrid Acrylic/Epoxy DLP-3D Printable Materials. Inventions 2018, 3, 29. https://doi.org/10.3390/inventions3020029
AMA Style
Lantean S, Roppolo I, Sangermano M, Pirri CF, Chiappone A. Development of New Hybrid Acrylic/Epoxy DLP-3D Printable Materials. Inventions. 2018; 3(2):29. https://doi.org/10.3390/inventions3020029
Chicago/Turabian StyleLantean, Simone, Ignazio Roppolo, Marco Sangermano, Candido Fabrizio Pirri, and Annalisa Chiappone. 2018. "Development of New Hybrid Acrylic/Epoxy DLP-3D Printable Materials" Inventions 3, no. 2: 29. https://doi.org/10.3390/inventions3020029