1. Introduction
Continuous population growth coupled with world economic development are increasing the Primary Energy (PE) consumption at a rate of +1.6% per year [
1]. A fact that implies an ever-increasing energy demand that needs to be fulfilled with cheap, reliable, and storable energy sources: typical traits of fossil fuels. Currently, 85% of the world PE consumption is met by non-renewable energy sources [
1], but this percentage needs to be rapidly reduced in favor of Renewable Energy Sources (RES) in order to fight climate change, biodiversity loss, and global warming. In this regard, the International Renewable Energy Agency (IRENA) estimates that the RES share in final energy consumption needs to increase from the 19% registered in 2017 to 65% by 2050 to achieve the 2 °C climate target [
2]. Therefore, in the upcoming years, it is expected a massive RES trend of growth. However, the wide RES spread can be accomplished only if the international bodies set binding targets and develop favorable energy policies. Actions that have already proven their effectiveness in the European Union (EU). Indeed, the EU member states were the trailblazer on the promotion of energy from RES since 2009. In fact, the first Renewable Energy Directive [
3] required the EU to fulfill at least 20% of its total energy needs with RES by 2020, while the December 2018 recast established a binding target of at least 32% for 2030 [
4]. Goals that need to be met through the attainment of individual national targets in turn achievable through energy policy also comprising support schemes.
Thanks to these actions, the EU primary energy consumption decreased from 1823.9 Mtoe to 1689.2 Mtoe in the period 2007–2017, while CO
2 emissions drooped down of 9.4% in the same decade [
1]. Results that repay the investments demonstrate the RES potential and force other countries to invest in RES. Indeed, in 2018, under the push of large worldwide investments (approximately
$280 billion), RES grew rapidly (the 70% of power additions were of renewable origin) and achieved a considerable coverage of the world PE consumption (10.4%). Within this framework, the highest growth rate in installed capacity was recorded by solar (+47%) and wind (+21%). Therefore, the widespread availability in conjunction with the great potential is pushing solar PhotoVoltaic (PV) installations worldwide. However, despite the capability of producing electricity in an eco-friendly way, PV plants presents three main drawbacks: (i) a production hard to forecast, (ii) large power fluctuations from second to month time base, and (iii) poor energy conversion efficiency.
The latter stems from the fact that a PV cell can absorb approximately 80% of the incident solar radiation, but only a small part of that is converted into electricity and the conversion efficiency depends on the PV cell manufacturing technology. On lab-scale, mono-crystalline cell efficiency reached the 26.7%, multi-crystalline Silicon (Si) wafer-based technology achieved 22.3%, thin-film technology based on Copper Indium Gallium (di)Selenide (CIGS) attained 22.9%, while Cadmium Telluride (CdTe) solar cells accomplished 21.0%. Again with reference to lab-scale test, the best performing mono-crystalline Si-based module reached an efficiency of 24.4%, while modules adopting high concentration multi-junction solar cells achieved 46.0% [
5]. On the market, the highest recorded energy conversion efficiency is equal to 25.6%, and it was reached by the HIT PV panel [
6] while available amorphous silicon, thin-film (CdTe), and CIGS modules can achieve efficiency in the range of 6 to 12% depending on the manufacturing technology [
7].
Leaving aside the lab records, it is essential to highlight that the 90% of the generated PV electricity comes from Si-based PV technologies (mono- and poli-Si-based technology) characterized by an average efficiency ranging from 10 to 15% [
8]. Technologies mostly installed although featured by low efficiency as characterized by low module price: 0.20
$ W
−1 for Si-mono and 17
$ W
−1 for Si-multi [
9].
Now, after the context clarification, it is clear that the PV module efficiency is poor; so, there is the need to identify the causes and the possible ways to improve it.
As clearly presented by Hasanuzzaman et al. [
10], the PV system operates in a paradox because it needs sunlight as input to generate electrical energy but the sunlight increases its operating temperature; a fact that determines a performance degradation. In a nutshell, due to thermal drift, the higher the PV operating temperature, the lower the PV conversion efficiency. As said, the cell efficiency is affected by the cell material and its operating temperature but also by solar irradiance, humidity, dust accumulation, and shading [
11].
Based on the available literature (see, e.g., in [
11]), the rise of the cell temperature increases the circuit current (0.06–0.1% °C
−1) but causes cell open-circuit voltage reduction (2.0 ÷ 2.3 mV °C
−1) and curtailment of both fill factor and power output within the range 0.1 ÷ 0.2% °C
−1 and 0.4 ÷ 0.5% °C
−1, respectively. Besides, the temperature increment generates irreversible damage to cell constituting materials and efficiency drop. In particular, the already modest PV technology efficiency is further reduced by 0.25 ÷ 0.5% every 1 °C temperature increment. Therefore, it is crucial to develop systematic approaches to improve PV modules efficiency and generated power. In practice, to pursue the goal, only two paths are viable:
Develop PV cells whose efficiency does not suffer from temperature variations. This solution required high investment in research activities and a long time. Furthermore, to improve the efficiency of the country’s PV-based generation park, the in-operation modules need to be substituted by the most efficient ones. A risky transition due to the high costs and long required time.
Develop technologies able to control the module temperature. In this manner, with a modest level of investment and amount of time, high-performance PV cooling systems can be developed and installed. A rapid and cost-effective switch-over that can boost the share of PV generation.
Considering that, at the end of 2019, the global cumulative installed PV capacity reached about 627 GW and, in the same year, the global PV capacity additions hit 115 GW, there is the need of a system applicable not only in new installations, but also on the existing ones; a feature proper of the PV cooling systems.
To this purpose, the authors developed and tested the so-called “Turbomachinery and Energy Systems group Spraying Cooling System” (TES-SCS). The TES-SCS is a low-cost, lightweight, and high-performance active cooling system applicable to both new and in-operation PV plants without extensive modification of the module’s architecture. A series of nozzles, initially designed for garden irrigation, are anchored on the aluminum top edge of the PV module allowing to cool the panel front surface with an intermittent or a continuous water film. Thus, the TES-SCS system can be included among the active cooling systems employing water as cooling medium.
To enhance the module performance, reduce panel degradation, improve the self-cleaning effect, maximize the system lifetime, and guarantee the sustainable use of water, the authors evaluate (i) the nozzles’ geometry, number, and position; (ii) the sprinkled water mass flow rate; (iii) the module’s temperature and water distribution; (iv) the limestone and hot spots formation; (v) the management strategy; and (vi) the system costs. To achieve these goals, the cooling system behavior is studied in an indoor lab, under irradiance and ambient conditions defined by the operator and approximately constant during the tests. The PV module temperature distribution, the air and water temperature, the generated power, as well as the spraying management system are monitored and controlled using an in-house acquisition and control unit. The testing facility also allows to evaluate water film distribution and losses along with the module’s edges, self-cleaning effects, limestone formation and thermal shock on the module’s glass, and cooling system installability and maintainability.
Starting from the experimental campaign and based on the obtained results, the authors evaluate the techno-economic feasibility of installing the TES-SCS on an upcoming 1 MW floating-PV facility.
Floating-PV systems, especially on unused bodies of water is considered an up-and-coming technology because it (i) does not take up valuable space on land, (ii) diminishes civil works, (iii) lowers shading, (iv) minimizes the water evaporation, (v) reduces algal blooming, (vi) improves water quality, and (vii) makes water-based PV cooling more feasible.
The paper is organized as follows. In
Section 2, the available and in-developing cooling technologies are presented and their features discussed. The measurement equipment adopted during the experimental campaign is presented in
Section 3, while
Section 4 describes the test rig architecture and the characteristics of the 1 MW floating PV facility.
Section 5 reports the main outcomes of the experimental investigation as well as the computations performed to evaluate the techno-economic applicability of the TES-SCS to a 1 MW floating plant. Finally, in
Section 6, concluding remarks are given.
2. Cooling System Technologies
PV cooling is, actually, the most effective way to modules’ thermal management especially in the case of in-operation plants where the PV constituent materials and manufacturing technology are fixed. A cooling system is not able to reduce the module’s temperature and boost its production and efficiency because it also needs to be easy to mount, maintain, and manage as well as not creating shading. The cooling apparatus must also have a long life and cannot employ flammable and explosive fluids as well as materials with high environmental impact. It must consume less energy than the one produced by the module thanks for its addition and has to provide a uniform cooling as well as fostering the self-cleaning effect. Based on the researchers’ experience, the cooling systems cannot deteriorate the module’s front glass optical properties or give origin to thermal shocks. Finally, it needs to be cost-effective and recyclable at the end of its life.
With the aim of developing cooling units able to fulfill the highest number of these requirements, along the years, several research groups proposed more or less feasible, efficient, reliable, and cost-effective PV cooling configurations.
The PV cooling techniques can be classified based on the requirement for an external source of power to function. In this manner, active and passive cooling can be identified. Active cooling systems require an energy input from an external source of power to fed devices like fans or pumps devoted to the motion of the cooling medium. By contrast, passive cooling systems do not require additional power to operate; therefore, they are simpler to manage. Obviously, the two ways of cooling can be bound together in a combined active-passive cooling system.
A different way to categorize the cooling techniques relies on the cooling medium. In fact, they can be distinguished as water-, air-, refrigerant-, and Phase Change Material (PCM)-based cooling methods. Besides, they can be ranked also on the basis of their heat removal capacity as suggested by Maleki et al. [
11]. The latter classification makes a distinction among air, liquid, passive, and phase change cooling. By the way, these two types of classifications are less effective than the first one because there are both active and passive cooling systems which use water or air as cooling medium or air cooling systems which adopt a combination of active-passive cooling techniques. Therefore, in the following, the cooling systems are presented by adopting the distinction between passive and active cooling techniques being the most effective and well-established classification method [
7,
10]. Note that, in literature, for both classes, there are numerical and experimental investigations.
Passive cooling systems do not require an additional source of power to operate. Therefore, compared to active cooling, their structure is simpler; a fact which reduces the investment, operating, and maintenance costs. However, the absence of a mechanical device which forces the cooling medium and, subsequently, boosts the heat transfer (mainly forced convection) determines a lower heat rejection which in turn results in a lower temperature reduction and, subsequently, in a modest efficiency improvement [
10].
Among passive cooling techniques, the methods involving air as a cooling medium were the first to be investigated. The module is cooled by radiation and free convection. Usually, air natural convection over and under the PV panel or air natural circulation only on the front or in the rear module’s surface are the easiest, less effective, and time-consuming cooling process. For these reasons, and with the aim of improving the heat rejection without adding mechanical equipments which consume energy and increase the investment and operating costs, several other passive systems have been developed and tested. In the following, some examples are presented and their performances discussed.
Sandberg and Moshfegh [
12] and Zhu et al. [
13] focused on passive cooling methods able to boost the electricity production on PV modules integrated in buildings. In particular, Sandberg and Moshfegh [
12] proposed and numerically investigated the performance of a buoyancy-driven cooling air stream for PV integrated in vertical facades, while Zhu et al. [
13] developed a colorless and lucid silicon coat. The method described in [
12] guarantees a redistribution of the heat by radiation within the air gap. The investigation also allows the understanding that the mass flow rate, velocity, and volumetric flow rate follow a power-law relation with the heat input elevated to an exponent of one-third, while the temperature increase between the inlet and outlet results as being proportional to the heat input elevated to two-thirds. The colorless and lucid silicon coat developed by Zhu et al. [
13] is able to collect and, then, radiate the heat into space without interfering with the ability of the cells of collecting the sunlight. The experimental results reveal a temperature reduction of 13 °C which in turn results in a 1% improvement of the overall cell efficiency.
Najafi and Woodbury [
14] presented a thermoelectric cooling system based on the Peltier effects. The performed simulations highlight that, with an ambient temperature of 300 K and a solar irradiation of 1500 W m
−2, the cell temperature reaches 340.15 K, but thanks to the developed cooling system, the temperature can be reduced of 4.35 K which means an extra power of 0.0062 W. Numerical simulations also show that the non-cooled cell temperature can reach 370.29 K when the ambient temperature and the solar irradiation are 300 K and 3000 W m
−2, respectively. However, if the thermoelectric cooling is applied, the cell temperature can be reduced and the power improved of 0.1866 W.
Ebrahimi et al. [
15] experimentally tested the performance improvements achievable using natural vapor as coolant. In practice, the natural vapor is used as heat transfer fluid to enhance the electrical production and it is applicable from large to building integrated PV modules. However, to apply the method, there is the need of installing the PV facility in a place where natural vaporization exists; this means near lakes, rivers, canals, etc. Despite this not meaningful requirement, the experimental measurements reveal that the best performance can be reached at high natural vapor flow rate (5 gr min
−1), low natural vapor temperature (18 °C), and with eight outlets.
Another interesting passive cooling method has been developed by Chandrasekar et al. [
16]. They attached a cotton wick at the back side of the PV panel and, by means of its capillary structure, three fluids (water, Al
2O
3/water, and CuO/water) were circulated. Results reveal that, compared to the state of non-cooled, a 30%, 17%, and 11% reduction of the module’s temperature can be obtained using water, Al
2O
3/water, and CuO/water, respectively. In a later study, the same research group proposed another type of passive thermal management system employing again cotton wick but combined with heat spreaders [
17]. The system guarantees to reduce the module’s temperature by 12% which in turn results in a 14% improvement of the electrical yield.
Drabiniok and Neyer [
18] developed a bionic cooling system which emulates the water transport mechanism of trees and the mechanism of human perspiration; the system was named “microporous evaporation foils”. The cooling effect is self-driven by solar energy after being started and does not require any extra energy input or mechanical devices to operate. Based on the performed tests under calm air, a temperature reduction up to 11.7 °C can be reached.
Higher cooling performance can be obtained applying PCMs or heat pipes. In fact, PCMs absorb the excess thermal energy of the cell as latent heat of fusion, while heat pipes are two-phase thermal transfer devices able to exploit high phase change latent enthalpy. Both of them are receiving great attention from researchers due to their ability of drastically reducing the panel’s temperature. As stated by Stritih et al. [
19], the adoption of the RT28HC PCM can decrease the module’s temperature up to 35.6 °C while the application of filled heat pipe [
20] and pulsating heat pipe [
21] can shrink the temperature of the cell of approximately 38 °C and boots the generated electricity of 18%. Despite the demonstrated high cooling efficiency, the deployment of PCMs and heat pipes is limited, respectively, by the high cost and the sensitivity to tilt angle. However, for more details see, e.g., in [
22].
Based on the above-mentioned literature survey, it is clear that cost-effective passive cooling systems can achieve temperature reduction in the range of 6 to 20 °C, which in turn results in electrical efficiency improvement up to 15.5%. By the way, the limited performance improvements are compensated by the simplicity of the system structure and its easy way to manage; features hard to find in active cooling systems. In fact, an active cooling requires additional devices like pumps or fans to force the cooling medium flow. Therefore, the system architecture becomes complex, hard to manage, costliest, and, in certain cases, less-beneficial than expected due to the high energy consumption. However, despite the need of additional devices and power, it is undeniable that active cooling systems need to be investigated because they guarantee better thermal management thanks to the higher capability of rejecting heat.
Basically, active cooling can be sub-classified based on the fluid state; so, the systems can employ a liquid or a gaseous medium as well as a combination of them. At the time of writing, the only adopted gaseous medium is air. Therefore, active cooling can be air-, liquid-, or gas-liquid- based cooling systems. Note that, in all cases, the heat transfer fluid can be used for thermal purposes; this means implementing the so called “PhotoVoltaic Thermal (PVT) collector” or “photovoltaic thermal hybrid system”; a structure that guarantees improving the overall system efficiency, but which requires, at the same time, a thermal user to efficiently use the removed heat from the PV. Therefore, the PVT system is a very interesting and promising cooling method which can play a key role in domestic applications while it is less applicable to large-scale PV facilities due to the absence of thermal users. For more details on system future development see, e.g., in [
23].
Obviously, in the following literature survey, some of the proposed methods envisage the use of the removed heat by a thermal user. Therefore, also the thermal efficiency is computed. However, it is the authors’ aim to develop a cooling system primarily installable in large scale-PV facilities where thermal users are difficult to find; the focus is only on improving electrical production. Therefore, the literature analysis and its discussion are targeted to temperature reduction, electrical production/efficiency, and, where computed, system cost.
Despite the lower heat carrying capacity and thermal conductivity compared to liquid, air-based active cooling requires minor modifications of the PV architecture, lower investment costs, non air-tight PV covers, and materials without adequate resistance to corrosion. Obviously, to circulate the air, a fan or a series of them are necessary; so, the energy consumption of the mechanical equipments need to be considered during the evaluation of the system techno-economic feasibility. An aspect rarely taken into account in the available works.
As an example, Kumar and Rosen [
24] presented a solar air heater with a double-pass configuration. In practice, the PV module is inserted in a box which first cools the front side and, then, the rear side of the panel. The influence on the heat extraction of vertically attached fins on the back module’s surface is also evaluated. Results demonstrate that fins extend the heat transfer area and help in the cell temperature reduction; in the analyzed case from 82 to 66 °C. Furthermore, Tonui and Tripanagnostopoulos [
25] developed a system configuration in which the panel is cooled by a forced air flow, but, contrary to the work in [
24], only the rear side of the panel is cooled. The geometrical parameters of the channel and the addition of fins are deeply investigated in the study to understand their influence on cooling performance and pressure drop. Numerical and experimental outcomes reveal that thin flat metal sheet suspended at the middle of the air channel or finned back wall are configurations that allow the best cooling performance.
The effect of the geometrical parameters on the cooling performance is investigated also in Kasaeian et al. [
26]. In particular, the study shows that decreasing the channel depth slightly improves the electrical efficiency: from 12 to 12.4%.
In contrast to previous works, Shahsavar and Ameri [
27] investigated the influence of fans number (two, four, and eight fans) on the heat extraction. They concluded that, for each operating condition, there is an optimum number of fans which allows achieving the maximum electrical efficiency. Obviously, in the literature, several other works investigate air-based active cooling systems. However, in a nutshell, all of them reveal that the obtainable improvements in terms of electrical efficiency and power ratio are poor (approximately 7–9% and 6–8%, respectively) but still higher than the ones achievable with passive air cooling techniques. On the other side, the best performance can be achieved with liquid active cooling; systems which mainly adopt water as coolant. The ability of reducing the temperature up to 30 °C (which in turns corresponds to an electrical efficiency improvement up to 22%), increasing the self-cleaning effects and ensuring a longer life to PV modules are the main advantages of liquid active cooling techniques. By contrast, the system complexity, the high investment and operating costs, the water consumption, as well as the possibility of inducing deterioration of the front glass optical properties and/or thermal shock are the main drawbacks of this way of cooling PVs. However, these are also the drivers that are forcing researchers to develop and test new ways of cooling, layouts, fluids, and management strategies.
As an example, Baloch et al. [
28] developed a converging channel heat exchanger and observed an increment of 35.5% and 36.1% in the power output and conversion efficiency, respectively. Rahimi et al. [
29] evaluated the effectiveness of equipping the module with single- or multi-header microchannels with the same hydraulic diameter. They observed that the multi-header layout removes 19% extra heat and allows to increase the power of 28% compared to the single heater configuration.
Anyway, the most straightforward way to cool the module was proposed by Bahaidarah et al. [
30]. The cooling system permits cooling the back surface of the module panel with a water flow rate. Water is sucked by a pump from a water tank, flows from the top to the bottom part of the module and, thanks to a panel attached to the module’s back surface, it cools it before being collected and, if needed, used by a thermal user. The developed system is able to reduce the module’s temperature of about 20% leading to an increase in the panel efficiency by 9%. However, to additionally boost the heat removal, several research groups are investigating the possibility of adding nanofluids to water. For example, Karami and Rahimi [
31] added to water Boehmite nanofluid and compare the cooling performance to the obtainable with water. They found that, for each channel geometry, there is a proper concentration of nanoparticles. In the case of straight and helical channels, water with Boehmite nanofluid improves the electrical efficiency up to 37.67% compared to pure water. Xu and Kleinstreuer [
32] added alumina to water and, again, compare the cooling performance of water with the one obtainable with water plus nanofluids. They found that the performance of alumina/water are higher than the one reachable by pure water. A result confirmed also in a latter study performed by Ebaid et al. [
33]. As obvious, adding nanofluids to water is not the only explored solution. Valeh-e Sheyda et al. [
34] proposed a gas–liquid active cooling system in which air and water are used as two-phase fluid. This cooling technique led to increase the generated electricity up to 38%.
Despite the achievable cooling performance which in turn results in an improvement of the generated electricity, the above-mentioned liquid active cooling systems require complex structures which need to be assembled on the module. Thus, extensive modifications of the module’s structure need to be put in place.
To solve this issue, researchers look to liquid immersion. Mehrotra et al. [
35] proposed to immerse the modules in flowing water, while Sun et al. [
36] preferred to use dimethyl silicon oil as heat dissipation fluid. The focus is on the height of the fluid layer which engulfs and bathes the module’s front surface and on the liquid flow velocity. Two parameters that need to be optimized to find the best compromise between cooling and solar irradiance availability on the module’s surface. Note that Mehrotra et al. [
35] demonstrate that 1 cm of water over the module front surface can increase the panel efficiency of 17.8% while the efficiency improvement is smaller if the height of the water layer is from 2 to 6 cm. This is an interesting active cooling technique with good cooling and self-cleaning performance, but it can be applied only in the case of large water reservoirs such as lakes, rivers, canals, sea, or even oceans, not a negative feature considering the reduction of lands dedicated to PV facilities allowed by PV modules’ immersion. However, the modules need to be set on floating frames allowing the panels to be underwater (few centimeters are enough); a complex and costly system architecture especially in the case of salty water.
With the aim of mitigating these drawbacks while keeping the high cooling and self-cleaning performance, researchers’ attention has been placed on continuous and intermittent spraying cooling. A technique applicable on the module glass surface or on the rear side or on both surfaces of the panel without extensive modification of the panel’s architecture. As is obvious, the better the water distribution, the higher the cooling efficiency. An aspect linked also to water evaporation which boosts the temperature reduction. However, uniform water distribution can imply high water flow rate which in turn means large water consumption. A non-negligible aspect taken into account only in few works but which needs to become a research priority.
Krauter [
37], Wendelstorf et al. [
38], Abdolzadeh and Ameri [
39], and Odeh and Behnia [
40] were some of the first to develop and test this kind of cooling arrangement. In [
39], the researchers conducted an experimental campaign and observed that spraying water on the module’s front surface reduces the temperature and improves the system optical performance, while Wendelstorf et al. [
38] focused on the computation of the heat transfer coefficient improvement arising from spraying water also on the front side of the module. Contrary, Krauter [
37] and Odeh and Behnia [
40] proposed a water flow from top to bottom and a water trickling configuration, respectively. In the first case, the system seeks to reduce the reflection while, in the second one, the aim is to increase the annual electricity production. Results reveal that water can reduce reflection (2–3.6%) and temperature (−22 °C) compared to a non-cooled module as well as improving the electrical production [
37]. A result confirmed also in [
40] where the annual delivered energy is improved by the water trickling configuration of 5%.
Later on, Moharram et al. [
41] investigated the positive effects on cooling rate arising from spraying water using nozzles installed at the upper side of the module. Results show that the system guarantees to cool and clean the panel with a maximum cooling rate of 2 °C per minute. Rodgers and Eveloy [
42] developed an intermittent water cooling with sun tracking able to improve the electrical power of 40% and 23% depending on whether water is used (chilled or not). Smith et al. [
43] proposed a continuous and uniform film of water over the surface of the solar panel and evaluated its influence on the temperature reduction. The experiments underline that a module temperature reduction from 55 to 40 °C can be achieved as well as the increase in the energy output deriving from the cooling is more than sufficient to compensate the pump energy need.
By the way, it is from 2015 that the investigations on water spraying cooling have risen considerably; a fact linked to the large development of PV installations all around the world. Thus, in the following, only the more relevant works investigating the continuous or intermittent spraying cooling systems, are discussed.
Castanheira et al. [
44] presented a water spray cooling system for utility-scale application. The test bench is an in-operation 20 kW PV park installed on the roof of an industrial building located in Lisbon, Portugal. Therefore, tests are conducted under outdoor conditions and the PVs tilt angle is set equal to 33°. The water cooling system is made by a series of sprinklers mounted on the top edge of the module in order to spread the water along the PV at low pressure and velocity; a condition which guarantees creating a uniform layer of water on the module top surface. However, after cooling the module, the water is collected from the PV bottom edge and stored in a tank creating a close loop because the pump which fed the sprinklers sucks the water from this tank. The measurement of the PV module surface temperature is performed with two sensors placed on the panel. The 5 min average values are considered as PV surface temperature. Note that these two sensors allow estimating the temperature of the entire string of PV panels. Water is sprayed following an ON-OFF mode management strategy for 2 min. Results show that the annual energy production can be boost up to 12% and that the financial payback time is approximately 2 years.
Similarly, Osma-Pinto and Ordónez-Plata [
45] developed and tested a spray cooling system which cools the module front side by means of nozzles design for irrigation applications. The test facility is installed on the green roof of the Universidad Industrial de Santander, Bucaramanga (Colombia). Test are performed under topical climate conditions with an average ambient temperature of 24 °C during the day. PV panels are equipped with two temperature sensors, while twenty cooling regimes are tested. As in [
44], the water is collected and stored in the same tank where the feed pump sucks the water to fed the nozzles. Experiments conducted on the field reveal that the cooling system can enhance the daily energy production up to 10%, but, due to the pump energy consumption, the benefits introduced by the cooling system are significantly reduced. In terms of PV surface temperature, thermograms show a nonuniform temperature distribution of the panel neither before the cooling, nor after spraying the water.
Following the same idea of the previous researchers, Wang et al. [
46] worked to a similar cooling system but the focus was on the system automation. The result is an automatic water cooling system based on the wireless sensor network technology. The PV panel, composed by 60 multi-crystalline 6 inch silicon cells, is equipped with sprinkler positioned on the top edge of the module and fed by a pump which sucks the water from a tank. The cooling occurs on the module’s front surface. The module is located on the roof of the National Taiwan University building and the test are performed from 29 March to 26 July 2016, and from 8 June to 3 July 2017. The module and the sprayed water temperatures are not measured but estimated on the basis of the local weather data. Results show that the system increases the produced energy of 17.75%.
Furthermore, Elnozahy et al. [
47] and Hadipour et al. [
48] developed a spraying cooling system which cools the front surface of the module but in their apparatuses the nozzles are not fixed on the panel top edge. In [
47], the water is sprayed from 16 nozzles mounted on a moving copper pipe to favor cooling and cleaning effects, while in [
48] the nine five-micron nozzles are placed 8 cm from the panel top edge thanks to an external support which imposes to the nozzles an inclination angle equal to the tilt one (30°). In the first study, the experimental campaign is conducted outdoor under Alexandrian (Egypt) climate conditions during a clear day, while, in the second research, the data are acquired on certain days of June 2019 in Semnan, Iran. In [
47], thanks to the movement of the nozzles from the top to the bottom of the panel, the temperature is maintained uniform. The water is stored in a tank near the panel while the surface module’s temperature is measured by four thermocouples: two mounted on the front face and two on the backside. Temperature measurements registered a reduction of the PV front face temperature up to 45.5 °C. This means a decrease of about 45.5% compared to non-cooled situation for the front but, on the rear face, the temperature drop registered a lower value (only a 39%). Despite the temperature drop difference between front and back sides, an increase in efficiency from 9% (non-cooled PV) to 11.7% and a rise in the maximum output power from 68.4 W to 89.4 W are obtained. In [
48], the nine five-micron nozzles are coupled with a pulsed-spray management strategy: a way of managing the cooling system which guarantees to increase the maximum electrical power up to 25.9% compared to non-cooled module as well as saving water. The researchers also found that using pulsed-spray cooling the surface temperature of the panel drops from 57.1 to 26.5 °C; only 1.7 °C more that applying the steady-flow cooling. In addition, pulsed cooling guarantees a reduction of the levelized cost of electricity up to 76.3% compared to steady-spray cooling. Thus, the proposed cooling method can be convenient also from an economic point of view. Cooling the front surface of the module with a continues water flow is a solution explored from both numerical (see, e.g., in [
49]) and experimental (see, e.g., in [
50,
51]) viewpoints. In particular, the tests performed by Sainthiya et al. [
51] during both summer and winter conditions of the city of Jhansi assessed that the cell efficiency can be improved up to 27.3% and 27.6% in winter and summer, respectively, despite the high water consumption.
Contrary to previous investigations, Zilli et al. [
52] proposed to cool polycrystalline photovoltaic modules only on the rear side with a water-cooling sprinkler system. Intermittent cooling, no-cooling and continuous cooling are tested to investigate the performance and the temperature reduction. Note that two J-type thermocouples are used: one for measuring the temperature underneath the panel, and one for the ambient temperature in the shadow of the panel. To avoid water temperature rise, the adduction tube is buried on the ground. The experiments are conducted in Parana (Brazil) under different solar irradiance conditions: low (approximately 700 W m
−2) and high (approximately 1020 W m
−2). Tests on the performance of intermittent cooling are performed on 17 and 18 December 2015, while no-cooling and continuous cooling experiments are run on 4–5 January 2016 and 7–8 January 2016, respectively. The researchers first observed that the increase in irradiation provokes a decrease in the panel temperature. Then, they stated that, at high irradiation level, the cooling system guarantees a 12.26% and 12.17% relative increase in power and efficiency, respectively, while, at low irradiation level, the relative increase is 8.48% for power and 9.09% for efficiency.
These researchers are not the unique to propose a system that cools the rear surface of the module. In fact, Bevilacqua et al. [
53] suggest cooling the back surface to avoid the deterioration of the front glass optical properties as well as thermal shock. They tested three cooling techniques acting on the PV panel back surface and verified that spray cooling is able to reduce the surface temperature up to 26.4 °C during sunny days as well as maintaining a uniform temperature distribution. In a later investigation [
54], they demonstrate that, under Rende city (Calabria, Italy) climate conditions, cooling the rear surface with a spray cooling can boost the monthly energy production up to 8.6% with only 2.78 m
3 of water.
Furthermore, Nižetić et al. [
55] experimentally evaluated the performance of a spray cooling system but, compared to the above-mentioned works, the static nozzles cool both sides of the panel. Referring to front face, 10 nozzles are mounted around the PV perimeter while other 10 nozzles cool the entire backside surface. The cooling and cleaning effects are investigated. The experimental measurements are conducted in Split (Croatia) under Mediterranean climate conditions from 11 a.m. to 2 p.m. in the month of June under a solar irradiance and air temperature ranging between 810 and 850 W m
−2 and 27 and 30 °C, respectively. The water temperature was approximately constant and equal to 17 °C while the setted tilted angle was equal to 17°. Temperature measurements of the panel surface are acquired by means of two sensors mounted, respectively, on the front and rear surface. The proposed cooling system is able to boost the front surface cleaning as well as decreasing the panel temperature from 54 to 24 °C. A temperature reduction that guarantees to achieve a maximal total increment of 16.3% in the electric power output and a 14.1% improve of the electrical efficiency. The conducted feasibility analysis reveals that the developed system is viable using a spraying pressure of 4.8 bar and a maximum water sprayed flow rate of 225 L h
−1.
Later on, the same researchers performed an economic-environmental evaluation of both passive and active cooling techniques [
7,
56] using as test case a 30 kW PV system and cooling technologies presented in the literature by several other researchers. The environmental analysis is based on the Life Cycle Assessment approach, the most accredited assessment method at the international level for the quantification of damage and its outcomes (see, e.g., in [
57,
58]). Results show that, from a technical and economic point of view, the most viable passive cooling system is the one using air as coolant on the backside surface of the PV panel; but, to this surface aluminum fins need to be attached to increase the thermal exchange surface. Despite the high obtainable cooling performance, active cooling methods have proved to be not economically viable. From an environmental viewpoint, air based cooling techniques are the most harmful because they characterized by intense global warming and environmental acidification effect.
The analyzed literature clearly demonstrates that spraying water on the module’s front surface is a very effective cooling method because, compared to rear side cooling, it also guarantees to collect the sprayed water after cooling the panel and boosts the self-cleaning effects. However, during the development of this kind of system, there is the need of a simultaneous evaluation of the following aspects.
The developed cooling system needs to be installable on in-operation large-scale PV facilities placed on the ground or on the water surface (floating applications).
The cooling system needs to be technically and economically feasible. This means an evaluation of cooling system installability, maintainability, weight, investment, and operating cost.
The PV surface temperature needs to be measured in detail under fixed ambient and irradiance conditions.
The influence on cooling performance of the temperature at which water is sprayed needs to be investigated.
The impact on cooling performance, film uniformity and self-cleaning of the nozzles geometry, position, and inclination need to be studied.
The evaluation of front glass deterioration, thermal shock formation and limestone deposition after cooling must be analyzed.
The improvement in the cooling performance due to water self-evaporation needs to be taken into account.
Water and energy consumptions need to be minimized by means an efficient management strategy.
Being in literature almost absent works dealing with the simultaneous evaluation of these aspects, the TES-SCS system has been developed and tested to cover this lack.
4. The Testing Facility and the Floating PV Plant
The testing facility is staged at the University of Padova in the Laboratory of Fluid Machines and Energy Systems of the Department of Industrial Engineering. The facility can accommodate a single PV module or an array of them as well as structures which support moving or stationary cooling nozzles, heat exchangers, etc. Tests can be performed using passive or active cooling methods using both air or water as cooling fluids. When water active cooling systems are tested, the wind effect can be simulated through fans. Therefore, its influence on, e.g., water distribution and film formation can be properly evaluated.
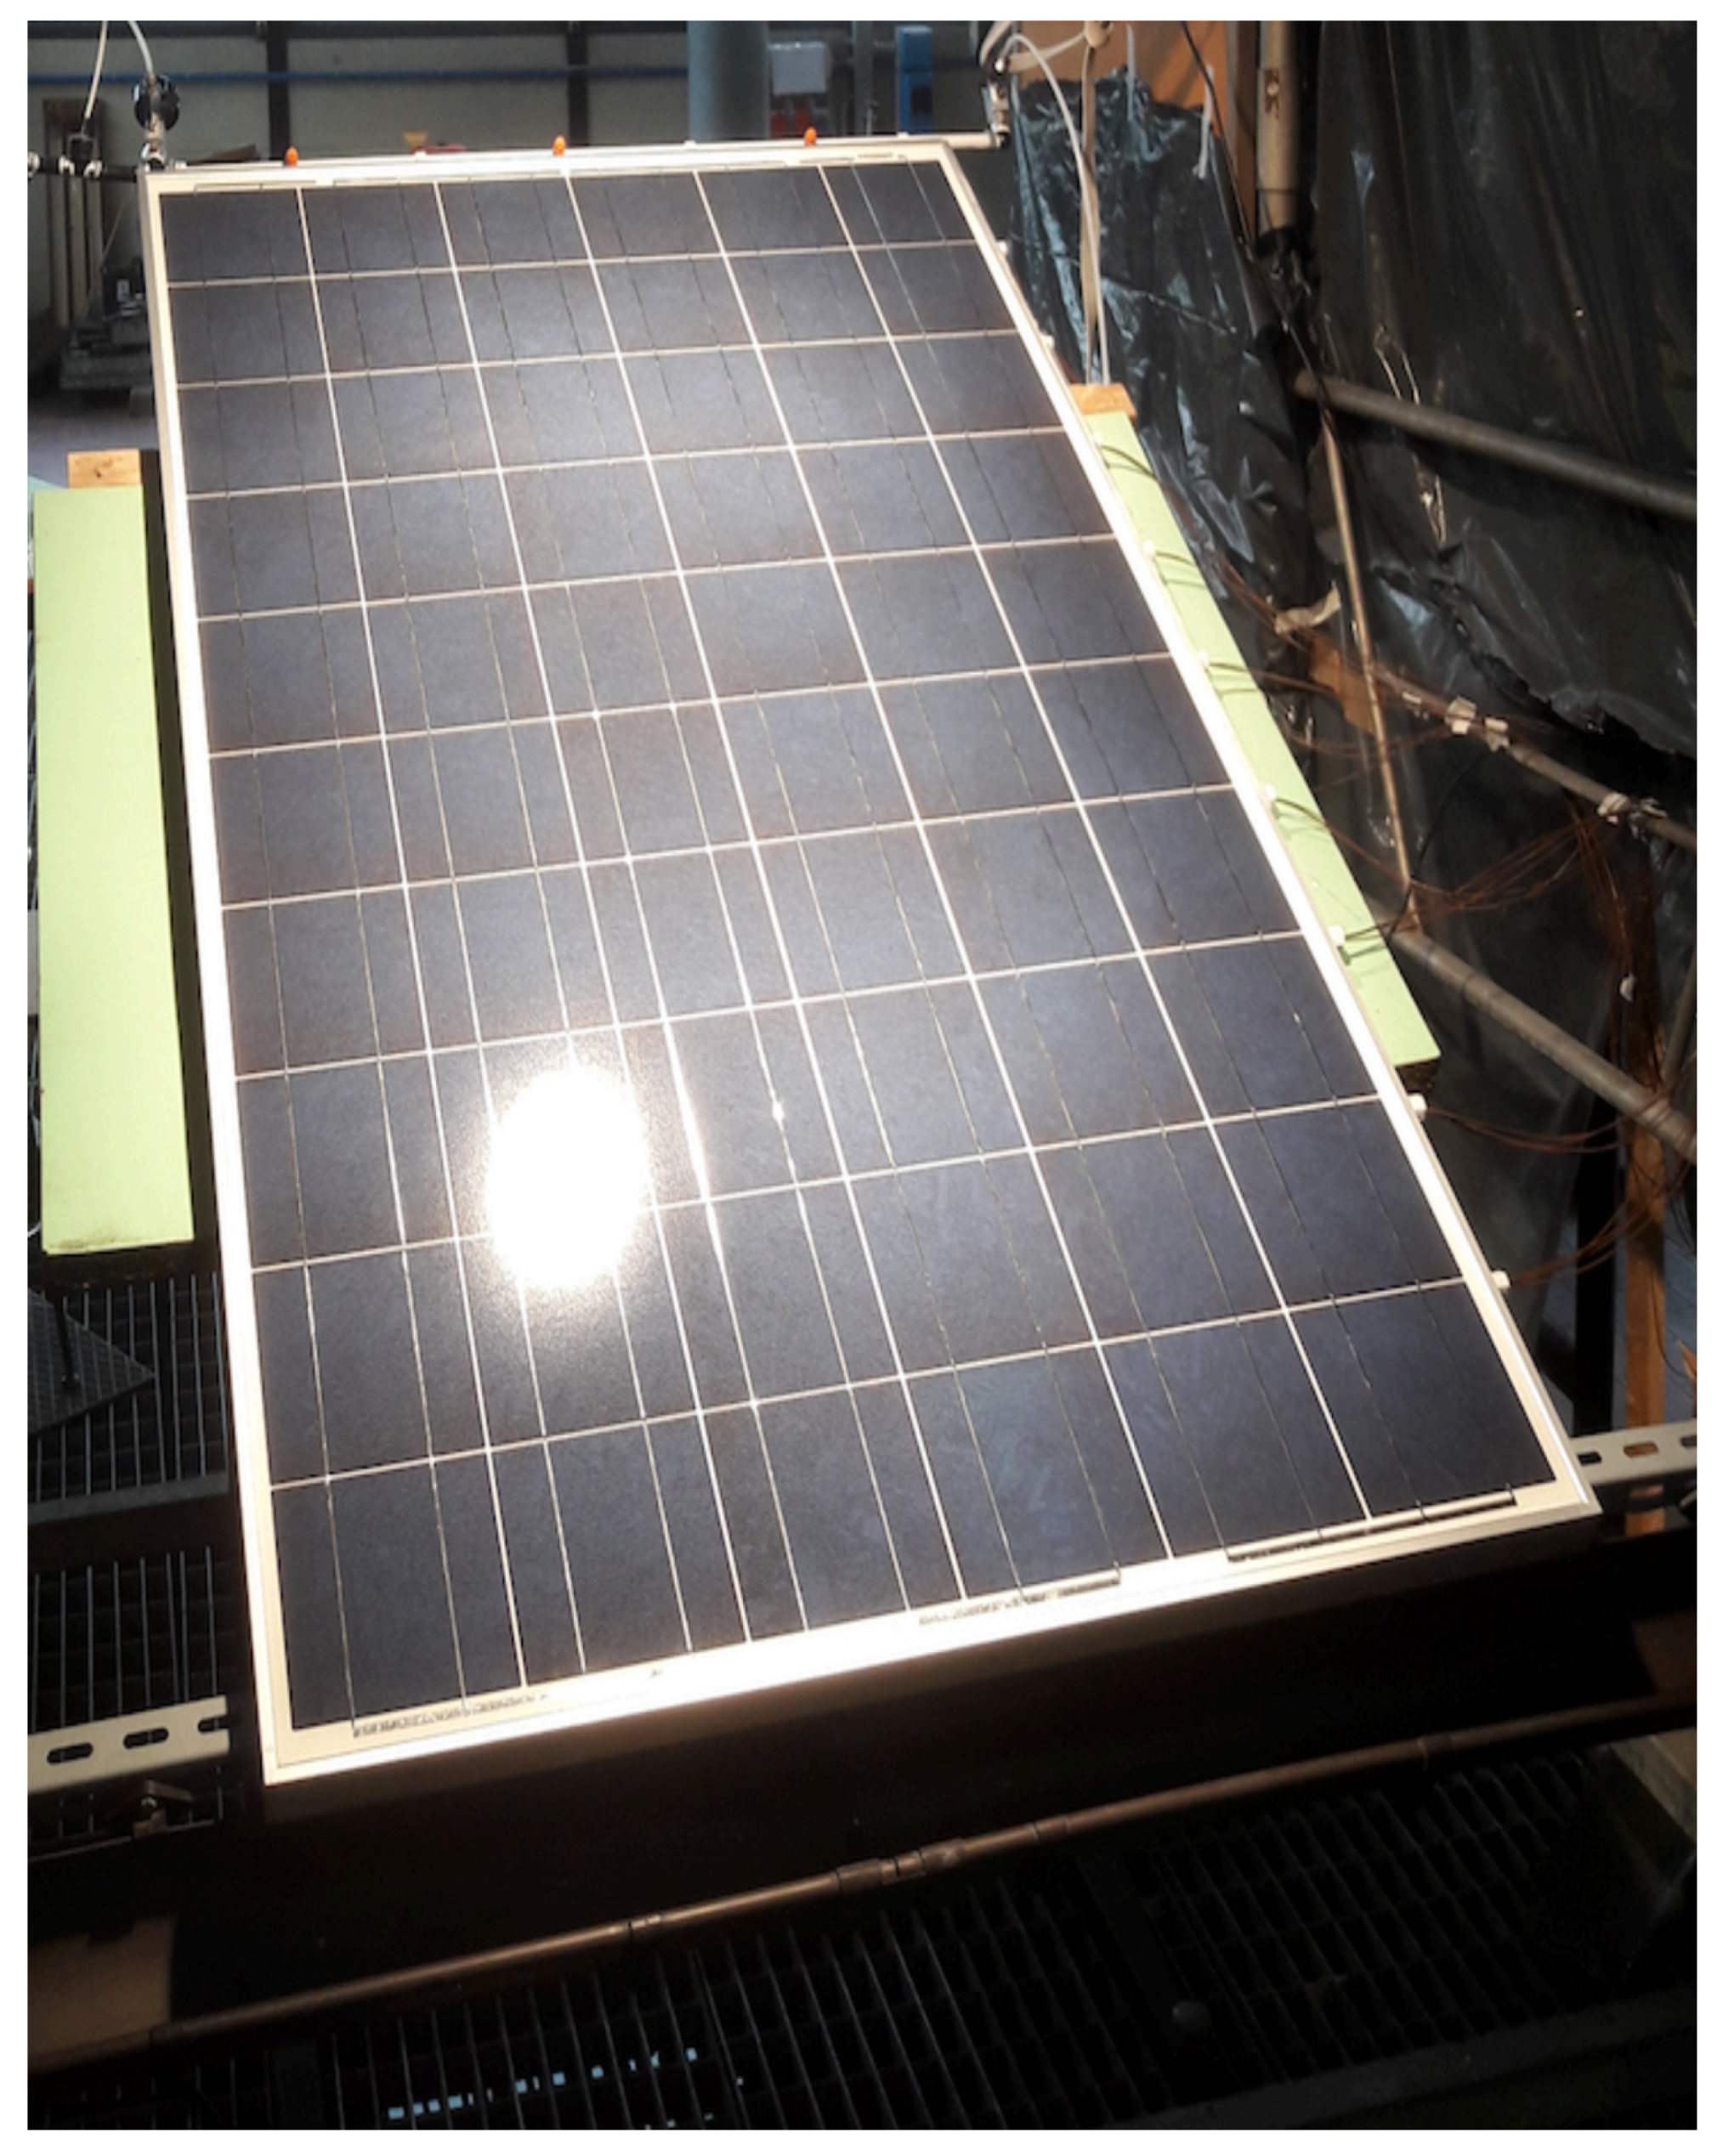
As shown in
Figure 2, the module is installed on a rolling table (the table surface is green-colored), an architecture that allows performing the cooling test at different tilt angles. The tests can be conducted with angles of inclination from 0° (perfectly horizontal) to 90° (perfectly vertical) without disassembling the cooling system and the measurement apparatus from the module. In the ongoing investigation, the PV module tilt angle is set at 30° because it is a conventional angle for Italian installations.
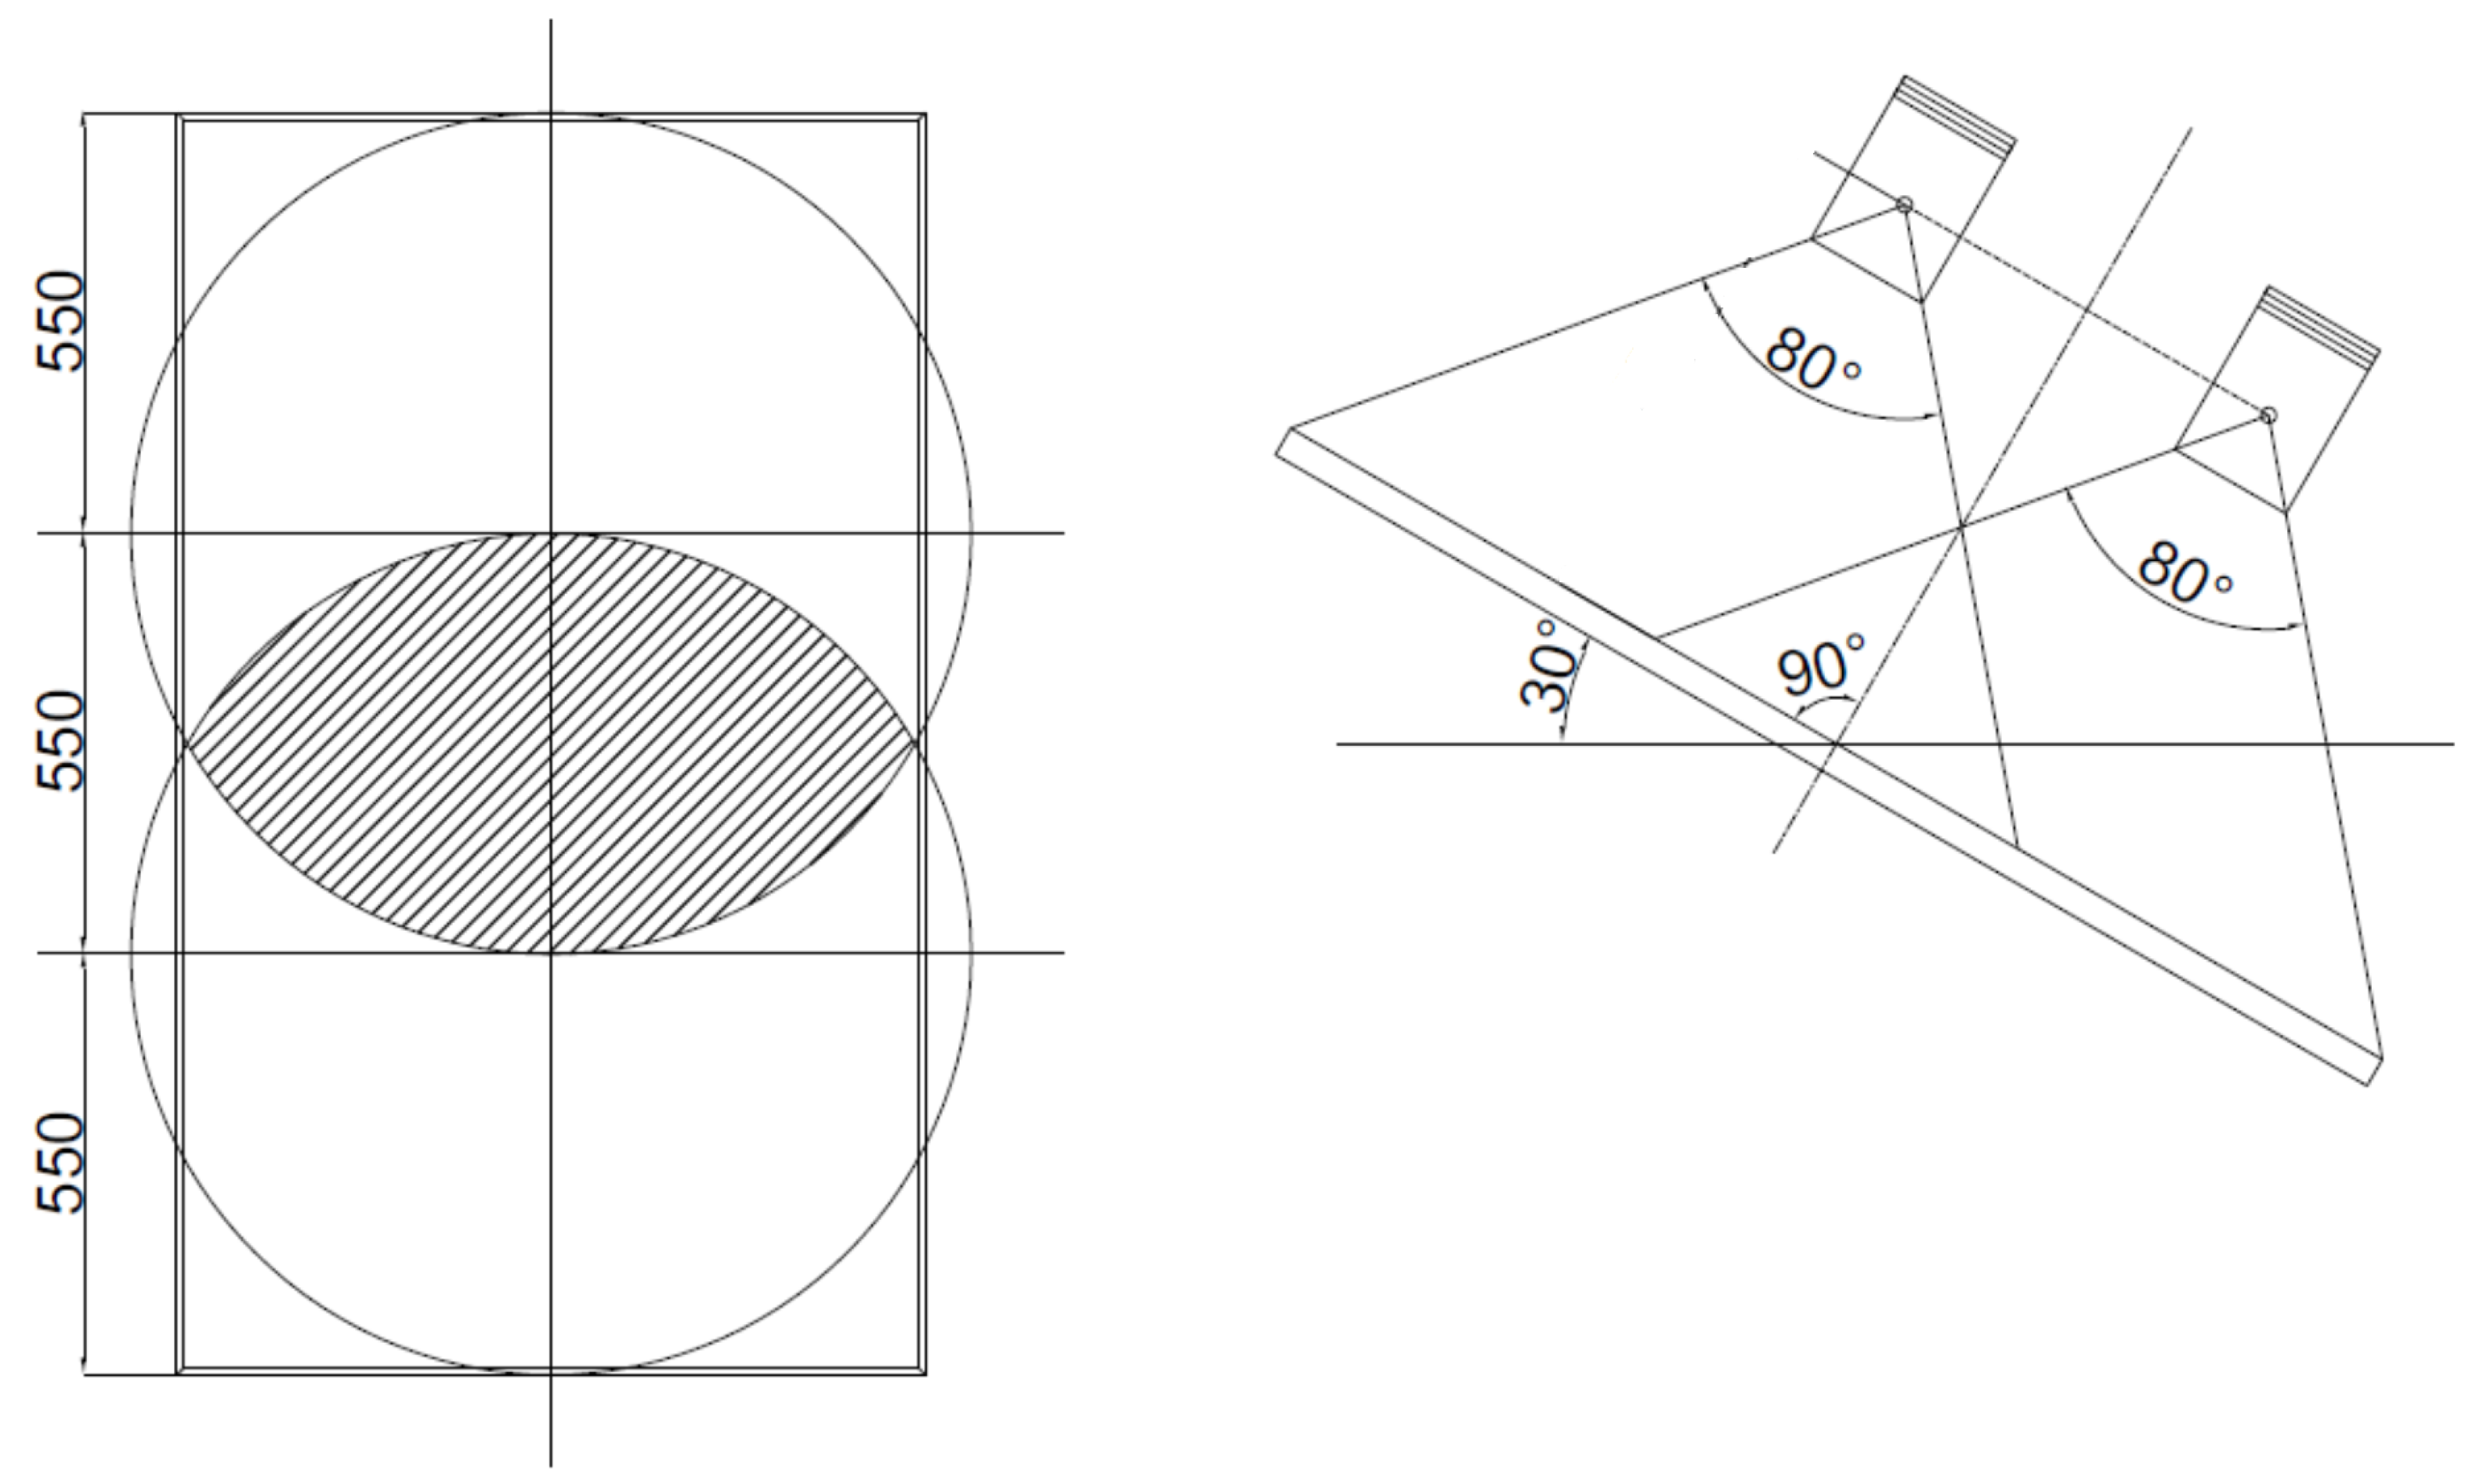
The PV module in placed over a structure which allows to simultaneously protect it from external light and support the halogen lamps. Thanks to this support facility, from one to four lamps can be mounted at different height with respect to the module’s surface to reproduce different solar irradiance conditions. Experiments are performed using 2 lamps installed over the PV module at a distance of 1 m each, as shown in
Figure 3.
Three T-type thermocouples are installed and devoted to air temperature measurements to evaluate the air temperature’s influence in different places of the test facility. The first one is placed between the module and the rolling desk and measures the air temperature under the module. Another temperature sensor is located between the lamps and the PV panel to measure the air temperature increment generated by the light, and it is named . The third thermocouple is placed in an unhindered zone of the lab and measures the undisturbed room temperature.
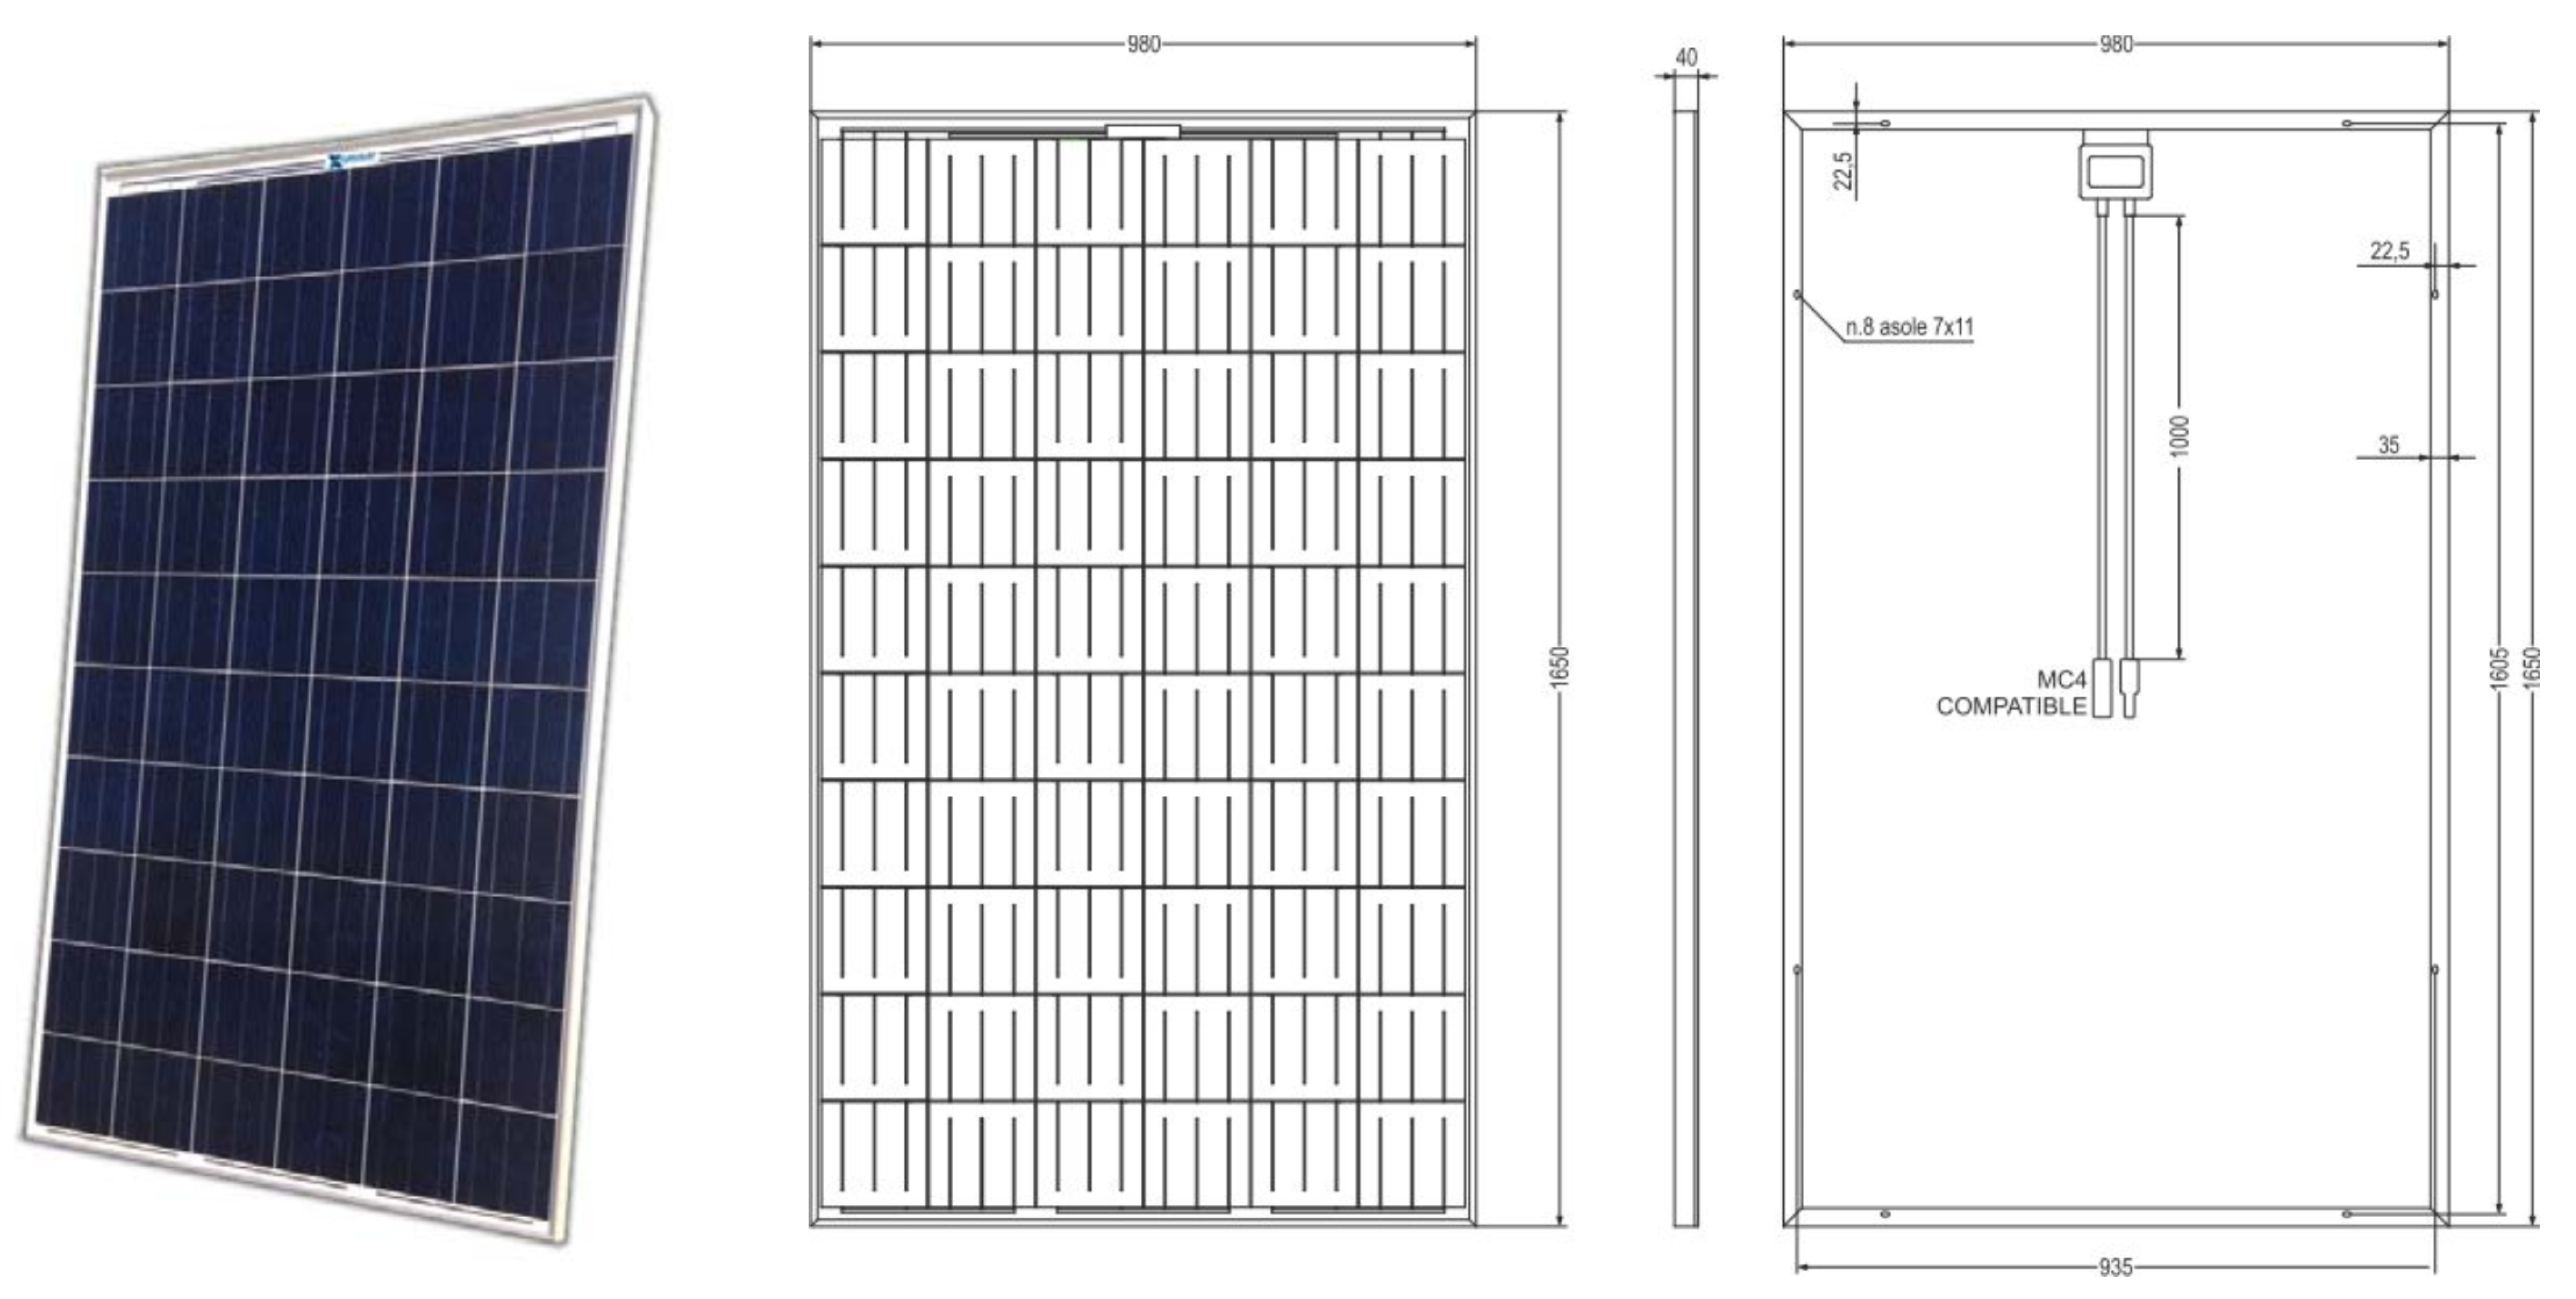
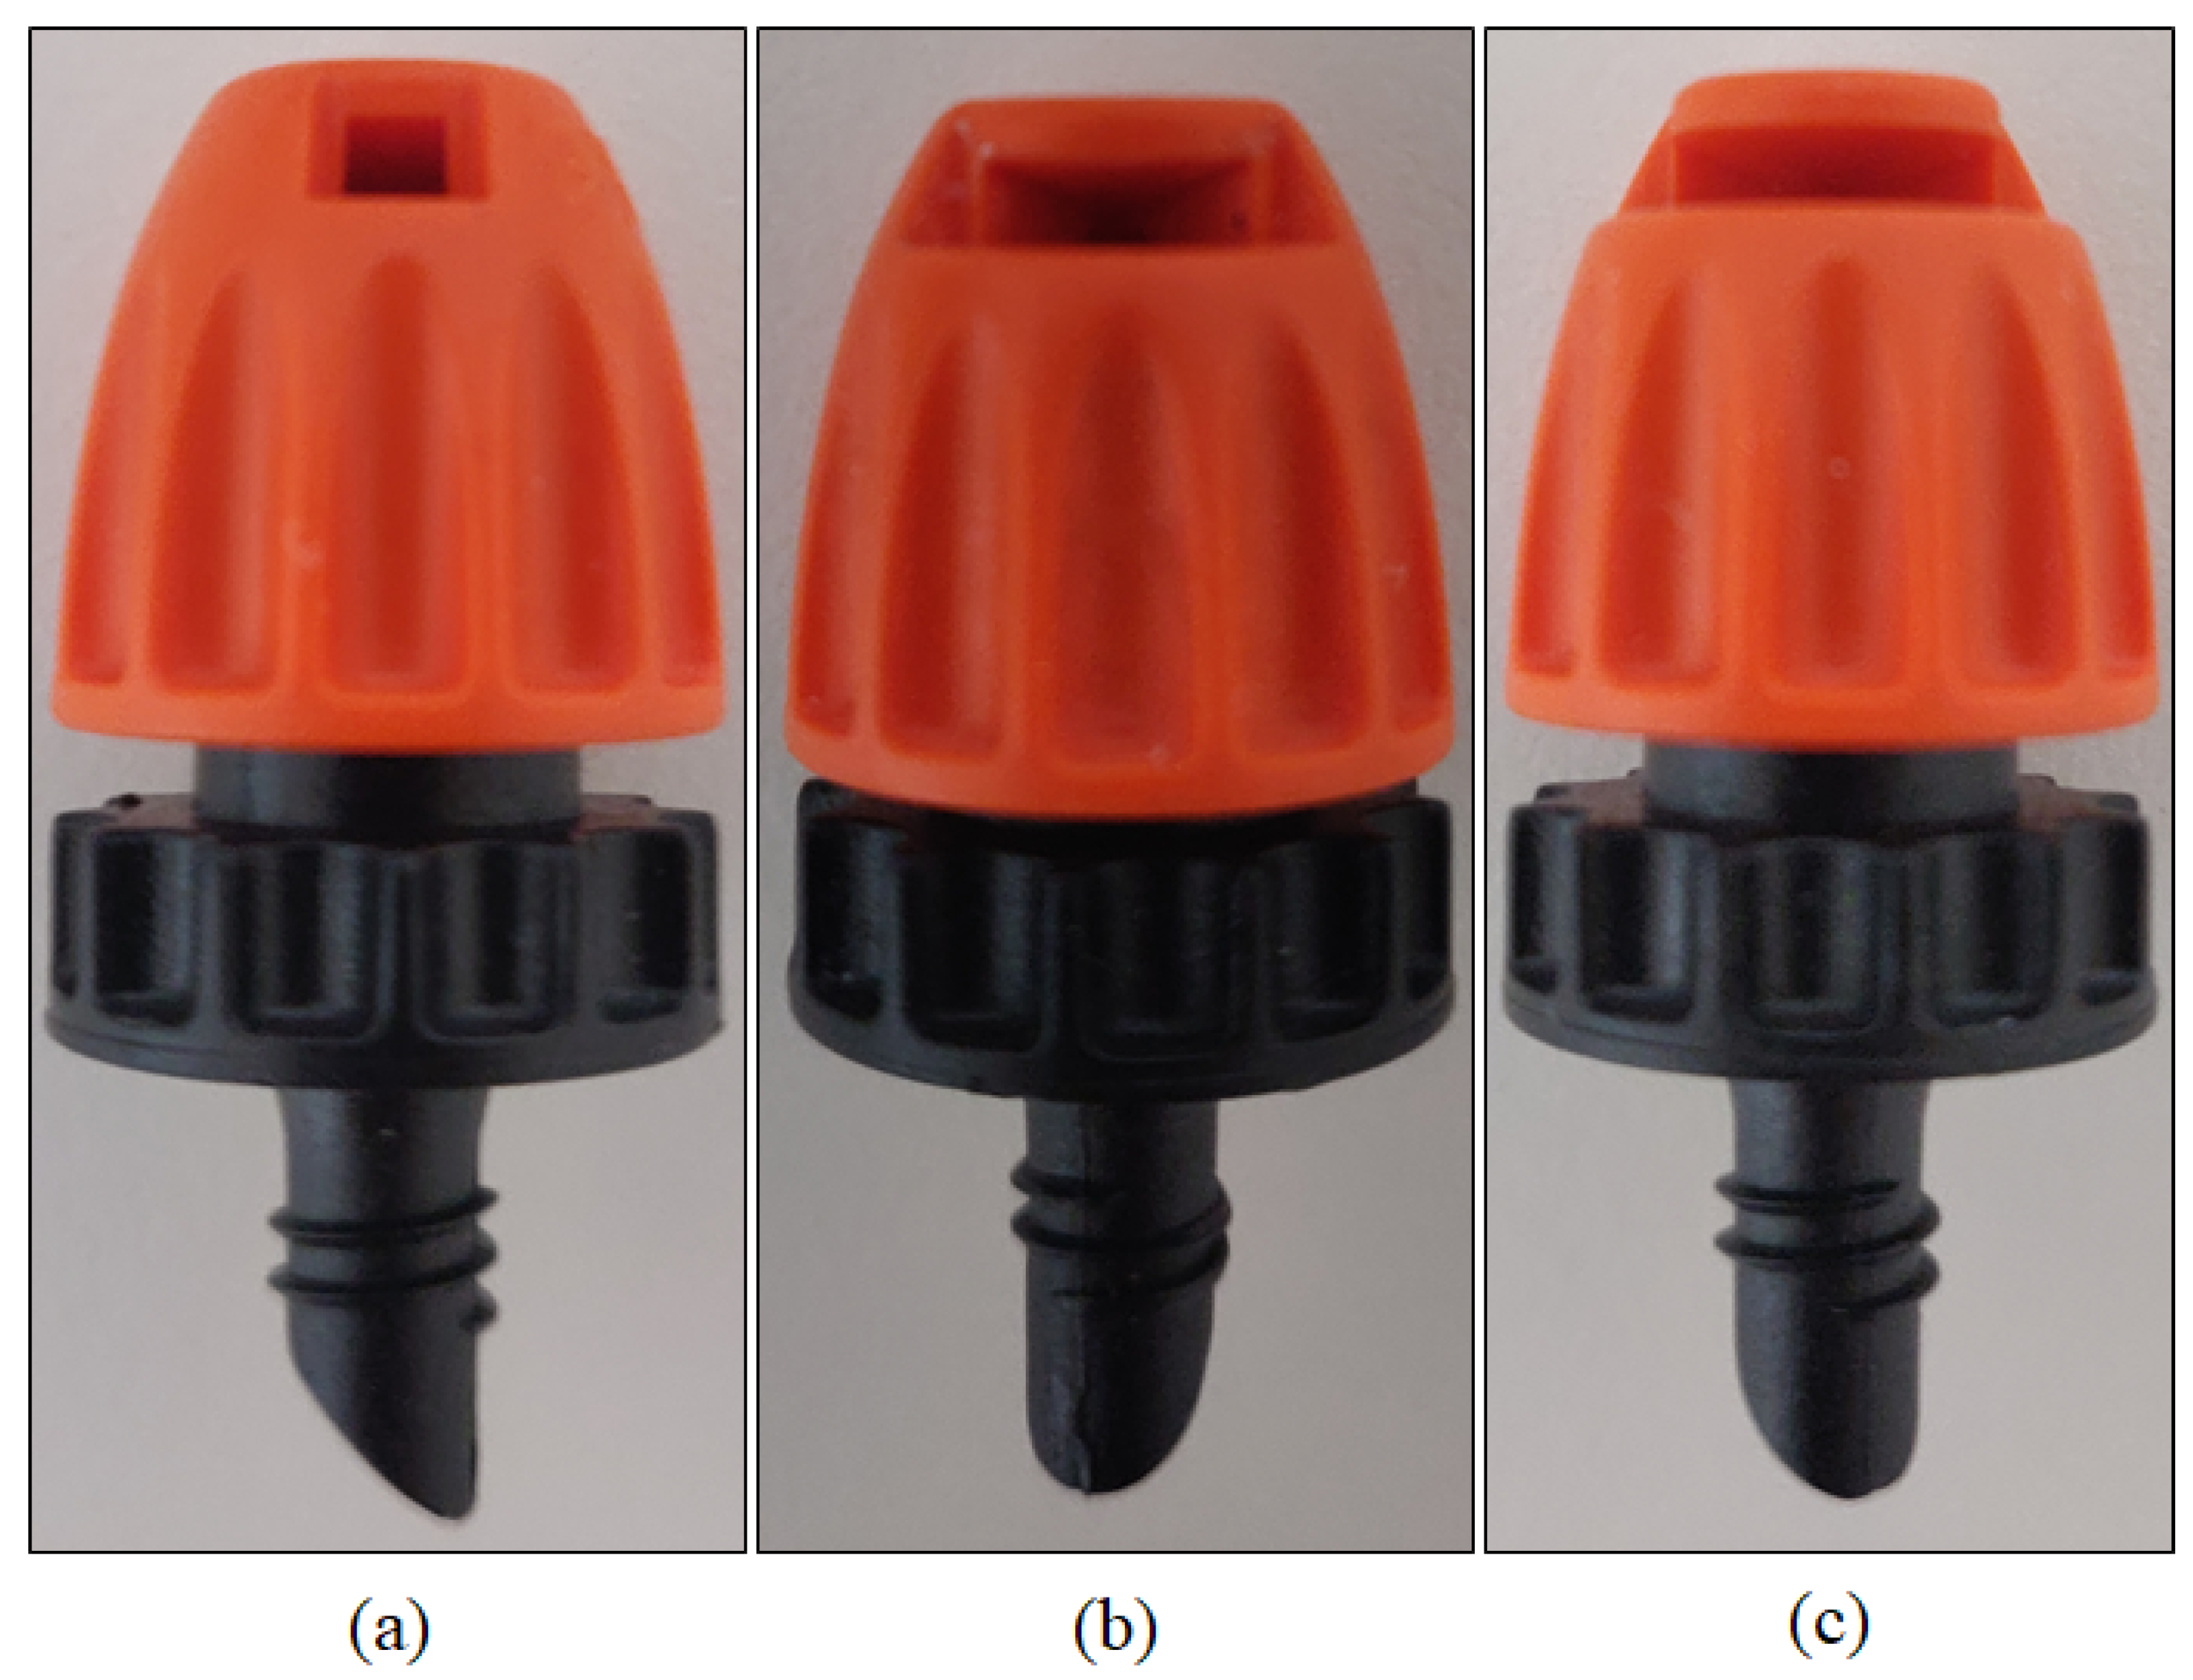
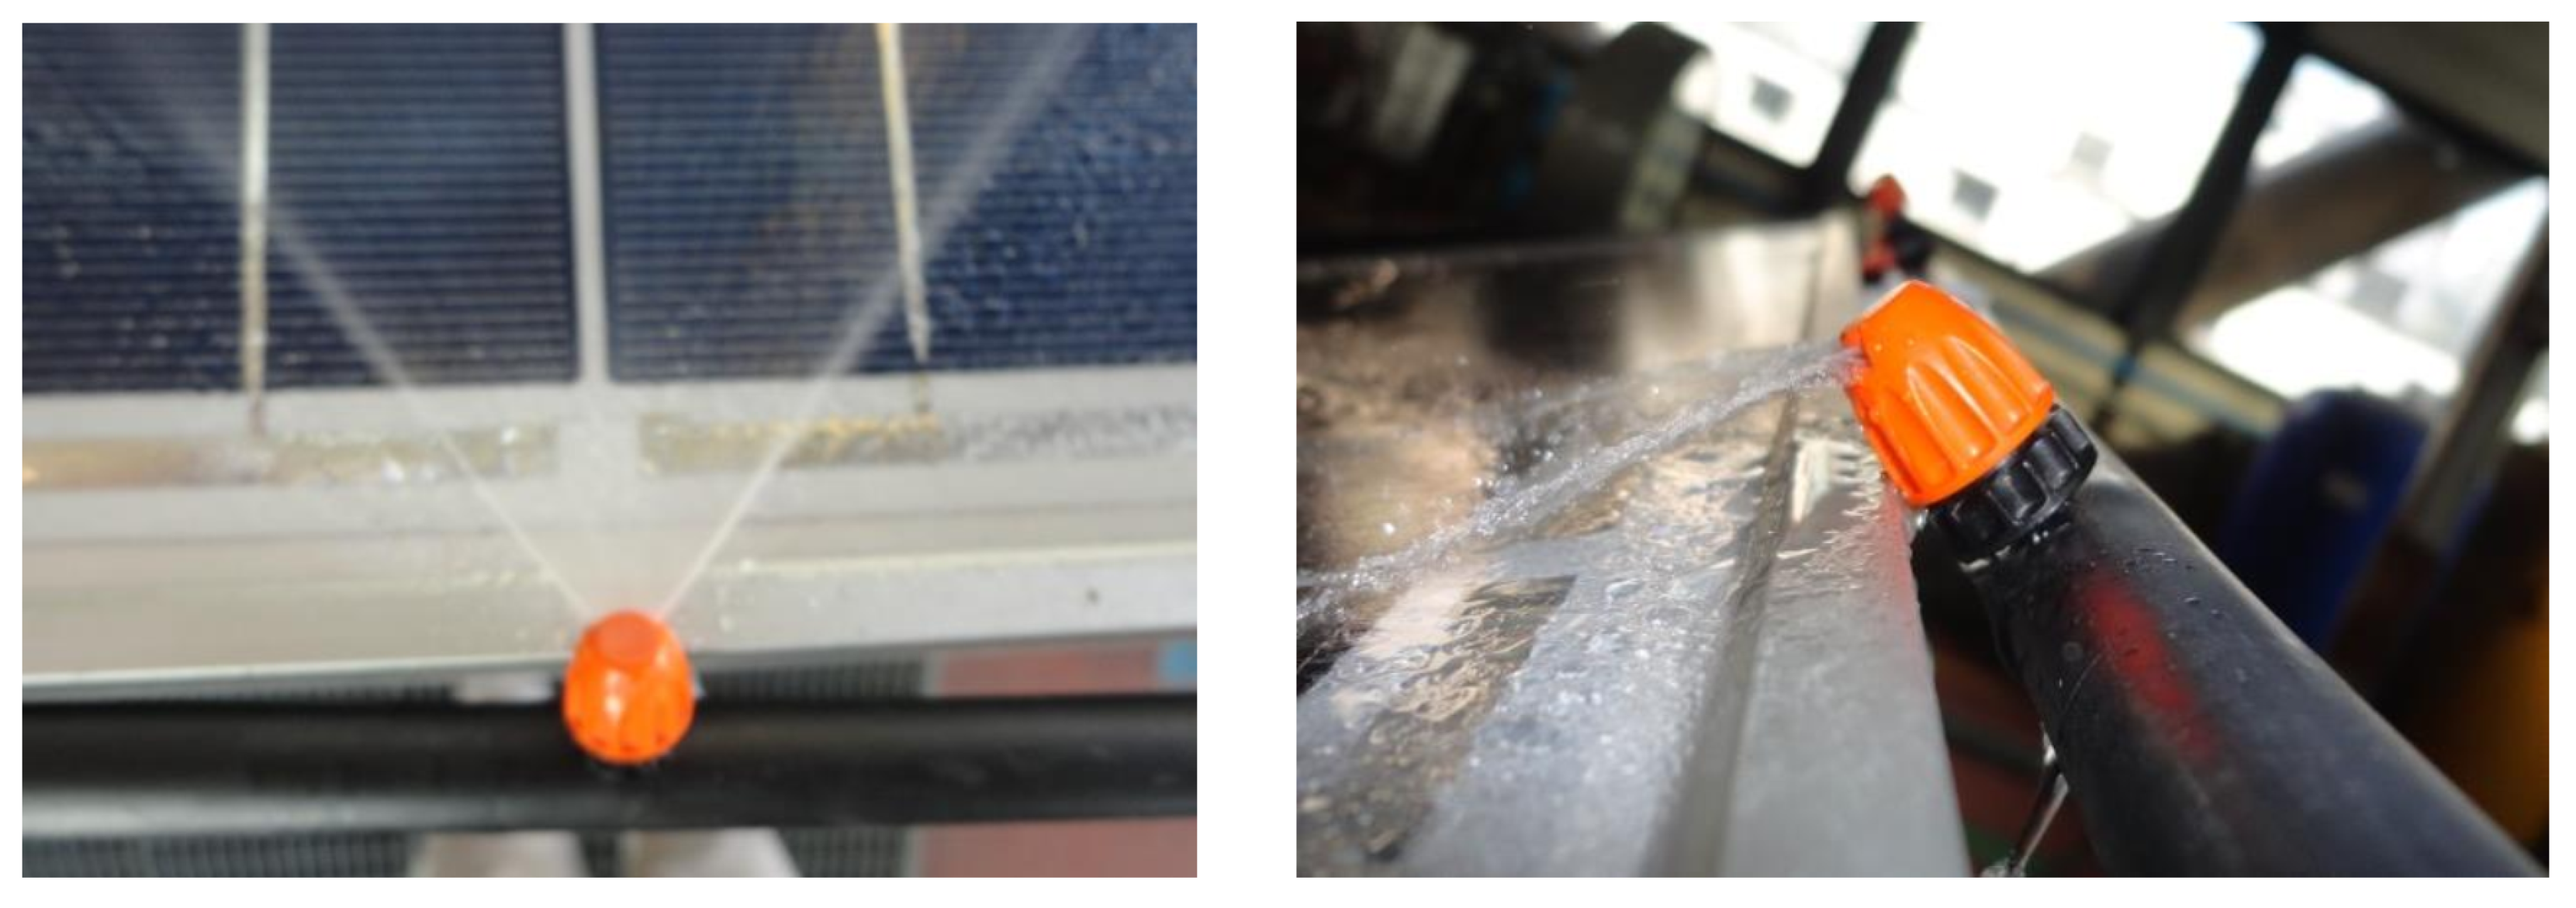
According to the scope of developing an efficient, low-weight, easy-to-mount, and low-cost spraying cooling system, the nozzles shown in
Figure 4 and initially designed for irrigation purpose are selected and tested among hundreds of market-available sprinklers. These types of nozzles are readily available on the market and manufactured in plastic according to the highest manufacturing standards despite the low cost. Another interesting feature of the selected nozzles is the dependency between the sprayed water mass flow rate and the inlet pressure. For each nozzle type, the manufacturer provides the water mass flow rate vs. inlet pressure characteristic curve. Therefore, regulating the nozzle inlet pressure allows spraying different water mass flow; a fact that guarantees selecting the most suitable flow rate without changing the cooling system layout. The design sprayed flow rates are given in
Table 1 for each nozzle type. Note that each of them allows spraying the same water flow rate at a given pressure. Therefore, the difference among them is spraying angle; a parameter that needs to be select during the experimental campaign.
The nozzles are mounted on a flexible tube (20 mm diameter) also designed for gardening purposes. This kind of pipe guarantees a fast installation on the module’s top edge through clips as well as a rapid fixing and orientation of the nozzles (see
Figure 5). Clips and flexible tubes also allow to drastically reduce the modification of the PV module necessary to install the cooling system.
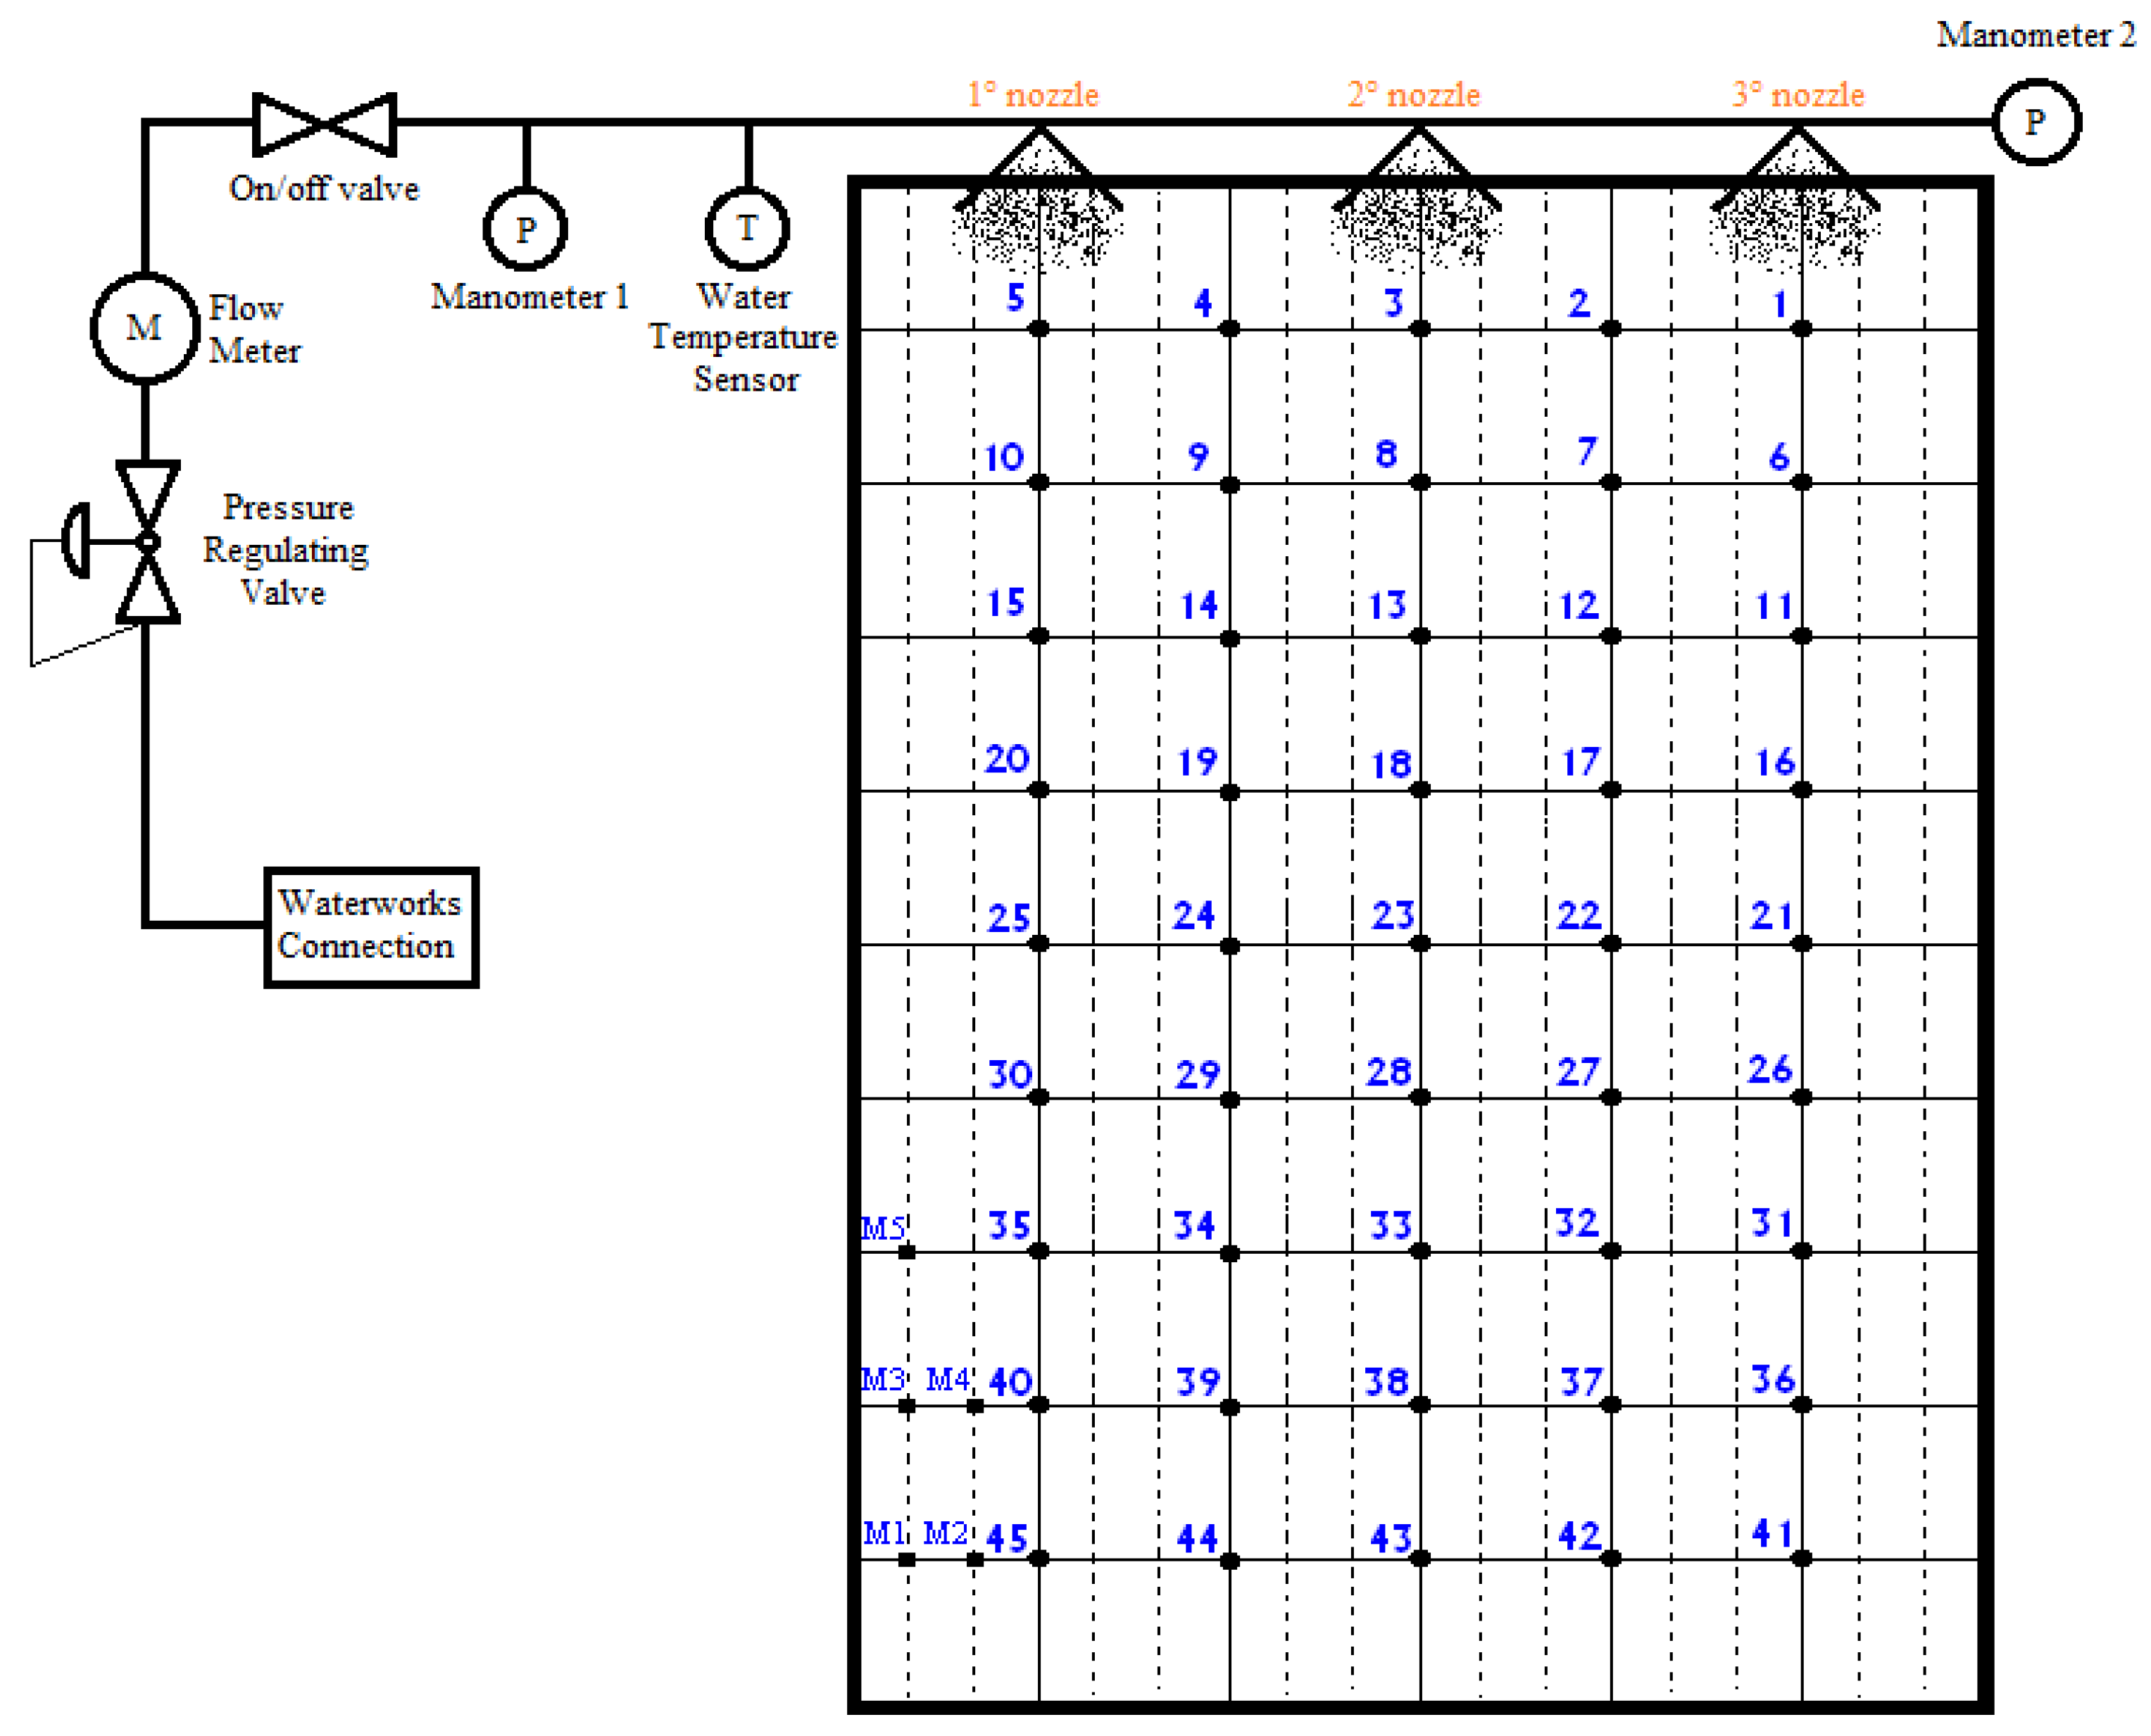
For a detailed characterization of the module’s surface temperature, 50 T-type thermocouples are stuck up on the module’s backside. Compared to the literature where the module’s surface temperature is monitored using 1, 2, or 4 thermocouples, the authors preferred to use a large number of temperature sensors to better characterized the temperature over time evolution in each point of the module. Note that despite the fact that Elnozahy et al. [
47] observed a difference between the surface temperature measured on the front and back side of the module, the authors preferred to stick the temperature sensors on the back surface to do not create shading and blockages to the water flow. In addition, in authors’ preliminary tests, the difference between front and rear side surface temperature was approximately zero and lower than 3 °C when lamps were switched off and on, respectively. Compared to Osma-Pinto and Ordónez-Plata [
45], who measured the temperature of the panel surface with a thermal camera, the adoption of thermocouples allows us to measure and acquire the temperature in each point of the surface with a properly selected time frame. A point of novelty of the proposed investigation which guarantees also to build a temperature map of the module’s surface temperature during different operating conditions. Thermocouples are placed in the module as depicted in
Figure 6. Note that sensors identified with symbol “M” are located in panel’s areas characterized by low wet grade. This maldistribution in sprayed water and related low wet grade zones have been detected during preliminary spraying tests. Therefore, these thermocouples permit the detection of hotspots caused by nonuniform distribution of the water film and, then, identify possible degradation of the glass properties or thermal shock.
Figure 6 also shows the hydraulic circuit starting from the point of water intake (waterworks). Water flows across the pressure-regulating valve, the flow meter, and the on/off valve, and it is sprayed by the set of nozzles mounted on the module’s upper edge. The nozzles are mounted on a plastic pipe and before and after the nozzles there is a pressure gauge (manometer 1 and 2 in
Figure 6) used to measure nozzles inlet pressure and the pressure drop across them. The
Pressure Regulating Valve is used to control the inlet water pressure in the cooling injection circuit because, for different nozzle type, the water mass flow rate sprayed by the nozzle is a function of the inlet pressure. Therefore, the proper management of the valve opening allows testing different spraying pressures and, subsequently, different water flow rates. The second valve, which is called
on/off valve, is used to perform a non-continuous spraying test. This means that water can be sprayed for different durations; a fact which allows to test and, then, define the best compromise between cooling effect maximization and water consumption minimization. Valves are directly managed via the
in-house code developed in LabVIEW and adopted to acquire temperatures, pressures, and the water flow rate.
As water is delivered to nozzles using a non-isolated pipe, its exposure to solar irradiance increases the water’s temperature into the tube. The higher the water temperature, the lower the cooling efficiency. Thus, it is crucial to monitor the tube’s water temperature, mostly if the on/off cycle is adopted as spraying strategy. To this purpose, a T-type thermocouple is installed after manometer 1 (see
Figure 6) to measure the water temperature before being sprayed on the module surface, and another thermocouple is placed before the pressure regulating valve to monitor water temperature in a not irradiated zone of the tube. Note that after cooling the module, water is collected using a gutter.
To evaluate the tehcno-economic feasibility of the proposed spraying cooling system, the results of the experimental campaign are applied to a 1 MW floating PV plant constituted by 4438 PV module. The construction of the PV facility is, at the time of writing, under-evaluation in an lake located in Veneto region.
5. Experimental Campaign Outcomes
To be efficient, an active cooling system using water needs to establish a uniform film on the module surface. In this manner, the whole PV surface results wet and, then, cools. Therefore, the cooling system demonstrates its highest efficiency. Moreover, when the cooling system is equipped with spraying devices, it is crucial to verify that only a marginal quantity of water leaves the module edges without cooling the PV surface.
To study these fundamental points, the authors first run tests devoted to select nozzles number, geometry (spraying angle), and position (top or bottom edge installation), but they also evaluate the water inlet pressure being directly related to the sprayed flow rate and, subsequently, linked to the water distribution on the panel surface.
Adopted nozzles are commercially available devices with different spraying angle; though, the first step is the selection of the nozzle type which guarantees a good water spread.
Independently to the water inlet pressure and nozzle position (top or bottom edge of the panel), the strip and the 180° sprinkler demonstrate their inability of distributing the water on the PV surface. In fact, measurements reveal the 180° sprinkler sprayed 30% of the water outside the module’s edges while strip sprinklers are not able to distribute the water on the panel because they create only water strip. Therefore, only a small part of the module’s surface resulted wet. Note that the authors also evaluate the installation of the 360° sprinkler. This sprinkler sprayed approximately 50% of the water outside of the panel surface, except in the case of installing this nozzle type over the panel at a certain distance from the surface. Obviously, this solution is difficult to build for two reasons: (i) the architecture which supports the 360° sprinkler over the panel is costly and complicated to build, and (ii) the structure over the module as well as the nozzles can create shading on the panel. Therefore, the adoption of these 3 types of nozzle cannot be used during tests due to high water losses or film maldistribution. Effects that imply high water consumption and/or reduce cooling efficiency which in turns results in a reduction of the cooling benefits.
Based on these preliminary tests, the authors selected the nozzle with a spraying angle of 90° because it is the only one able to establish a well-distributed water film on the panel, as well as to minimize the water losses along the module’s edges.
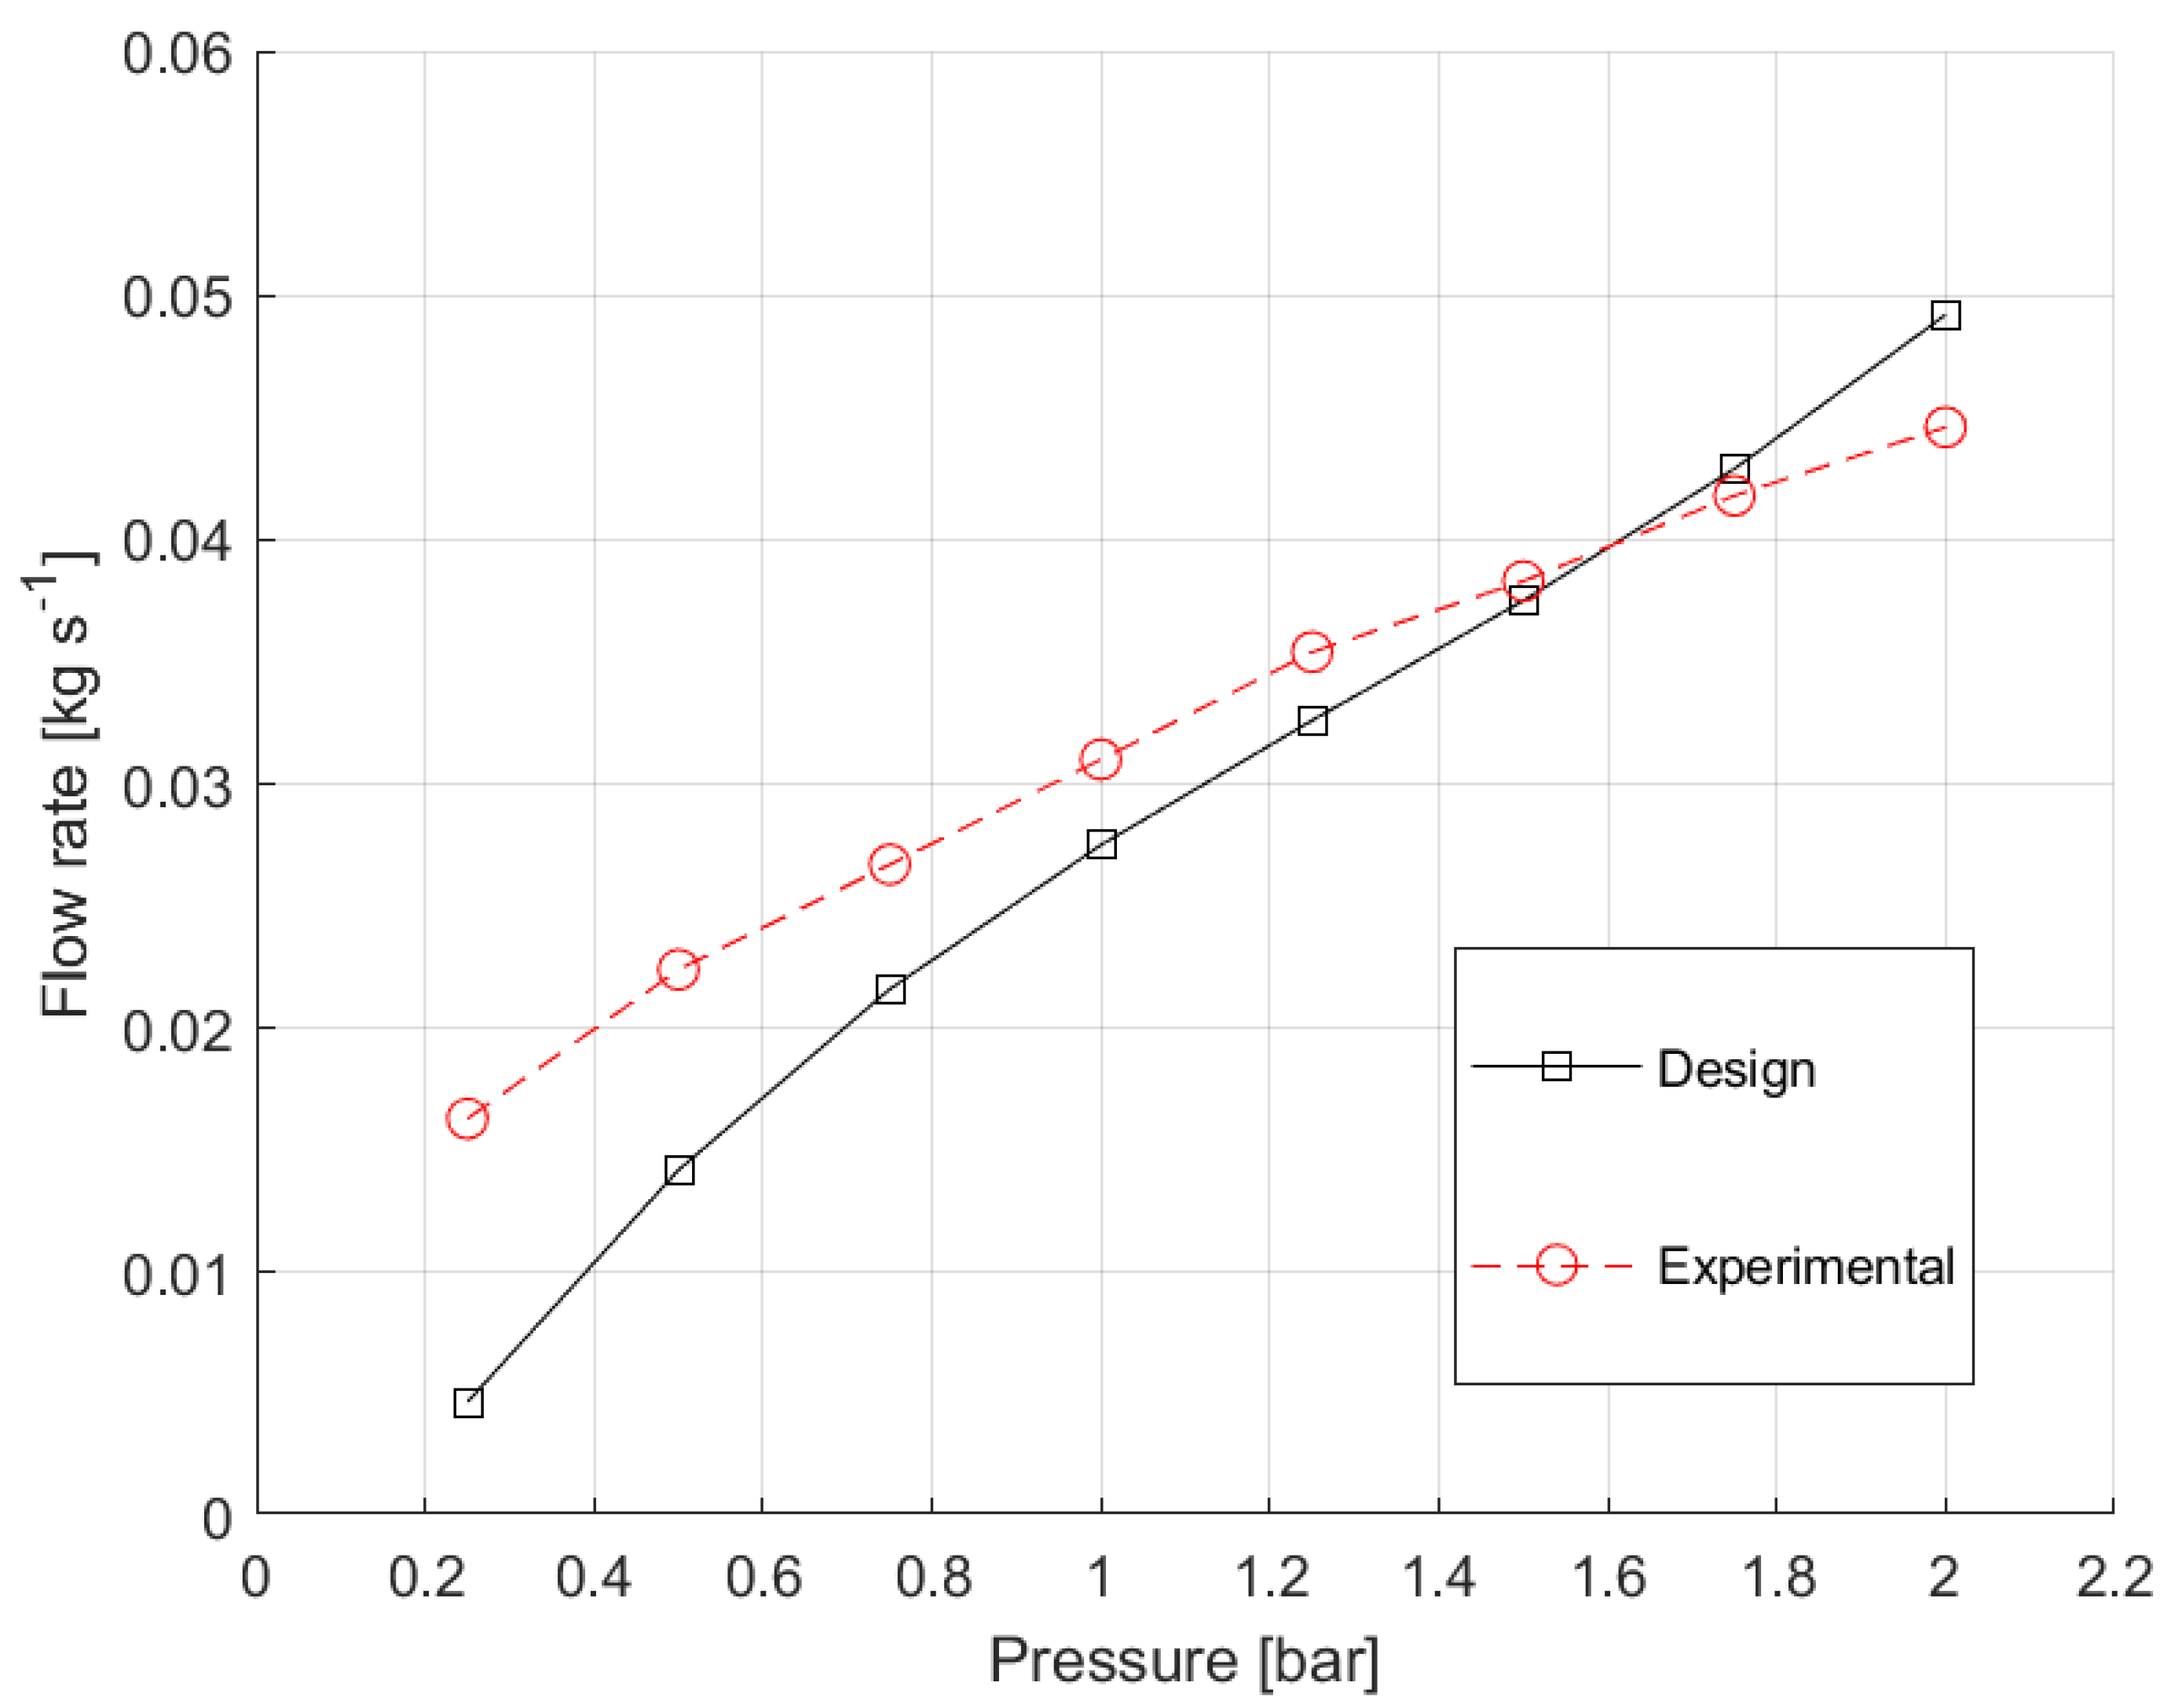
During these tests, the authors observed that the water sprayed by the nozzle at a certain inlet pressure does not correspond to the one provided by the manufacture. To point out the source of the flow rate discrepancy, for each spraying pressure (0.25, 0.50, 0.75, 1.00, 1.25, 1.50, 1.75, and 2.00 bar), the sprayed water is collected in a water vessel. The collected water is weighted and the water mass flow rate computed. The measured flow rate is then compared with the one directly measured by the flow meter installed on the hydraulic water circuit. The comparison among manufacturer data and measured values are shown in
Figure 7.
In the range 0.25 ÷ 1.60 bar, the sprayed water flow rate is higher than the one listed in nozzle data sheet while, for pressures ranging from 1.75 and 2.00 bar, the flow rate is lower than the declared one. At 0.25 bar, the measured flow rate is 3.8 times the design one while at 2.00 bar the measured one is 10% lower than the declared value. Around 1.6 bar, the mismatch between experimental measurement and design value results in less than 1%. In a nutshell, the flow rate tests reveal a mismatch between real sprayed water and the design one. This is a crucial aspect, especially when one of the experimental campaign aims is the computation of the proposed system water consumption as well as water losses along the module’s edges and self-evaporation effects.
To study the nozzle manufacturing accuracy in terms of sprayed flow rate and pressure drop across it, several spraying tests are run using different nozzles of the same type. Results reveal a flow rate mismatch lower than 1% while, independently to the nozzle inlet pressure, the pressure drop across a single nozzle is 0.03 bar. As for the water flow rate vs. the spraying pressure curve, the performed test is a fundamental step because the proper evaluation of pressure drop is essential when multiple nozzles are placed in series and their mass flow directly linked to the water inlet pressure.
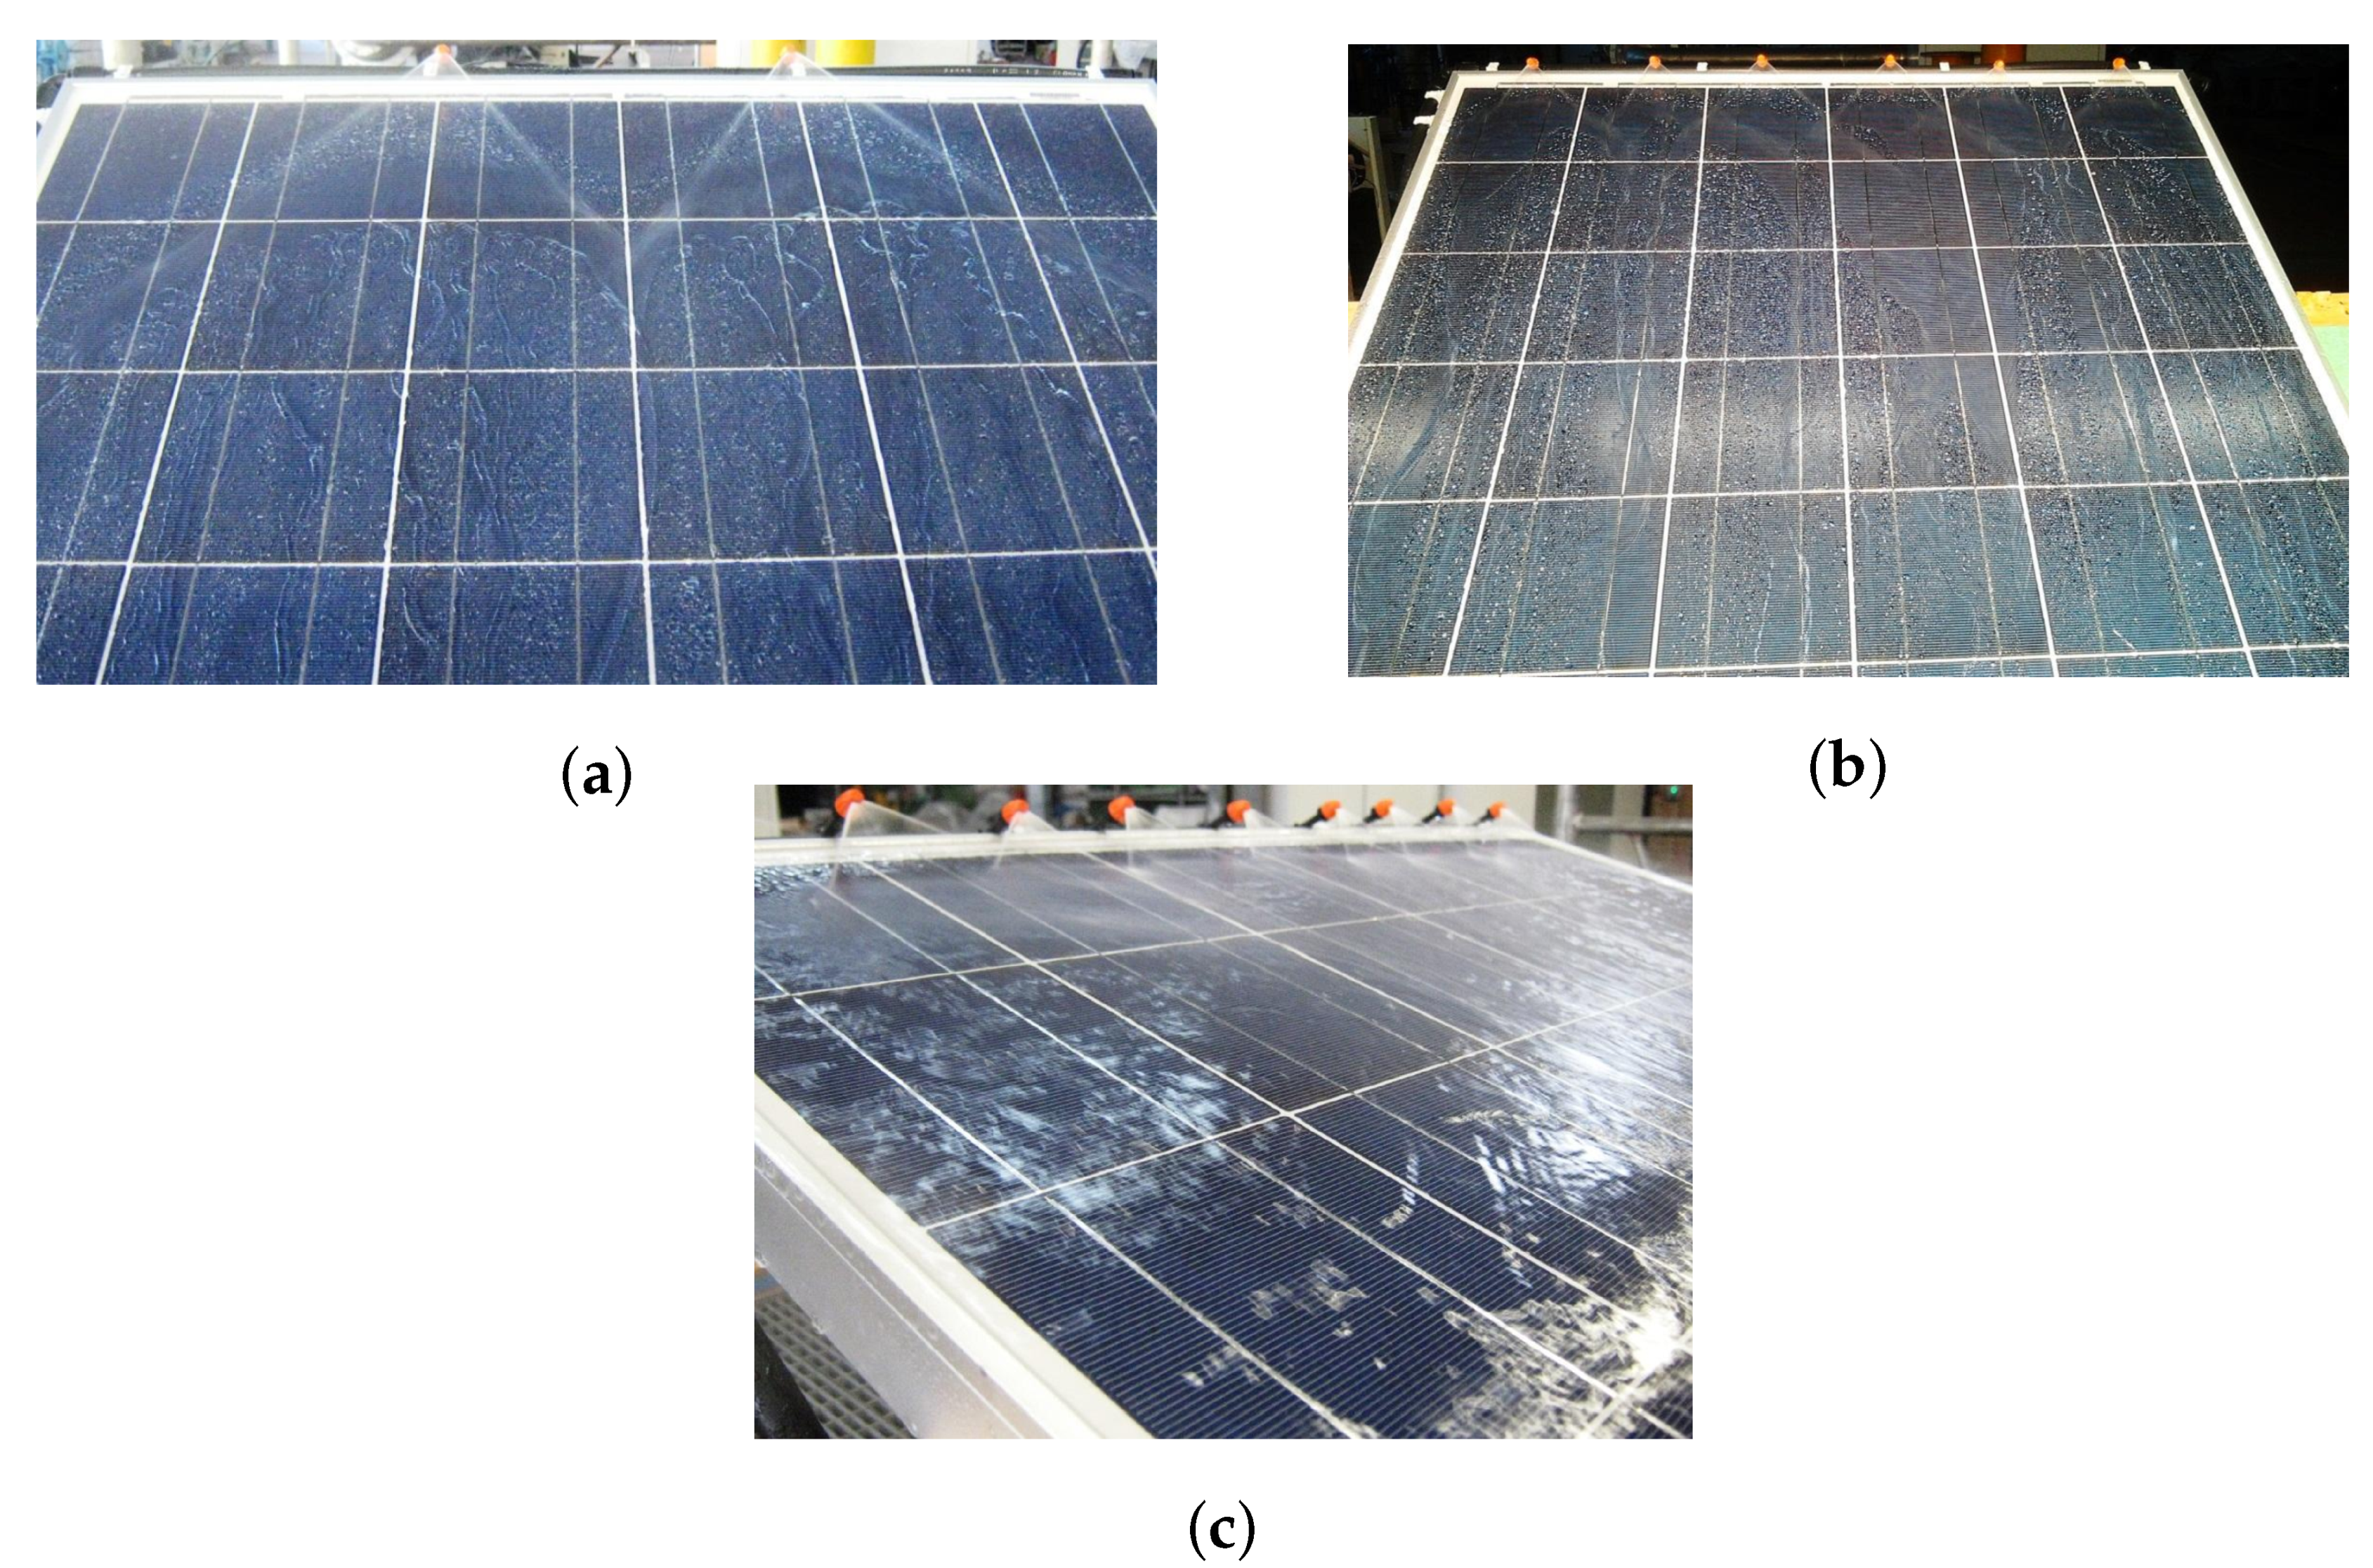
In conjunction with the selection of the nozzle spraying angle, the authors evaluated also their position (top or bottom of the panel), inclination, and number. As previously, these parameters are investigated with the aim of finding the configuration which allows a uniform film distribution and, subsequently, the best compromise between PV performance improvement and water consumption. Placing the nozzles on the PV module bottom edge does not guarantee to sprinkle water on the entire module surface (the upper part of the module resulted non-cooled) as well as to eventually collect the sprayed water after surface cooling. Therefore, to establish a uniform film from top to bottom, nozzles need to be placed on the module’s top edge, as shown in
Figure 8. In this manner, the sprayed water flows from the top to the bottom of the module surface by gravity and independently the panel tilt angle. Note that, water allows to cool down the surface not only directly but also because of its evaporation. Besides, the water flow guarantees to clean the module surface from dust favoring the self-cleaning mechanism.
After identifying the nozzle type and location, the authors focused their attention on nozzles’ number selection. To this purpose, cooling tests are performed varying the nozzles’ number from 1 to 12.
Figure 8 depicts three spraying tests with 2, 6, and 9 water nozzles.
A cooling system equipped with two nozzles cannot establish a uniform film on the surface and completely cool the upper part of the module. On the contrary, 6, 9, or 12 nozzles establish a very uniform water film but the water loss along the module edges are really high: from 30 to 70% of the sprayed flow rate is lost along the module’s edges. Based on these tests, a uniform film and an acceptable loss of water along the edges (less than 10%) can be reached with three nozzles. Therefore, the proposed cooling system is equipped with three nozzles characterized by a spraying angle of 90° placed on the module top edge. The nozzles’ inclination with respect to the panel surface is set to 75°; an angle which guarantees to wet the surface entirely also on near sprinklers.
After determining the flow rate vs. pressure characteristic and the pressure losses across the nozzle, an investigation on water consumption at different spraying pressures for the selected cooling system configuration is performed. Tested pressures range from 0.25 to 2.5 bar while the progressive increase is set to 0.25 bar. These experiments are run to figure out the feasibility of continuous cooling from the module’s top surface with the proposed configuration.
Taking into account the measured water flow rate vs. pressure characteristic and considering that, in summer, the cooling system runs for at least 6 h per day (usually from 10 a.m. to 4 p.m.), at a pressure of 0.25 bar the daily water consumption per single module is 368 L, while adopting a pressure of 2.0 bar it becomes 972 L. If the cooling system is installed on a 1 MW plant (4438 PV module), the daily water consumption with a pressure of 0.25 bar becomes 1634 m3, while, in the case of 2.0 bar, it is 4313 m3. Continuous cooling is not feasible even in the case of floating PV due to the high pump energy need to operate. Therefore, the only solution which guarantees to reduce water consumption and, subsequently, pumping consumption, is to manage the cooling system in ON/OFF mode. In this scenario, the authors investigate, for each water pressure (0.25, 0.50, 0.75, 1.00, 1.25, 1.50, 1.75, and 2.00 bar), different ON/OFF cycles: 30 s ON and 30 s OFF (30–30 s), 30–60 s, 30–120 s, 30–180 s, and 30–300 s.
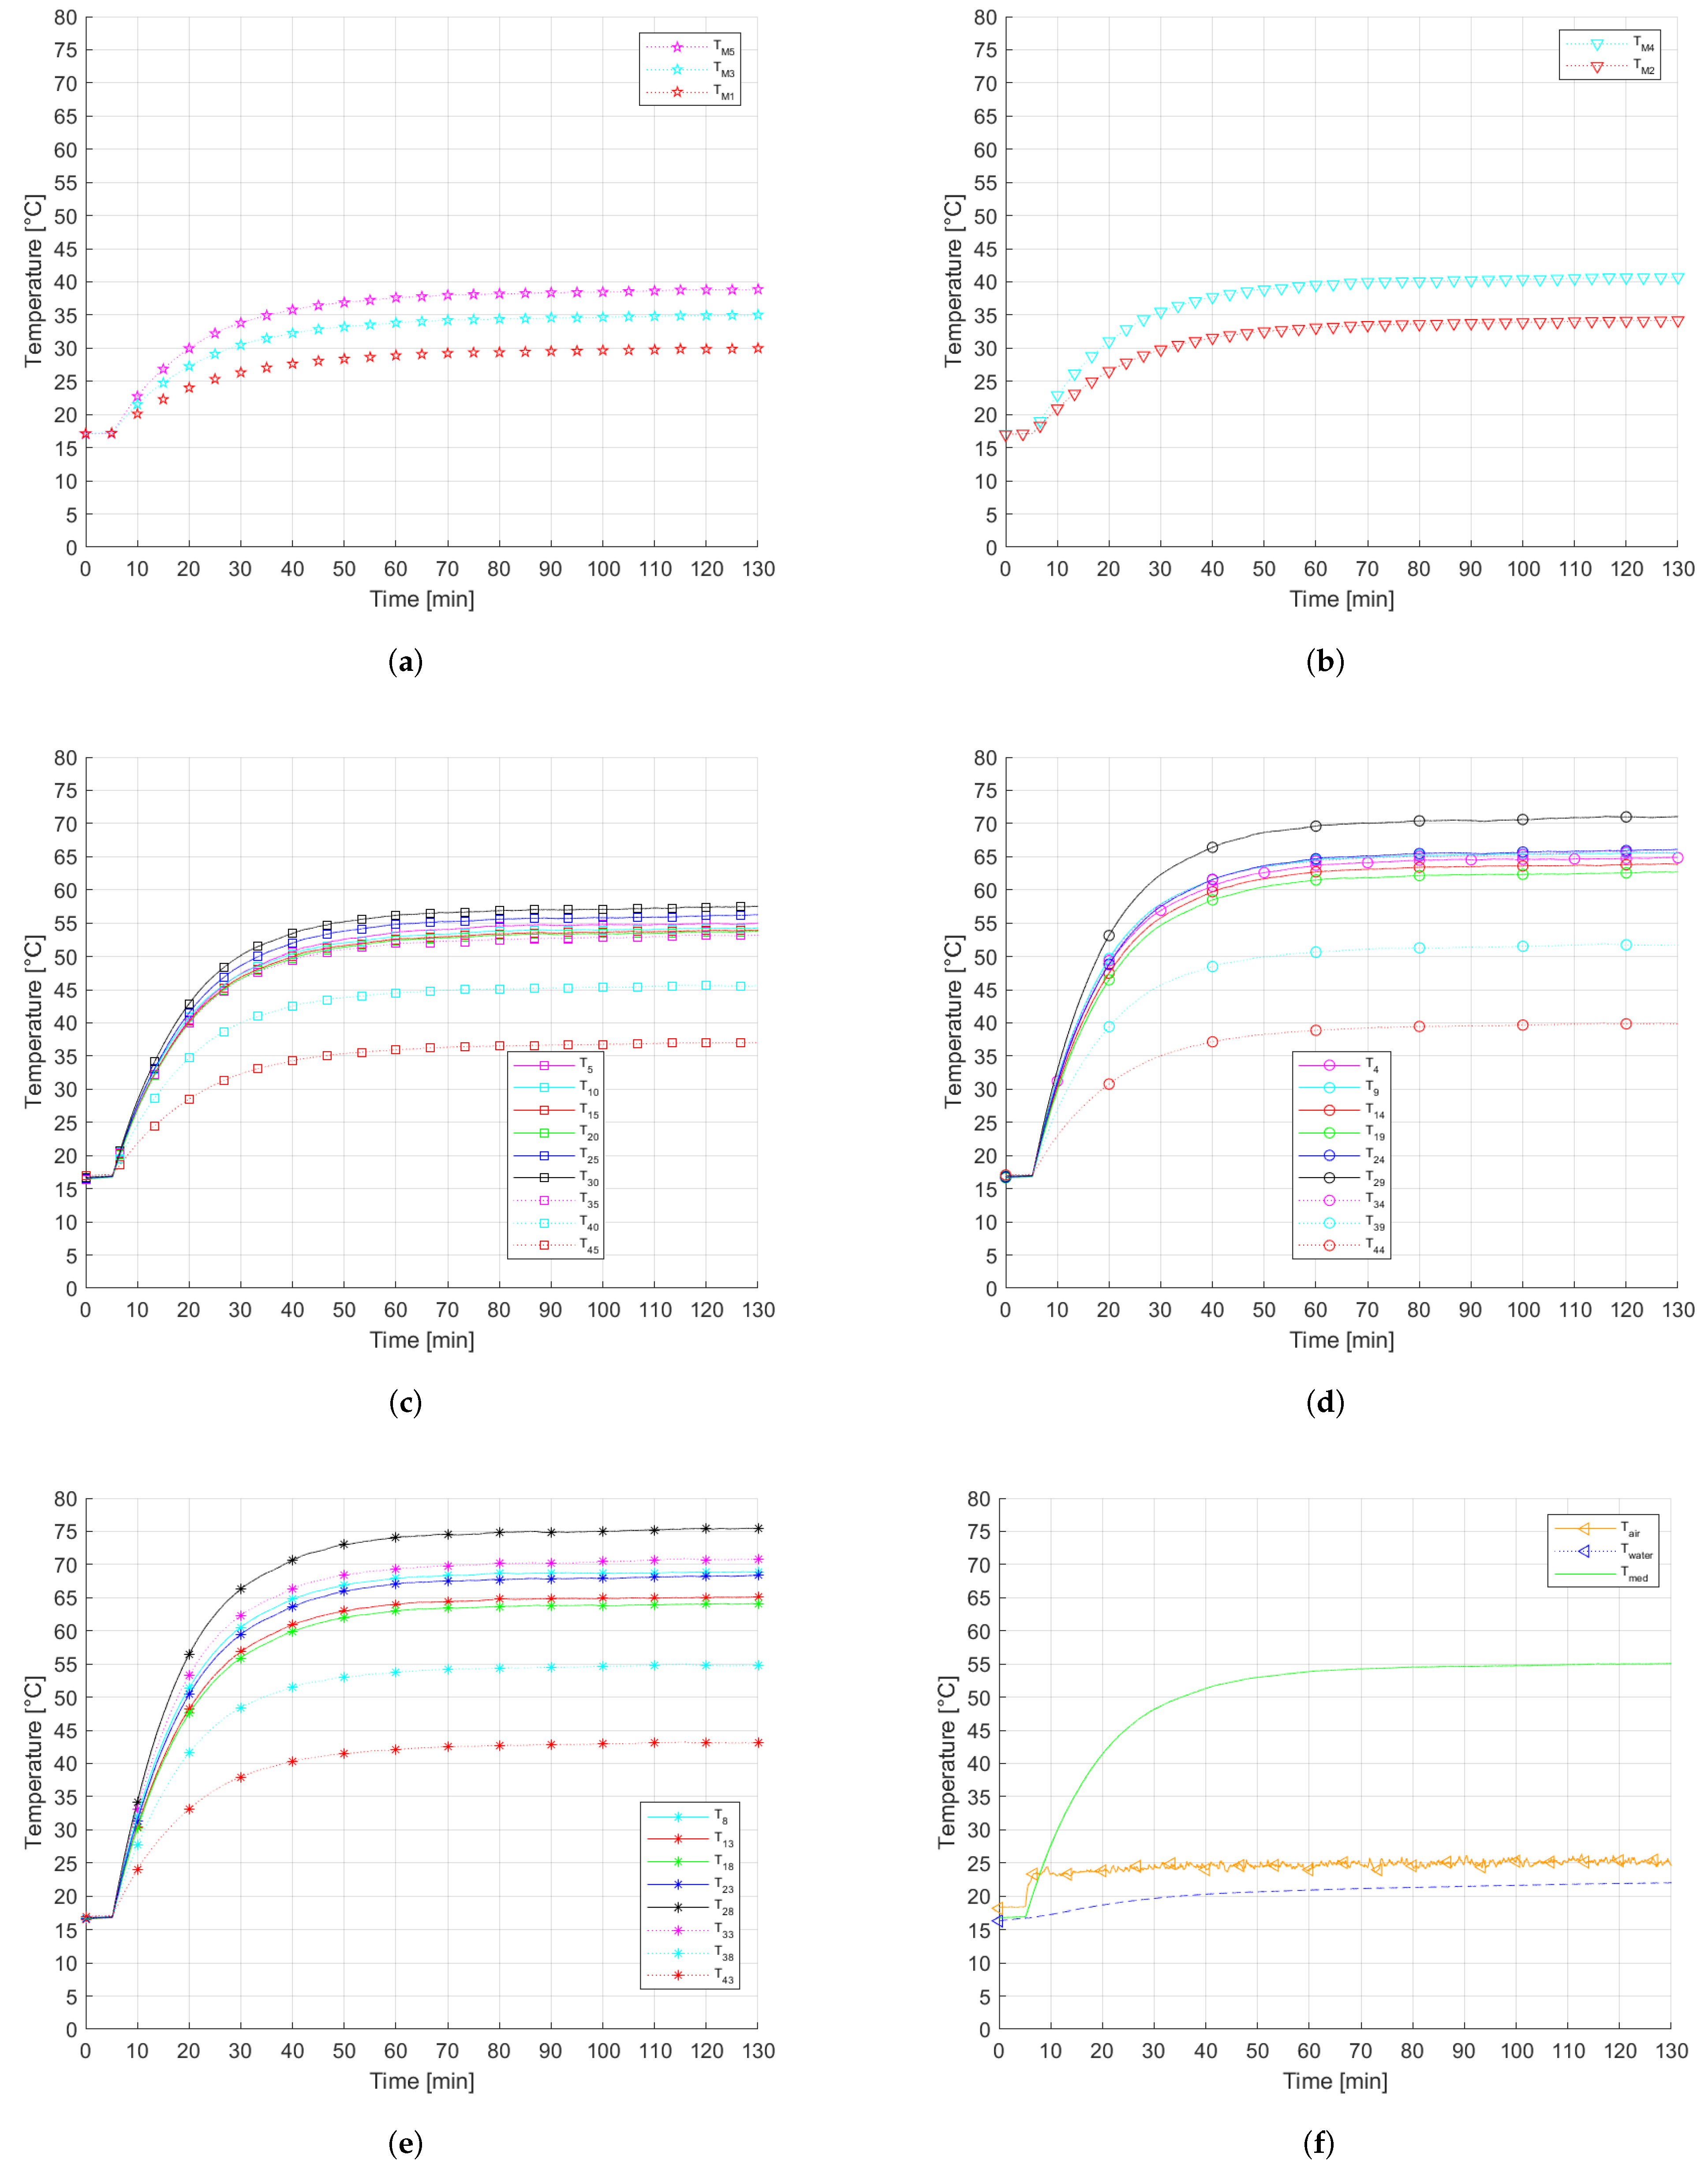
Each cooling test is performed after a heating period of the PV module, as shown in
Figure 9. The heating period stops when the entire set of thermocouples reaches stability and maintains it. This means after 120 min. The strategy of starting the cooling cycles after achieving the steady-state of mean surface temperature at the highest value is useful to assess the cooling system capability and velocity of reducing the temperature as well as to investigate the effects on the module’s surface (thermal shock and glass deterioration) of cooling it with fresh water.
Analyzing
Figure 9, it emerges that PV surface temperature is not uniform: a maximum is observed in point 28 (
shown in
Figure 9e), where the temperature reached values up to 70 °C while a minimum is detected in the lower part of the panel: point M1 (
shown in
Figure 9a). In that position, the temperature can also be 40 °C lower than in point 28. This high-temperature discrepancy between hottest and coldest point is further investigated by the authors exposing the PV module to solar radiation, showing nonuniform temperatures in the surface.
Focusing on
Figure 9f, it is essential to highlight that mean surface temperature after the heating process is 56 °C which means 32–37 °C above the measured air temperature between the panel and the lamps and 11 °C higher than NOCT temperature. Regarding heating rates, the maximum is 0.45 °C min
−1, and it is registered in point 28 while the minimum is equal to 0.13 °C min
−1 and corresponds to position M1. The average is 0.33 °C min
−1.
Another critical aspect detected during heating tests is that water contained into the water pipe increases its temperature of 5 ÷ 12 °C compared to the one measured at the beginning of the tube; being the latter in a non-heated zone of the lab (see
Figure 9f). Then, the temperature increment affected the cooling system efficiency during the early spraying cycles. In particular, the higher the water temperature, the lower the cooling effect. However, the higher the water temperature, the lower the thermal shock that water provokes on the glass surface. Thus, do not bury or insulate the water tube can be a way to mitigate the thermal shock and glass properties degradation; facts that also imply a cost reduction.
Note that, since 2016, the authors have been performing heating and cooling tests, and they did not observe thermal shock or glass properties degradation on the analyzed modules. However, based on their experience, these phenomena are difficult to detect under lab tests as the panels not exposed to summer and winter environmental conditions (sun, rain, hail, wind, etc.) which can also induce the onset of these effects. For these reasons, the authors are running outdoor tests to better investigate the above-mentioned effects, but also they expect to further study them on the floating PV facilities.
Before analyzing each cooling cycle’s temperature trends, it is crucial to witness film maldistribution in order to select the most suitable spraying pressure. In particular, the pressure
p = 0.5 bar does not allow to establish a water film on the module surface. The module is not thoroughly wet, especially in the bottom part. Then, starting from the horizontal line defined by points 26–30 visible in
Figure 6, thermocouples registered temperature reduction in the range 10 ÷ 20 °C compared to 30 ÷ 45 °C registered in the upper part. Therefore, it is evident that this pressure cannot be used due to a lack of film establishment. Obviously, it is essential to remember that
p = 0.5 bar is the pressure that minimizes the water consumption.
A similar film maldistribution is observed with an inlet pressure up to 1.25 bar while for pressure higher than 1.5 bar the film is approximately uniform. The higher the inlet pressure, the higher the water losses along the module edges. However, with 1.5 bar, the water sprayed outside the panel is approximately the 16% of the total while it reaches the 20% in the case of inlet pressure equal to 2.0 bar.
Note that, to determine the water losses along the module’s perimeter, tests are run without lamps irradiance to avoid water evaporation; so, the difference between the value registered by the flow meter and the weight of the water collected at the bottom of the panel by the gutter, represents the water losses. Starting from these computations and performing tests with lamps irradiance, it is possible to compute the water quantity that evaporates during spraying tests.
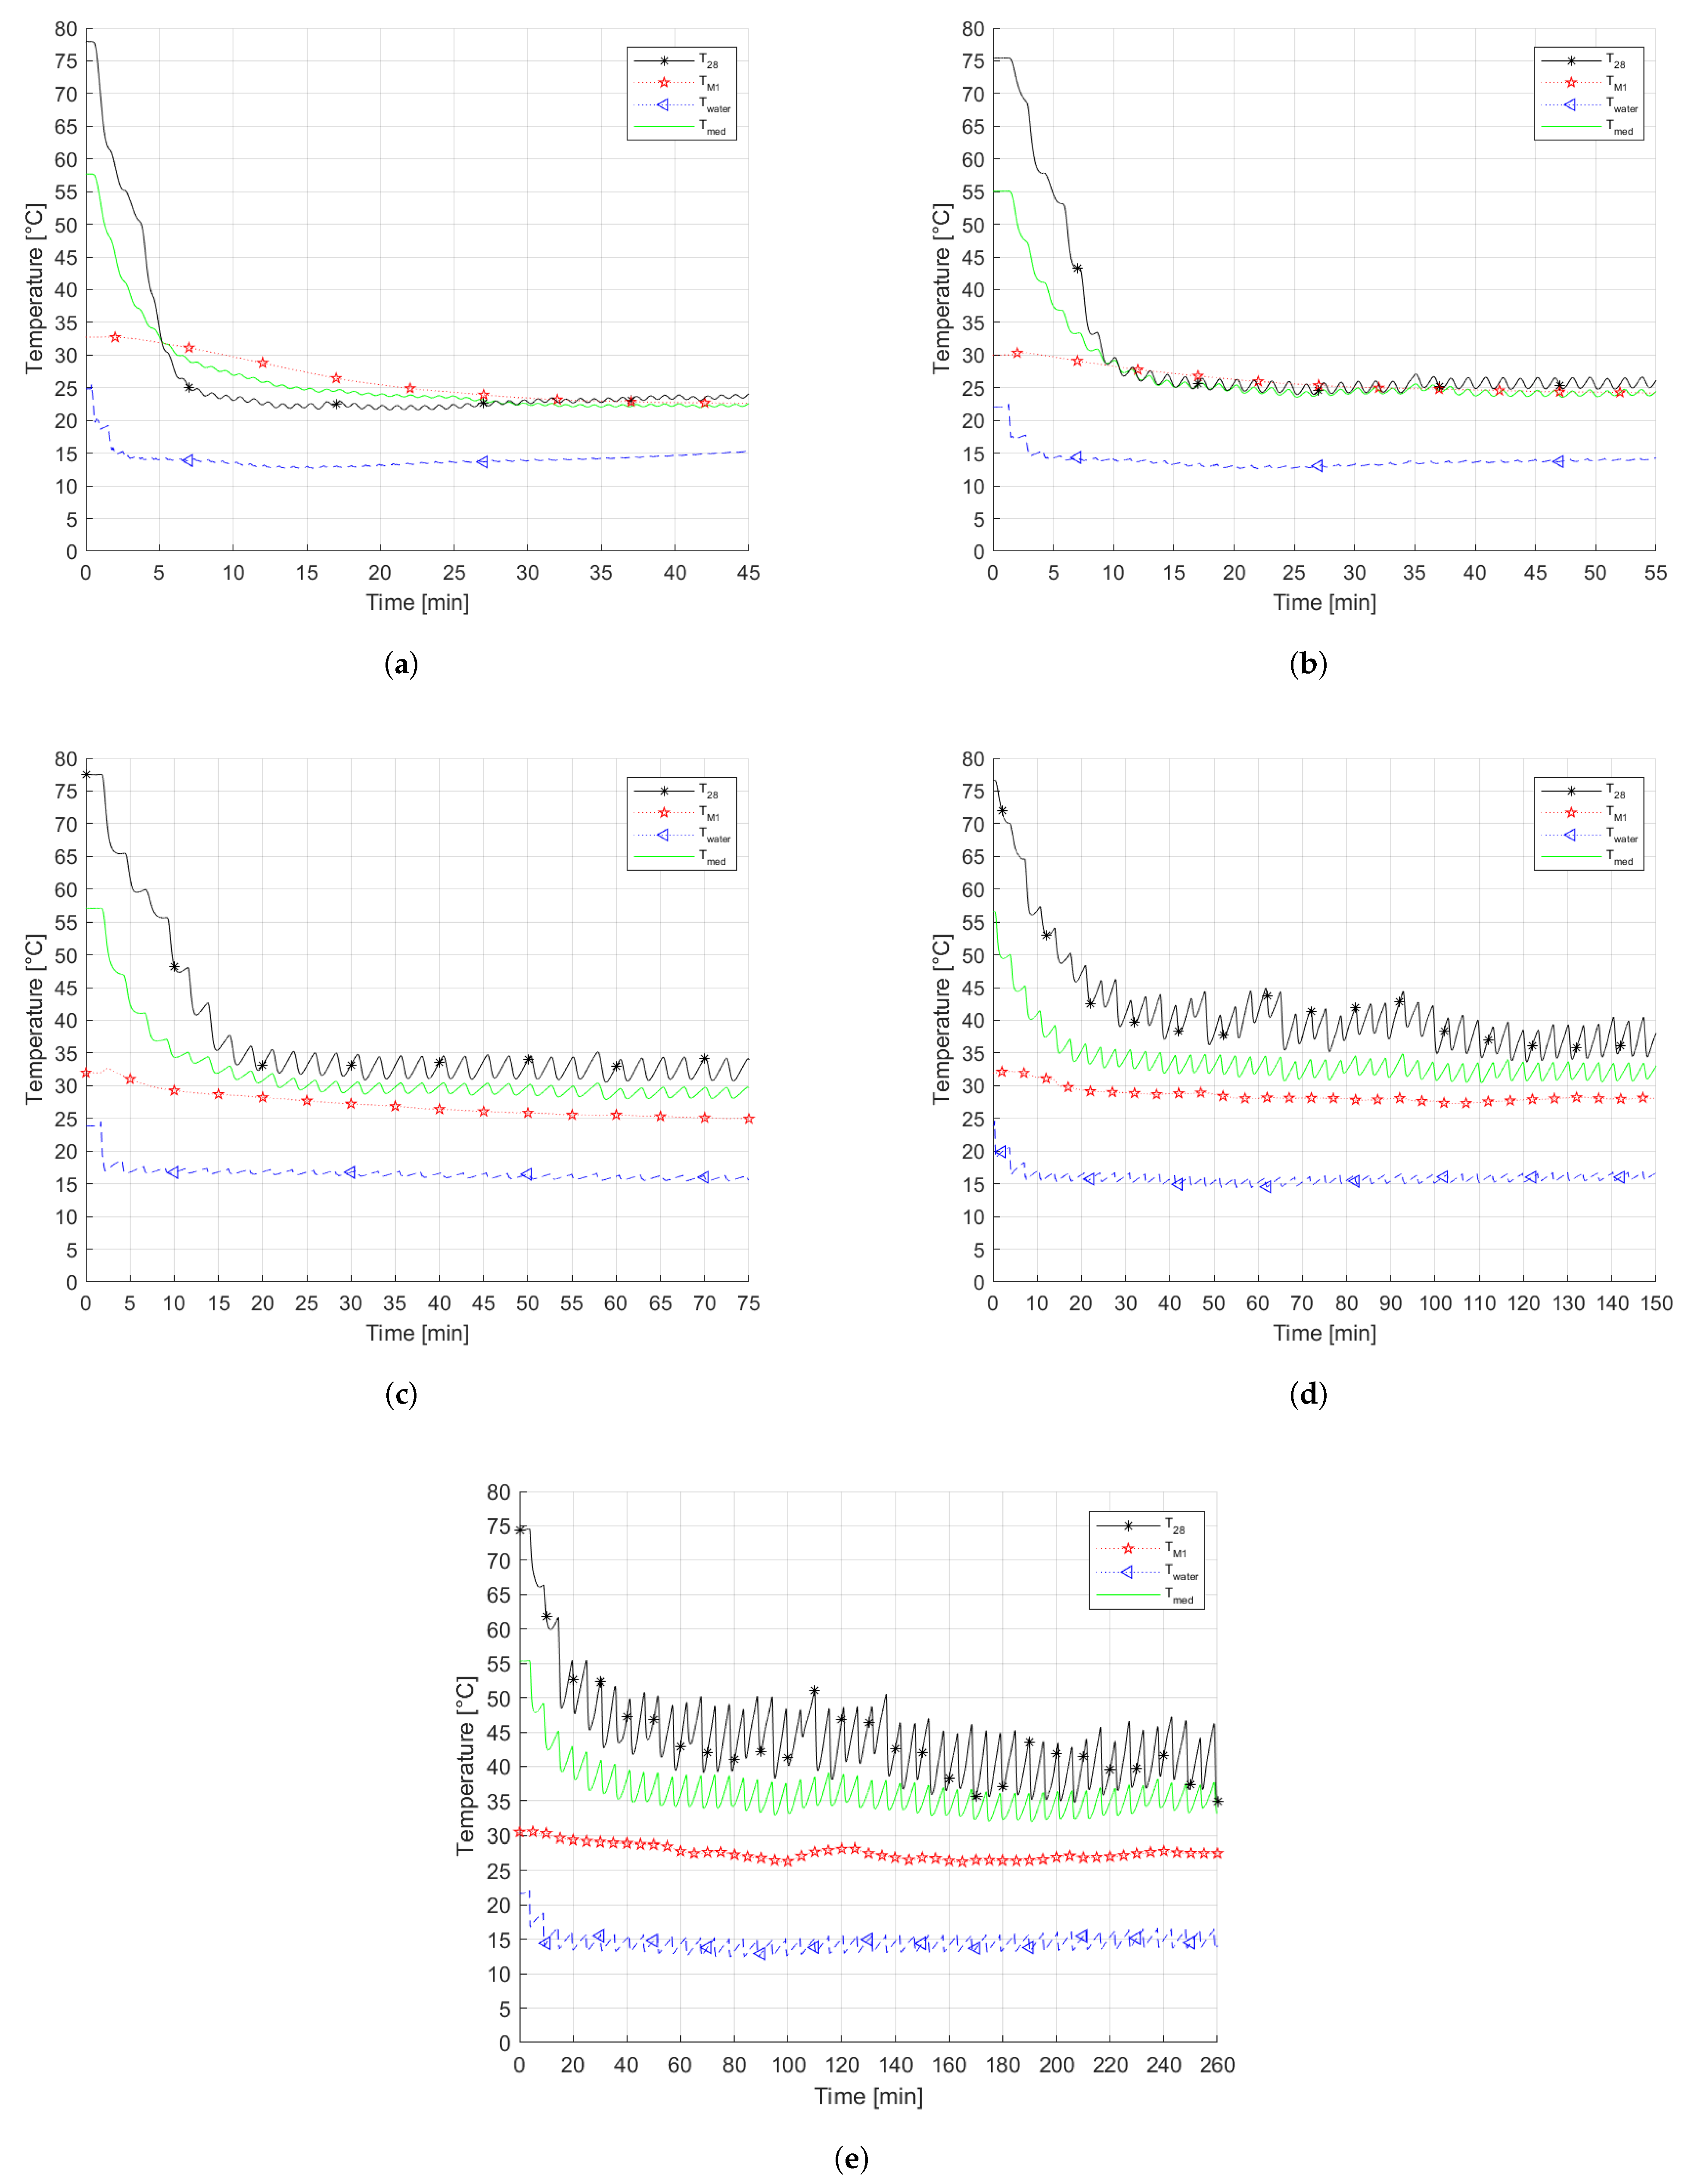
To make the film uniform and the water losses along the edges acceptable, the authors selected 1.5 bar as spraying pressure. Then, to develop a control strategy which reduces PV surface temperature and minimizes the water consumption, experiments are run adopting different ON/OFF cycles using in inlet spraying pressure of 1.5 bar. Temperature trends in the hottest (point 28) and coolest (point M1) as well as mean PV surface temperature (
) and water temperature are shown in
Figure 10 during different ON/OFF praying tests.
The first observation that can be derived from
Figure 10 is linked to the heating process of the water contained into the tube which fed the spraying apparatus. During the heating process, water temperature increases up to 12 °C in respect to waterworks temperature. In addition, as appreciable by comparing
Figure 10a,e, the longer the off time, the longer the time required by water temperature to reach waterworks temperature. Then, during the early spraying cycle, the cooling effect is reduced; a fact which extends the time required to the cooling system to reduce the module’s surface temperature. In addition, using an off time of 300 s provides sufficient time to lamps irradiance to increase the water temperature. The increment is only of 3–4 °C but sufficient to underline that it seams not useful to additionally increase the off period to do not compromise the cooling system performance.
However, it can be interesting to further study the water temperature increment during off period in order to understand the influence on thermal shock. In fact, a gradual surface temperature reduction arising from relatively long off period can avoid thermal shock and PV materials degradation as well as favor the heat rejection by water self-evaporation. Obviously, for equal activation of the cooling system, the longer the off period, the lower the sprayed flow rate. Furthermore, the PV surface temperature reduction, the daily water consumption, the required pumping energy, and pump start-up and shut-down are reduced. In addition, it is important to note that in on-earth PV facilities, to avoid water temperature increment, the tubes and the water tank need to be bury and/or insulated. Actions which increase the cooling system costs as well as complicates the system architecture. For these reasons, the authors need to further investigate these aspects with field tests and economic evaluations based on ground-mounted solar panels.
The analysis of
Table 2 clearly shows that the PV mean temperature is reduced from 57.69 to 22.27 °C, namely, 35.42 °C of temperature reduction by a 30–30 s. However, to reach stability, the PV mean temperature needs 40 min. Therefore, if the cooling systems run for 6 h per day, the water consumption per PV panel is approximately 420 L, which means in the case of a 1 MW plant, approximately 1870 m
. Adopting 30–300 s cycles, 19.7 °C of temperature reduction is observed for the PV mean temperature. However, as shown in
Figure 10e, continuous fluctuation is detected due to the most extended period in which the cooling system is turned off. Therefore, as give in
Table 2, the fluctuation is in the range ±1.62 °C. Contrary, in the case of 30–30 s cycle, the temperature fluctuation after reaching the stability is only ±0.18 °C. However, despite the fluctuations detected by the thermocouples, the mean PV surface temperature drops below the NOCT temperature. Therefore, also with this management strategy, a positive effect is obtained. Another important aspect is the sprayed water reduction compared to 30–30 s: water consumption is five times lower. Despite the positive effect of water-saving, 30–300 s cycle tests revealed an important drawback: limestone formation on the PV surface. In fact, during the period with no-spray, the water on the panel evaporates and the limestone contained in water deposits. An important issues detected using water coming from waterworks which can be further investigated also in the case of using lake, river or sea water because it is infeasible to demineralize the water before being sprayed. Then, 30–300 s cycles cannot be implemented due to high limestone formation, while 30–30 s cycle management strategy is unenforceable due to the high required flow rate per single module.
Comparable PV mean temperature reduction can be computed in the case of 30–60 s (30.78 °C), 30–120 s (28.14 °C), and 30–180 s (24.3 °C) as listed in
Table 2. Besides, no limestone formations on the PV surface are detected during the experiments. Therefore, the three management strategies can be adopted to cool the PV module. However, in the 30–180 s cycles, the water consumption is hugely reduced compared to 30–60 s. In terms of self-evaporation, computations reveal that, with 30–180 s cycles, the evaporated flow rate is 3–4% of the sprayed water.
The non-cooled module reaches an average efficiency of 11.18% while its power is 178.88 W. Adopting a 30–30 s cooling strategy permits reaching an efficiency of 13.74% and a power of 219.89 W. This means boosting of 22.9% the electricity generation of the single module. In the case of a 30–180 s cooling strategy, the efficiency reaches the 13.27% while the module production is increased up to 212.31 W.
To better understand the techno-economic feasibility of the proposed cooling system, the results of the experimental campaign are transferred to a floating PV facility constituted by 4438 PV panels and with a peak design power of 1 MW. The cooling system is applied to the modules, enters in operation when the mean PV temperature reaches the stability at a temperature higher than 50 °C, performs 30–180 s cooling cycles and works for 6 h a day (from 10 a.m. to 4 p.m.). Note that this managing technique is the most simple one. However, at the time of writing, the authors are involved in developing a control strategy that starts the cooling procedure when the NOCT temperature is exceeded and works to maintain the module temperature at least 10 °C below the NOCT.
Apart from the future improvements, the actual cooling system is equipped with a pump which charges 317 pressurized water tanks. From each tank, the water fed the nozzles of every single panel. The cooling system’s architecture is complicated because it needs to guarantee the spraying pressure of 1.5 bar. The single PV module efficiency and generated power without the cooling system are equal to 11.18% and 178.88 W, while, with the adopted cooling technique, they reach 13.27% and 212.31 W, respectively. Therefore, the produced power by the 4438 modules is 942.23 kW instead of 793.87 kW reachable without the cooling system. Based on preliminary calculations on the pump peak power (approximately 120 kW) and thanks to the installation of pressurized tanks, during the six hours of cooling, the pump work for 0.81 h. This means a power consumption of 97 kWh. Therefore, considering the extra production achievable in the 6 h with the cooling system (793.1 kWh), it can be stated that the cooling system installation is feasible from an energy point of view.
Considering that water is freely available, as the plant is a floating facility, the cooling system equipment plus installation cost is approximately 250,000 Euro, although the price per single panel of the cooling equipments is less than 15 Euro. In practice, to guarantee a stable spraying pressure in each panel, it is necessary to install a pressurized tank every 14 modules and fed each module in parallel. Therefore, each module requires an ON/OFF valve to perform the spraying cycles. The proposed configuration is complicated and challenging to manage. Then, considering the complexity, the high investment costs, and the need to reach payback period less than three years (a request of the PV owner), the investment is not eligible for financing also in the case of a 1 MW floating PV facilities where water is freely available. In a nutshell, the proposed system is very effective and promising from an energy point of view in floating PV installation or in a facility where water is available for free. However, the high investment cost and the increased complexity of the cooling system arrangement linked to the need of constant spraying pressure, lead researchers to study alternative layout and management strategies.


