
Design and Development of Unibody Quadcopter Structure Using Optimization and Additive Manufacturing Techniques
by
 , , ,
, , ,
Sagar Nvss
1 ,
,
Balasubramanian Esakki
2,*,
Lung-Jieh Yang
3 ,
,
Chandrasekhar Udayagiri
4 and
Kameswara Sridhar Vepa
5 1
Design Prototyping Centre & Mechanical Division, Engineering Staff College of India, Hyderabad 500032, India
2
Department of Mechanical Engineering, Vel Tech Rangarajan Dr Sagunthala R & D Institute of Science and Technology, Chennai 600062, India
3
Department of Mechanical Engineering, Tamkang University, New Taipei City 251301, Taiwan
4
Advanced Technology Centre, Wipro3D Bangalore, Bangalore 560058, India
5
Department of Mechanical Engineering, GITAM Deemed to be University, Hyderabad 502329, India
*
Author to whom correspondence should be addressed.
Designs 2022, 6(1), 8; https://doi.org/10.3390/designs6010008
Submission received: 5 November 2021
/
Revised: 18 January 2022
/
Accepted: 19 January 2022
/
Published: 22 January 2022
(This article belongs to the Special Issue Unmanned Aerial System (UAS) Modeling, Simulation and Control)
Abstract
:Quadcopters represent rotary wing configuration of the Unmanned Aerial Vehicles (UAVs) with immense application potential in industrial and strategic contexts. Tradeoff between flight endurance and payload capacity renders design optimization of UAVs a critical activity with substantial impact on the application possibilities. Among the structural parts of a typical Quadcopter, the central body frame constitutes major portion of the total weight. The present study aims at reduction of the frame weight while conforming with structural integrity requirements, through an integrated approach involving topology optimization, part consolidation and design for additive manufacturing (DFAM). Commercial UAV designs consist of multiple parts and fastening elements that necessitate considerable time and effort for assembly. This study reengineers the frame as a monocoque structure with desirable outcomes of weight reduction and less assembly time. The reengineered Quadcopter structure is manufactured through Fused Filament Fabrication (FFF) and characterized with reference to structural, vibrational and fatigue characteristics. Concomitant application of modal analysis, computational fluid dynamics and wind tunnel testing reveals close match between theoretical estimates and experimental results. Assembly and field trials of the monocoque Quadcopter structure affirm betterment of operational superiority and endurance vis-a-vis commercial UAV designs.
1. Introduction
Unmanned aerial systems, popularly known as drones, have found significant uses in aerospace, strategic and civil sectors due to their inherent advantage of deployment at the desired locations [1,2]. Due to numerous advantages, the world is witnessing a significant increase in the usage of drones, especially in civil and defense missions [3]. Technological advancements in manufacturing, navigation and control systems made feasible developing drones in an ample range of applications. For various scientific and research tasks, UAVs are deployed in multifaceted environments such as remote observation of wildlife and analysis of different environmental parameters [4]. Some more applications ‘include extraction of volume data from quarries, inspection of plants for precision agriculture, communication antenna, inspection of power lines [5,6,7,8], etc. In addition, multirotor UAVs have been predominantly utilized for short range navigation [9,10,11] due to their hovering, vertical take-off and landing and high maneuvering capabilities. The main parameters that decide the success of a Quadcopter are its manufacturing cost and structural integrity [12]. It is essential to reduce the weight of the Quadcopter frame so that the Quadcopter can carry better payloads. Hence, optimization with regards to lower weight and high strength is of utmost importance/essential. One of the critical advancements that took the design of light-in-weight Quadcopters to the next level is to fabricate the structure using additive manufacturing (AM) [13]. Klippstein et.al. [14] discussed successful applications of FFF in the field of UAV industry, which represents the potential of AM in the context of UAVs. It was concluded that complex structures and even embedded electronics of UAVs can be built successfully with the use of FFF technology. Parts built using FFF will reduce the weight and show improvement in the UAV’s aerodynamic performance and structural efficiency. A cost effective and aerodynamically efficient Quadcopter is very much needed for swift maneuvering and being capable to handle large payloads. Reducing the structural weight is a primary concern to improve the performance of UAVs, increase their payload carrying capacity and enhance the endurance. Another major challenge in the Quadcopter is that the structure typically consists of multiple modules that necessitate dedicated efforts on assembly. The central structure of the load carrying member for a specific payload has to be designed to withstand the thrust loads. The designed structure has to be assembled with screws, nuts and drilling of holes, requiring considerable time and assembly skills, which preclude their application in many sectors. Hence, there is a need to develop a lightweight monocoque Quadcopter structure with the least number of parts so that the assembly effort is reduced, structural integrity is enhanced and ease of deployment is greatly facilitated.
The conventional structures are made of carbon fiber-based composites, but the fasteners and casings are metallic. Most of the Quadcopters have inadequate structural integrity, due to which they disintegrate on high-impact landings, have considerably low endurance and more importantly, they necessitate substantial assembly effort due to multiple parts. Because of their structural weight, most of the Quadcopters have limited flight endurance and payload capacity. Thus, optimization of structural weight is of utmost importance for enhancing flight time and payload capacity.
Hence, this work aims to build a unified body of the Quadcopter central frame structure. The following are the advantageous of the proposed structure:
- It reduces assembly time.
- There is no joint failure as observed in the assembled models.
- Enhanced structural integrity.
- Due to non-usage of nuts and bolts, the weight of the entire structure is reduced.
In order to achieve a unified structure, the AM technique is envisaged. AM is a disruptive technology [15] through which realization of functional parts and reducing the weight of existing components can be effectively achieved. The high design flexibility, easier manufacturing process and usage of a minimal number of tools leads to the use of AM for realization of the functional components quickly [16]. Hence, the Quadcopter structure can be fabricated using AM technologies to attain a high strength to weight ratio.
This work delineates the design of the lightweight structural frame of the Quadcopter to carry an all-up weight of 2 kg. Research proves that the structural performance of UAV can be enhanced by reducing its weight. In general, the structural frame of the Quadcopter constitutes 30% of its total weight. In view of this, the present research work is focused on reducing the weight of the frame. To achieve this, the concept of topology optimization is used. Topology optimization results in complex and uneven shapes [17]. Fabricating those parts is indeed a quite challenging task by using conventional manufacturing methods. Hence, AM technologies are preferred to fabricate such models. From the literature, it is observed that the combination of topology optimization along with additive manufacturing technology is well utilized in manufacturing the complex and light weight UAV structures [18,19]. Hence, the proposed work attempts to manufacture the optimized Quadcopter frames using FFF through incorporating guidelines of DFAM [20].
1.1. Context of UAV Development Using 3D Printing
AM technologies are gaining acceptance for the fabrication of prototypes and functional parts in several sectors. The present study primarily focuses on developing AM technologies for the gainful development of UAVs. Due to advantages of design freedom and time compression, realizing AM technologies in UAVs development, redesigning the components is imperative.
Apart from universities, research centers and industries, FFF technology deployment by researchers has proven the importance of FFF technology for the development of UAVs [21,22,23]. Complex shaped UAVs and their embedded electronics are printed successfully and demonstrate the enhancement in aerodynamics performance and structural efficiency of UAVs. Due to its ability and design freedom in printing the parts irrespective of its geometrical complexity, it is widely accepted in the fabrication of functional parts [24].
The basic objective of any UAV design is to restrict overall weight with adequate structural integrity. Even though UAV structures can be fabricated using AM technologies, the literature available is scarce. The present work focuses on prototyping of a UAV structure using low-cost desktop 3D printers.
1.2. Topology Optimization
While designing a structure, there is always a tradeoff between weight and strength. For this, the designer needs to balance this trade off because the strength of the part reduces with the decrease in weight. Topology optimization [25] allows the engineer to find the optimum weight with sufficient strength to withstand the loading conditions. Finite Element Analysis (FEA) plays an important role in the process of topology optimization; in a single word, topology optimization cannot be performed without FEA; because topology optimization takes FEA results as input and starts optimizing the part by deleting the unwanted elements.
Topology optimization is a numerical method used for optimizing the material distribution in a component while maintaining its functional requirements [26]. Topology optimization is used not only to design a new product but also to modify an existing product [27]. This method helps to cut down the component weight by eliminating the unwanted material based on the objective function and specified constraints. Owing to its high geometrical design freedom, this method is particularly suited for aerospace applications [28,29]. The major difference between the shape and topology optimization is that the topology optimization will work on reduction of weight by optimally distributing the weight whereas the shape optimization will work around the known geometries [30,31]. Hence, the resulting shape obtained from the topology optimization is organic and unique in nature.
Typically, the process of topology optimization involves the following steps [32]:
- In the first step of topology optimization, the model need be partitioned to the design space (the area that needs optimization) and non-design space (the area that should not be modified).
- In the next step, the part is analyzed for finite element analysis with the provided loading and boundary conditions for analyzing the stress distribution and deformation.
- This is followed by topology optimization to eliminate the material at the space where loading does not affect by the applied load.
1.3. Design Methodology
In order to achieve the desired objectives of the research, the following methodology is adopted:
- Design of Quadcopter structure for monolithizing through topology optimization and additive engineering followed by DFAM principles.
- Validation of redesigned model through FE analysis.
- Fabrication using Fused Filament Fabrication (FFF).
- Experimental validation for optimized 3D printed structure using wind tunnel and CFD simulations.
- Experimental analysis for measurement of strain using strain gauge.
- Field trials in both indoor and outdoor environments.
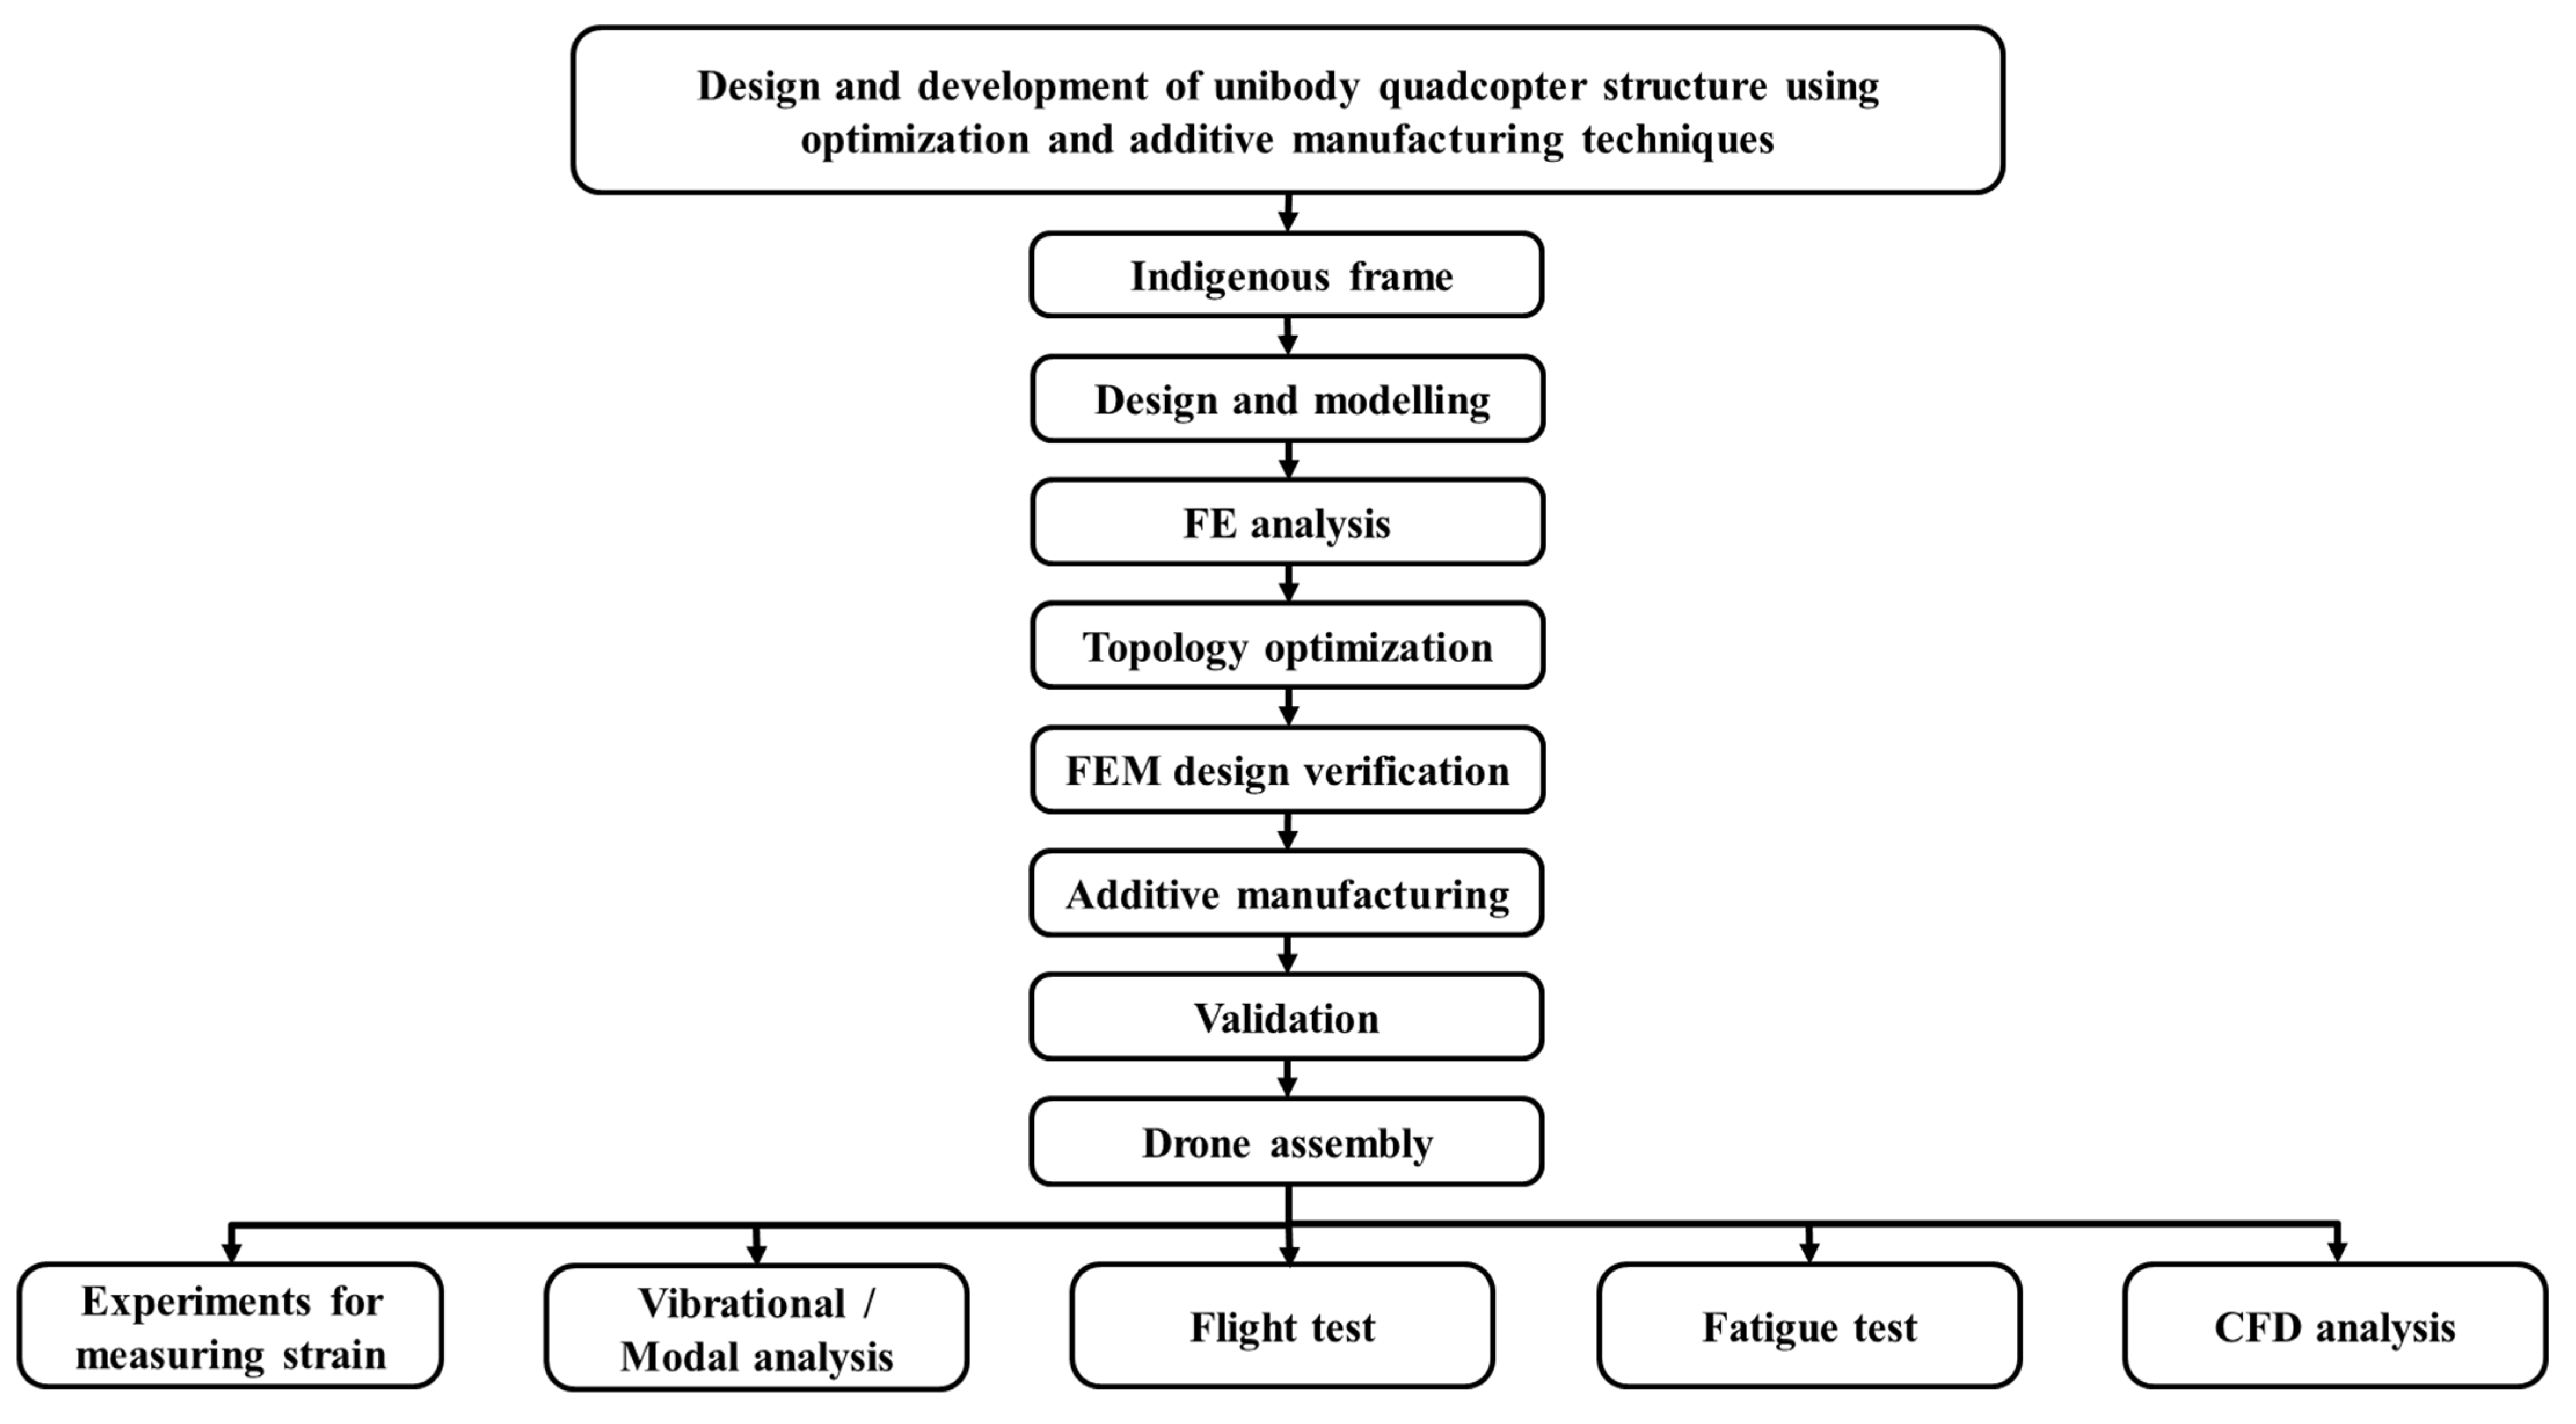
- The methodology carried out in this work is schematically represented in Figure 1.
The scientific benefits of this work are:
- A design process is proposed/suggested to design and develop a quadcopter frame with optimum weight and with unified body as per the payload requirements.
- As the design is based on topology optimization, only the required material is utilized by avoiding unwanted material.
- The scientific principles such as finite element analysis and computational fluid dynamic analysis are well exploited to understand the structural integrity and flow characteristics during hovering and forward flight conditions are comprehended.
- Experimental analysis provides a vital role to understand the vibration characteristics, and real time flight trails give stability characteristics of the Quadcopter for various wind conditions.
In this work, diverse scientific techniques and methodologies are adopted to understand the various characteristics of the Quadcopter structure.
2. Design of Monocoque Quadcopter Structure Using Topology-Based Optimization and Additive Manufacturing
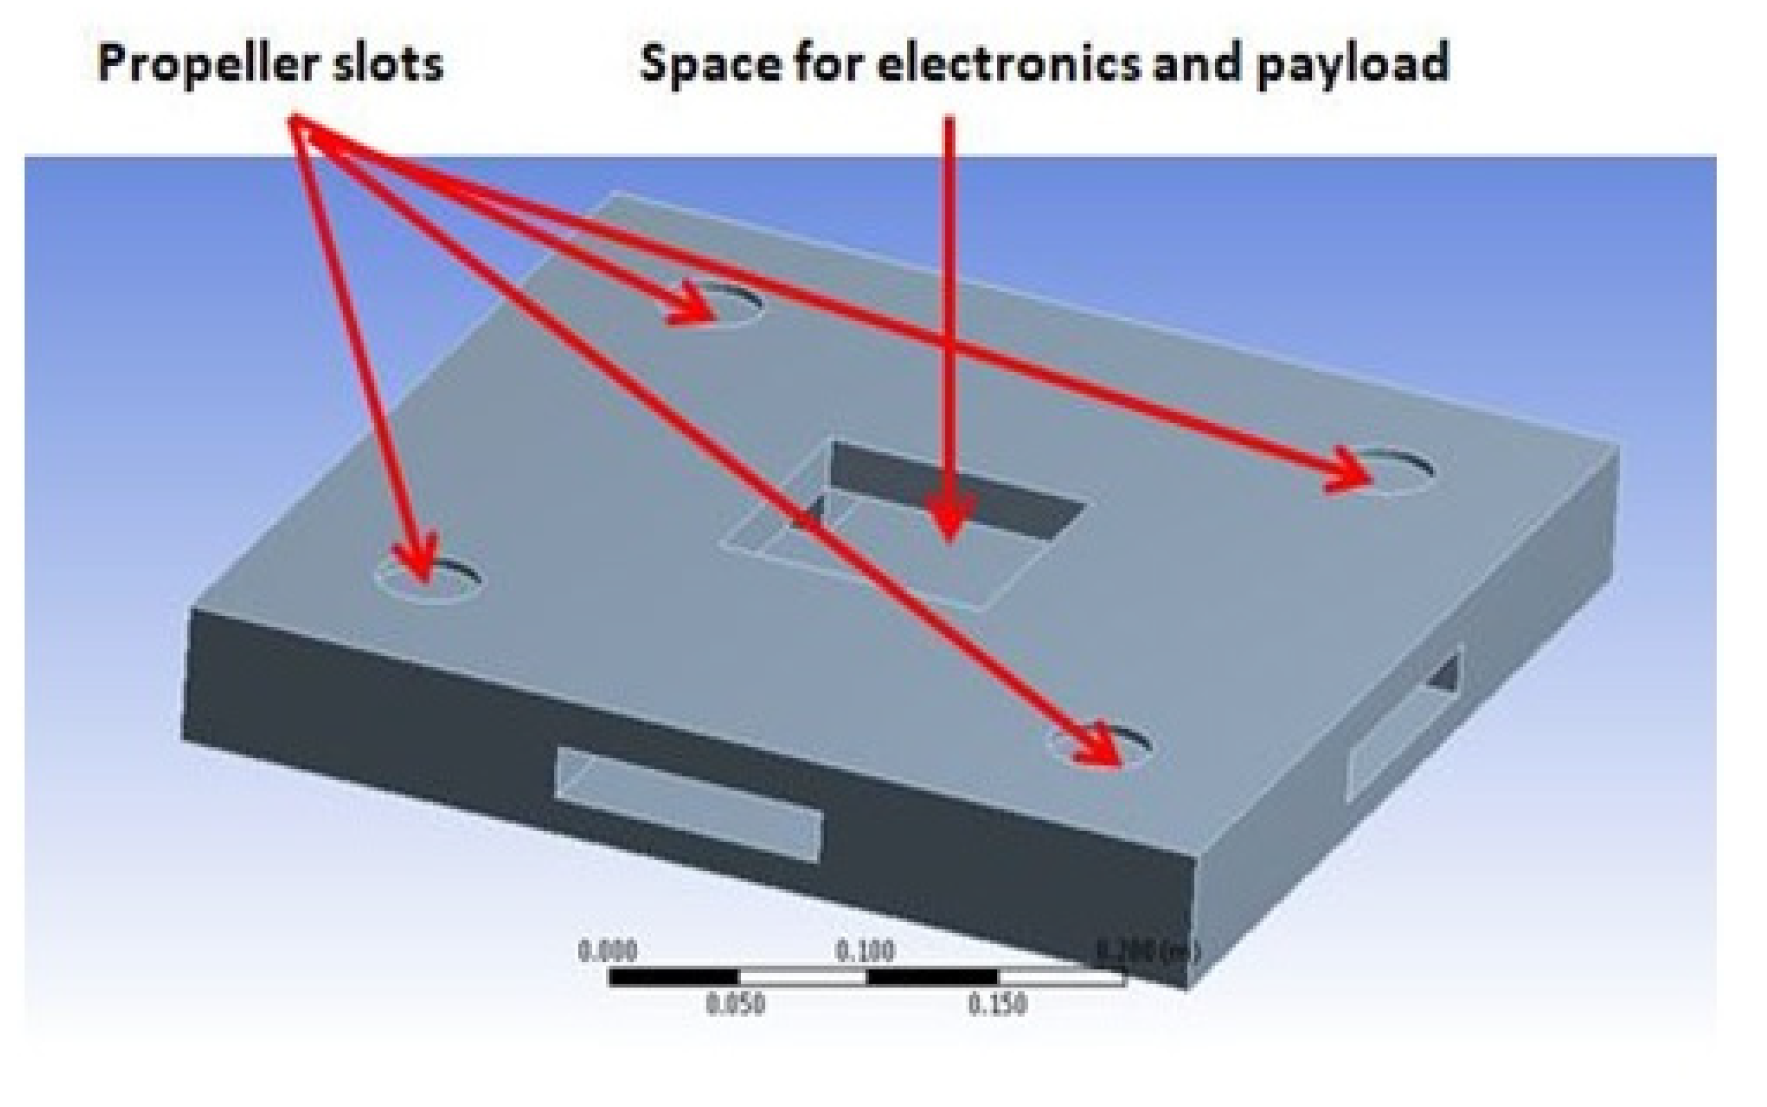
The design is initiated with a frame of diagonal length 330 mm and by considering Acrylonitrile Butadiene Styrene (ABS) as the material. Initially, basic primitives like square, hexagonal and circular cross-sectional blocks are considered as the initial geometry (design domain as shown in Figure 2). All the elements excluding the elements that are subjected to loading and boundary conditions are taken as design space whereas other elements are considered as non-design space. The properties of the material are given in Table 1 [33,34,35].
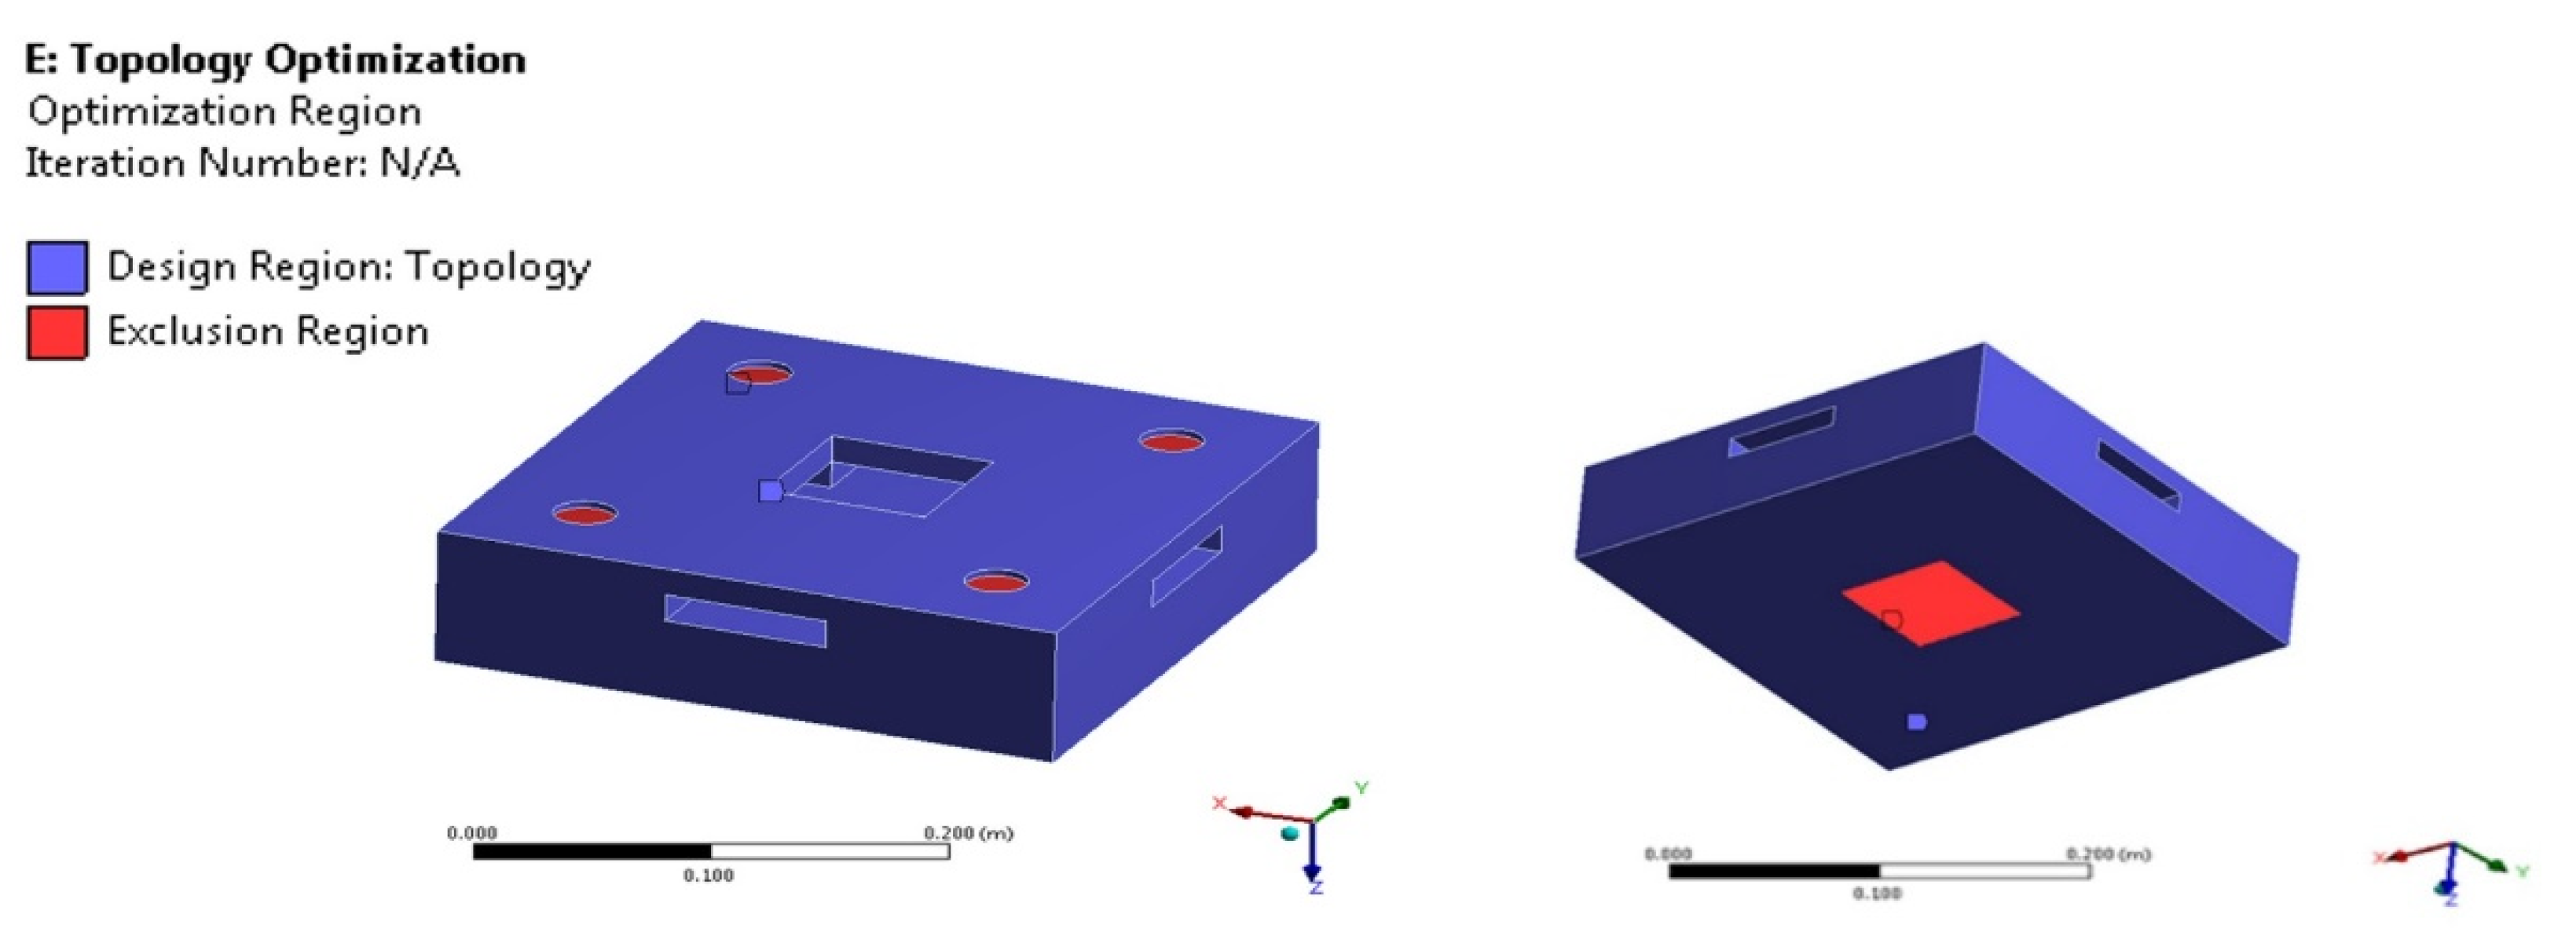
In these three models, the four slots which are used to place motors subjected to loading and the bottom plate which is used for landing and housing of electronics are identified as non-design spaces. For this, a displacement boundary condition is provided. All remaining elements are identified as the design space. Reducing the mass is chosen as the objective function for the topology optimization while limiting the maximum stress in the model below allowable stress of the material.
Among all the shapes, the geometry with square cross section yields with minimal weight after the process of topology optimization. Hence, it is considered for optimization. Figure 3 [36] shows the basic geometry with design as well as non-design spaces. The region considered for optimization is blue in color whereas the region excluded from the domain are red in color, as shown in the Figure 4. The design space is discretized into elements with a maximum size of 1 mm. Among the non-design space are propeller slots and base plate.
2.1. Finite Element Analysis
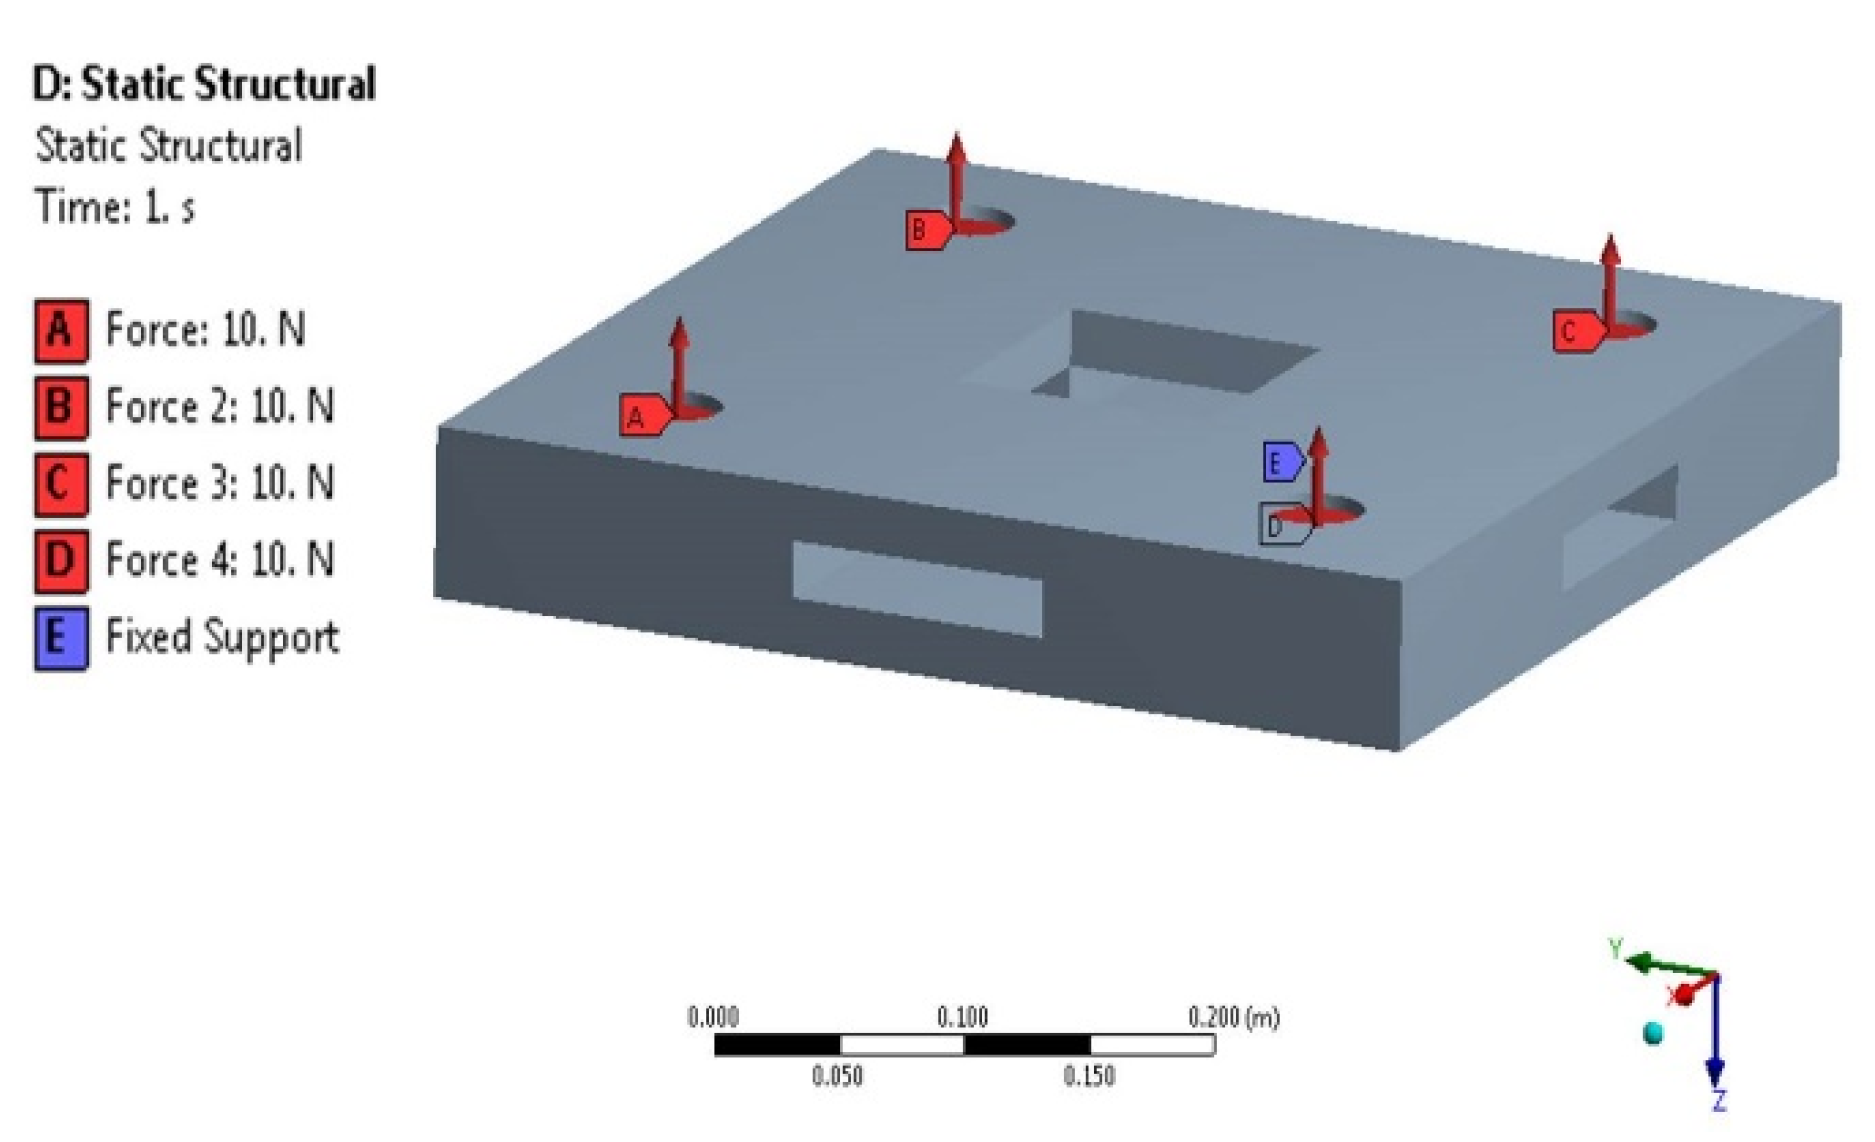
ANSYS DesignModeler is utilized for obtaining the basic geometry of the solid domain. For better discretization of the design space, meshing is done using block meshing in the ANSYS ICEM CFD platform instead of an automatic mesh generation tool. The meshed CAD geometry is divided into a total of 424,430 hexahedral elements. ABS is used as the material and finite element analysis is carried out for evaluating the values of deformation and stress concentration. Only one displacement boundary condition is given, i.e., a fixed boundary condition at the center of the frame. Thrust forces are applied at each of the four propeller slots (Figure 5).
2.2. Topology Optimization
Minimization of the compliance matrix is considered the objective function of the topology optimization problem along with mass minimization. Mechanical properties of the material dictate the usage of the constraints.
2.2.1. Problem Definition
Typically, the goal of topology optimization is to minimize the weight based on the prevailing stress field. Optimization of any structure helps to reduce the weight which helps to achieve higher thrust to weight ratio. For achieving this, stress-based topology optimization is carried out using the Solid Isotropic Microstructure with Penalization (SIMP) method in ANSYS software.
2.2.2. Objective Function
Generally, there are three types of objective functions: minimization of mass, minimization of volume and minimized compliance. The most common used is minimizing compliance which is a synonym of maximizing the stiffness. In this specific model, minimization of compliance and mass are considered as objective functions while keeping stress within allowable limits.
2.2.3. Design Constraints
Design constraints restrict the value of the design response. During the process of optimization, the desired response can be controlled by including specific constraints. The allowable stress of ABS material is 40 MPa. Hence, by considering 2 as the factor of safety, the stress is limited to 20 MPa.
2.2.4. Manufacturing Constraints
As additive manufacturing is chosen, the overhanging constraint is used, in which the maximum overhang angle can be defined. Based on the design for the additive manufacturing principle, the overhang angle is constrained to 45˚. In addition to this overhang constraint, cyclic and symmetry are also imposed.
Thus, by considering all these, the problem formulation is:
- Objective function: Minimizing structural compliance
- Design constraint: Minimization of mass
- Subjected to: von Mises stress ≤ 20 MPa
- Manufacturing constraint: Overhang angle = 45˚
The convergence accuracy taken for the optimization problem is 0.1%, whereas the penalty factor used is 3. In total, the optimizer took 21 iterations to realize the final model. The optimized model obtained is as shown in Figure 8. Where, Figure 8a shows the material retained against the initial geometry and Figure 8b shows the demarcated CAD model of the optimized structure.
2.2.5. Validation through Finite Element Analysis
The resulting model is then subjected to finite element analysis for validating the geometry, i.e., to check whether the stresses and strains (deformations) are within the allowable range. The displacement and loading boundary conditions are the same as those used before the optimization. The results obtained from the FE analysis are given in the Table 3.
The results mentioned in Table 3 show a maximum displacement of 0.11 mm and a maximum von Mises stress of 0.82 MPa is observed in the structure. It states that equivalent stresses for all locations were found below 40 MPa (maximum allowable stress), which are under safety limits with a factor of safety 2, representing that the optimized model is within limits.
2.2.6. Re-Design of Optimized Model
2.2.7. Validation through FE Analysis (Re-Analysis)
For validating, the optimized geometry is subjected to finite element analysis to ensure that von Mises stresses and deformations are within limits. The analysis is performed using the same displacement and loading boundary conditions that are used for topology optimization. The results indicate that the optimized model is within acceptable limits.
Results mentioned in the Table 4 shows a maximum displacement of 0.14 mm and a stress level of 3.02 MPa encountered, which are within the permissible limits. It renders the success of the model which can lift all-up a weight of 2 kg. The optimized model resulted with a weight of 0.337 kg. Table 5 presents the details of the initial model’s comparison to the final optimized model obtained by topology optimization.
3. Fatigue Analysis
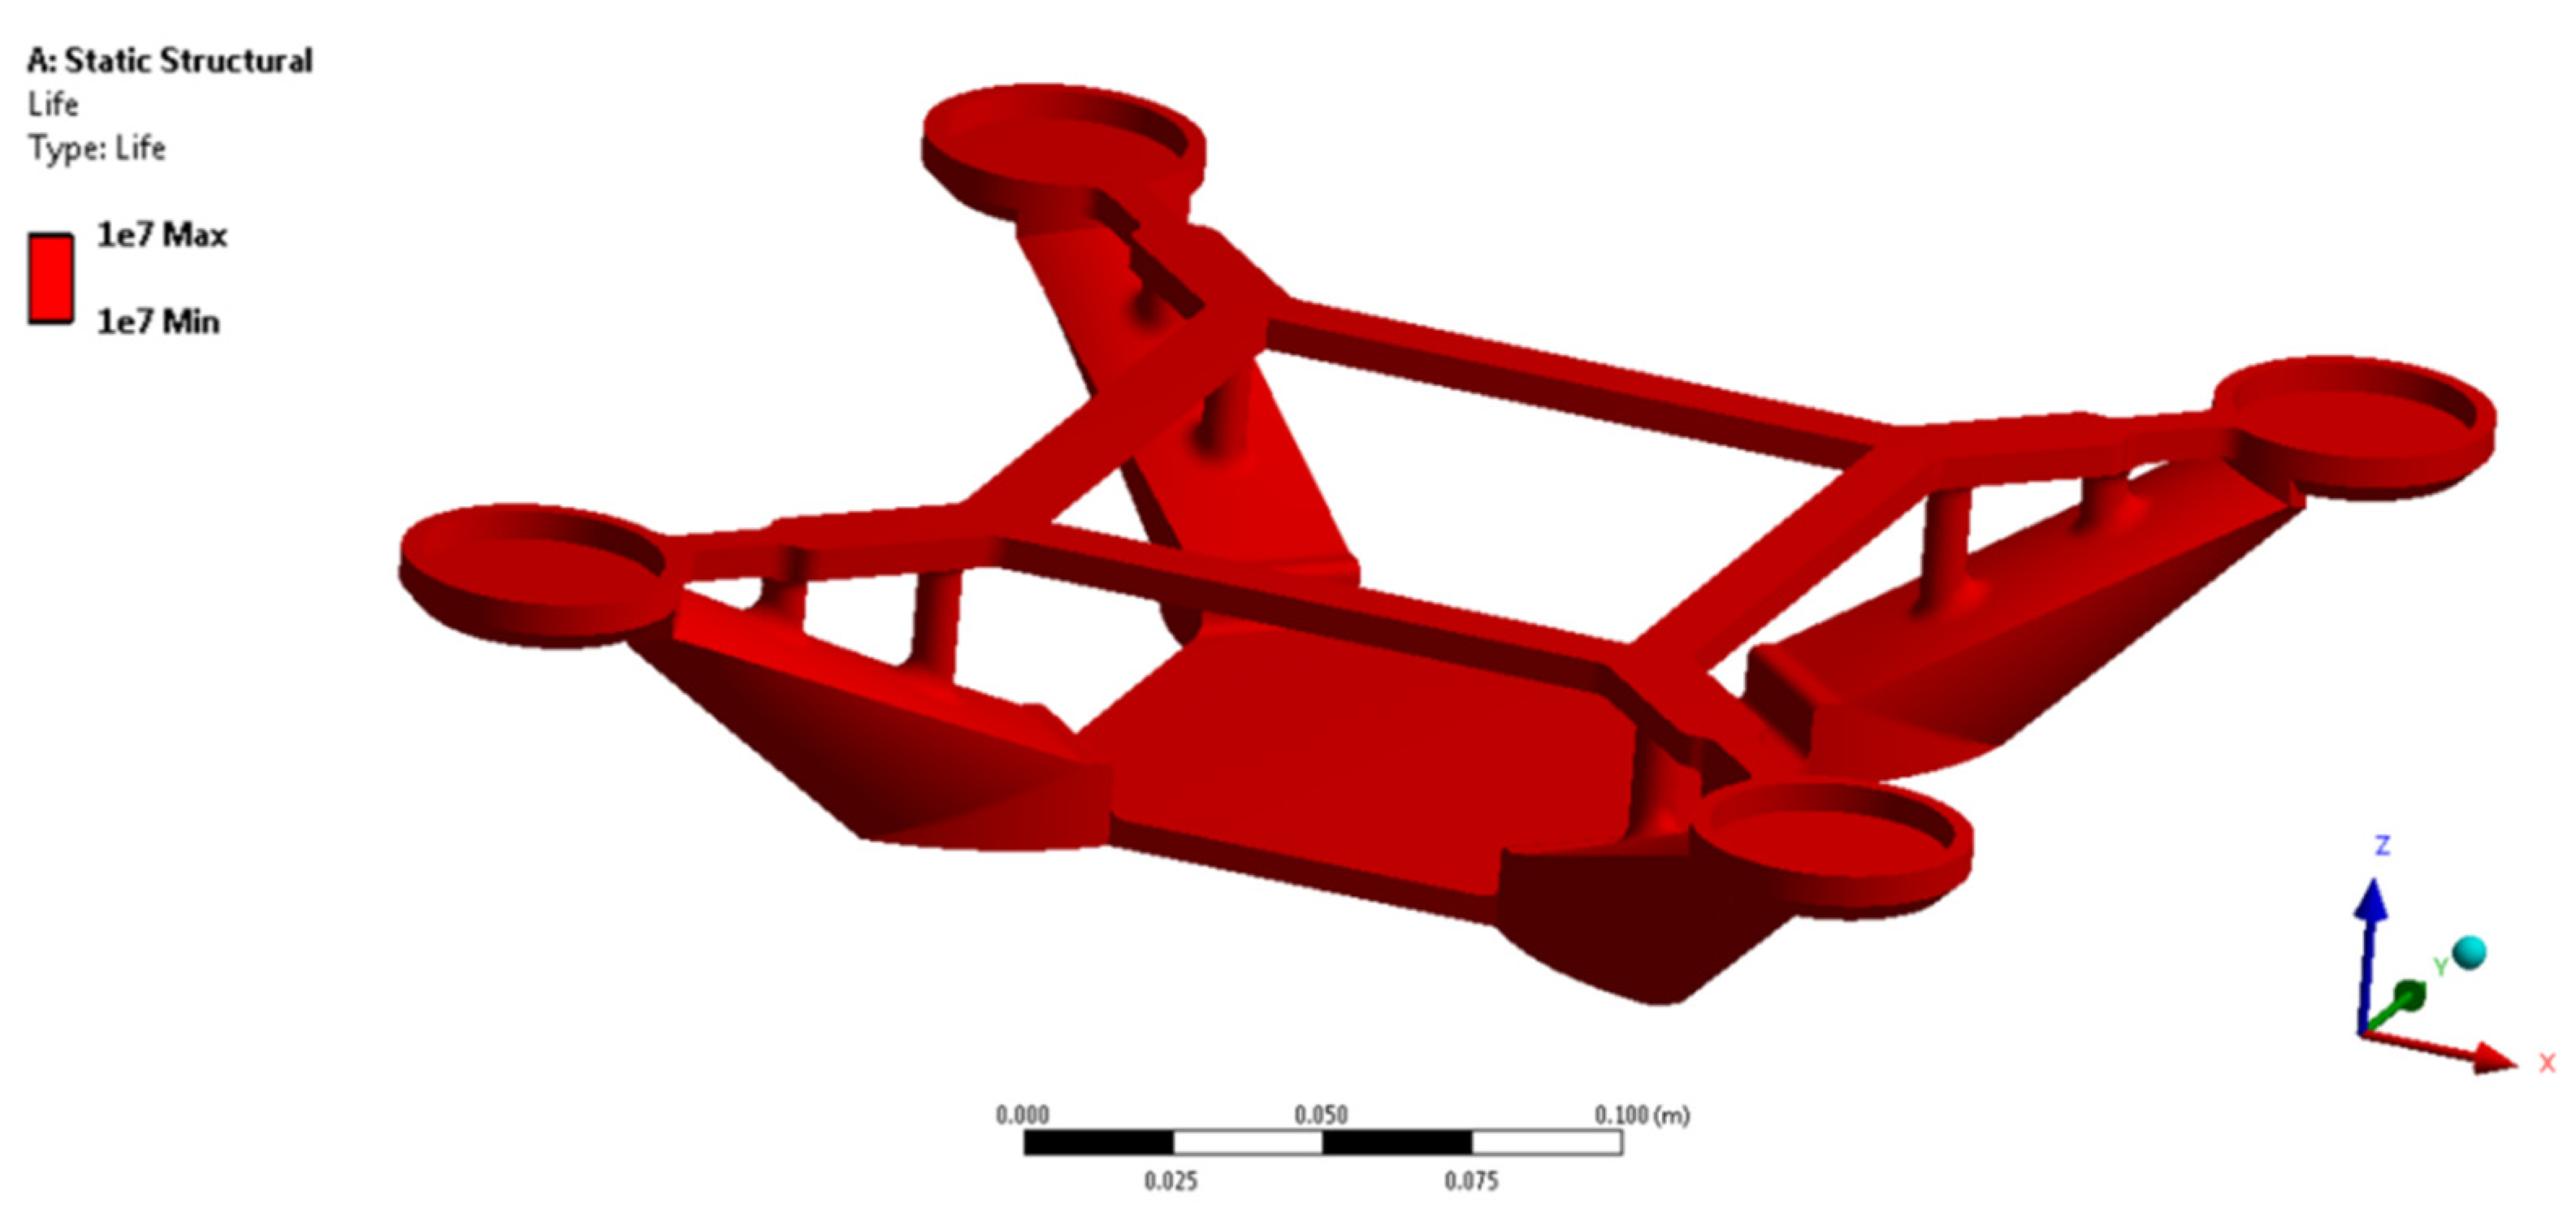
Typically, fatigue failure is one of the common reasons for the engineering structure’s failure. As most of the structure gets damage because of the fatigue load, it is the more significant to assess the operating life of any structure depending on its operating conditions and loading conditions. It is considered during design stage for preventing fatigue failure of the material and ensuring the factor of safety. Thus, fatigue analysis helps the designer to modify the design if required in the initial stage before manufacturing. The phenomena of fatigue analysis define the number of stress cycles a structure can withstand before its failure. ANSYS is one of the commercial softwares widely used for fatigue analysis for predicting the operating life of a structure. Hence, fatigue analysis is carried out for the optimized monocoque structure using ANSYS Workbench for analyzing its operating life. The theory of failure is utilized for the design under fatigue loading. S-N curve is generated by using the data of material properties mentioned in Table 1. The overall fatigue life is obtained by simulation as shown in the Figure 10. To determine the fatigue life of the Quadcopter structure, a high cycle fatigue test is conducted for 1 × 10⁷ cycles.
From the Fatigue analysis, the results show that the structure can withstand for 1 × 10⁷ number of cycles, which represents the life of the model, which is above 1 × 10⁷ cycles.
4. Fused Filament Fabrication of Optimized Quadcopter
Commercially available frames were manufactured using the process of injection molding. Since the resulting model obtained in topology optimization is complex, manufacturing of the structure using injection molding is always a challenging task. Hence, FFF is used for manufacturing, which is cost effective and versatile when compared with other AM techniques. The optimized monocoque structure is fabricated out of ABS material on the FFF printer. In FFF, reducing the printing time is of utmost priority. In addition, it is important to reduce the amount of support material used which is directly proportional to the manufacturing cost and time. Hence, Design for Additive Manufacturing (DFAM) concepts are adopted to reduce the printing time and support material consumption.
A 500 mm × 500 mm × 500 mm fully enclosed industrial grade 3D printer (AION 500) is used for fabricating the optimized monocoque model. The extruder of 0.4 mm diameter nozzle is utilized and the bed temperature is maintained at 70 °C. The specifications of the printer are as follows:
| : 955 mm × 1040 mm × 925 mm |
| : 1.75 mm |
| : 270 °C |
| : 2 |
| : 200 mm/s |
| : 15–30 cm3/hour |
| |
| : 0.1–0.25 mm |
| : 90 °C max |
| : Repetier, Cura, Kislicer, etc |
A eSUN 1.75 mm diameter White ABS Filament is used and the properties are given in Table 6.
4.1. Design for Additive Manufacturing
The manufacturing industry has seen a huge surge in implementing Design for Additive Manufacturing principles owing to its manufacturing feasibility. The main challenges of the FFF process like Overhang angle, orientation and the choice of support locations decide the success of the manufacturing process. In this specific model, DFAM rules like imposing overhanging angle constraint, coincident loading and printing direction and a minimum wall thickness of around 0.8 mm are adopted. This resulted in a printing time of 27 h. Of all the material used for printing this part, 66% of the material is utilized for printing the model whereas 34% is used for depositing the supporting material.
4.2. Part Building
Adding AM constraints in topology optimization eliminates the additional steps in interpreting the topology optimized results. Furthermore, it reduces the time of manufacturing and the amount of supporting material. While removing the supports, surface quality may be affected. In this work, topology optimization is carried out for the monocoque Quadcopter structure. To constrain the gradient compliances with respect to densities and converges, the result towards a structure with the least amount of overhang structures, the manufacturing constraint, namely, the overhang angle constraint is used. As a result, the considered model was generated with the arms greater than 45° from the horizontal. It leads to the utilization of less support with a reasonably high performance. Due to this, 23% of support material is saved in comparison to the model printed without the overhang constraint.
4.3. Build Time Analysis
The printing parameters considered for fabricating the optimized monocoque structure are provided in Table 7.
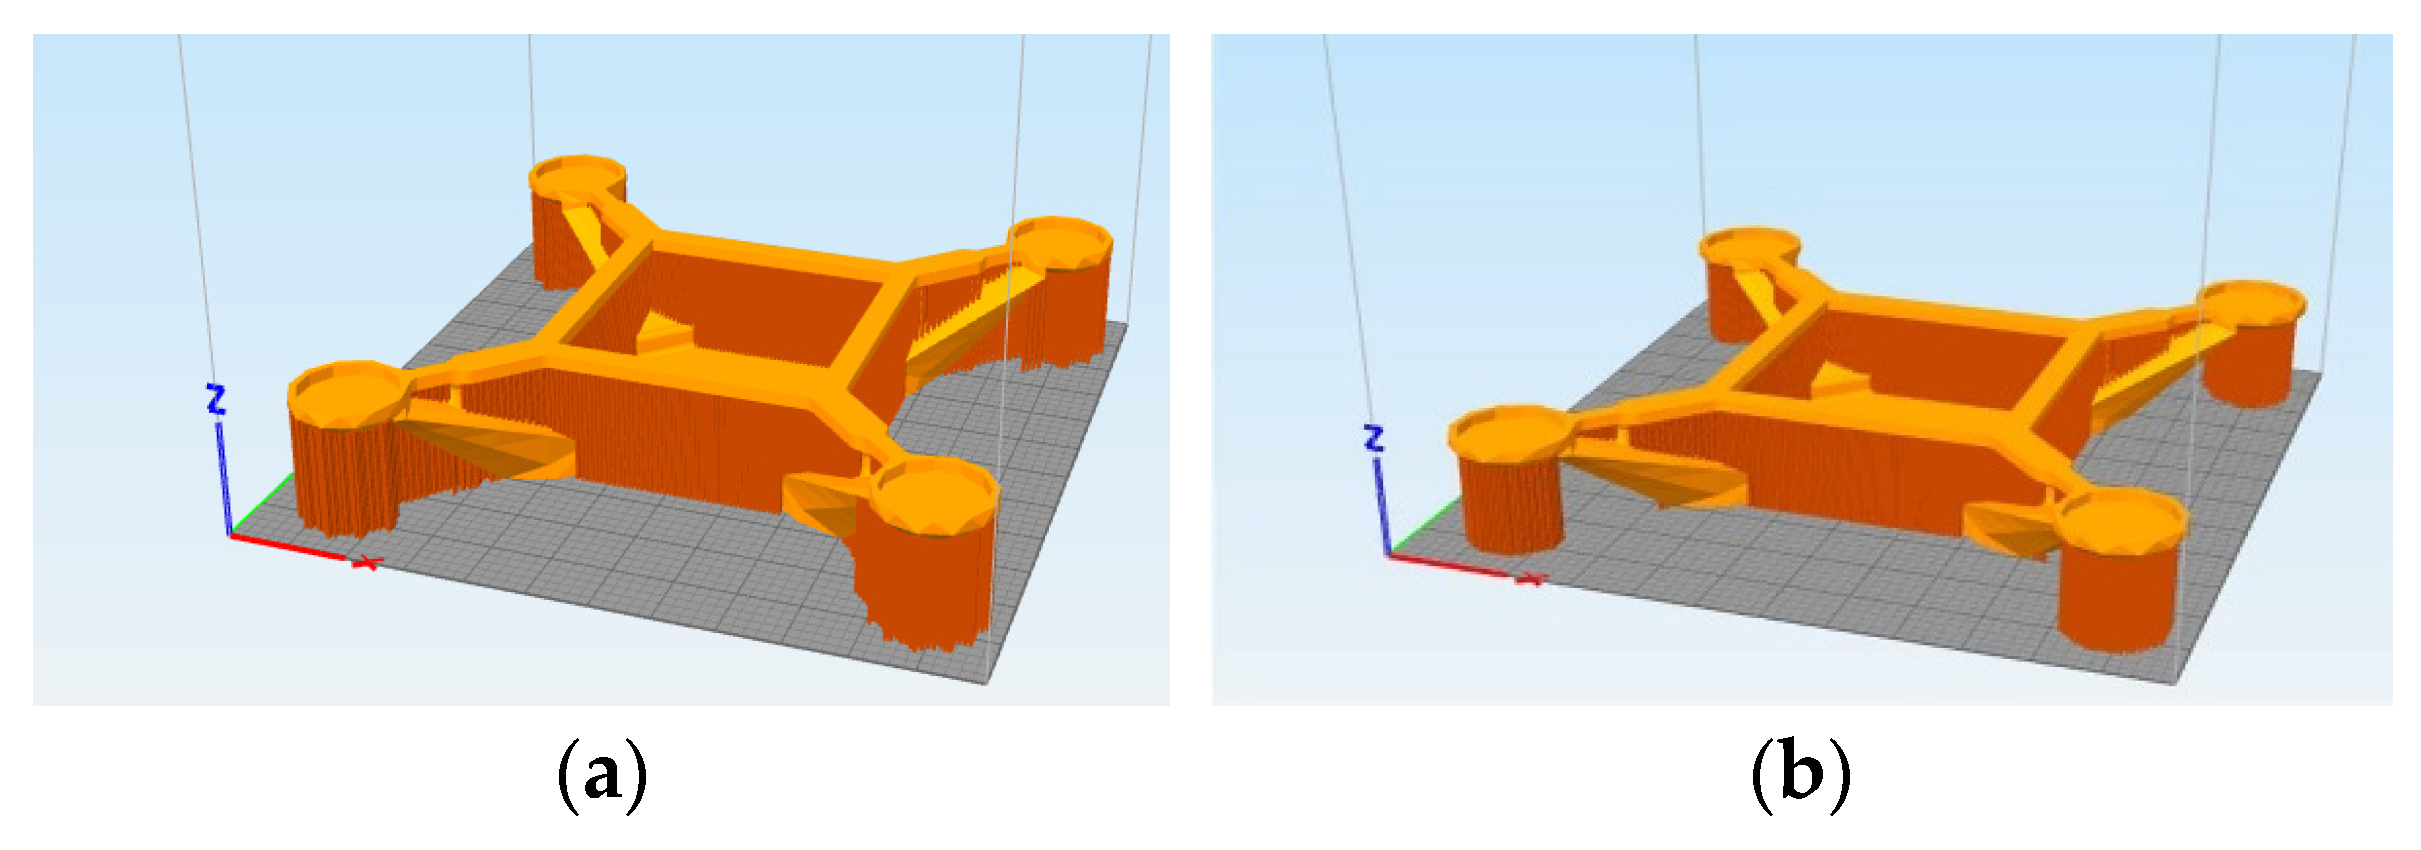
Support structures need to be optimized for minimizing material consumption, which provides an opportunity to reduce the building time and cost of manufacturing. The CAD model of the optimized Quadcopter structure is sliced using the software “CURA”. The original supports generated for the monocoque structure for various overhang angles are shown in Figure 11a,b.
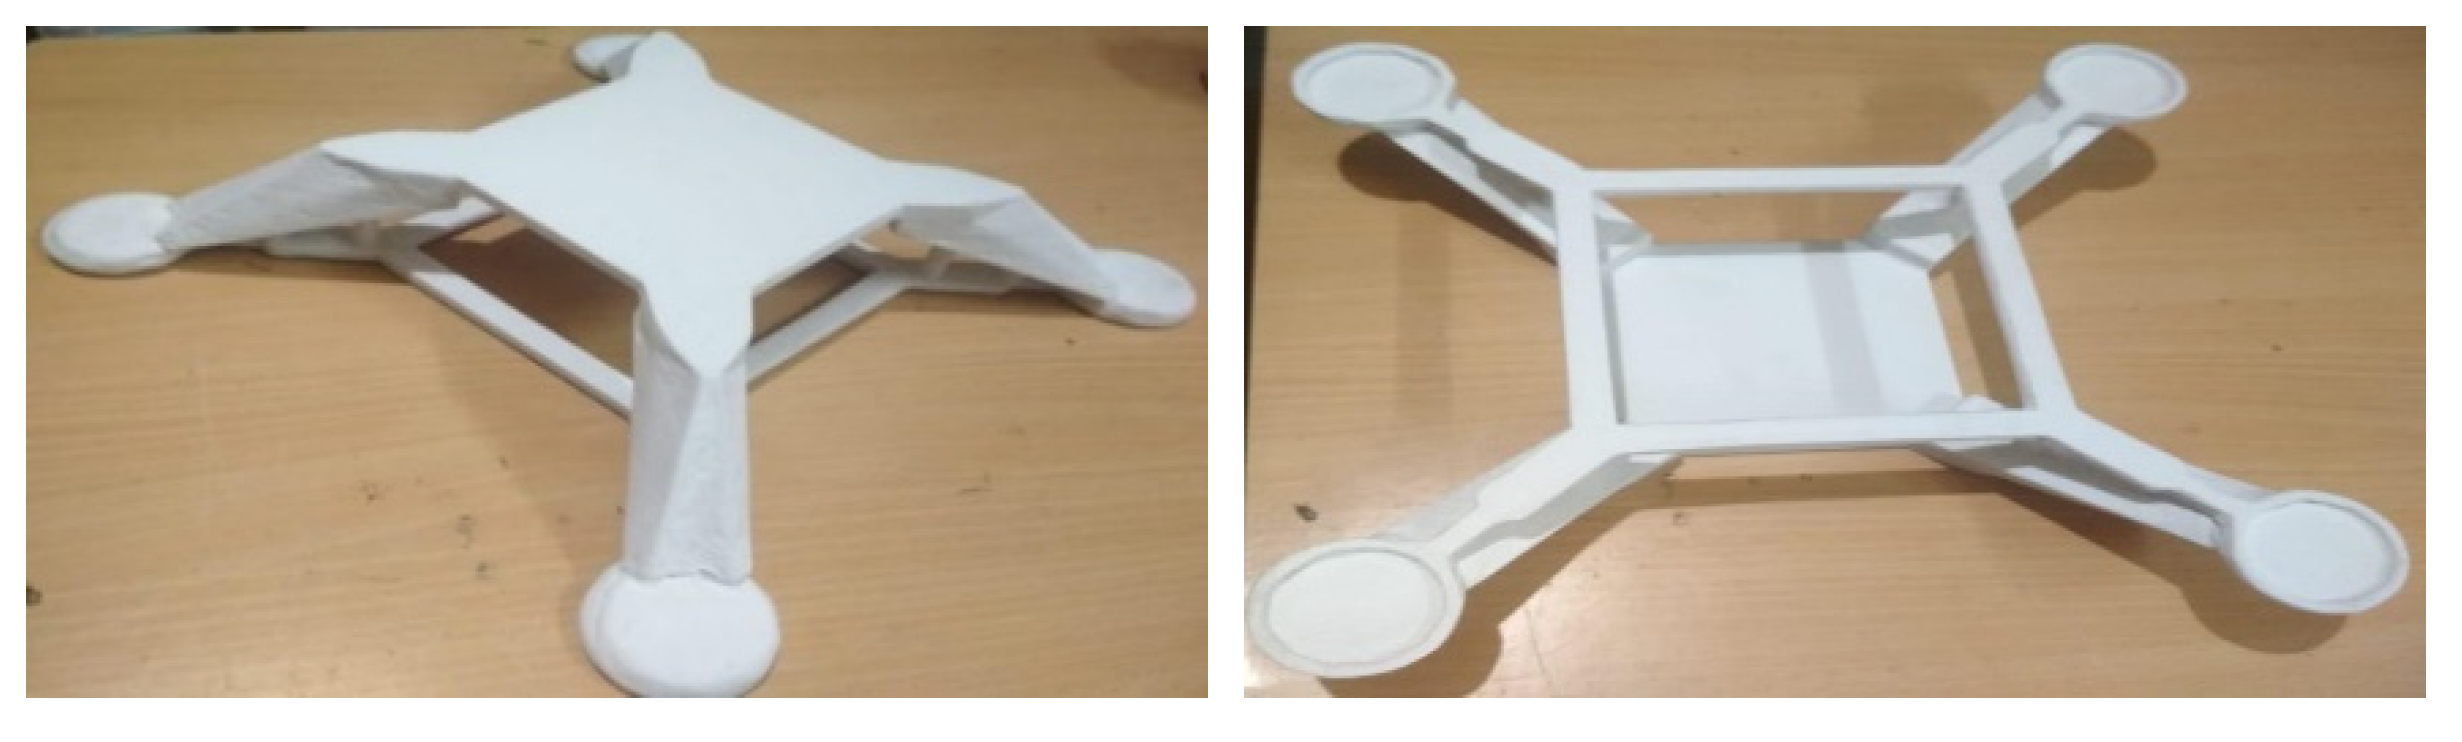
The manufacturing constraint (maximum overhang angle) is imposed in the process of topology optimization. Hence, the arms generated in the structure are greater than 45° from the horizontal. This enables the model to print without support material underneath the four arms. Figure 11 shows that the support generation for the model sliced with overhang angle of 45° and 46° and fabricated structure is depicted in Figure 12.
5. Experimental Analysis and Testing
5.1. Modal Analysis
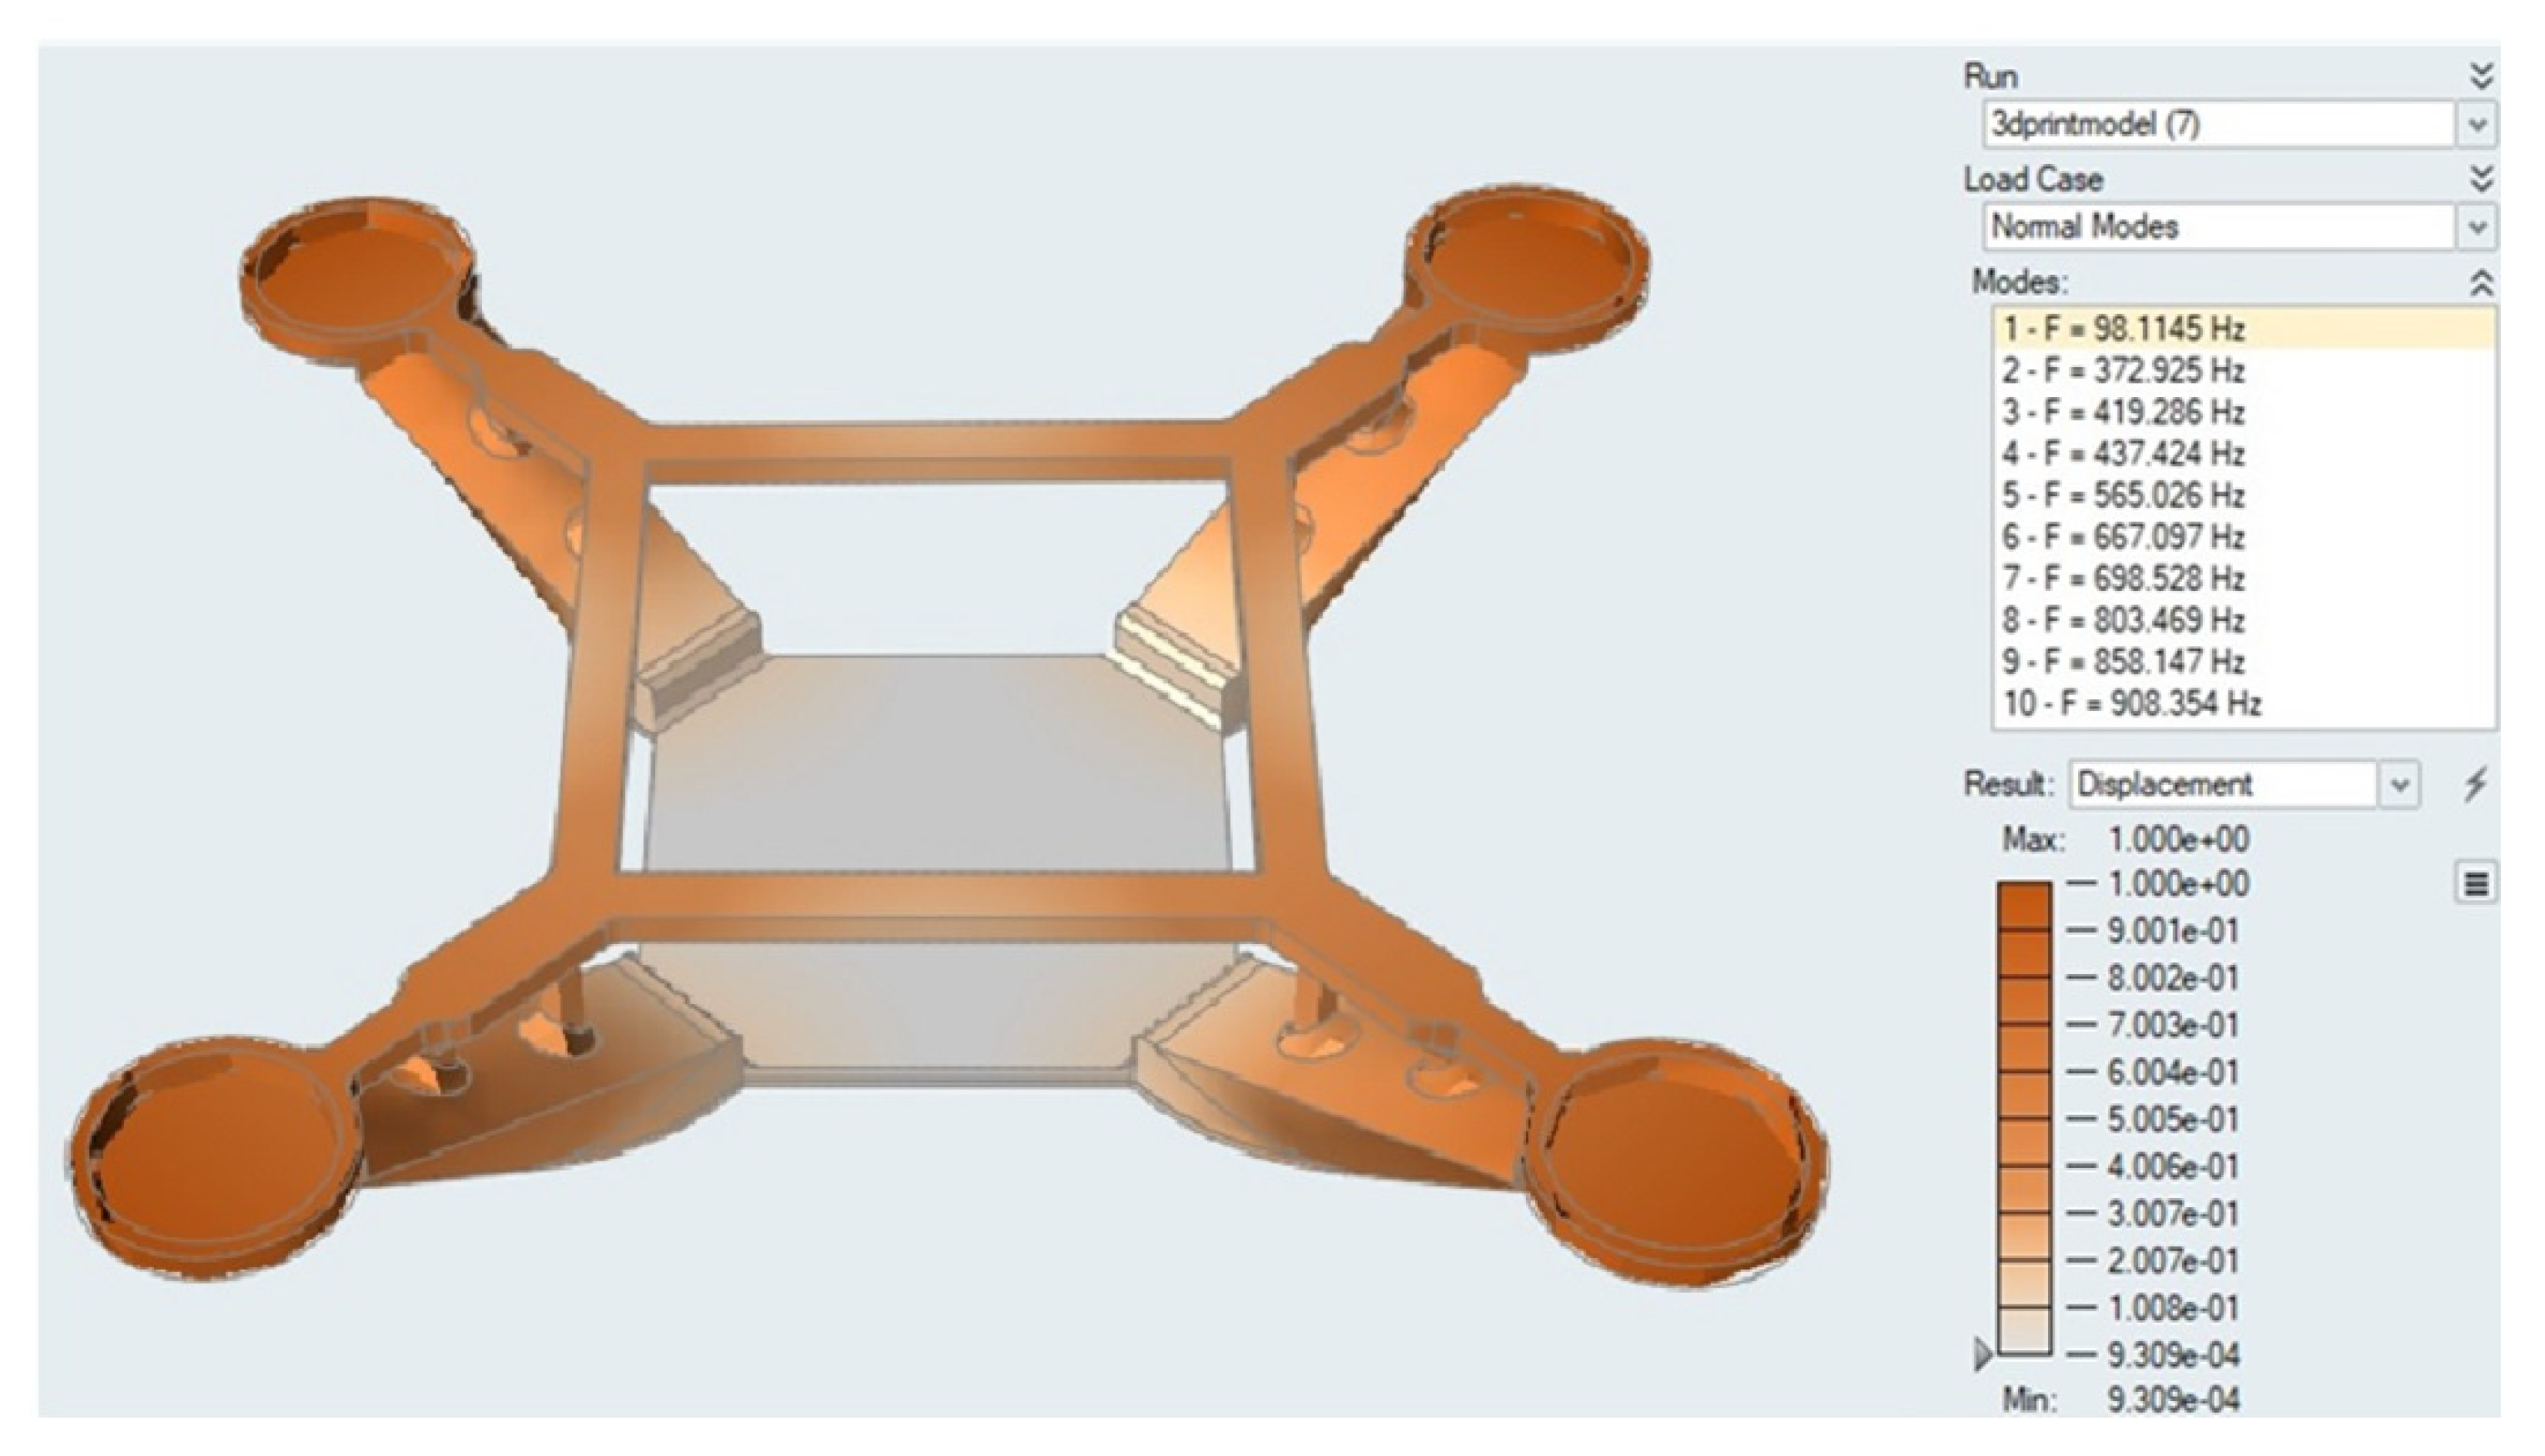
Modal analysis helps in determining vibrational characteristics like natural frequencies and mode shapes of a component or mechanical structure. Since the Quadcopter is subjected to continuous vibrations because of the onboard motors and propellers, it is important to understand its vibrational characteristics. Hence, modal analysis is carried out for the optimized model as shown in Figure 13, to analyze the mode shapes and natural frequencies determined. From the results, it is observed that the first natural frequency occurs at 98.1 Hz and its corresponding mode shape is as shown in Figure 14.
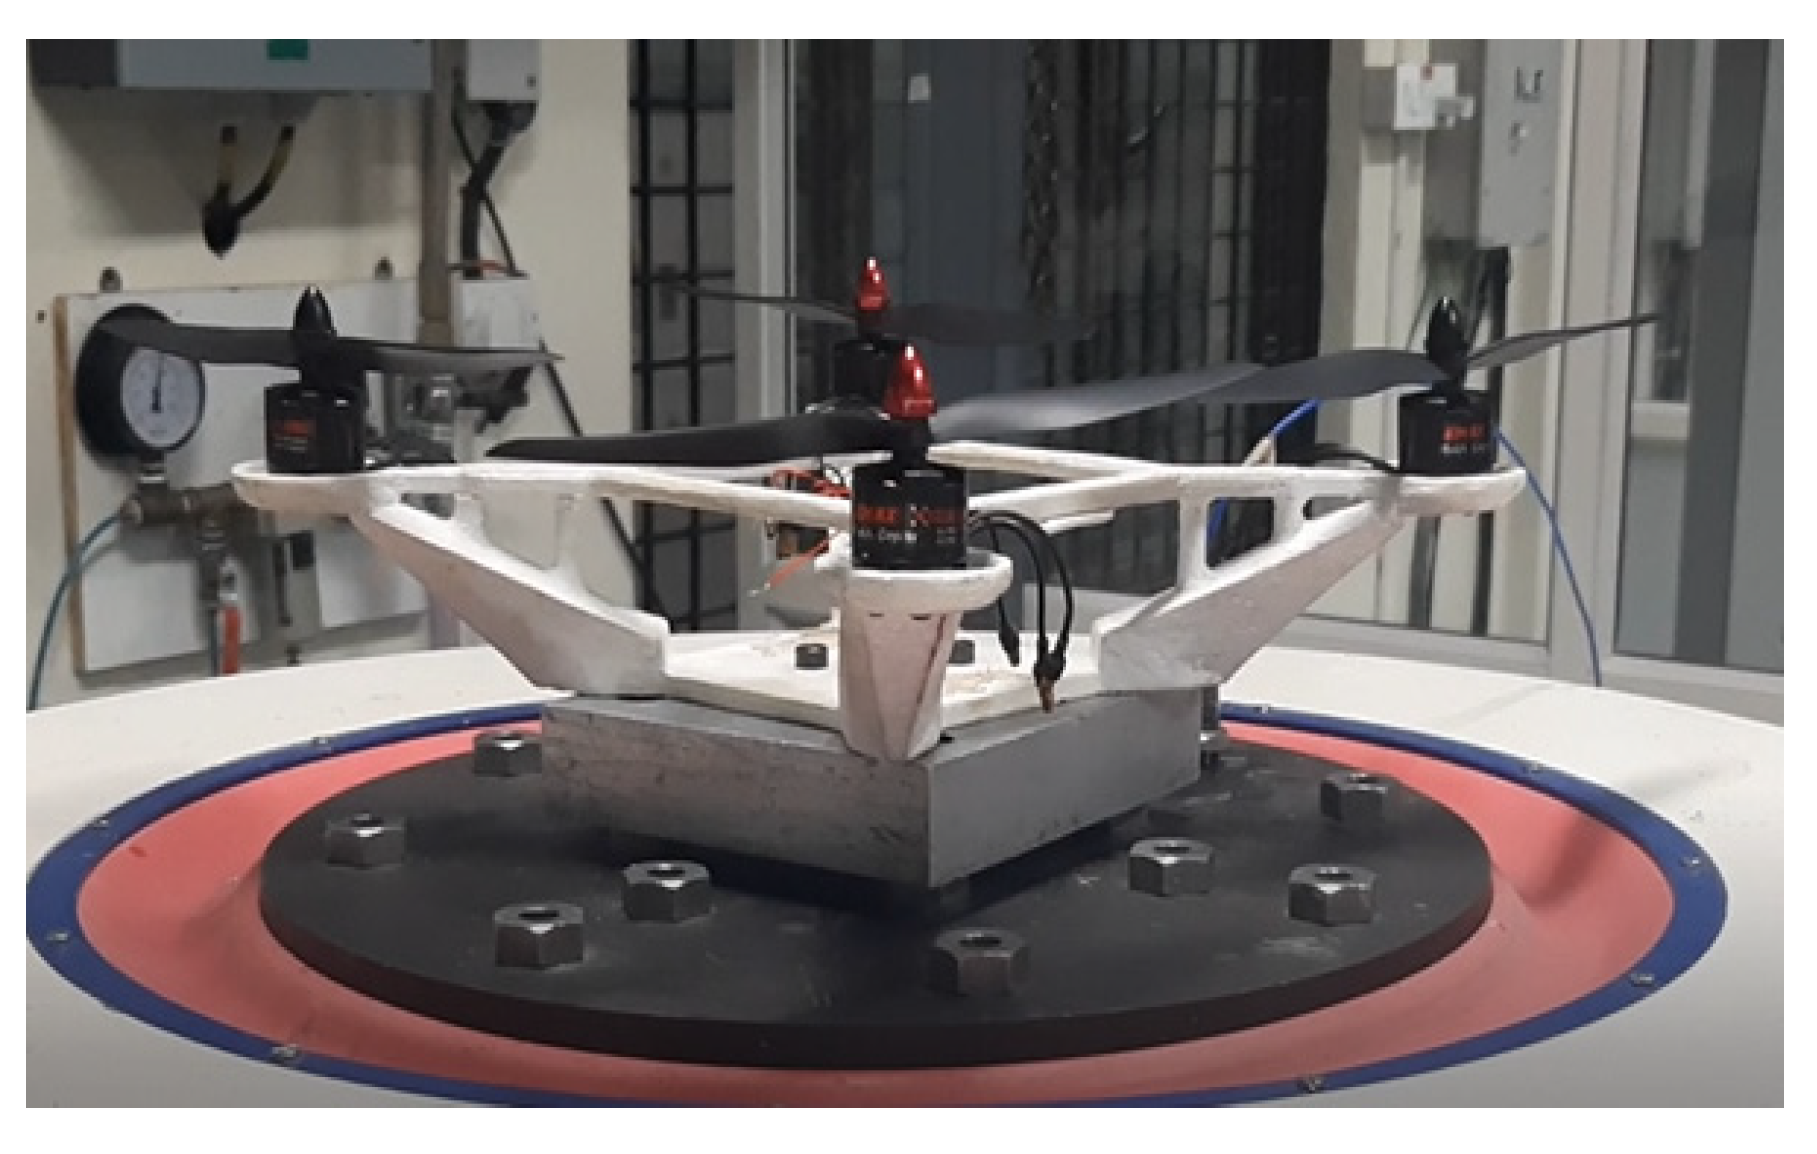
5.2. Experimental Analysis Using Vibration Shaker
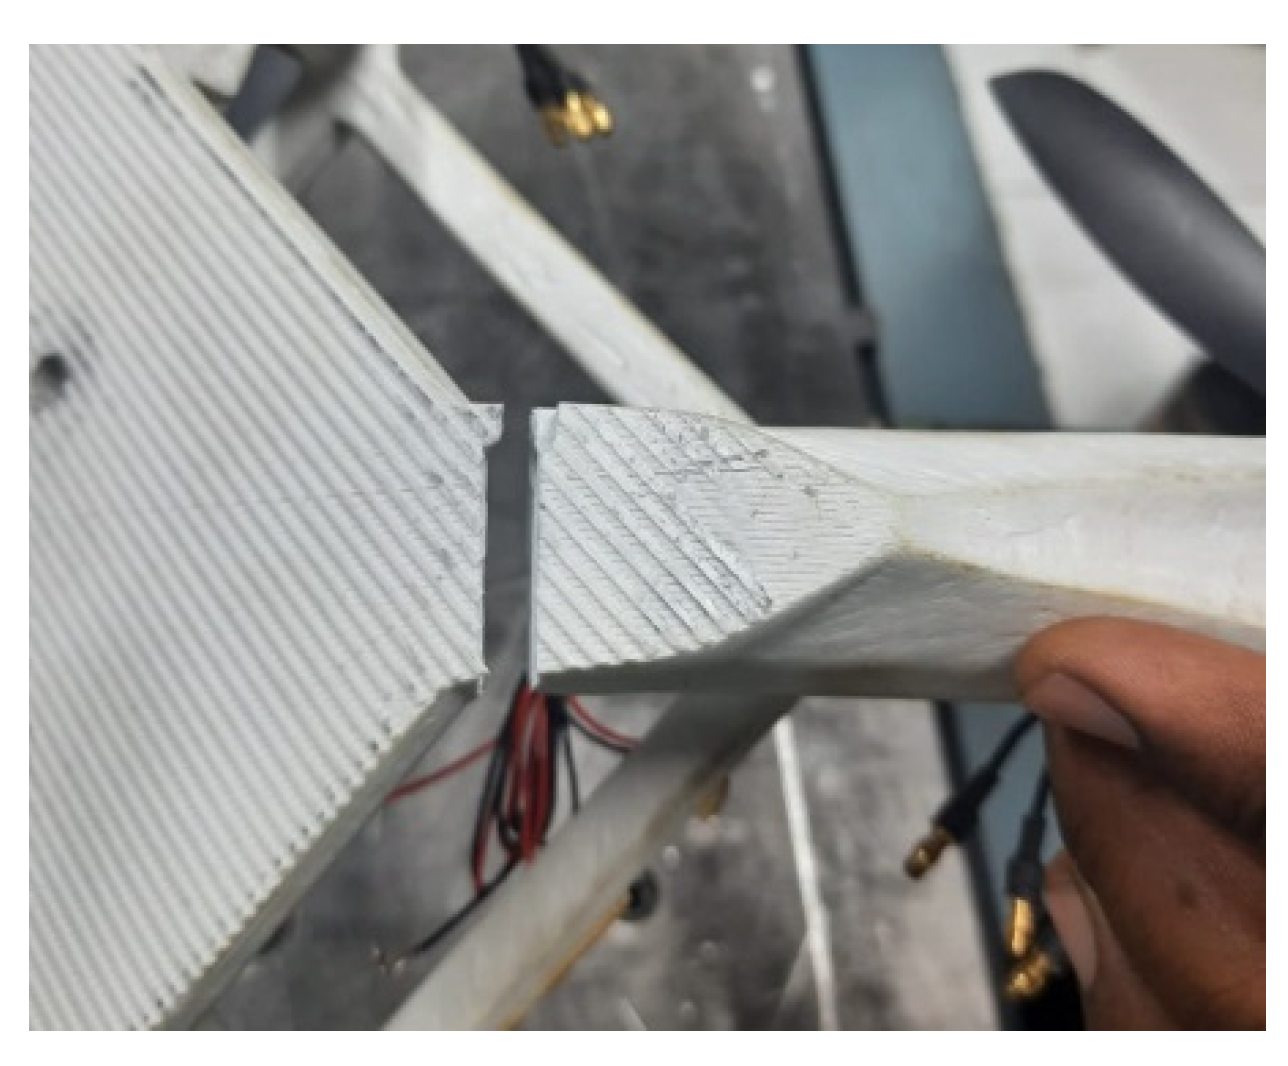
For validating the simulation results, experiments are conducted using a Vibrational shaker. The vibrational shaker is used for determining the acceleration response for various natural frequencies. The complete specifications of the vibration shaker are given in Table 8. The structure is fixed on to the shaker as shown in Figure 15 and is excited with sinusoidal wave for measuring its corresponding “g” value. The experiment started with a frequency of 5 Hz and continued by considering various frequencies till the structure fails (Figure 16). The structure failed at a frequency of 100 Hz which is very close to the first natural frequency (98.1 Hz) (Figure 17) as per the simulation results. Based on the experimental data, the value of “g” for its corresponding frequencies is given in Table 9.
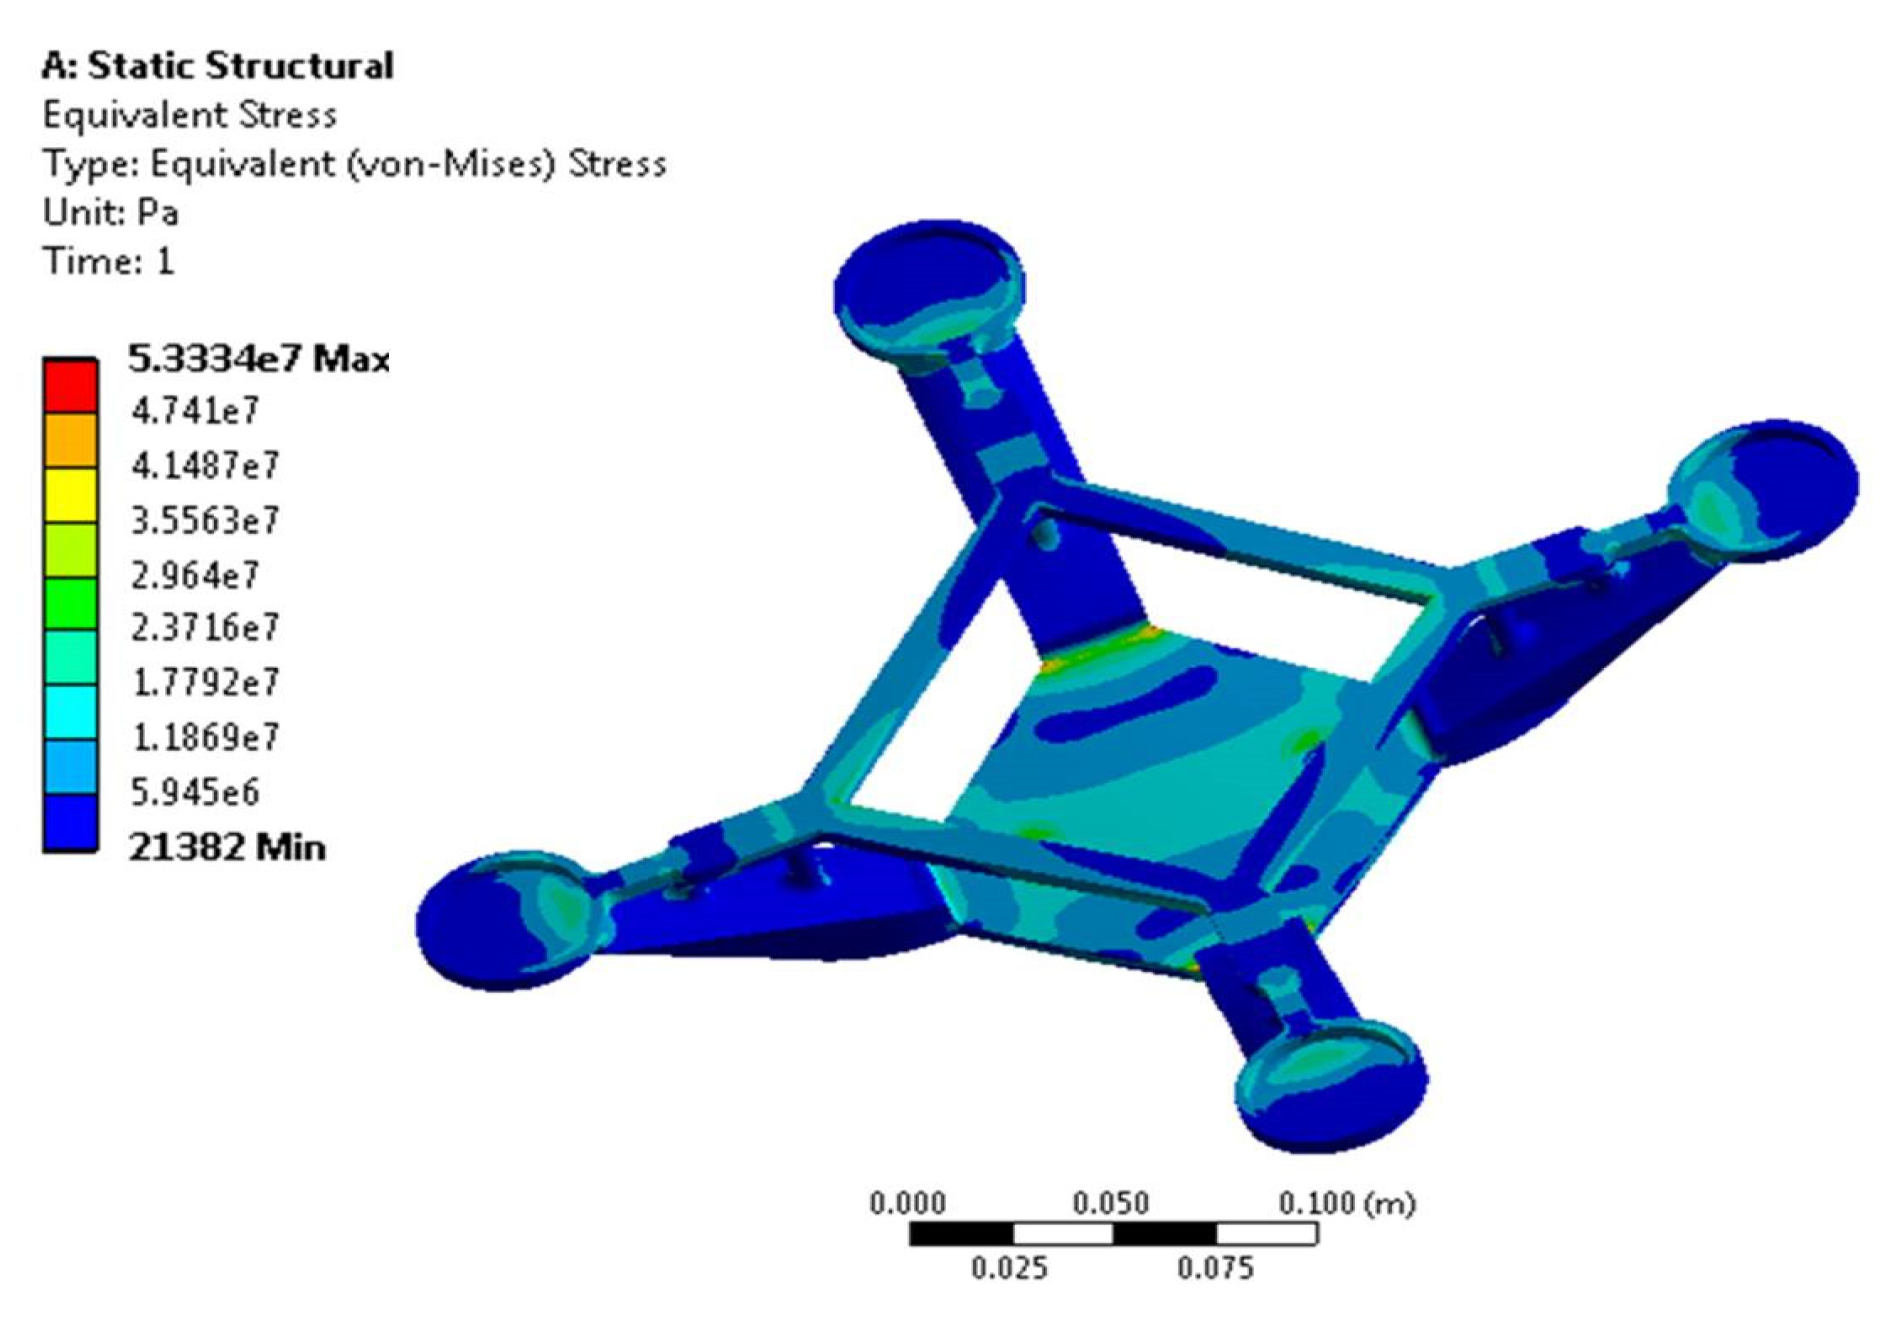
For analyzing failure, simulations are carried out. As the bottom of the plate is fixed, the maximum stress induced at the bottom of arm is 53.33 MPa (Figure 18), which is greater than the allowable stress of ABS material (40 MPa). Hence, the failure takes place at that particular point as shown in Figure 17.
5.3. Comparison of Simulation and Experimental Result
From the numerical and experimental analysis, it is observed that both the results are in very good agreement.
6. Measurement of Strain in the Arm of Monocoque Quadcopter Frame
6.1. Measurement of Strain
The study of mechanical properties of any designed component under its working conditions is of the utmost importance because the mechanical properties of any material are influenced by the stress induced. Stress measurement cannot be done directly in any material; hence, in the stress analysis, the measured strain is combined with any other property to calculate the value of stress under its loading condition. It can be measured by gluing the strain gauge to the structure. When the Quadcopter starts operating, the thrust force acting at the end of the arm tends to compress the strain gauge. This induced compression force changes the value of resistance, and it varies linearly in proportion to the strain induced in the arm. This change in resistance helps to calculate the strain.
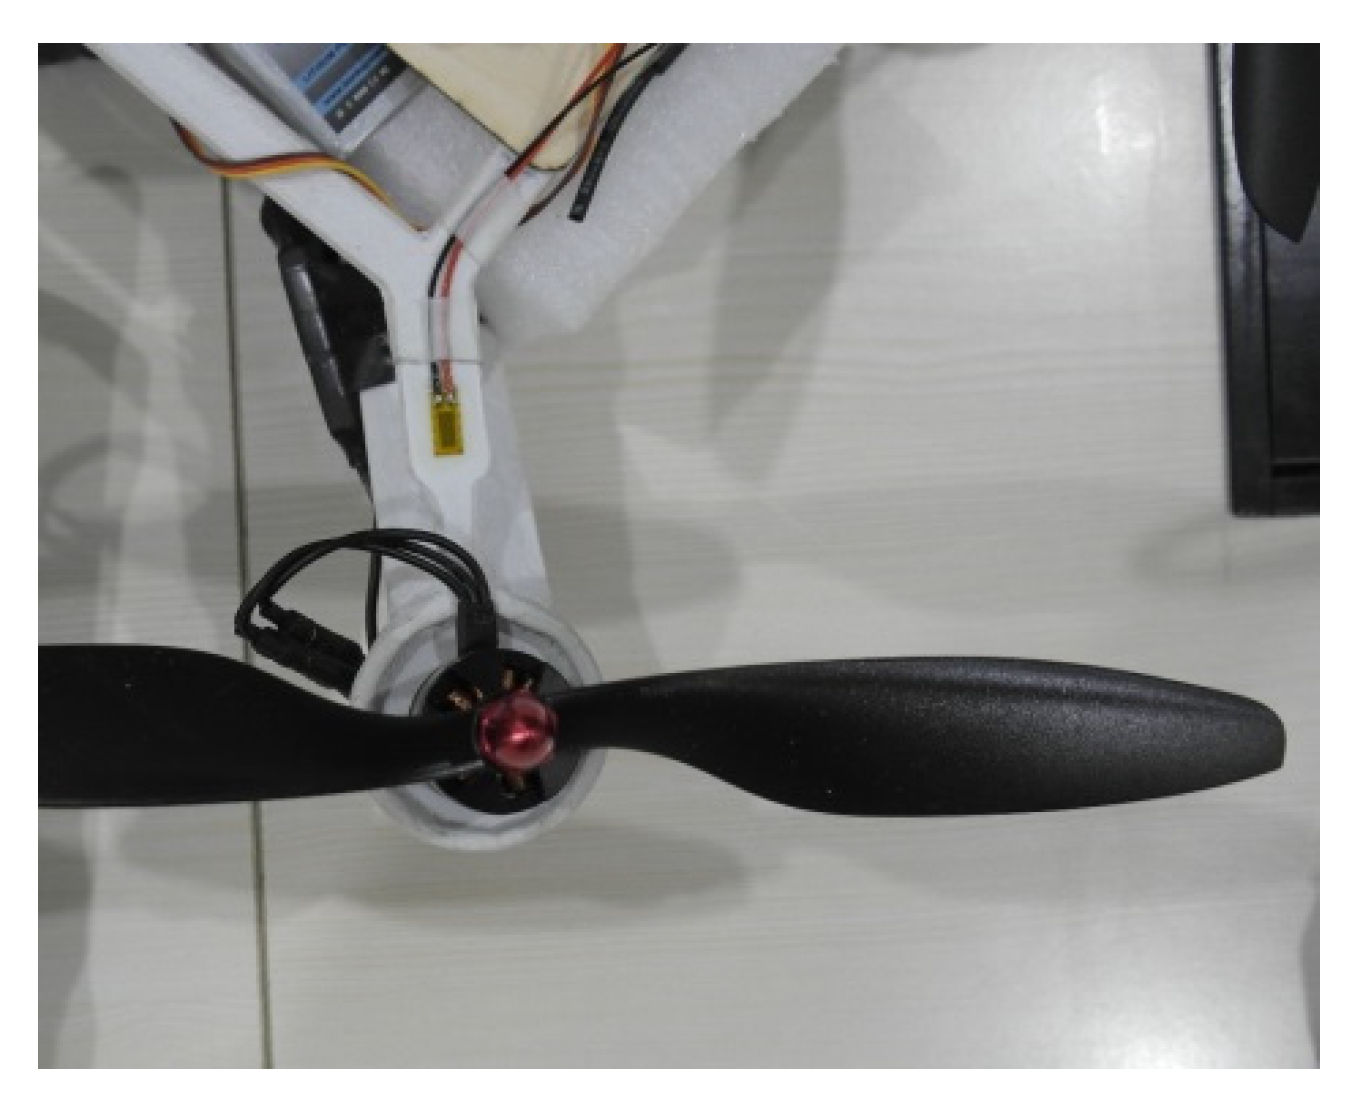
The Quadcopter which is fabricated through FFF and assembled is considered for study. For measuring the arm’s strain in the Quadcopter, a strain gauge is attached by using an adhesive. The mounted strain gauge on the arm of the Quadcopter provides the value of strain induced due to the thrust generated by the motor.
The requirements of strain gauge that should meet the current application are:
- The size of the strain gauge should be small, in consideration with the width of the Quadcopter arm
- The backing material should bond on the surface of the ABS material.
- Linear strain gauge, as it needs to measure the strain only in a single direction.
Based on the requirements, 1-LY41-6/350 linear strain gauge is used and mounted on the arm of the Quadcopter using an adhesive as shown in Figure 19. This enables the strain gauge to bend according to arm deformation. A quarter bridge configuration is used for measurement of strain due to its high measurement sensitivity. To create a quarter bridge circuit, one of the resistors in the Wheatstone bridge is replaced with the strain gauge that is glued with the Quadcopter arm. The remaining three resistors of bridge will act as a reference. The raw voltage from the Wheatstone bridge is acquired by a strain gauge amplifier with Catman software.
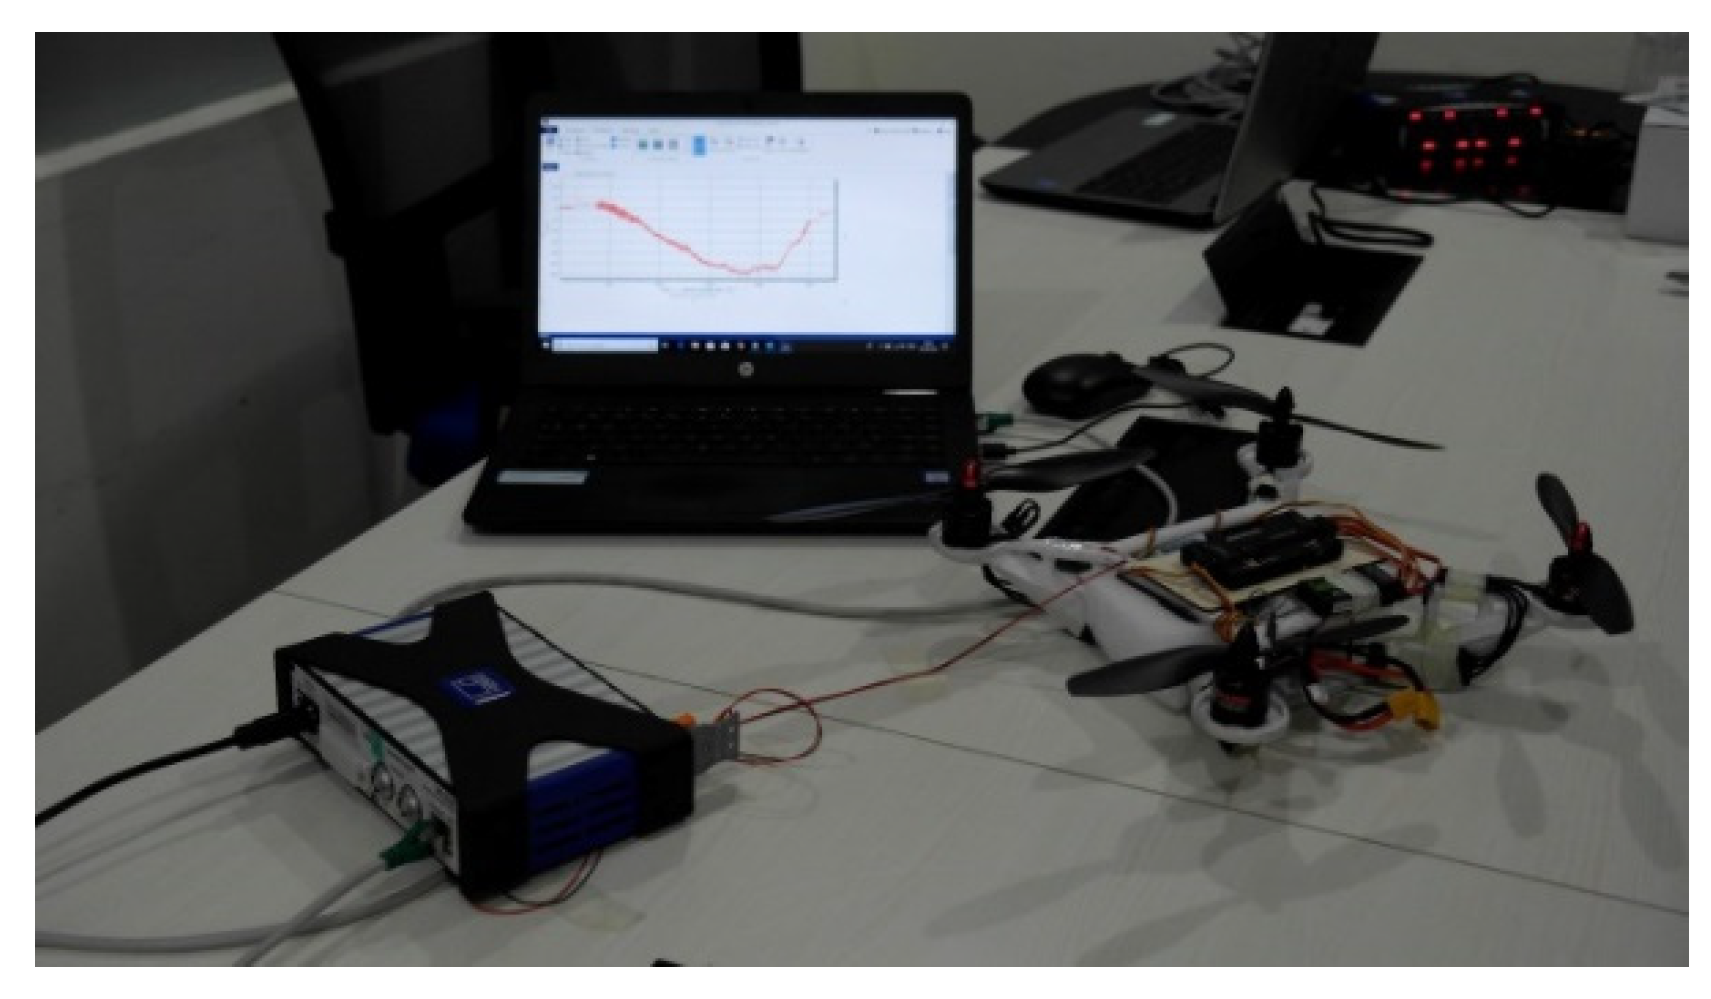
For data acquisition and analysis, the Mx1615B strain gauge amplifier with Catman software is used as shown in Figure 20 to measure the strain in the Quadcopter structure. Table 10 presents the complete specifications of the Mx1615B amplifier. It is the most suitable strain gauge amplifier for precise and safe data acquisition of strain gauge in quarter bridge configuration. It consists of 16 sensor inputs, all together organized in a compact housing.
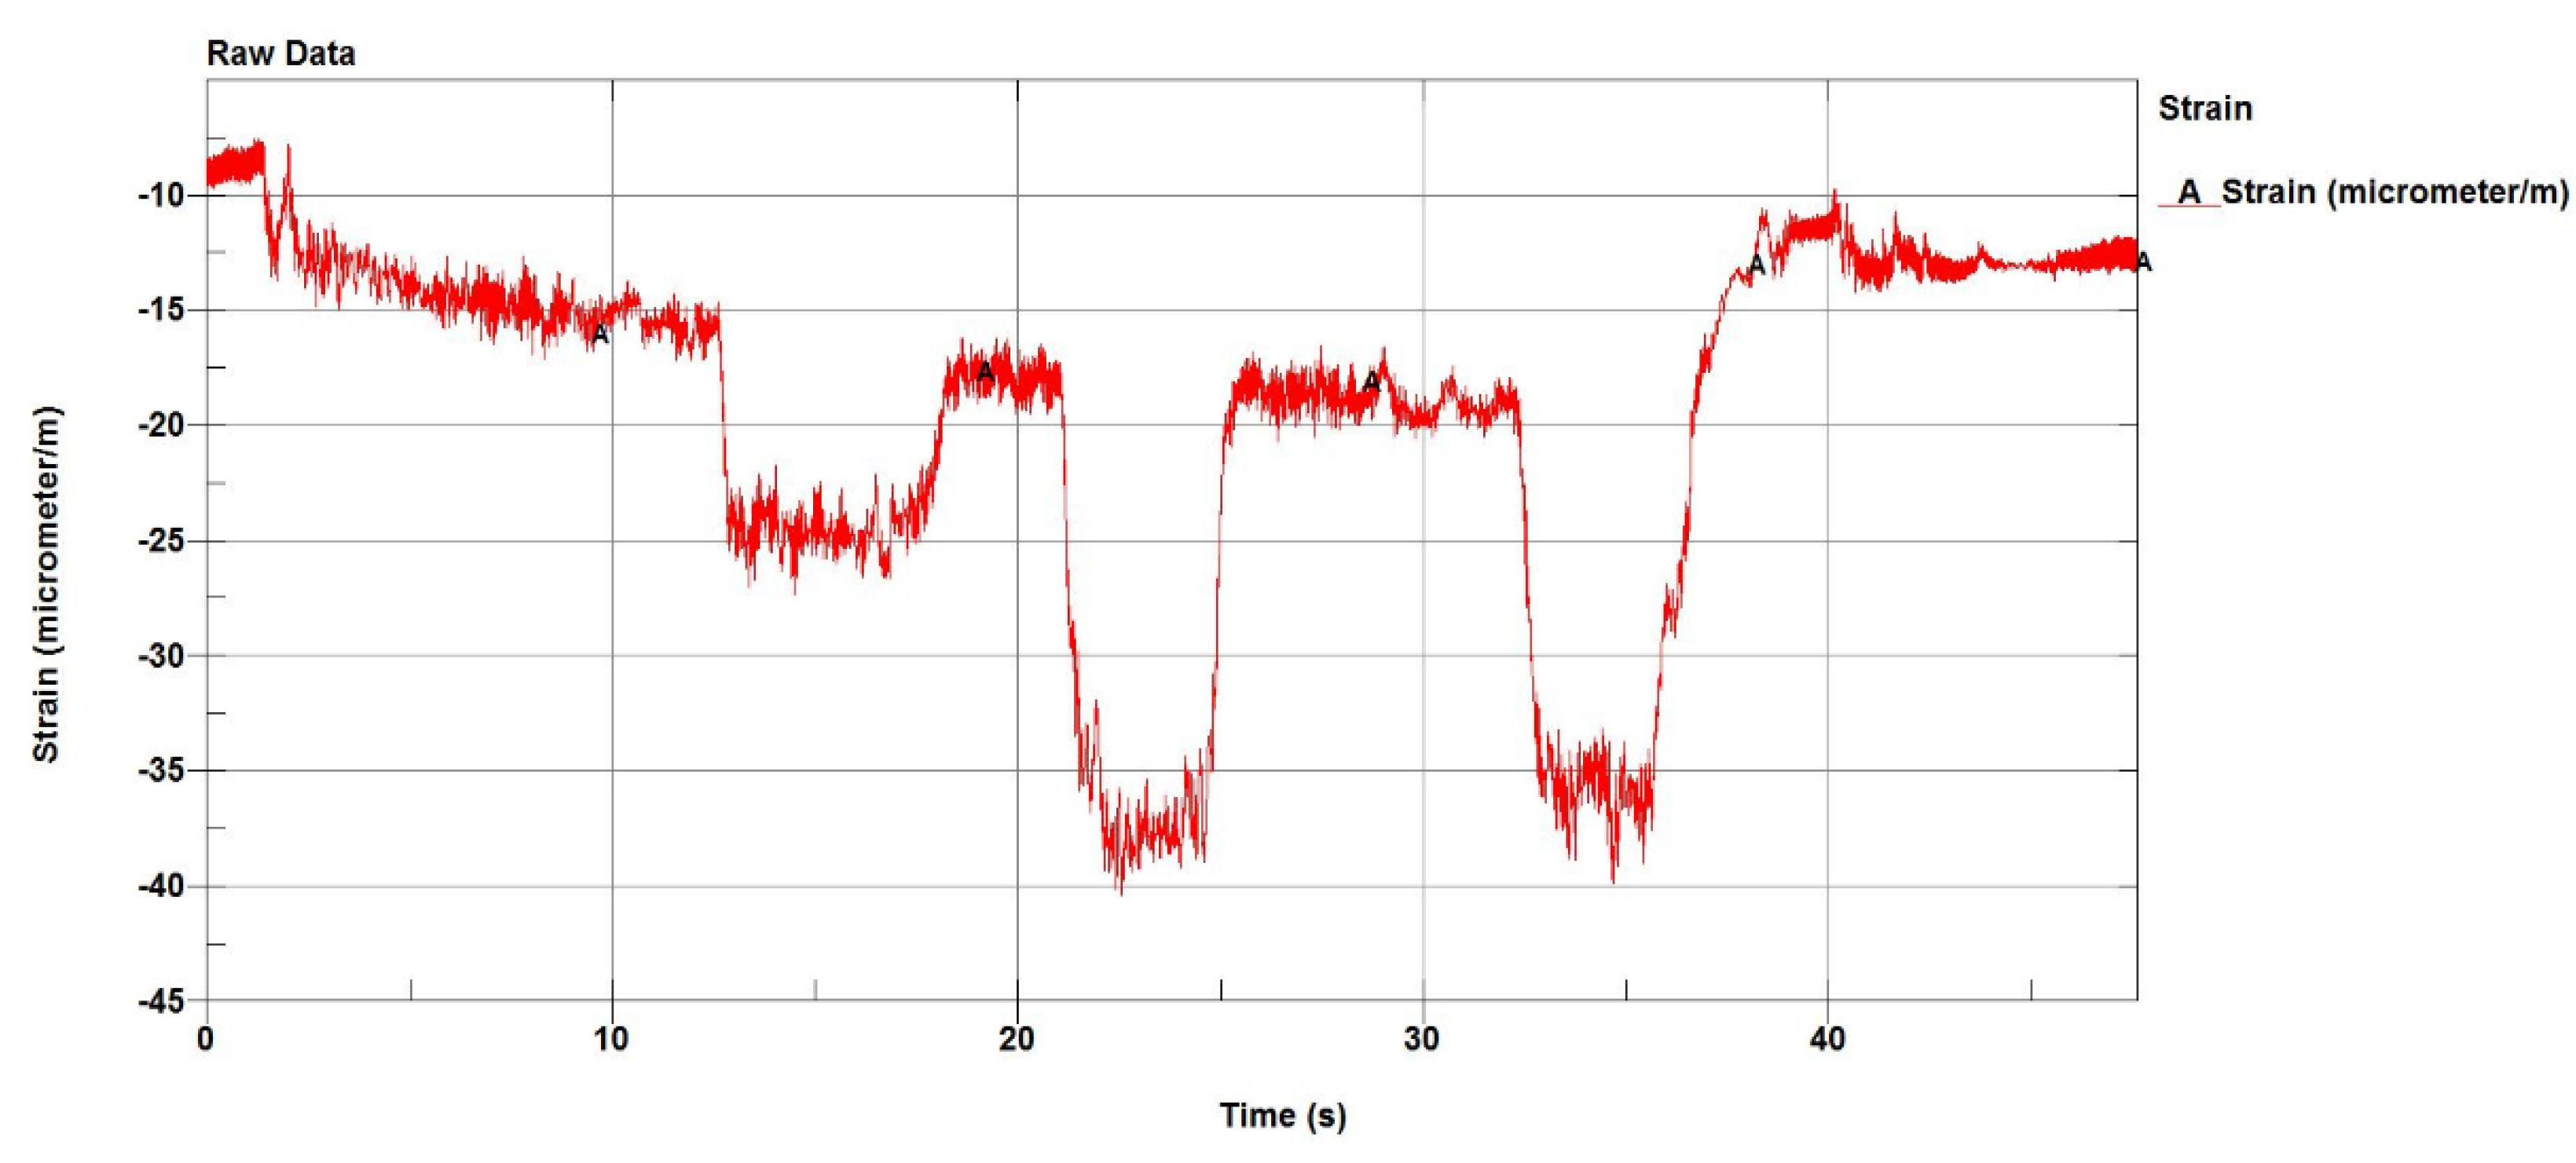
For the given input throttle conditions, the strain induced in the Quadcopter’s arm is noted and presented in Table 11. To analyze the strain of the Quadcopter arm during a real time scenario, strain data are recorded as shown in Figure 21 during hovering, pitch and roll moments and presented in Table 12.
6.2. Validation Using FE Analysis
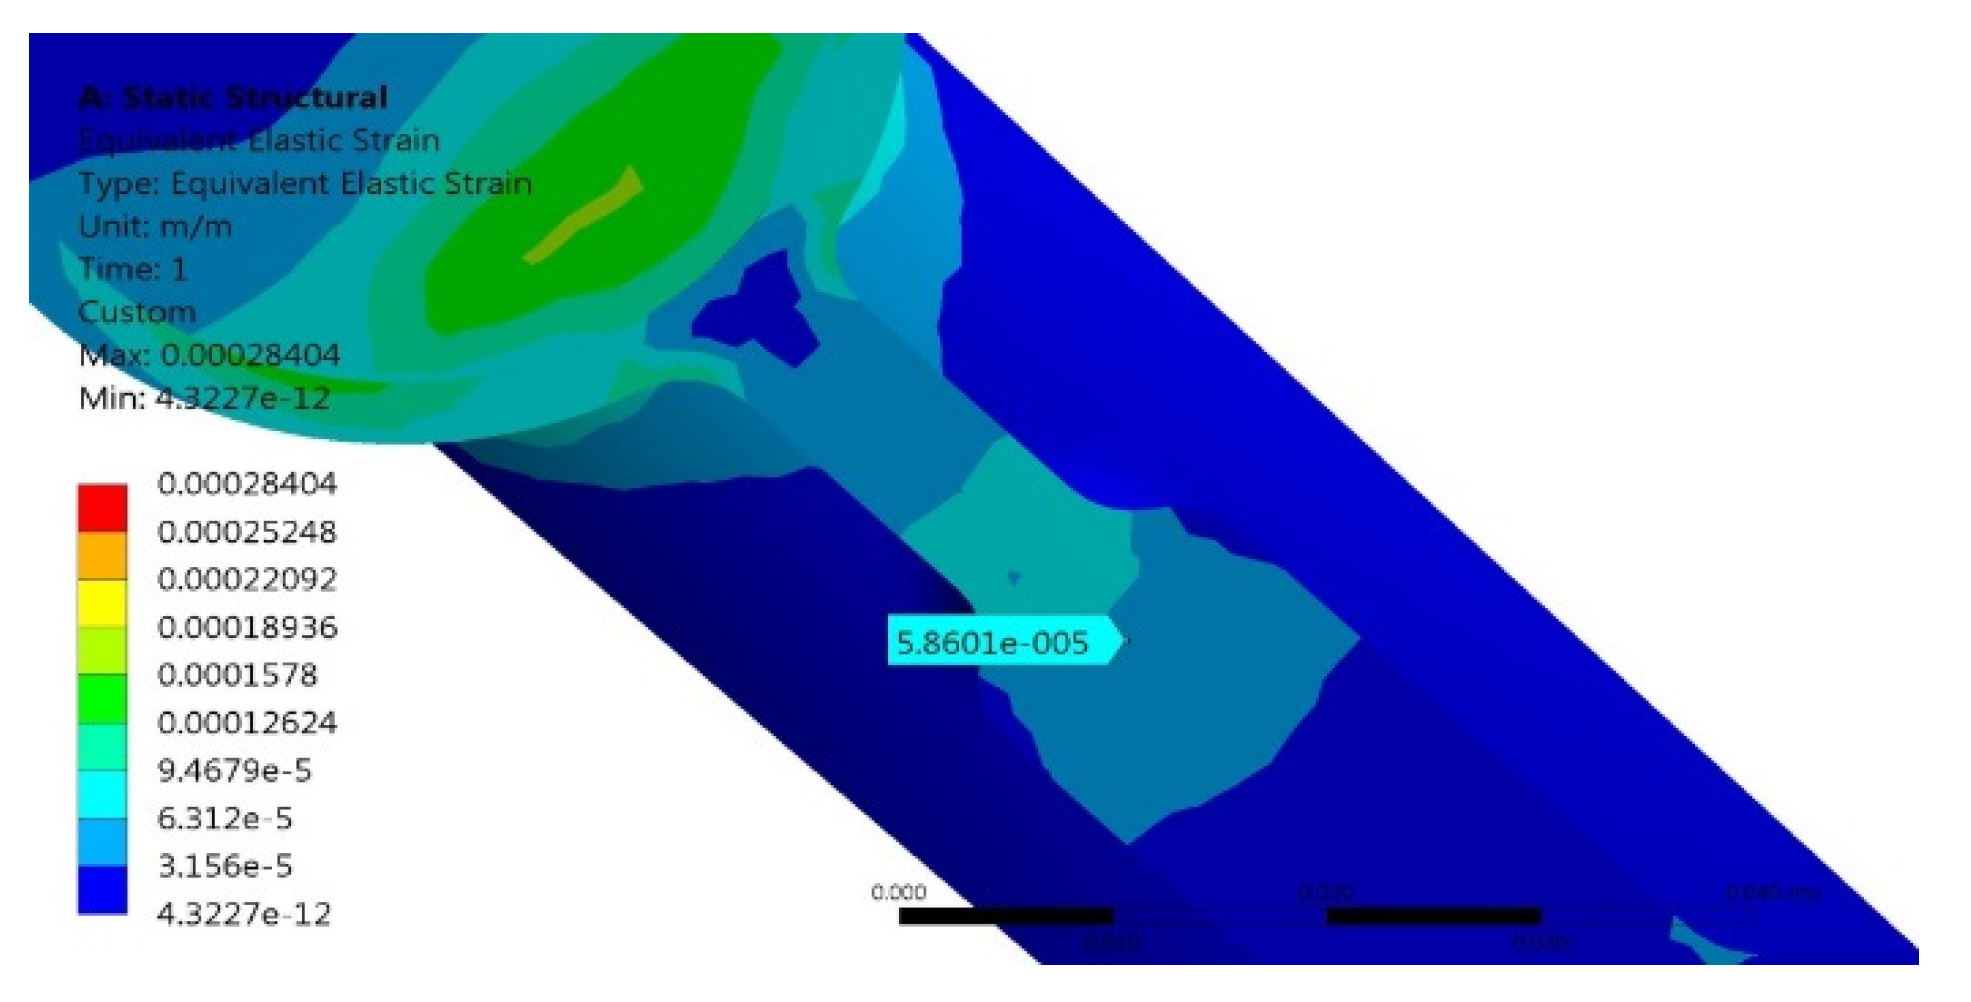
Finite element analysis for the Quadcopter structure is realized using ANSYS Mechanical. Simulations are carried out to measure the value of the strain induced in the arm. The strain of the Quadcopter arm is measured by considering the self-weight of the Quadcopter. For this, the bottom of structure is fixed and 5 N of thrust force is applied at the end of the arm. From the simulations, the strain experienced by the arm is noted (which is 0.05937 m/m) for a point where there is maximum deformation.
The Quadcopter arm strain is measured experimentally at 50% of throttle and is compared with the simulation results. The comparison shows that the strain obtained from the experiment is 59.37 µm/m (as shown in the Figure 22) which is very close to the simulation result (58.61 µm/m as shown in the Figure 23). Hence, it can be concluded that the simulation results are factual.
7. Aerodynamic Performance Measure of Developed Quadcopter Using CFD and Wind Tunnel Testing
This section focuses on CFD simulations carried out for exploring the flow around an UAV for four different angles of attack (AoAs) in both hovering and forward phase.
7.1. CFD Analysis of Monocoque Quadcopter
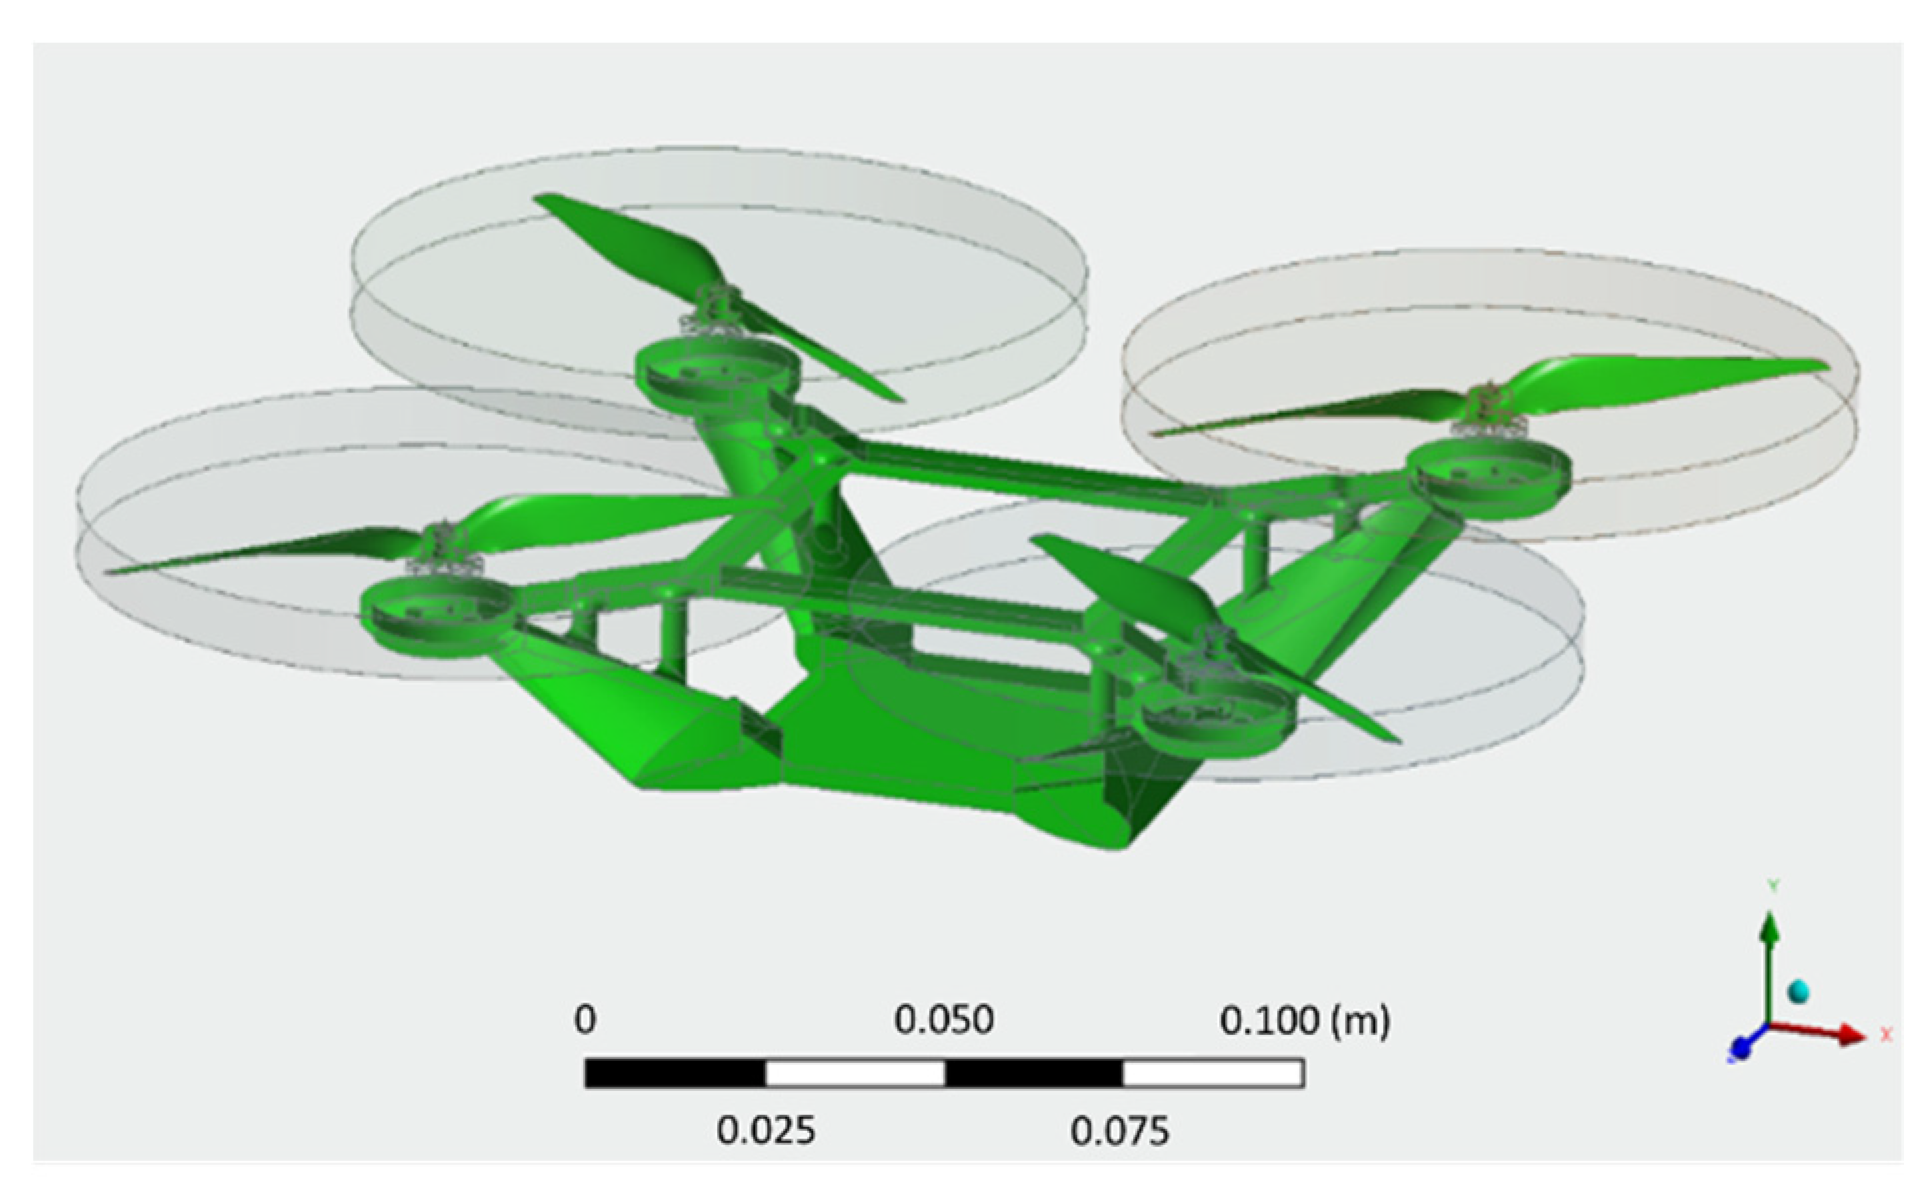
CFD analysis is performed to know the lift and drag forces coming on to the Quadcopter which define its maneuverability [37,38,39]. ANSYS DesignModeler is used for modelling the UAV and CFD analysis is accomplished using ANSYS CFX. The thrust required for hovering and forward motion is calculated using empirical relations. Hence, by considering a factor of safety of 2, the maximum thrust is found to be 40 N. The Quadcopter structure shown in Figure 24 has a tip-to-tip length of 330 mm with a height of 50 mm and it weighs 0.337 kg.
7.1.1. Computational Domain
The computational domain for performing CFD analysis shown in Figure 25 has a rotational frame and corresponding wall boundary conditions. It is constructed based on the wind tunnel size for the experimental study.
7.1.2. Mesh Generation
The structure is meshed with a tetrahedral element having a total number of 1,988,470 elements in the computational grid. Five layers of inflation are generated around all the walls and the y plus values are calculated based on the Reynolds number. After 1000 iterations, the solution is converged.
7.1.3. Hovering Phase
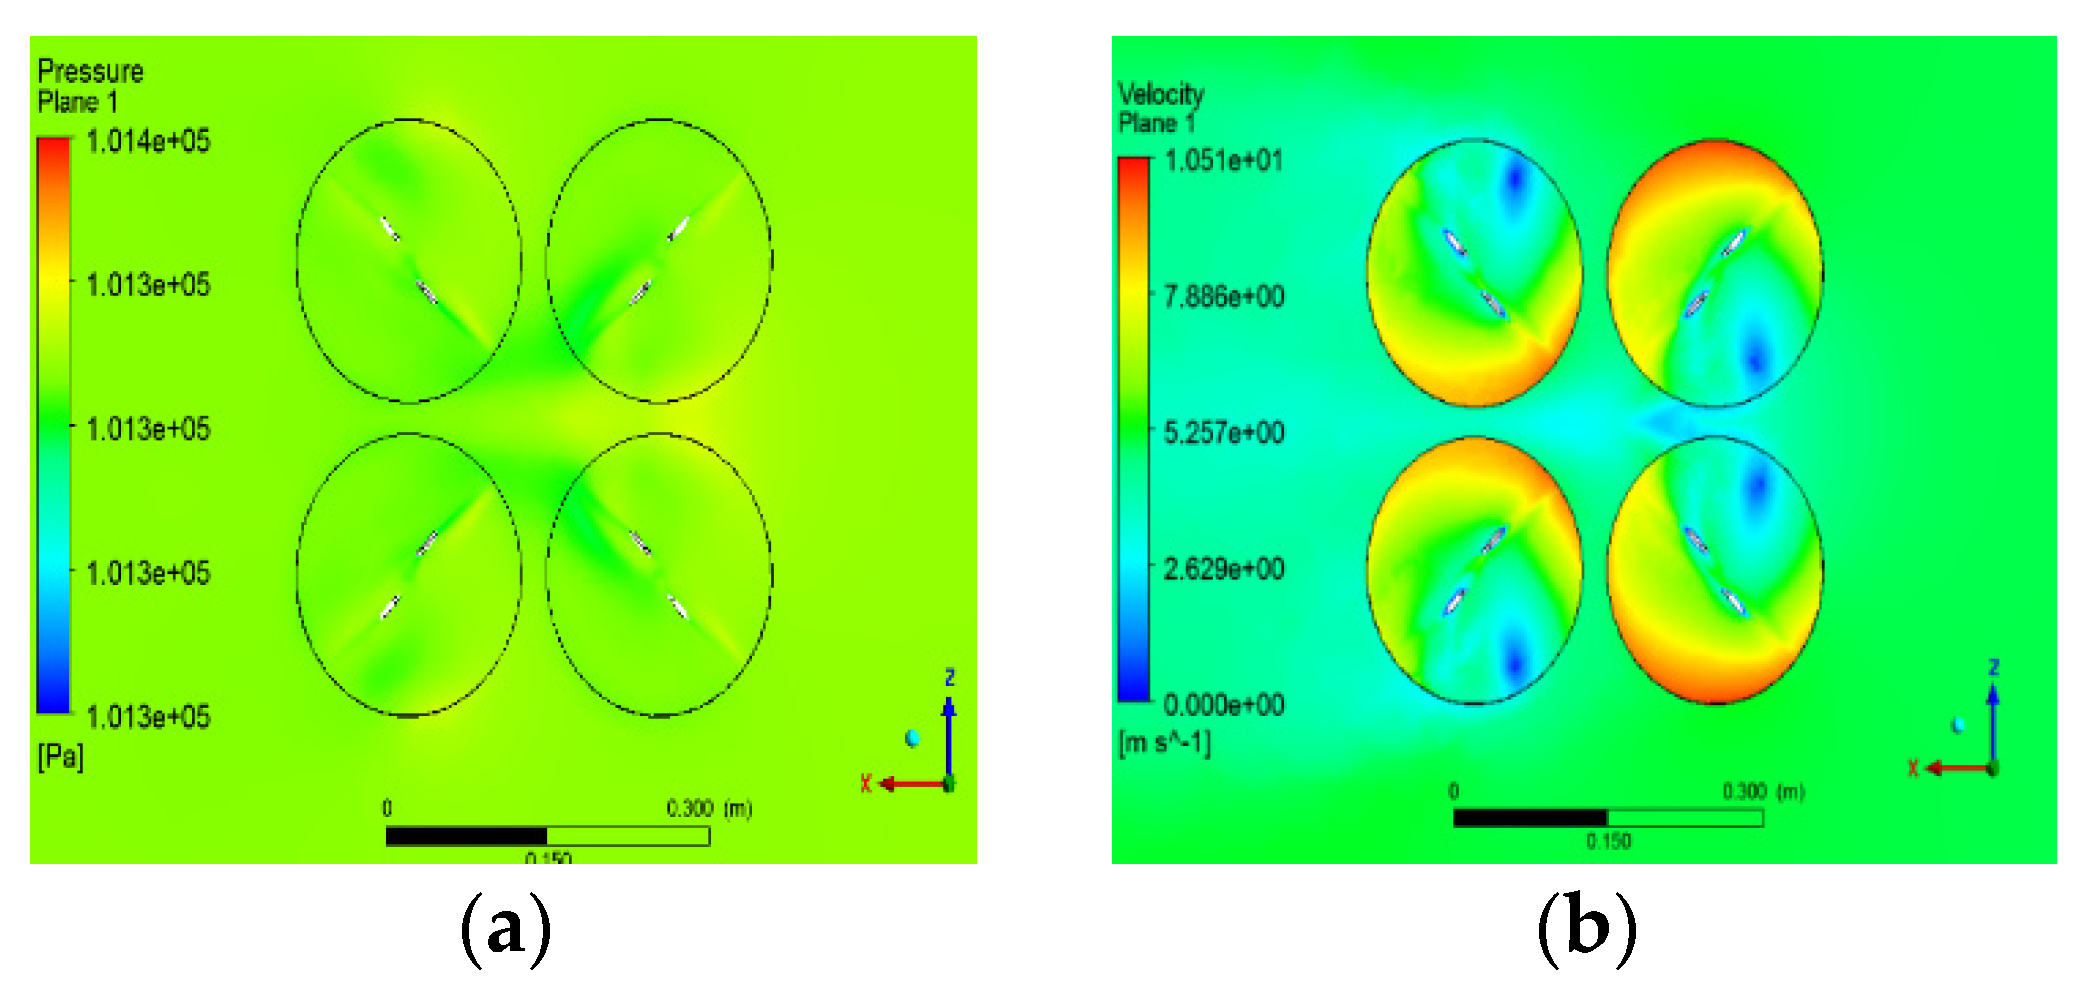
In the hovering phase, all the motors are maintained at the same speed to attain stability at a specific altitude. Under this condition, a recirculating flow around the Quadcopter structure arose those aids in the stability of the Quadcopter. By varying the Angle of Attack (AoA), the maximum pressure and velocity at the tip of the propeller is determined which is given in Table 13. Figure 26 shows the velocity and pressure contour for 0° AoA. It is observed that, increasing AoA after 4°, there is a decrease in lift force and increase in drag force.
7.1.4. Forward Flight
As against the hovering motion, in forward motion, the Quadcopter moves against the wind. This is simulated by imitating the environment of a wind tunnel where the Quadcopter is fixed and wind is blown at a specific speed. Similarly, by varying the AoA CFD analysis is performed and the results are provided in Table 14. It is evident that the lift force is maximum at 0° AoA and drag force is increasing at the increase in AoA. The distribution of pressure and velocity at 0° AoA is shown in Figure 27a,b.
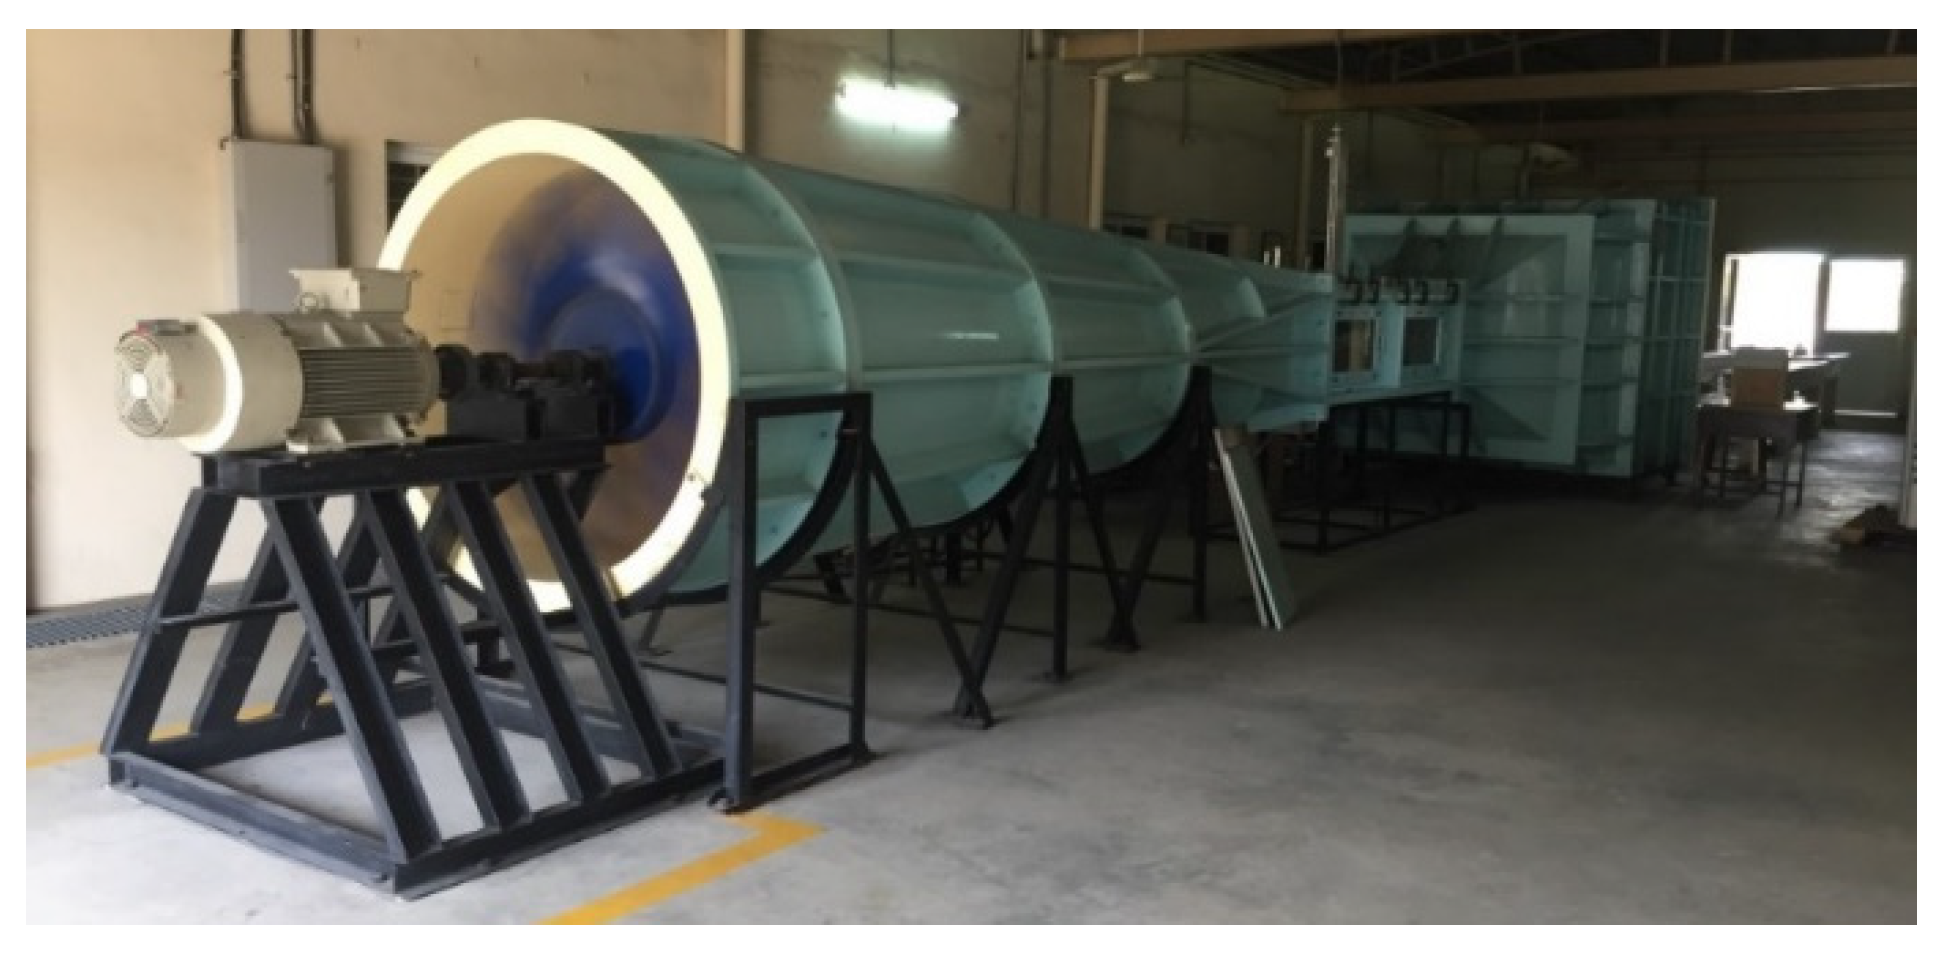
7.2. Wind Tunnel Testing
A subsonic Wind tunnel facility shown in Figure 28 with various sections, namely, inlet, nozzle and test section (Figure 29) and a diffuser section, is used for conducting experiments. The details of all the three sections and their specifications are presented in Table 15. A six-component force balance is utilized to acquire the forces, importantly horizontal (thrust) and vertical (lift) directions.
Wind tunnel testing is carried out for different speeds and its corresponding drag values are calculated, given in Table 16. The intent of performing the wind tunnel test is to validate the drag force obtained from the CFD analysis/simulation [40]. Hence, the comparison is done during hovering condition (where there is possibility of maximum drag force due to maximum cross-section area) for the simulation and wind tunnel test. The wind velocity provided in the wind tunnel is equivalent to the velocity of the quadcopter used in the simulations, i.e., instead of the quadcopter moving against the wind, wind is blown against the quadcopter [41,42]. For this, the drag force is provided through rotation of propellers in the CFD simulation whereas in the wind tunnel, the drag force is provided externally.
Comparative evaluation between numerical and experimental analysis for a wind speed of 4.7 m/s is achieved. There is an error of 3% between these two results observed for the drag force, as given in Table 17.
8. Assembly Integration and Field Analysis
The 3D printed monocoque Quadcopter structure accounted for integration of electronic components and assembly of motors. Based on frame dimensions and estimated thrust, four motors with 1.5 kg thrust and propellers with 8 × 4.5 inch are chosen. A Lithium Polymer battery of 3 cells 5000 mAh with 15 C Rating is utilized as a power source and Emax 2213 motors with a 935 kv rating and Electronic Speed Controller of 30 amps are used for generating thrust force. EMAX BLHELI SERIES electronic speed controller with GPS is used. A 2.4 GHz Radio communication for the range of 2 km and 433 MHz telemetry for real time data transmission to the ground control station is employed for transmission and receiving of the signals. The complete assembly of the Quadcopter is shown in Figure 30. After the successful assembly, field trials were carried out both indoor and outdoor to calculate the flight time and ensuring the integrity of the structure for 2 kg all-up weight.
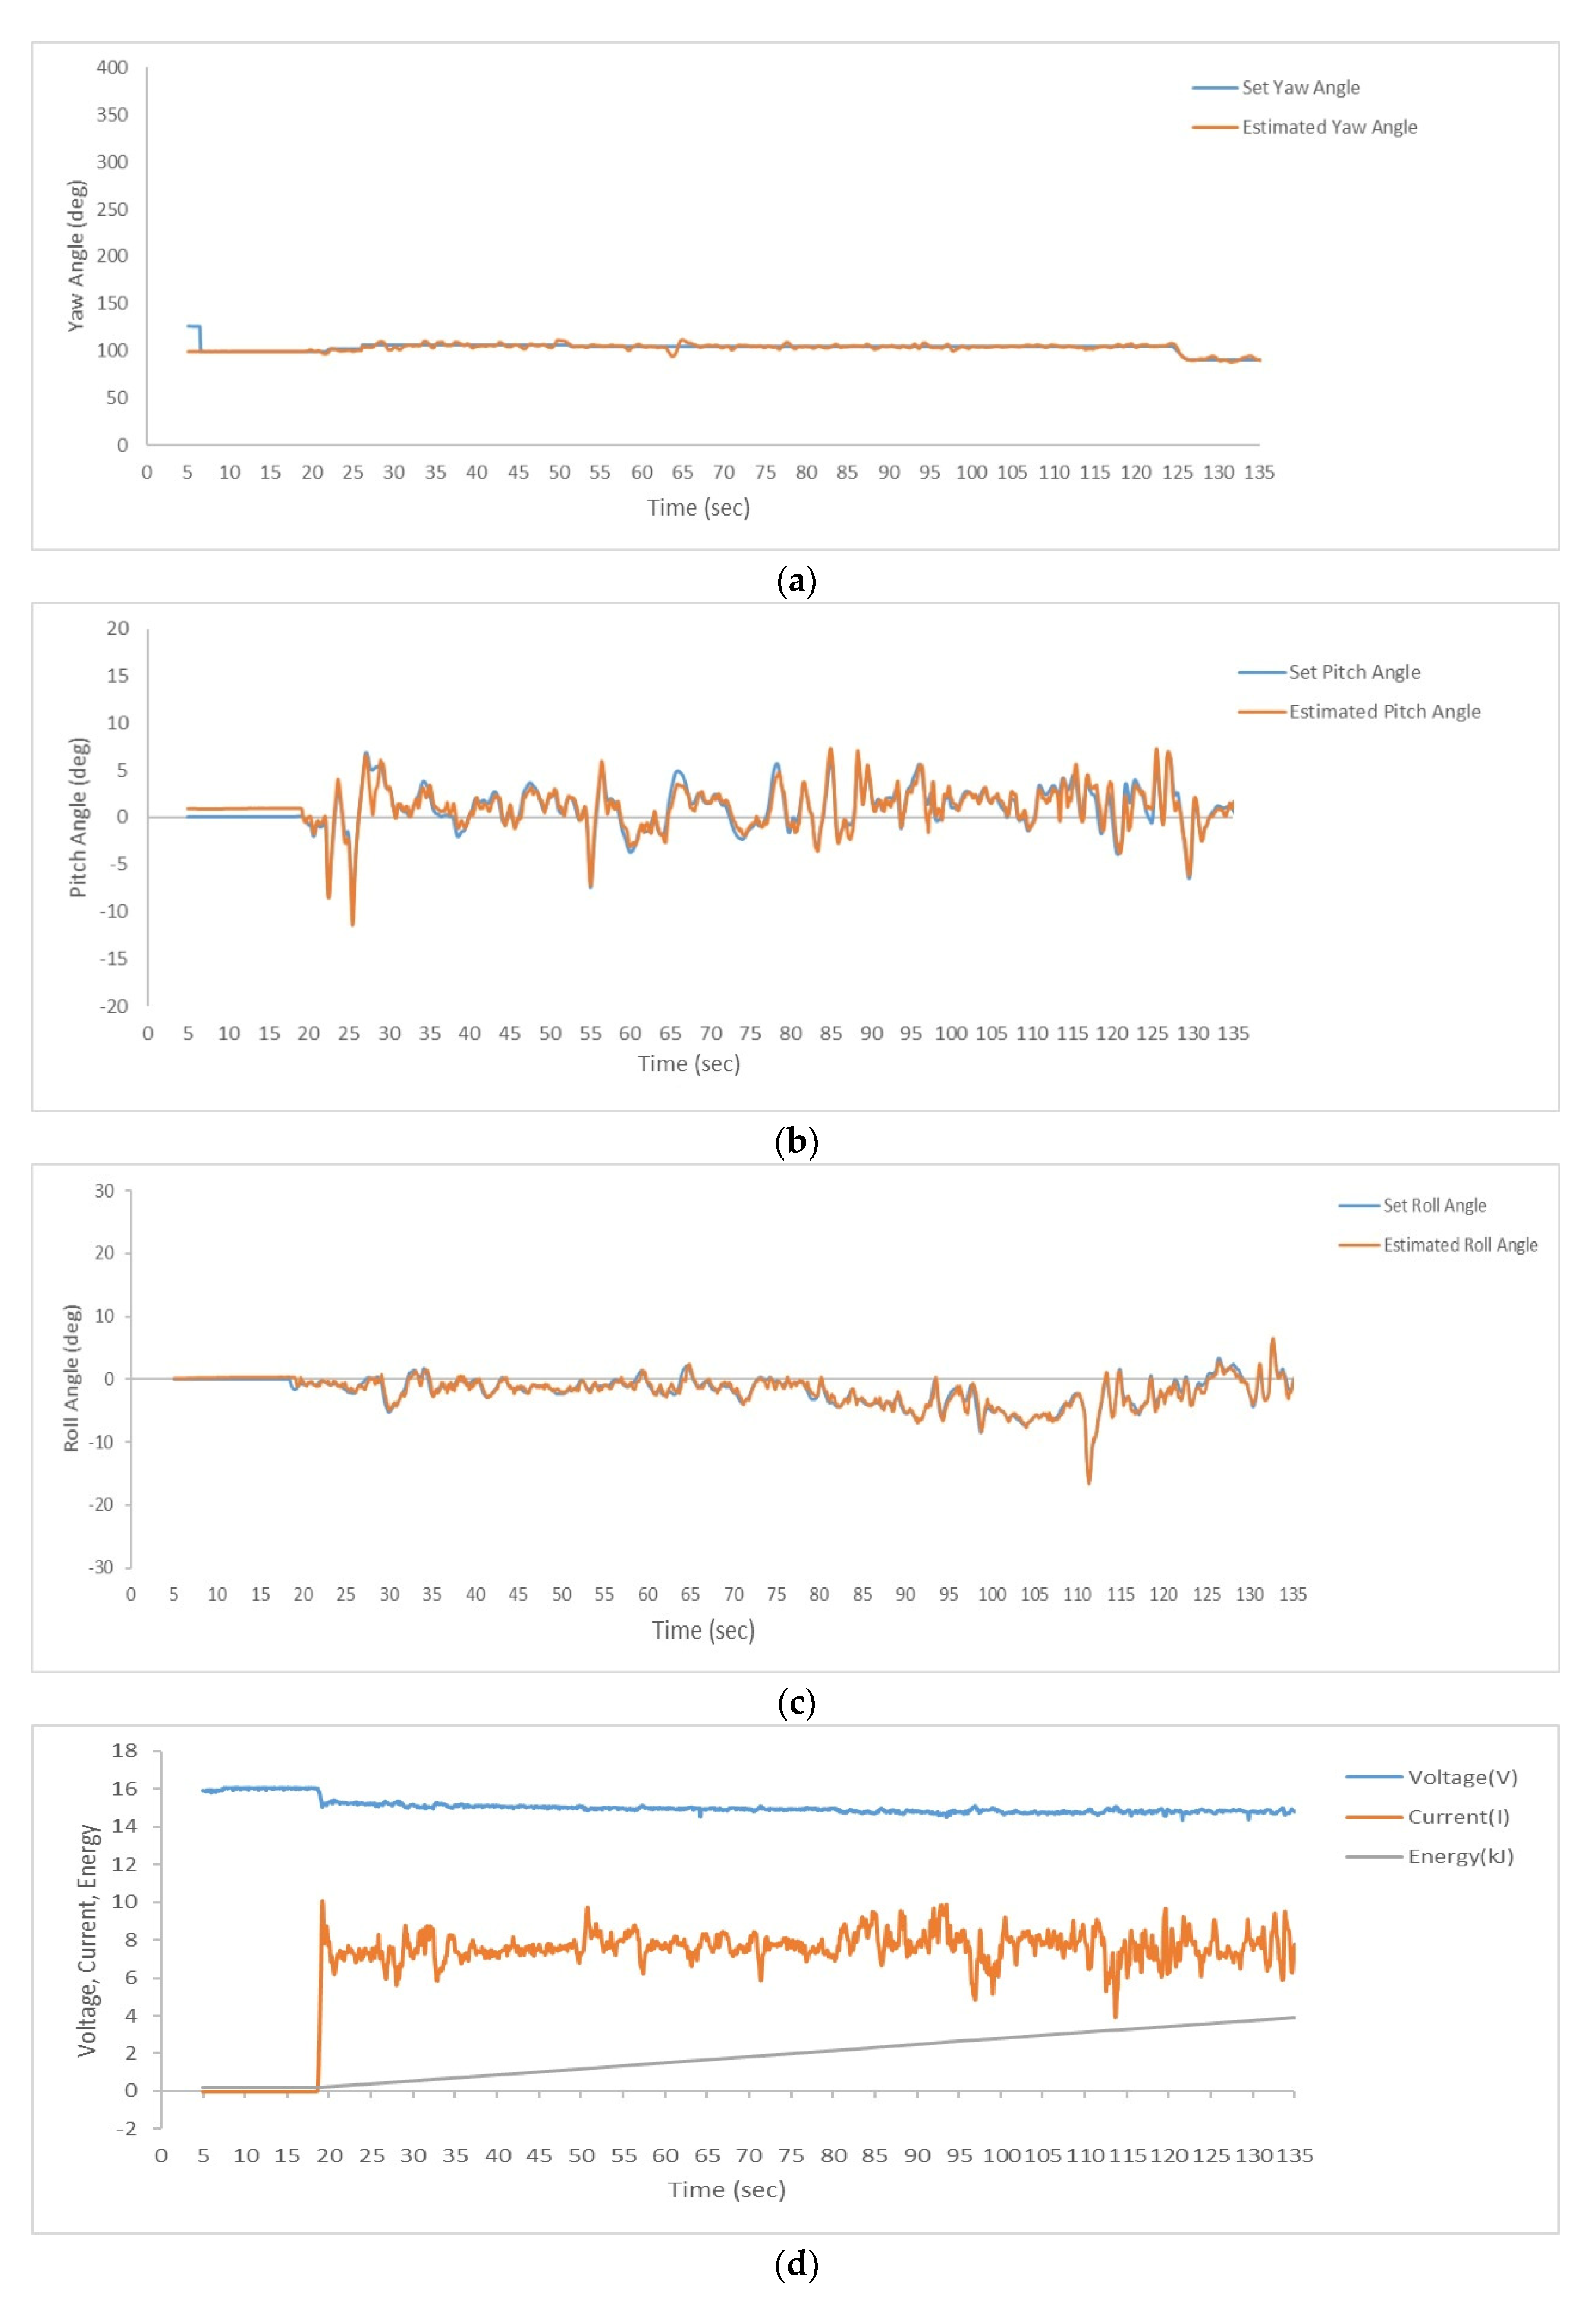
Relevant flight variables are analyzed to observe the behavior and attitude of the vehicle. Therefore, it can be concluded that the structure is stable and capable of lifting an all-up weight of 2 kg with an endurance of 12.01 min. Field analysis is carried out for the monocoque Quadcopter with all-up weight of 2 kg and it is observed that the Quadcopter achieved stable flight and the yaw, pitch and roll angles for the estimated and set points are almost matched, as shown in Figure 31a–c. The energy consumption was determined from the battery performance as shown in Figure 31d.
The innovative feature of this work is to develop a unibody Quadcopter that can provide a high thrust-to-weight ratio that improves the maneuverability complemented by other features with a significantly smaller amount of assembly time. The intended application for the designed Quadcopter is non-military and the number of field trails carried out to examine the stability and measure the endurance is about 50. It was tested under different wind and environmental conditions. During normal wind conditions, the Quadcopter system was quite stable and an increase in wind speed causes instability. During the field trials, the wind speed ranges from 3.4 m/s to 7.3 m/s, which is measured using a handheld anemometer. During these wind speeds, the stability of the Quadcopter is tested in autonomous mode. In the case of instability, manual control is performed to stay afloat. Based on this composite performance, it can be inferred that the Quadcopter developed by us provides the users multitudinous benefits of high endurance, greater maneuverability and considerably less time for deployment which in effect renders a suitable piece of armamentarium for the rapid reaction in surveillance applications.
9. Conclusions
In this research work, integration of optimization with AM principles is realized for a Quadcopter structure. Both structural compliance and mass matrices are taken together for obtaining the optimum product design layout. Topology optimization resulted in a quadcopter geometry with a minimal possible weight that is capable of enduring an all-up weight of 2 kg and satisfying the displacement and loading boundary constraints. The developed topologically optimized unified Quadcopter structure reduces the assembly time to zero and achieves superior structural integrity. From the modal analysis, it is concluded that the design fails at the first natural frequency at 98.8 Hz and from the fatigue analysis it is concluded the fatigue life of the manufactured monocoque Quadcopter structures can withstand 1e7 cycles. Based on the experimental vibrational analysis, it is noted that the maximum amplitude of vibration occurring at the highest “g” value (20.18) is 1 mm. In addition, the CFD analysis results suggested that an increase in AoA causes a decrease in lift force and increase in lift force in both hovering and forward flight conditions. At 4° AoA, maximum lift force is attained. Flight trails demonstrate good stability of UAV. Experimental and Numerical results are a close match with 3% error resulting. It is concluded that the designed Quadcopter UAV can withstand the effect of cyclic loads and other external loads to attain a stable flight. Hence, amalgamation of topology optimization and AM is considered to be an effective approach that can be well utilized to reduce the weight of the Quadcopter structure through which the performance of the monocoque Quadcopter is enhanced. In future, dynamic analysis and impact strength characteristics will be performed and also other AM techniques will be exploited.
Author Contributions
Conceptualization, S.N. and B.E.; methodology, C.U.; software, K.S.V.; validation, S.N., B.E. and K.S.V.; formal analysis, L.-J.Y.; investigation, C.U.; resources, L.-J.Y.; data curation, B.E.; writing—original draft preparation, S.N.; writing—review and editing, B.E.; visualization, K.S.V.; supervision, C.U.; project administration, L.-J.Y.; funding acquisition, L.-J.Y. All authors have read and agreed to the published version of the manuscript.
Funding
This research was funded by the Ministry of Science and Technology, Taiwan; grant numbers of 109-2221-E-032-002-MY2, 109-2221-E-032-001-MY3 and 111-2923-E-032-001-MY3.
Institutional Review Board Statement
Not applicable.
Informed Consent Statement
Not applicable.
Data Availability Statement
The initial and final models discussed in this manuscript are available at: osf.io/3j6c4 (accessed on 4 November 2021).
Conflicts of Interest
The authors declare no conflict of interest.
References
- Ostojić, G.; Stankovski, S.; Tejić, B.; Đukić, N.; Tegeltija, S. Design, control and application of Quadcopter. Int. J. Ind. Eng. Manag. 2015, 6, 43–48. [Google Scholar]
- Kumar, V.; Michael, N. Opportunities and challenges with autonomous micro aerial vehicles. Int. J. Robot. Res. 2012, 31, 1279–1291. [Google Scholar] [CrossRef]
- Hamurcu, M.; Eren, T. Selection of unmanned aerial vehicles by using multicriteria decision-making for defence. J. Math. 2020, 2020, 4308756. [Google Scholar] [CrossRef]
- Ma, L.; Li, M.; Tong, L.; Wang, Y.; Cheng, L. Using Unmanned aerial vehicle for remote sensing application. In Proceedings of the 2013 21st International Conference on Geoinformatics, Kaifeng, China, 20–22 June 2013; pp. 1–5. [Google Scholar]
- DeBusk, W. Unmanned aerial vehicle systems for disaster relief: Tornado alley. In AIAA Infotech@ Aerospace 2010; AIAA: Reston, VA, USA, 2010. [Google Scholar] [CrossRef] [Green Version]
- Doherty, P.; Rudol, P. A UAV Search and rescue scenario with human body detection and geolocalization. In Australasian Joint Conference on Artificial Intelligence; Springer: Berlin/Heidelberg, Germany, 2007; pp. 1–13. [Google Scholar]
- Barnard, J.A. The use of unmanned aircraft in oil, gas and mineral E + P activities. In SEG Technical Program Expanded Abstracts 2008; Society of Exploration Geophysicists: Tulsa, OK, USA, 2008; pp. 1132–1136. [Google Scholar] [CrossRef]
- Manyoky, M.; Theiler, P.; Steudler, D.; Eisenbeiss, H. Unmanned aerial vehicle in cadastral applications. In Proceedings of the International Conference on Unmanned Aerial Vehicle in Geomatics (UAV-G), Zurich, Switzerland, 14–16 September 2011; Copernicus: Gottingen, Germany, 2011; Volume 38, pp. 57–62. [Google Scholar] [CrossRef]
- Moon, S.K.; Tan, Y.E.; Hwang, J.; Yoon, Y.-J. Application of 3D printing technology for designing light-weight unmanned aerial vehicle wing structures. Int. J. Precis. Eng. Manuf. Green Technol. 2014, 1, 223–228. [Google Scholar] [CrossRef]
- Yang, L.-J.; Esakki, B.; Chandrasekhar, U.; Hung, K.-C.; Cheng, C.-M. Practical Flapping Mechanisms for 20 cm-span Micro Air Vehicles. Int. J. Micro Air Veh. 2015, 7, 181–202. [Google Scholar] [CrossRef] [Green Version]
- Mahony, R.; Kumar, V.; Corke, P. Multirotor aerial vehicles: Modeling, estimation, and control of quadrotor. IEEE Robot. Autom. Mag. 2012, 19, 20–32. [Google Scholar] [CrossRef]
- Bhatia, V.; Karthikeyan, R.; Ram, R.G.; Cooper, Y.N. Design optimisation and analysis of a quadrotor arm using finite element method. Appl. Mech. Mater. 2014, 664, 371–375. [Google Scholar] [CrossRef]
- Goh, G.D.; Agarwala, S.; Goh, G.L.; Dikshit, V.; Sing, S.L.; Yeong, W.Y. Additive manufacturing in unmanned aerial vehicles (UAVs): Challenges and potential. Aerosp. Sci. Technol. 2017, 63, 140–151. [Google Scholar] [CrossRef]
- Klippstein, H.; Diaz De Cerio Sanchez, A.; Hassanin, H.; Zweiri, Y.; Seneviratne, L. Fused deposition modeling for unmanned aerial vehicles (UAVs): A Review. Adv. Eng. Mater. 2018, 20, 1700552. [Google Scholar] [CrossRef] [Green Version]
- Campbell, T.A.; Ivanova, O. Additive manufacturing as a disruptive technology: Implications of three-dimensional printing. Technol. Innov. 2013, 15, 67–79. [Google Scholar] [CrossRef]
- Ngo, T.D.; Kashani, A.; Imbalzano, G.; Nguyen, K.T.Q.; Hui, D. Additive manufacturing (3D printing): A review of materials, methods, applications and challenges. Compos. Part B Eng. 2018, 143, 172–196. [Google Scholar] [CrossRef]
- Larsson, R. Methodology for Topology and Shape Optimization: Application to a Rear Lower Control Arm. Master’s Thesis, Chalmers University of Technology, Goteborg, Sweden, 2016. [Google Scholar]
- Ferro, C.G.; Mazza, A.; Belmonte, D.; Seclì, C.; Maggiore, P. A Comparison between 3D Printing and Milling Process for a Spar Cap Fitting (Wing-fuselage) of UAV Aircraft. Procedia CIRP 2017, 62, 487–493. [Google Scholar] [CrossRef]
- Pascariu, I.S.; Zaharia, S.M. Design and testing of an unmanned aerial vehicle manufactured by fused deposition modeling. J. Aerosp. Eng. 2020, 33, 06020002. [Google Scholar] [CrossRef]
- Fillingim, K.B.; Nwaeri, R.O.; Paredis, C.J.J.; Rosen, D.; Fu, K. Examining the effect of design for additive manufacturing rule presentation on part redesign quality. J. Eng. Des. 2020, 31, 427–460. [Google Scholar] [CrossRef]
- Hunt, G.; Mitzalis, F.; Alhinai, T.; Hooper, P.A.; Kovac, M. 3D printing with flying robots. In Proceedings of the 2014 IEEE International Conference on Robotics and Automation (ICRA), Hong Kong, China, 31 May–7 June 2014. [Google Scholar]
- Dams, B.; Wu, Y.; Shepherd, P.; Ball, R.J. Aerial additive building manufacturing of 3D printed cementitious structures. In Proceedings of the 37th Cement and Concrete Science Conference UCL, London, UK, 11–12 September 2017. [Google Scholar]
- Toleos, L.R., Jr.; Luna, N.J.; Manuel, M.C.; Chua, J.M.; Sangalang, E.M.; So, P.C. Feasibility study for Fused Deposition Modeling (FDM) 3D-printed propellers for unmanned aerial vehicles. Int. J. Mech. Eng. Robot. Res. 2020, 9, 548–558. [Google Scholar] [CrossRef]
- Sagar, N.V.S.S.; Vepa, K.S. Experimental investigations for improving the strength of parts manufactured using FDM process. In Innovative Design, Analysis and Development Practices in Aerospace and Automotive Engineering (I-DAD 2018); Springer: Singapore, 2019; pp. 307–313. [Google Scholar] [CrossRef]
- Dvorakova, J.; Dvorak, K. Topological optimization of a component made by the FDM method. Int. J. Mech. Eng. Robot. Res. 2021, 10, 67–71. [Google Scholar] [CrossRef]
- Nguyen, D.S.; Vignat, F. Topology optimization as an innovative design method for additive manufacturing. In Proceedings of the 2017 IEEE In-ternational Conference on Industrial Engineering and Engineering Management (IEEM), Singapore, 10–13 December 2017. [Google Scholar] [CrossRef]
- Gebisa, A.W.; Lemu, H. A case study on topology optimized design for additive manufacturing. In IOP Conference Series: Materials Science and Engineering; IOP Publishing: Bristol, UK, 2017. [Google Scholar] [CrossRef] [Green Version]
- Stamatelos, D.; Labeas, G. Towards the Design of a Multispar Composite Wing. Computation 2020, 8, 24. [Google Scholar] [CrossRef] [Green Version]
- Zhu, J.; Zhang, W.-H.; Xia, L. Topology optimization in aircraft and aerospace structures design. Arch. Comput. Methods Eng. 2015, 23, 595–622. [Google Scholar] [CrossRef]
- Kalanchiam, M. Application of Topology Optimization Techniques in Aircraft Design; SAE Technical Paper; SAE international: Warrendale, PA, USA, 2009. [Google Scholar] [CrossRef]
- Rezaie, R.; Badrossamay, M.; Ghaie, A.; Moosavi, H. Topology Optimization for Fused Deposition Modeling Process. Procedia CIRP 2013, 6, 521–526. [Google Scholar] [CrossRef] [Green Version]
- Taheri, A.H.; Suresh, K. An isogeometric approach to topology optimization of multi-material and functionally graded structures. Int. J. Numer. Methods Eng. 2016, 109, 668–696. [Google Scholar] [CrossRef]
- Nvss, S.; Esakki, B.; Udayagiri, C. Design of Monocoque Quadcopter Structure through Inte-gration of Additive Manufacturing and Topology Optimization. Int. J. Eng. Adv. Technol. 2019, 8, 5. [Google Scholar]
- Balasubramanian, E.; Sagar, N.V.; Chandrasekhar, U.; Salunkhe, S. Development of light weight multirotor UAV structures through synergistic application of design analysis and fused deposition modelling. Int. J. Mater. Prod. Technol. 2019, 59, 229–238. [Google Scholar] [CrossRef]
- Utimura, S.; Tenorio, J.; Espinosa, D. The Effect of Ethanol Concentration for the Separation of ABS and HIPS from Waste Elec-trical and Electronic Equipment (WEEE) by Flotation Technique. In EPD Congress 2014; Wiley Online Library: Hoboken, NJ, USA, 2014. [Google Scholar] [CrossRef]
- Nvss, S.; Esakki, B.; Yang, L.-J.; Udayagiri, C.; Vepa, K.S. Design and Development of Unibody Quadcopter Structure Using Optimization and Additive Manufacturing Techniques. OSF. 2022. Available online: osf.io/3j6c4 (accessed on 4 November 2021).
- Raj, P.G.; Esakki, B.; Vikram, P.; Yang, L.-J. Numerical Investigation on Amphibious UAV Using Turbulent Models for Drag Reduction. In Proceedings of the ICDMC 2019; Springer: Singapore, 2020; pp. 1–8. [Google Scholar]
- Ganesan, S.; Esakki, B. Computational fluid dynamic analysis of an unmanned amphibious aerial vehicle for drag reduction. Int. J. Intell. Unmanned Syst. 2020, 8, 187–200. [Google Scholar] [CrossRef]
- Jaouad, H.; Vikram, P.; Balasubramanian, E.; Surendar, G. Computational fluid dynamic analysis of amphibious vehicle, in advances in engineering design and simulation. In Advances in Engineering Design and Simulation; Springer: Berlin/Heidelberg, Germany, 2020; pp. 303–313. [Google Scholar]
- Sridhar, V.; Dwivedi, Y. Effect of peak shape in bio inspired corrugated wing. In International Conference on Advances in Thermal Systems, Materials and Design Engineering (ATSMDE2017); Elsevier: Amsterdam, The Netherlands, 2017. [Google Scholar] [CrossRef]
- Nila, A.; Vanlanduit, S.; Vepa, S.; Van Paepegem, W. A PIV-based method for estimating slamming loads during water entry of rigid bodies. Meas. Sci. Technol. 2013, 24, 045303. [Google Scholar] [CrossRef]
- Van Nuffel, D.; Vepa, K.; De Baere, I.; Lava, P.; Kersemans, M.; Degrieck, J.; De Rouck, J.; VAN Paepegem, W. A comparison between the experimental and theoretical impact pressures acting on a horizontal quasi-rigid cylinder during vertical water entry. Ocean Eng. 2014, 77, 42–54. [Google Scholar] [CrossRef] [Green Version]
Figure 1.
Overview of research methodology.

Figure 2.
Iterations for considering initial geometry.
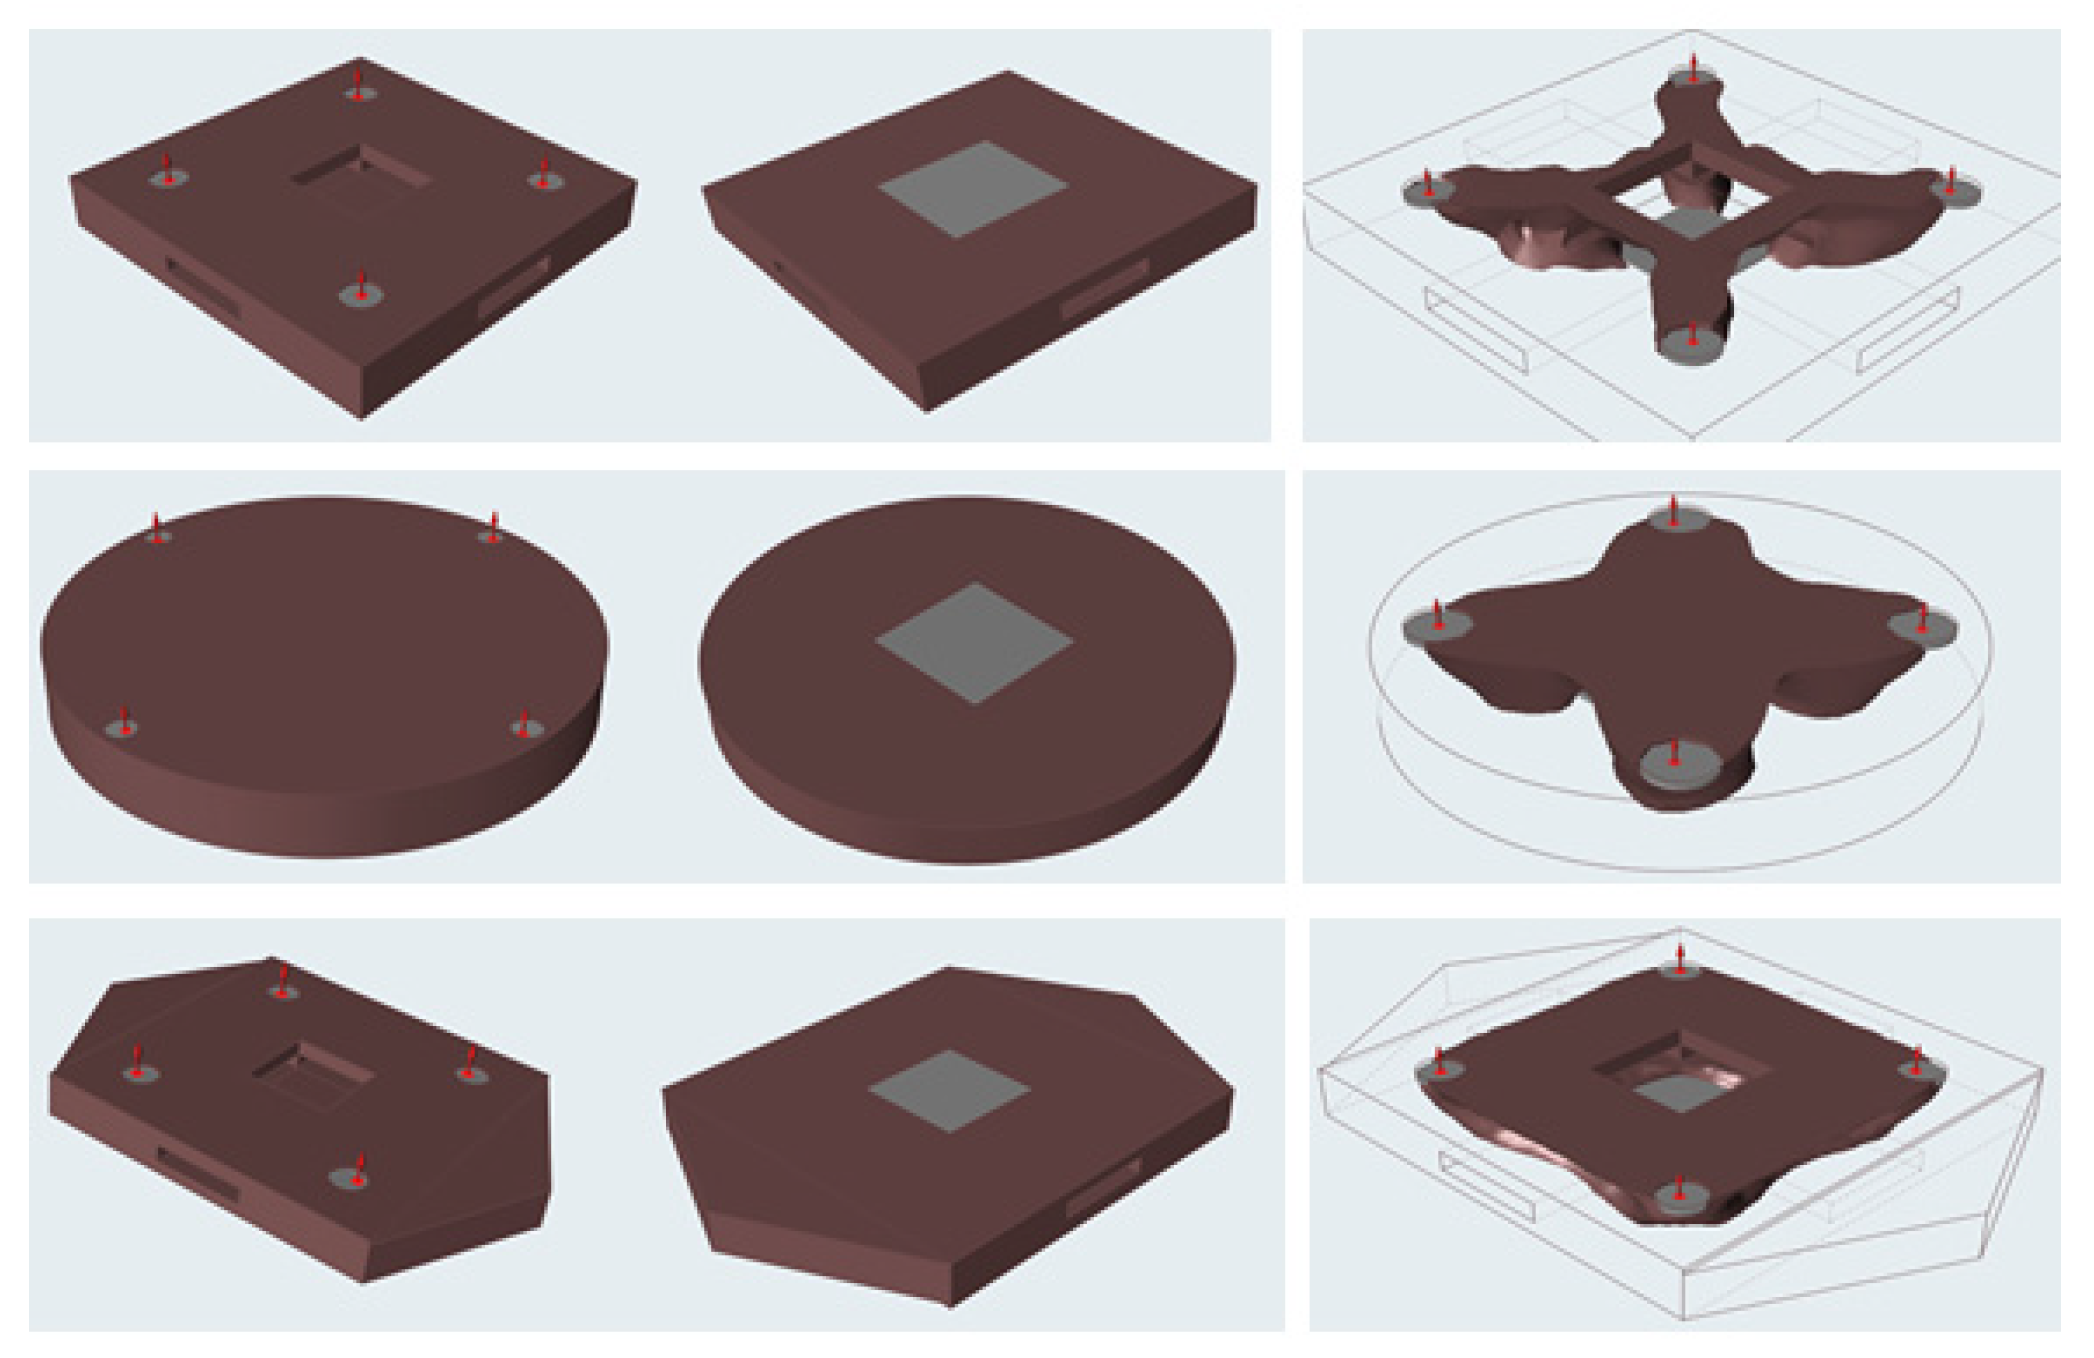
Figure 3.
Initial geometry.

Figure 4.
Design and non-design spaces.

Figure 5.
Description of load and supports.

Figure 6.
Maximum deformation for initial geometry.
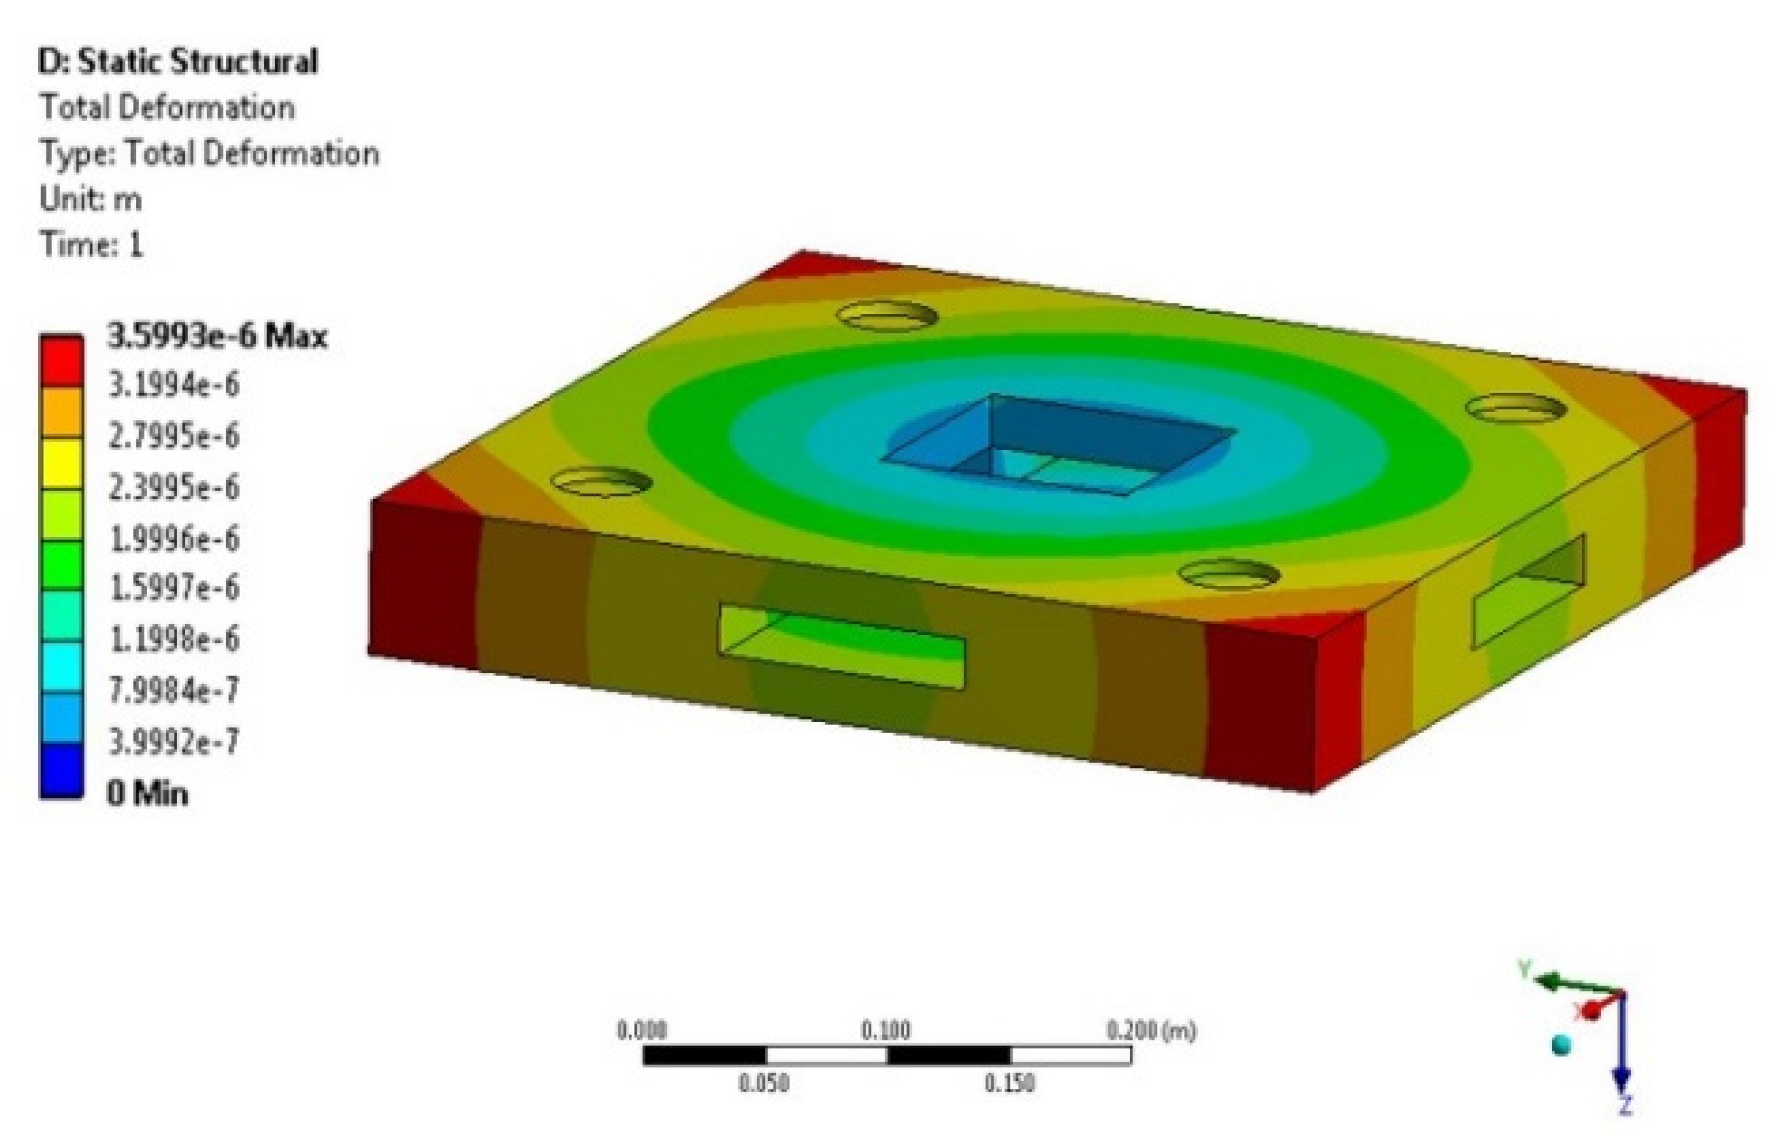
Figure 7.
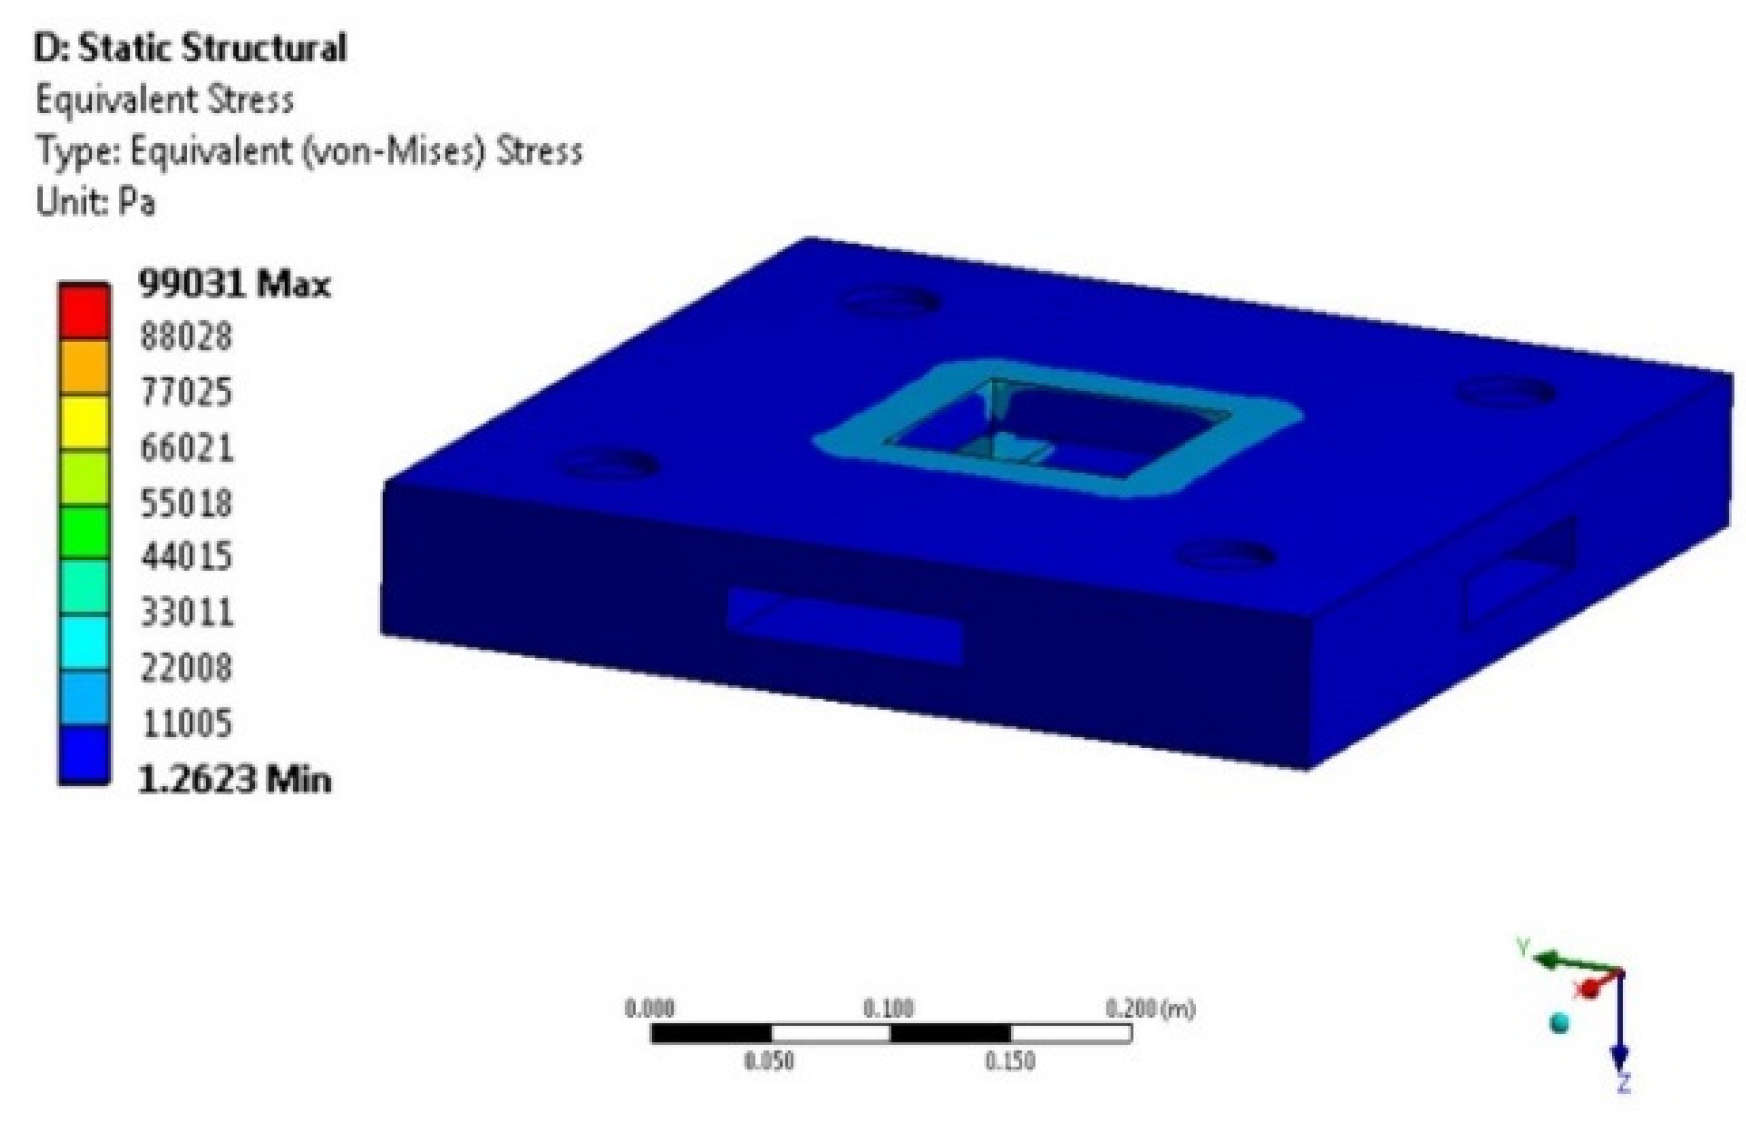
Von-Mises stress for initial geometry.

Figure 8.
Topology optimization result with monocoque model. (a) Topology density tracker, (b) Topology optimized model.
Figure 8.
Topology optimization result with monocoque model. (a) Topology density tracker, (b) Topology optimized model.
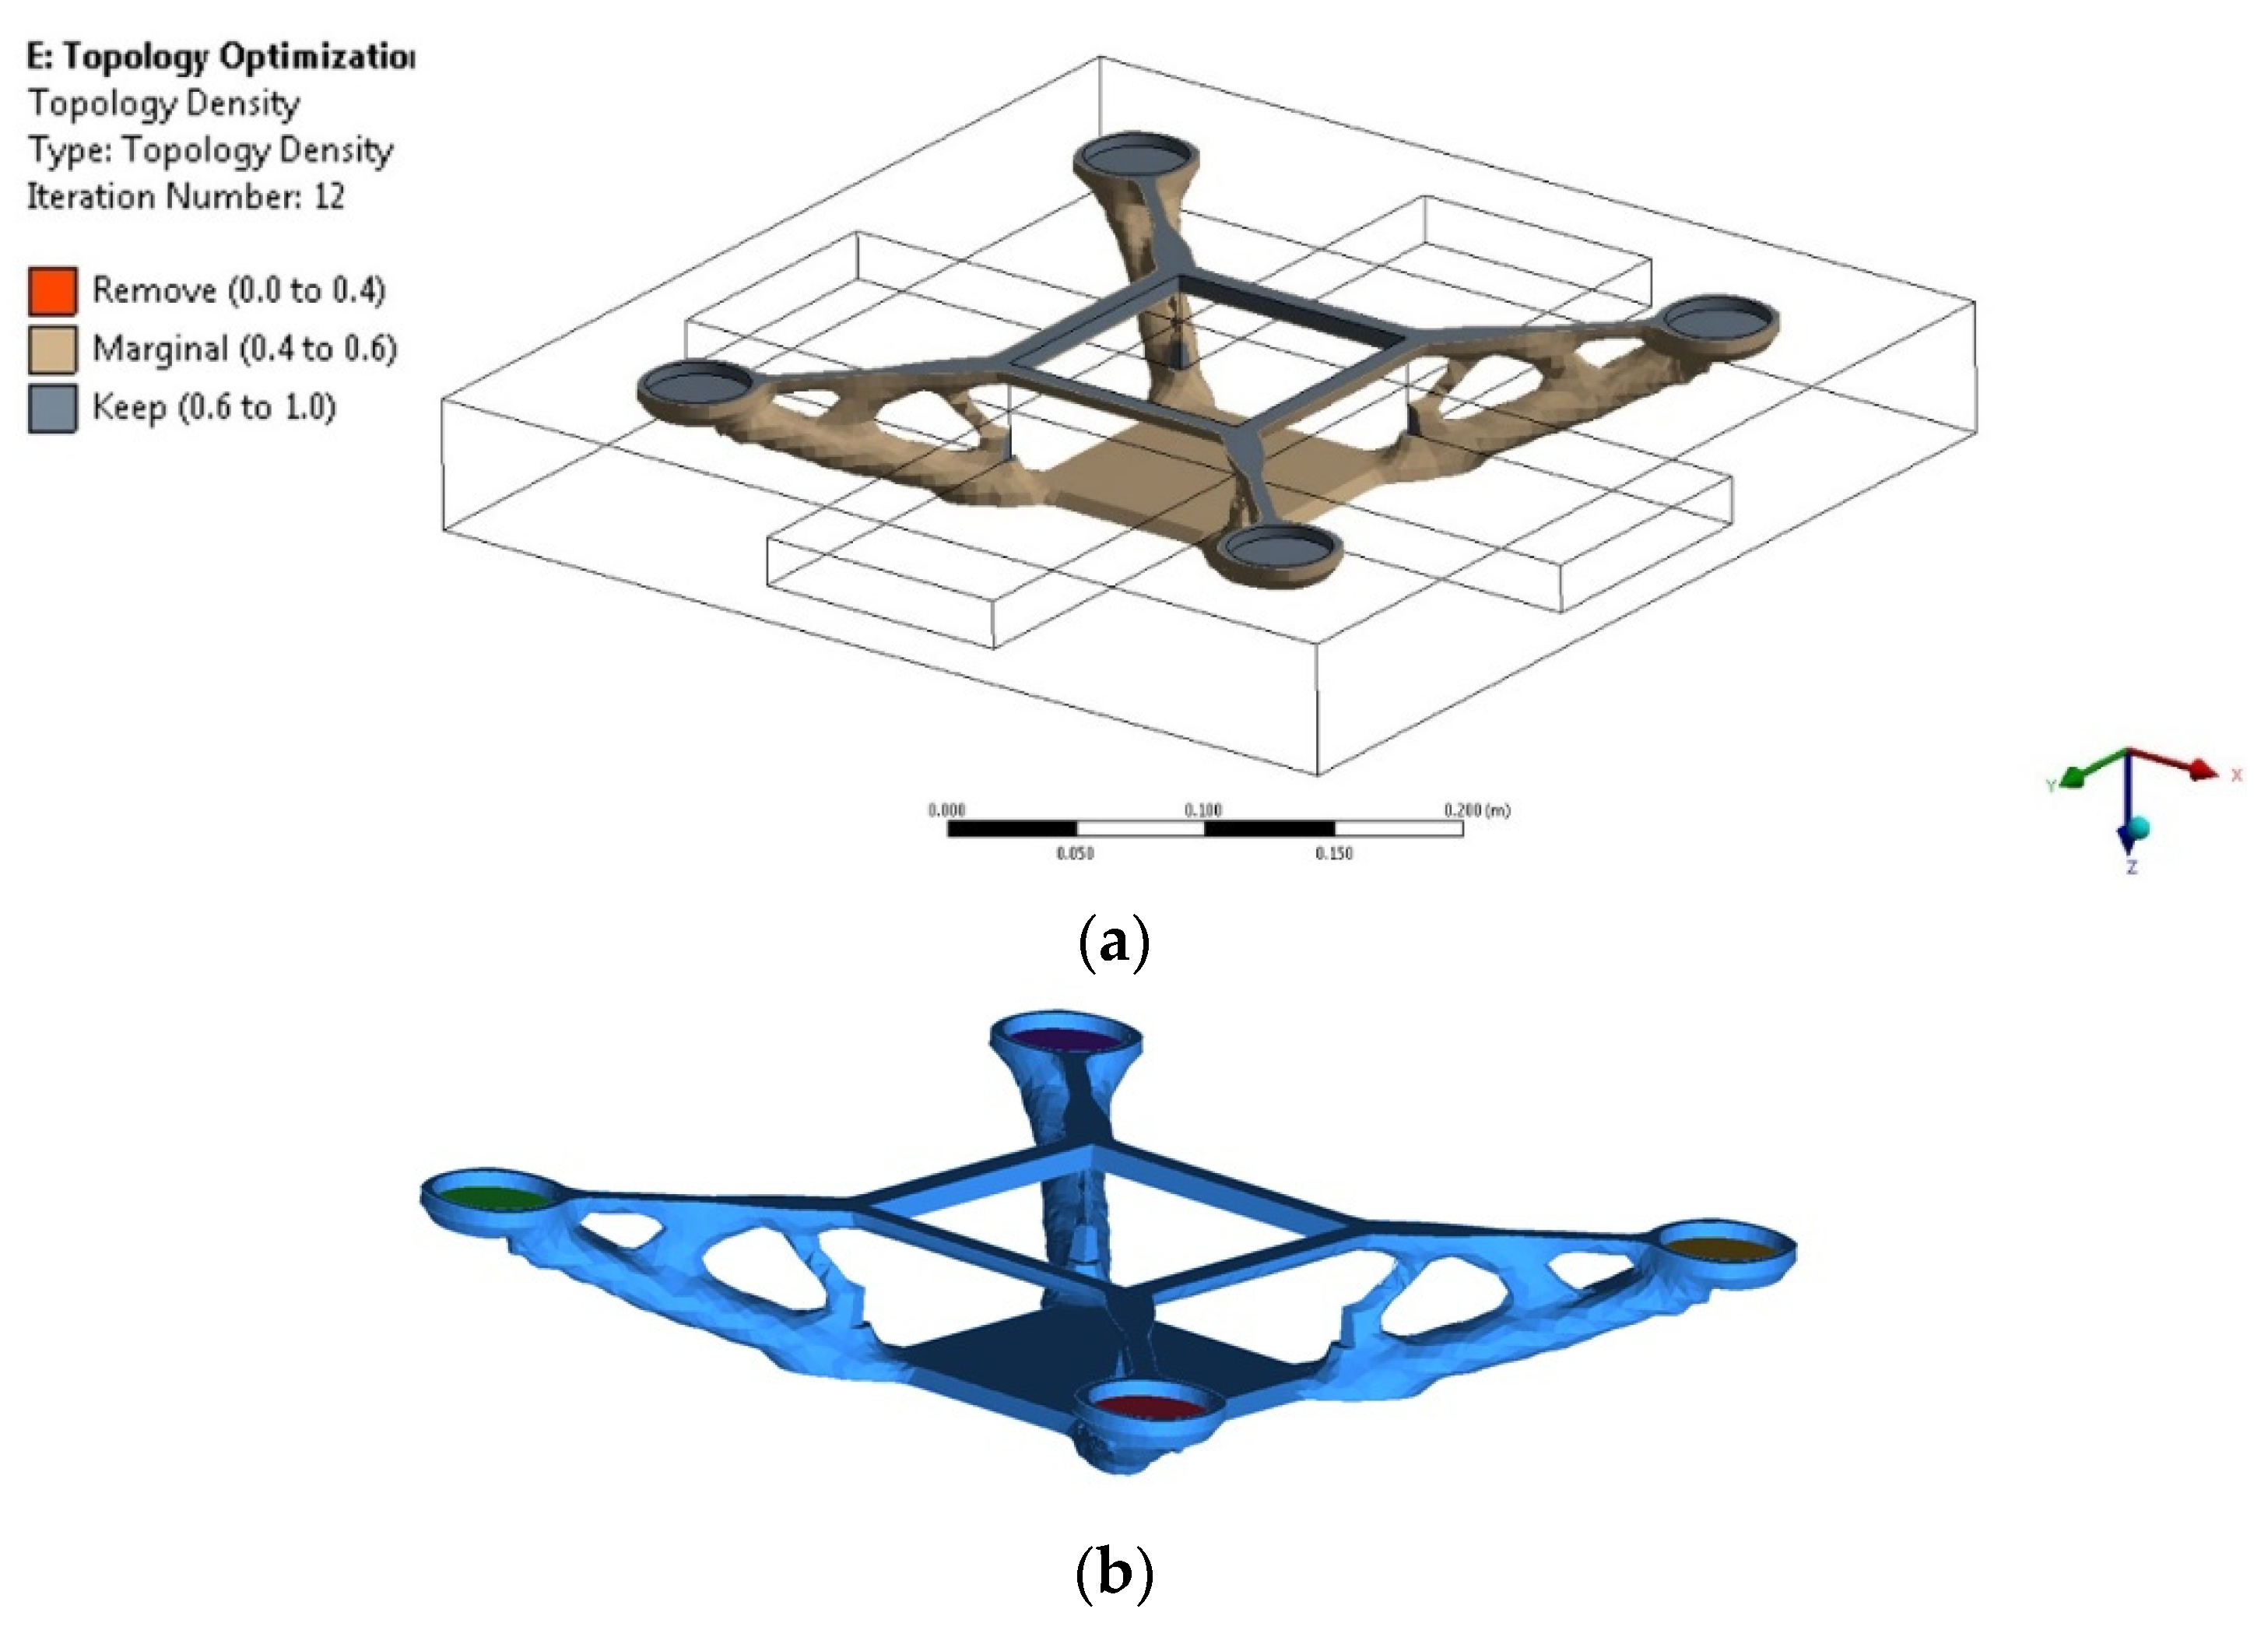
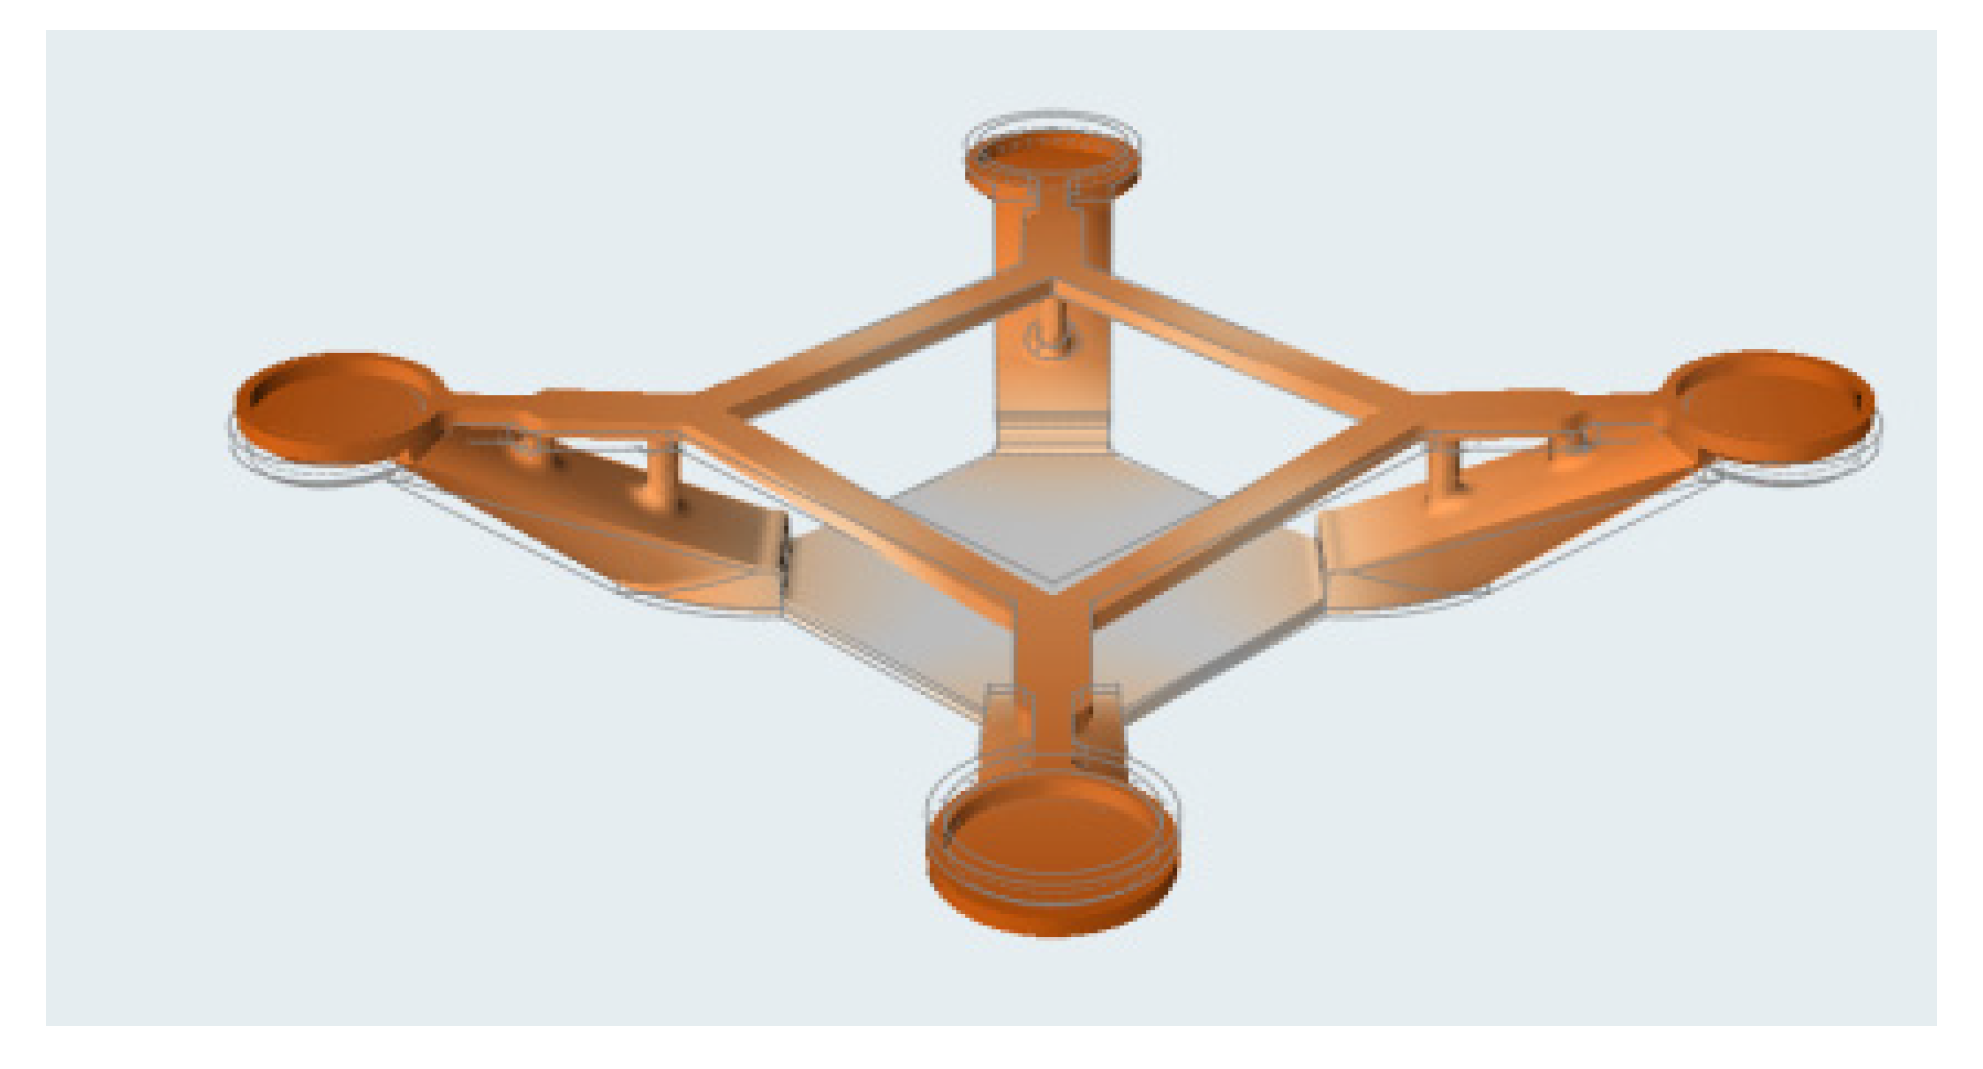
Figure 9.
Optimized geometry.
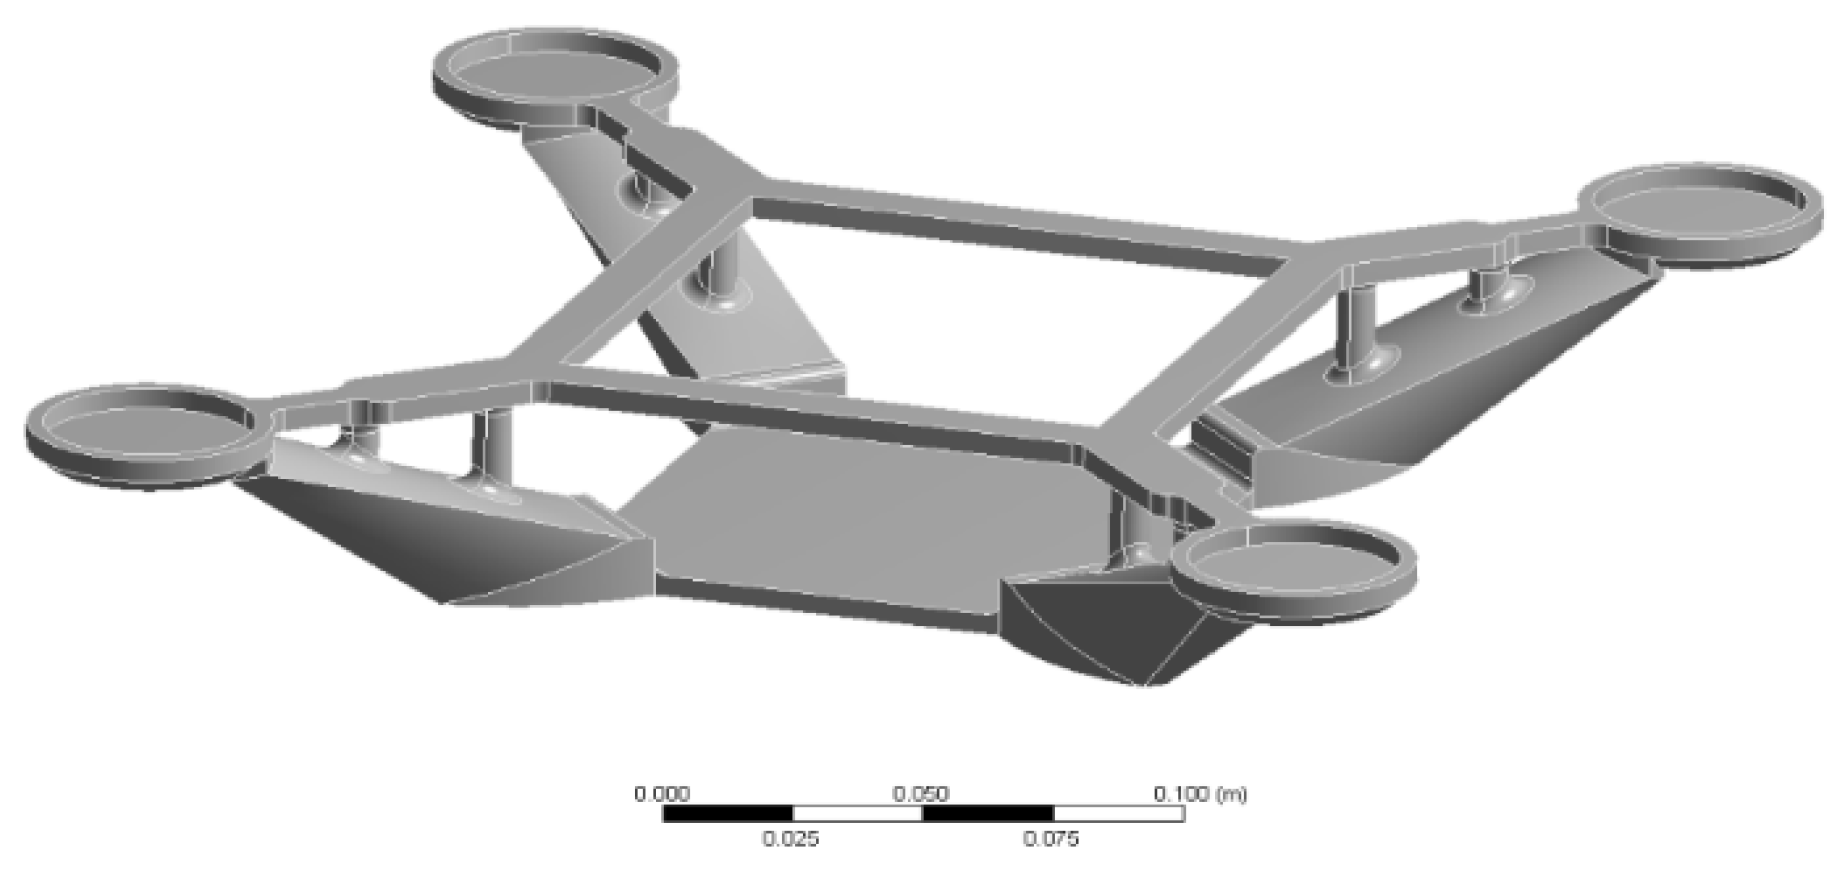
Figure 10.
Fatigue analysis.

Figure 11.
Model sliced with (a) 45° overhang angle, (b) 46° overhang angle.

Figure 12.
3D printed structure.

Figure 13.
Modal analysis.

Figure 14.
First mode shape and its corresponding frequency at 98.1 Hz.
Figure 15.
Quadcopter structure fixed to the shaker.

Figure 16.
Acceleration response for various natural frequencies.
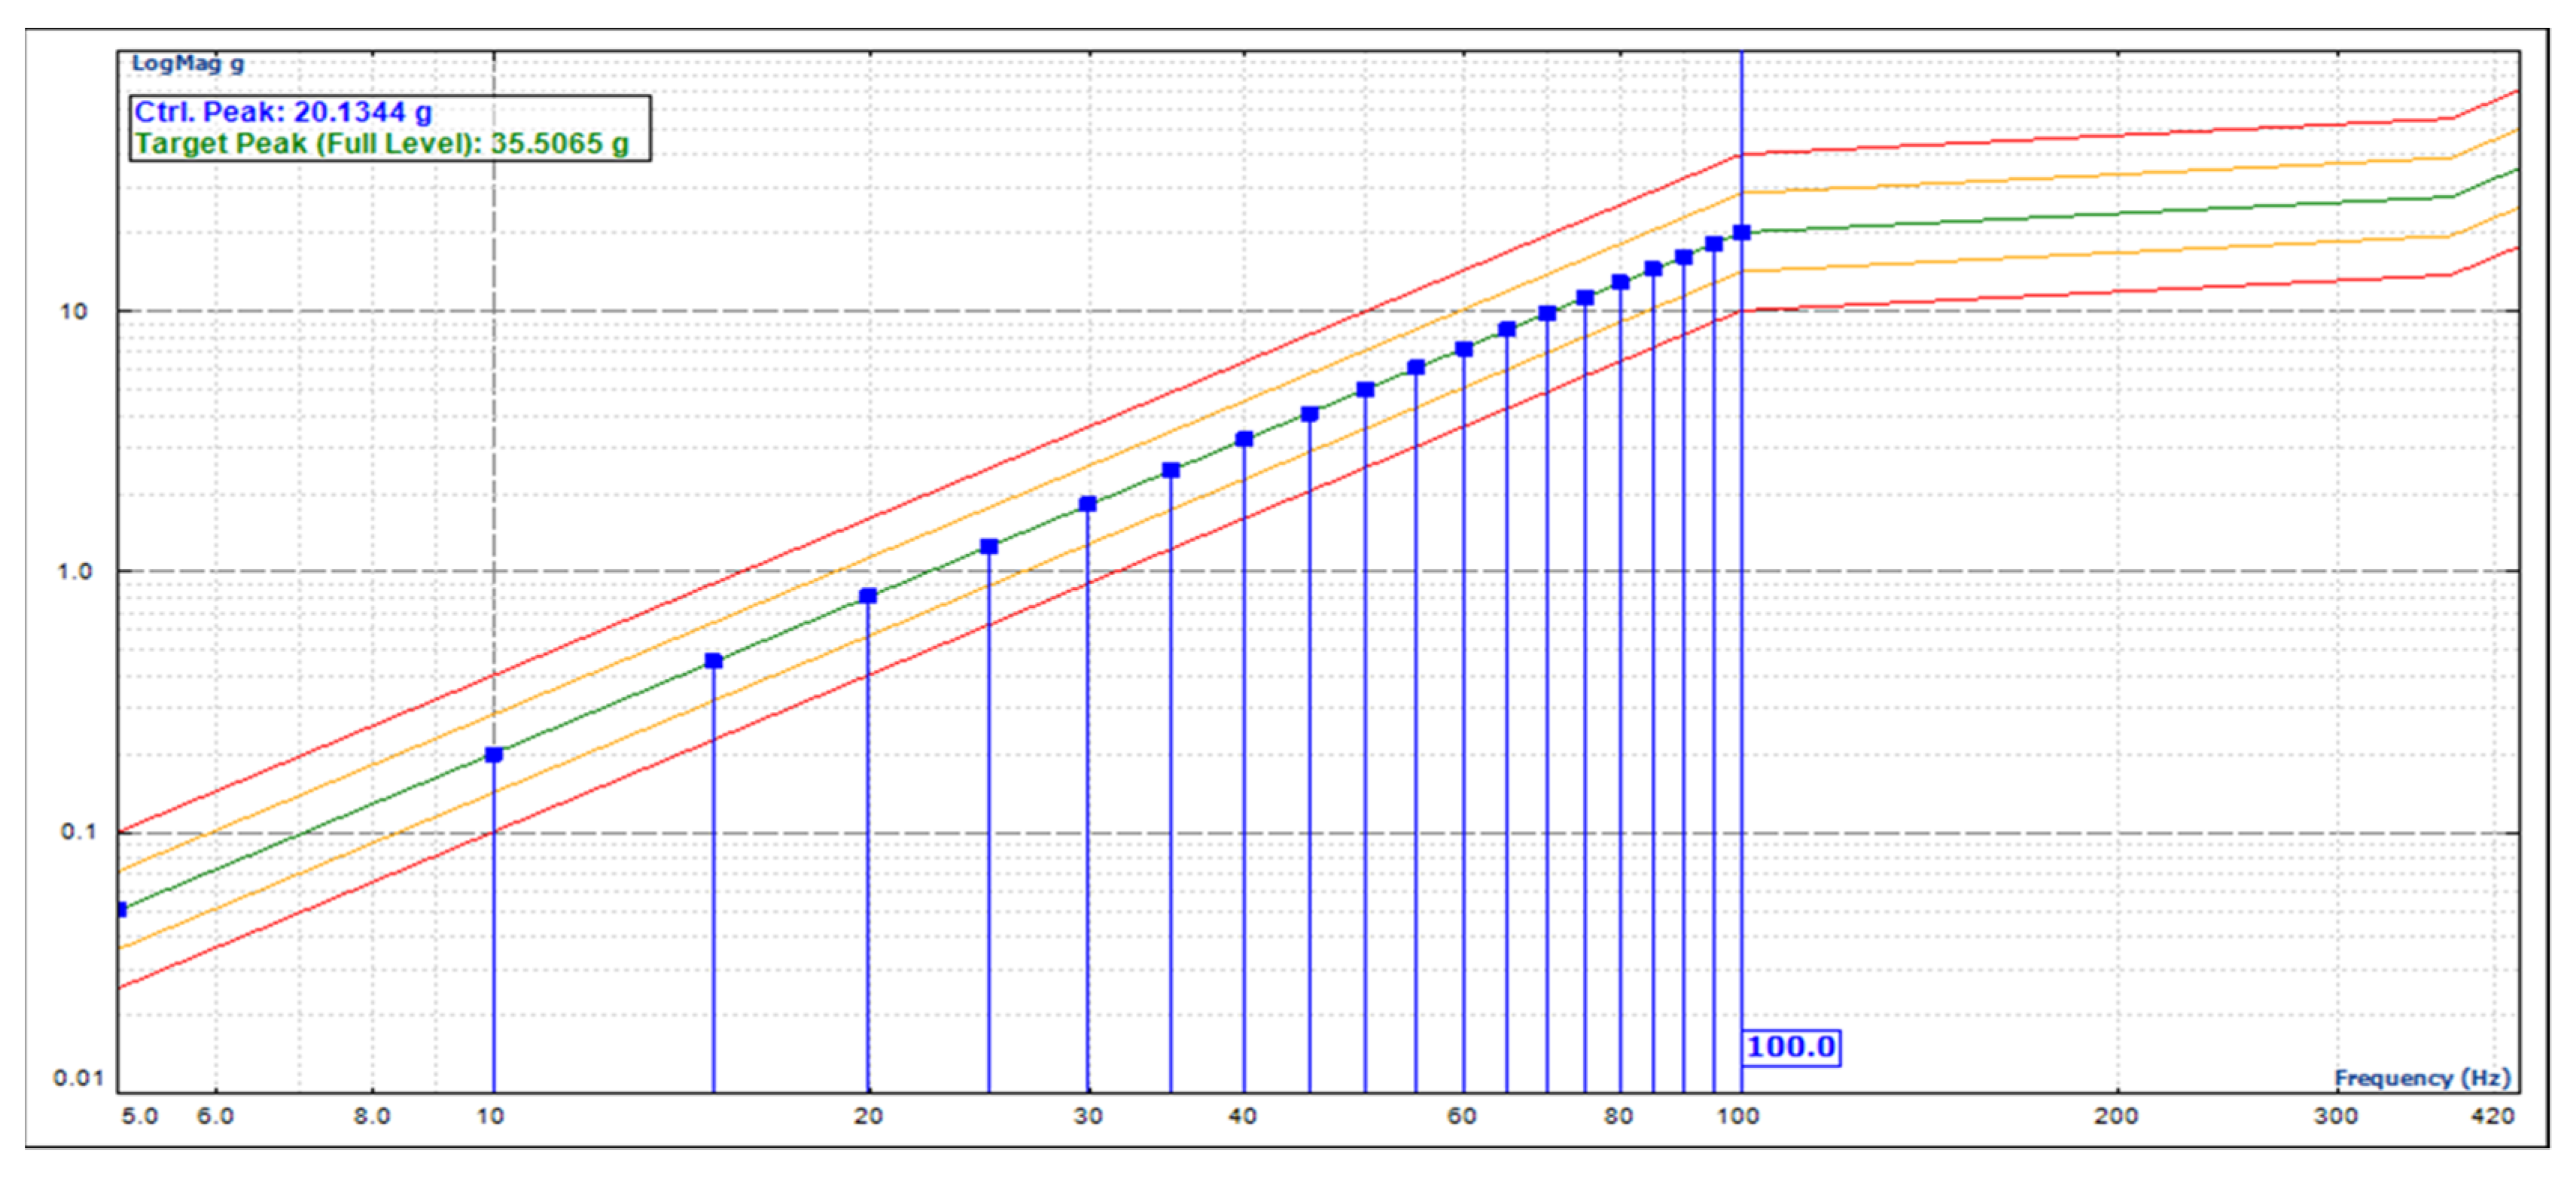
Figure 17.
Failure at first natural frequency.

Figure 18.
Von-Mises stress induced at 98.8 Hz.

Figure 19.
Monocoque Quadcopter structure with strain gauge.

Figure 20.
Data acquisition system.

Figure 21.
Strain induced during hovering, yaw left, yaw right, pitch up, pitch down, roll left and roll right.
Figure 21.
Strain induced during hovering, yaw left, yaw right, pitch up, pitch down, roll left and roll right.

Figure 22.
Measurement of strain for increase in throttle.
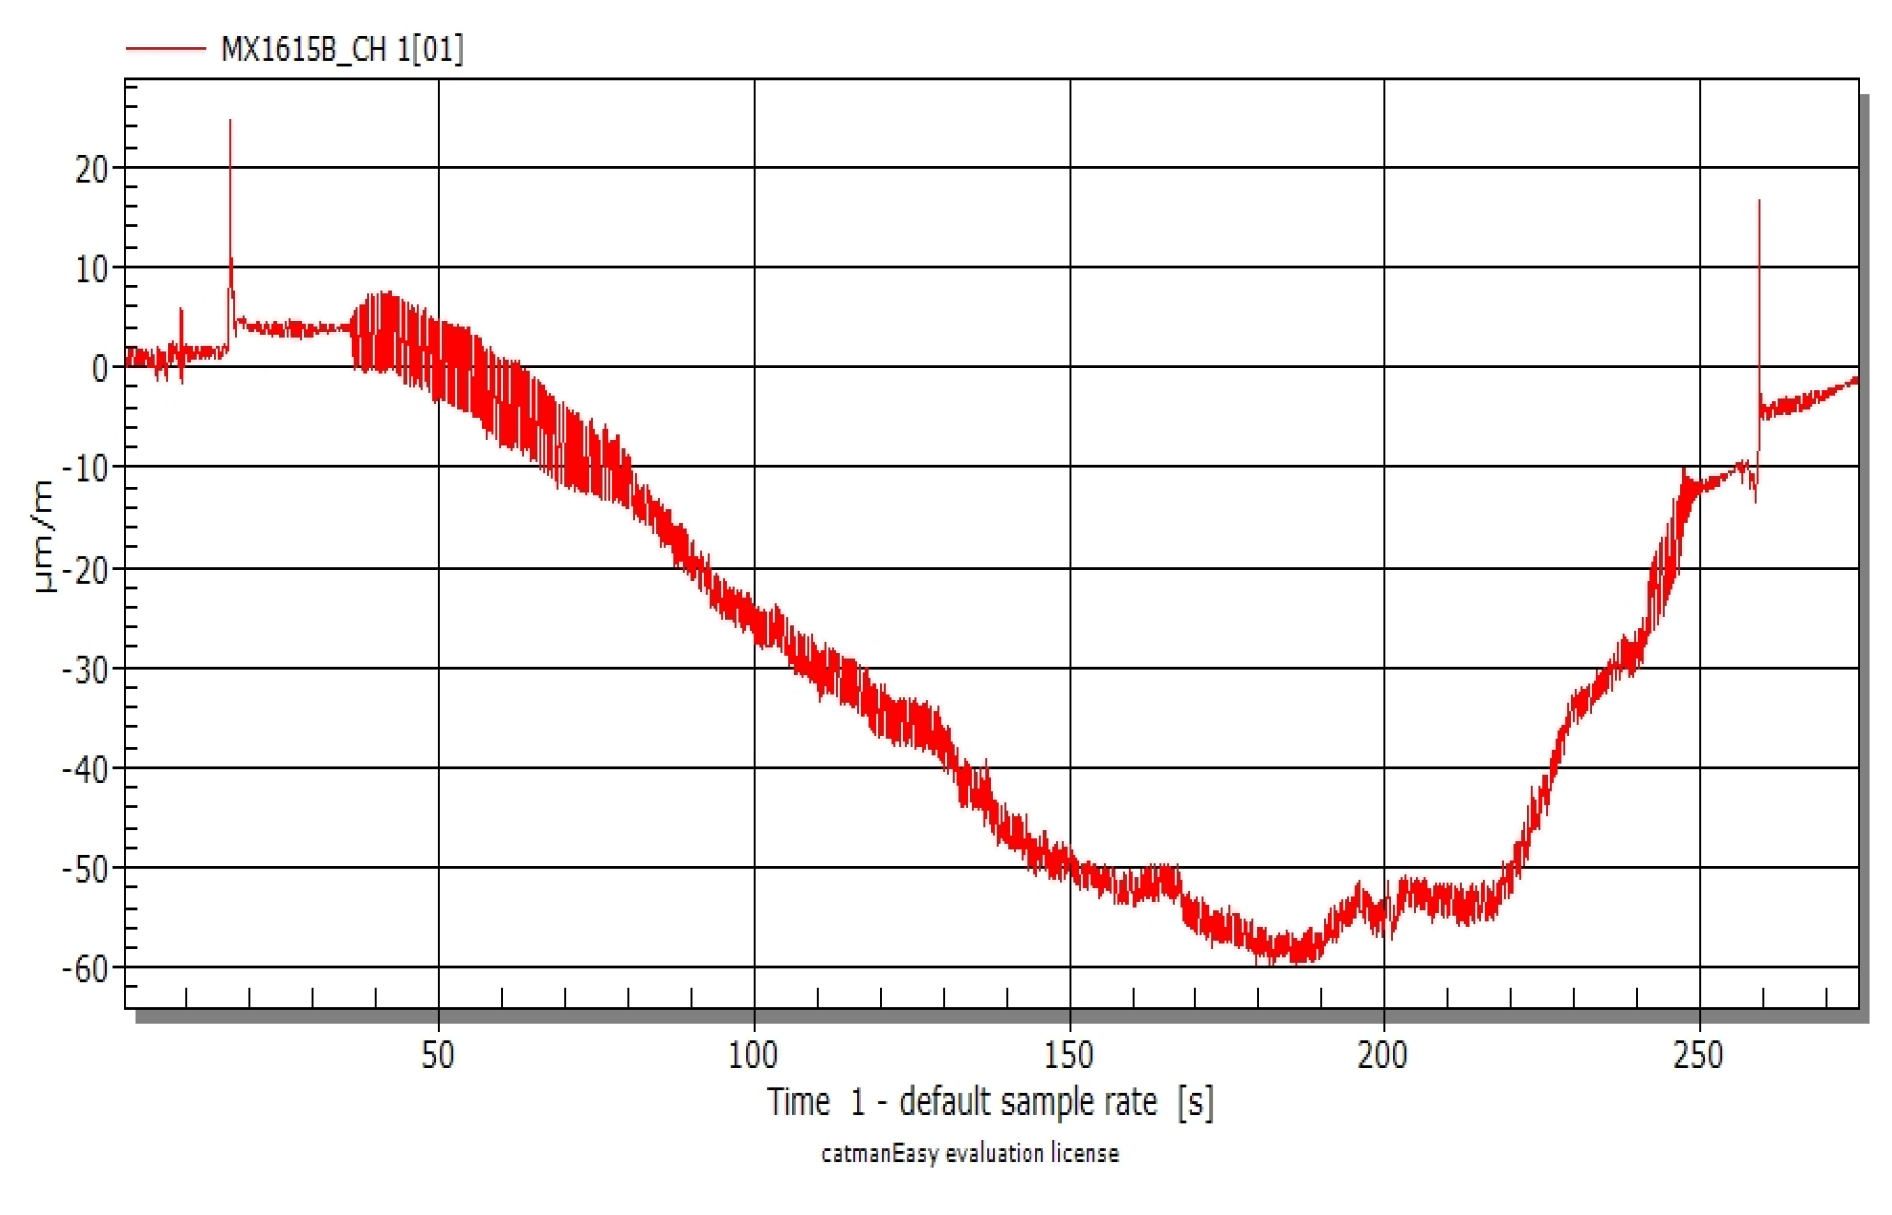
Figure 23.
Measurement of strain using FEA.

Figure 24.
Quadcopter with Moving Reference Frame (MRF).

Figure 25.
UAV with Computational domain.
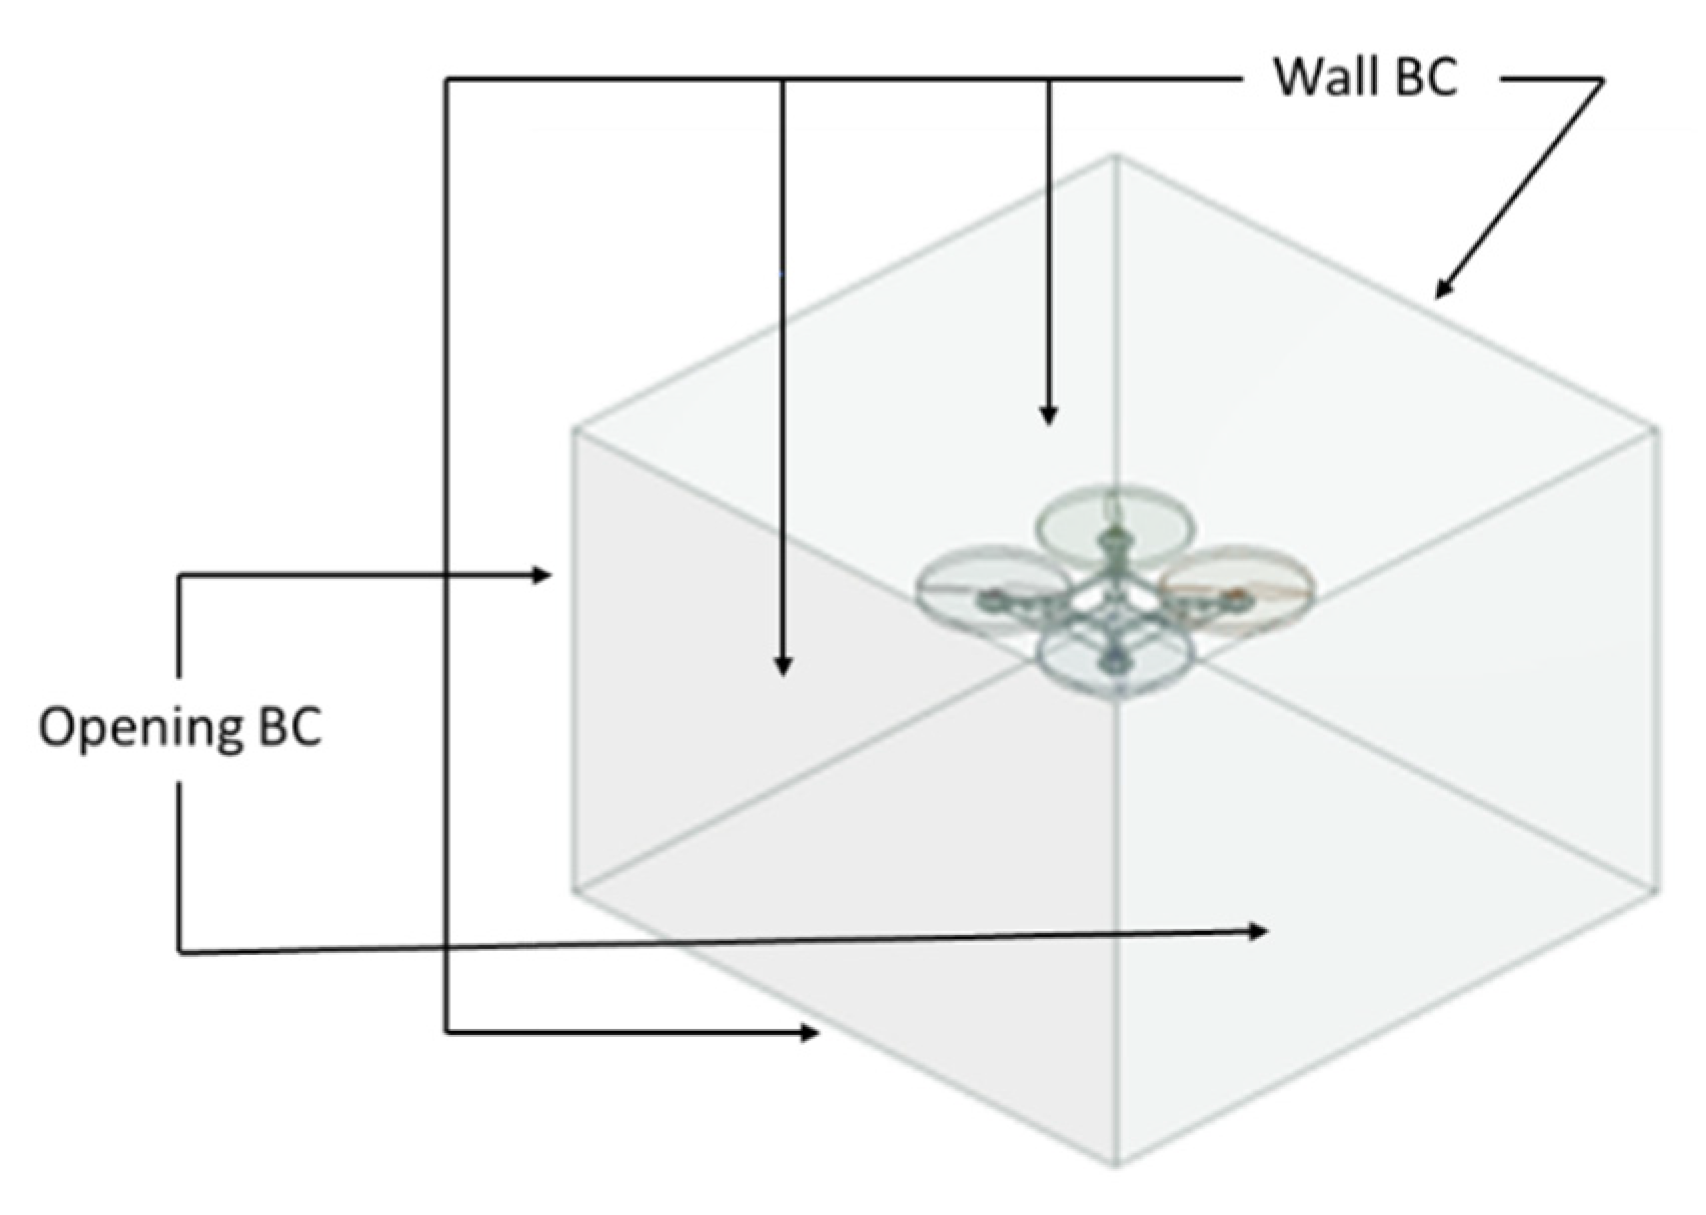
Figure 26.
Hovering flight of UAV. (a) Pressure at 0° AoA, (b) Velocity at 0° AoA.
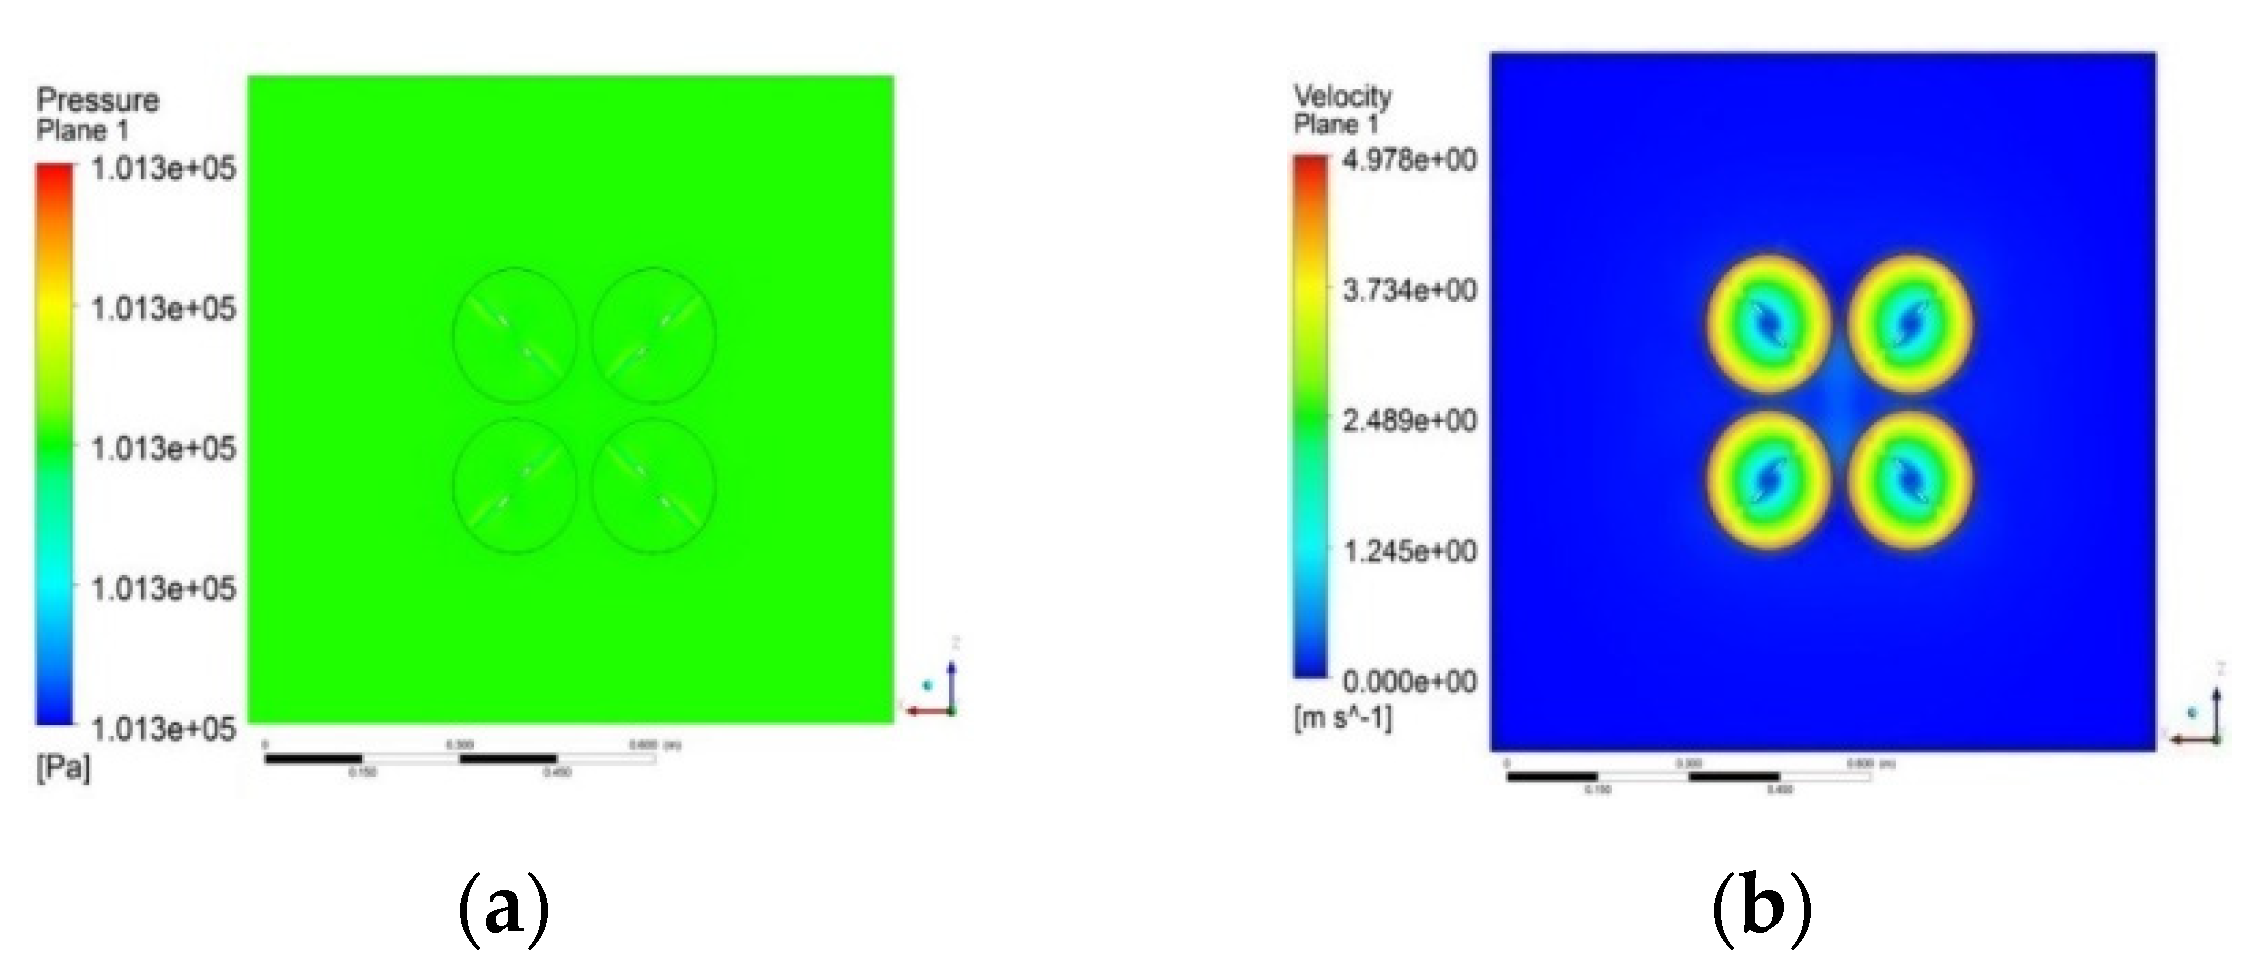
Figure 27.
Forward flight of UAV. (a) Pressure at 0° AoA, (b) Velocity at 0° AoA.

Figure 28.
Wind tunnel.

Figure 29.
Test section with model.
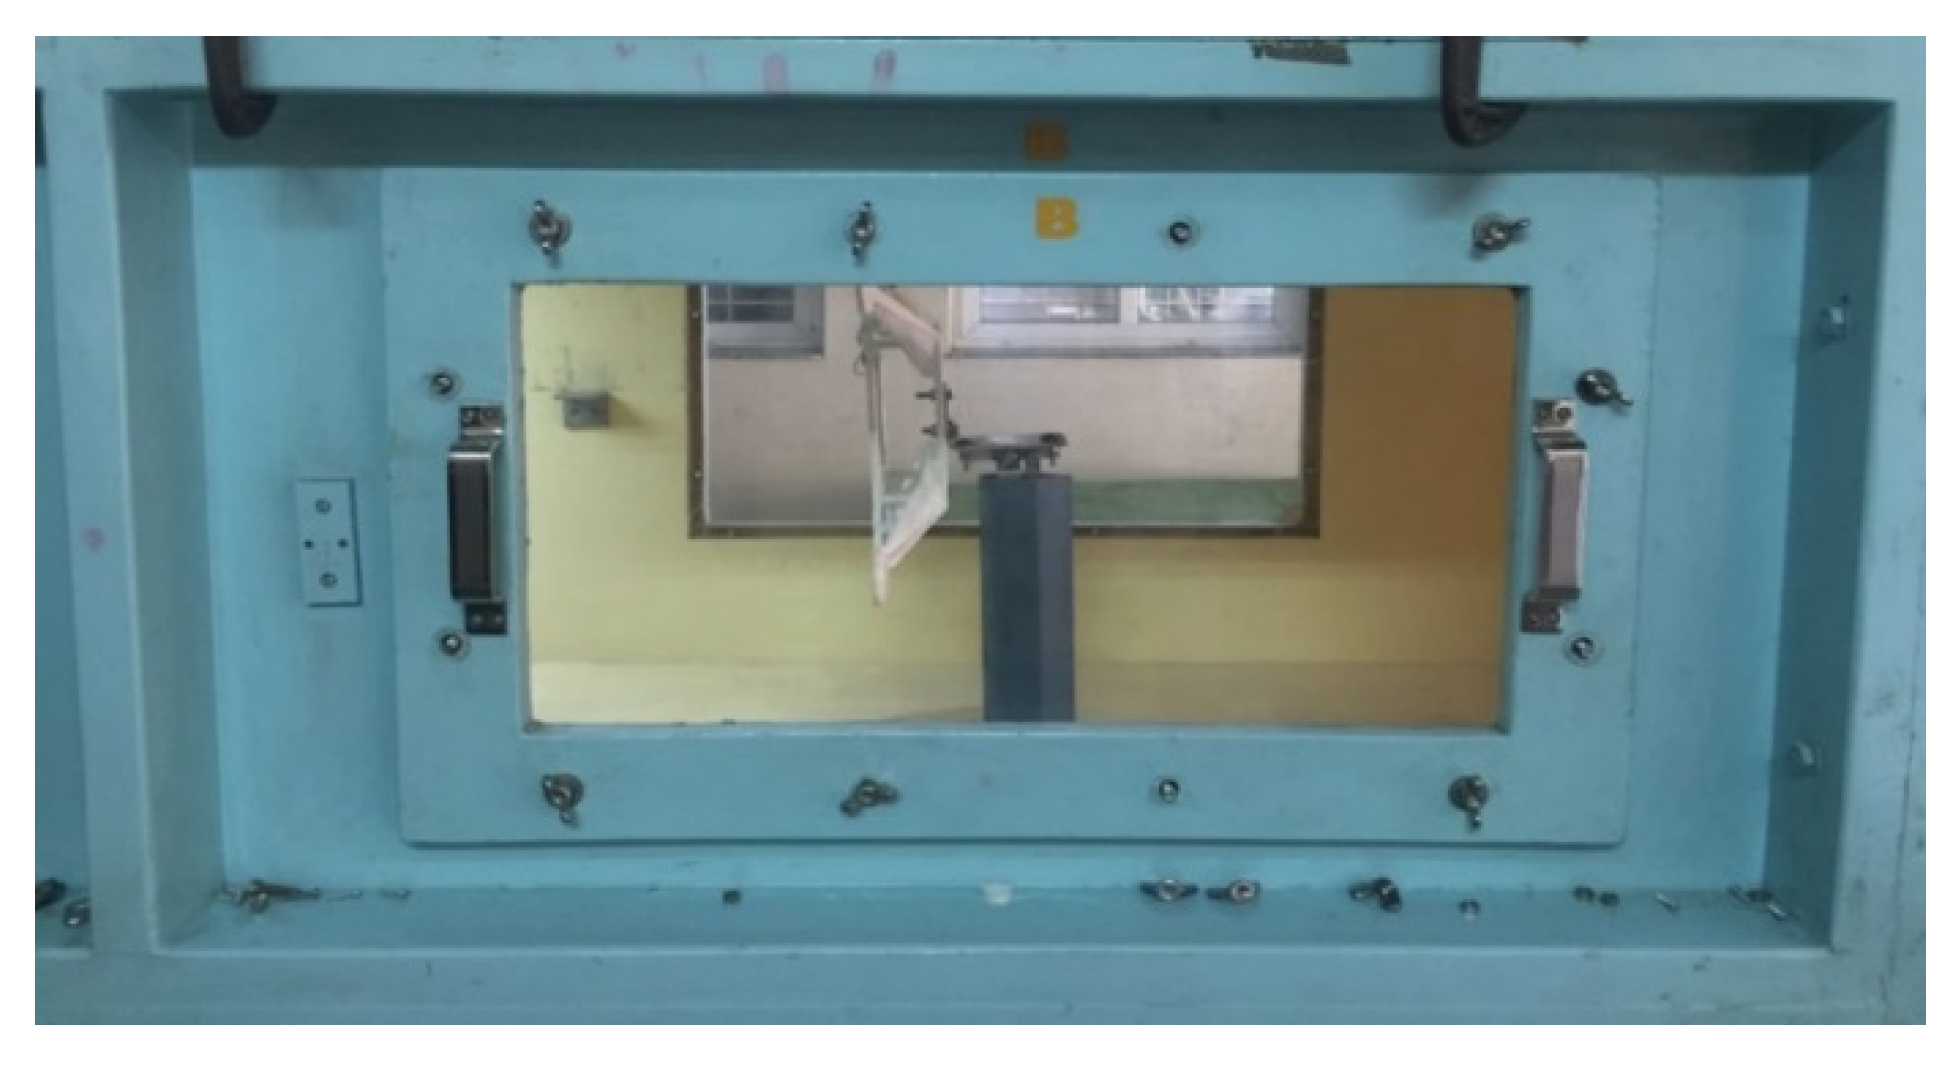
Figure 30.
Quadcopter Assembly.
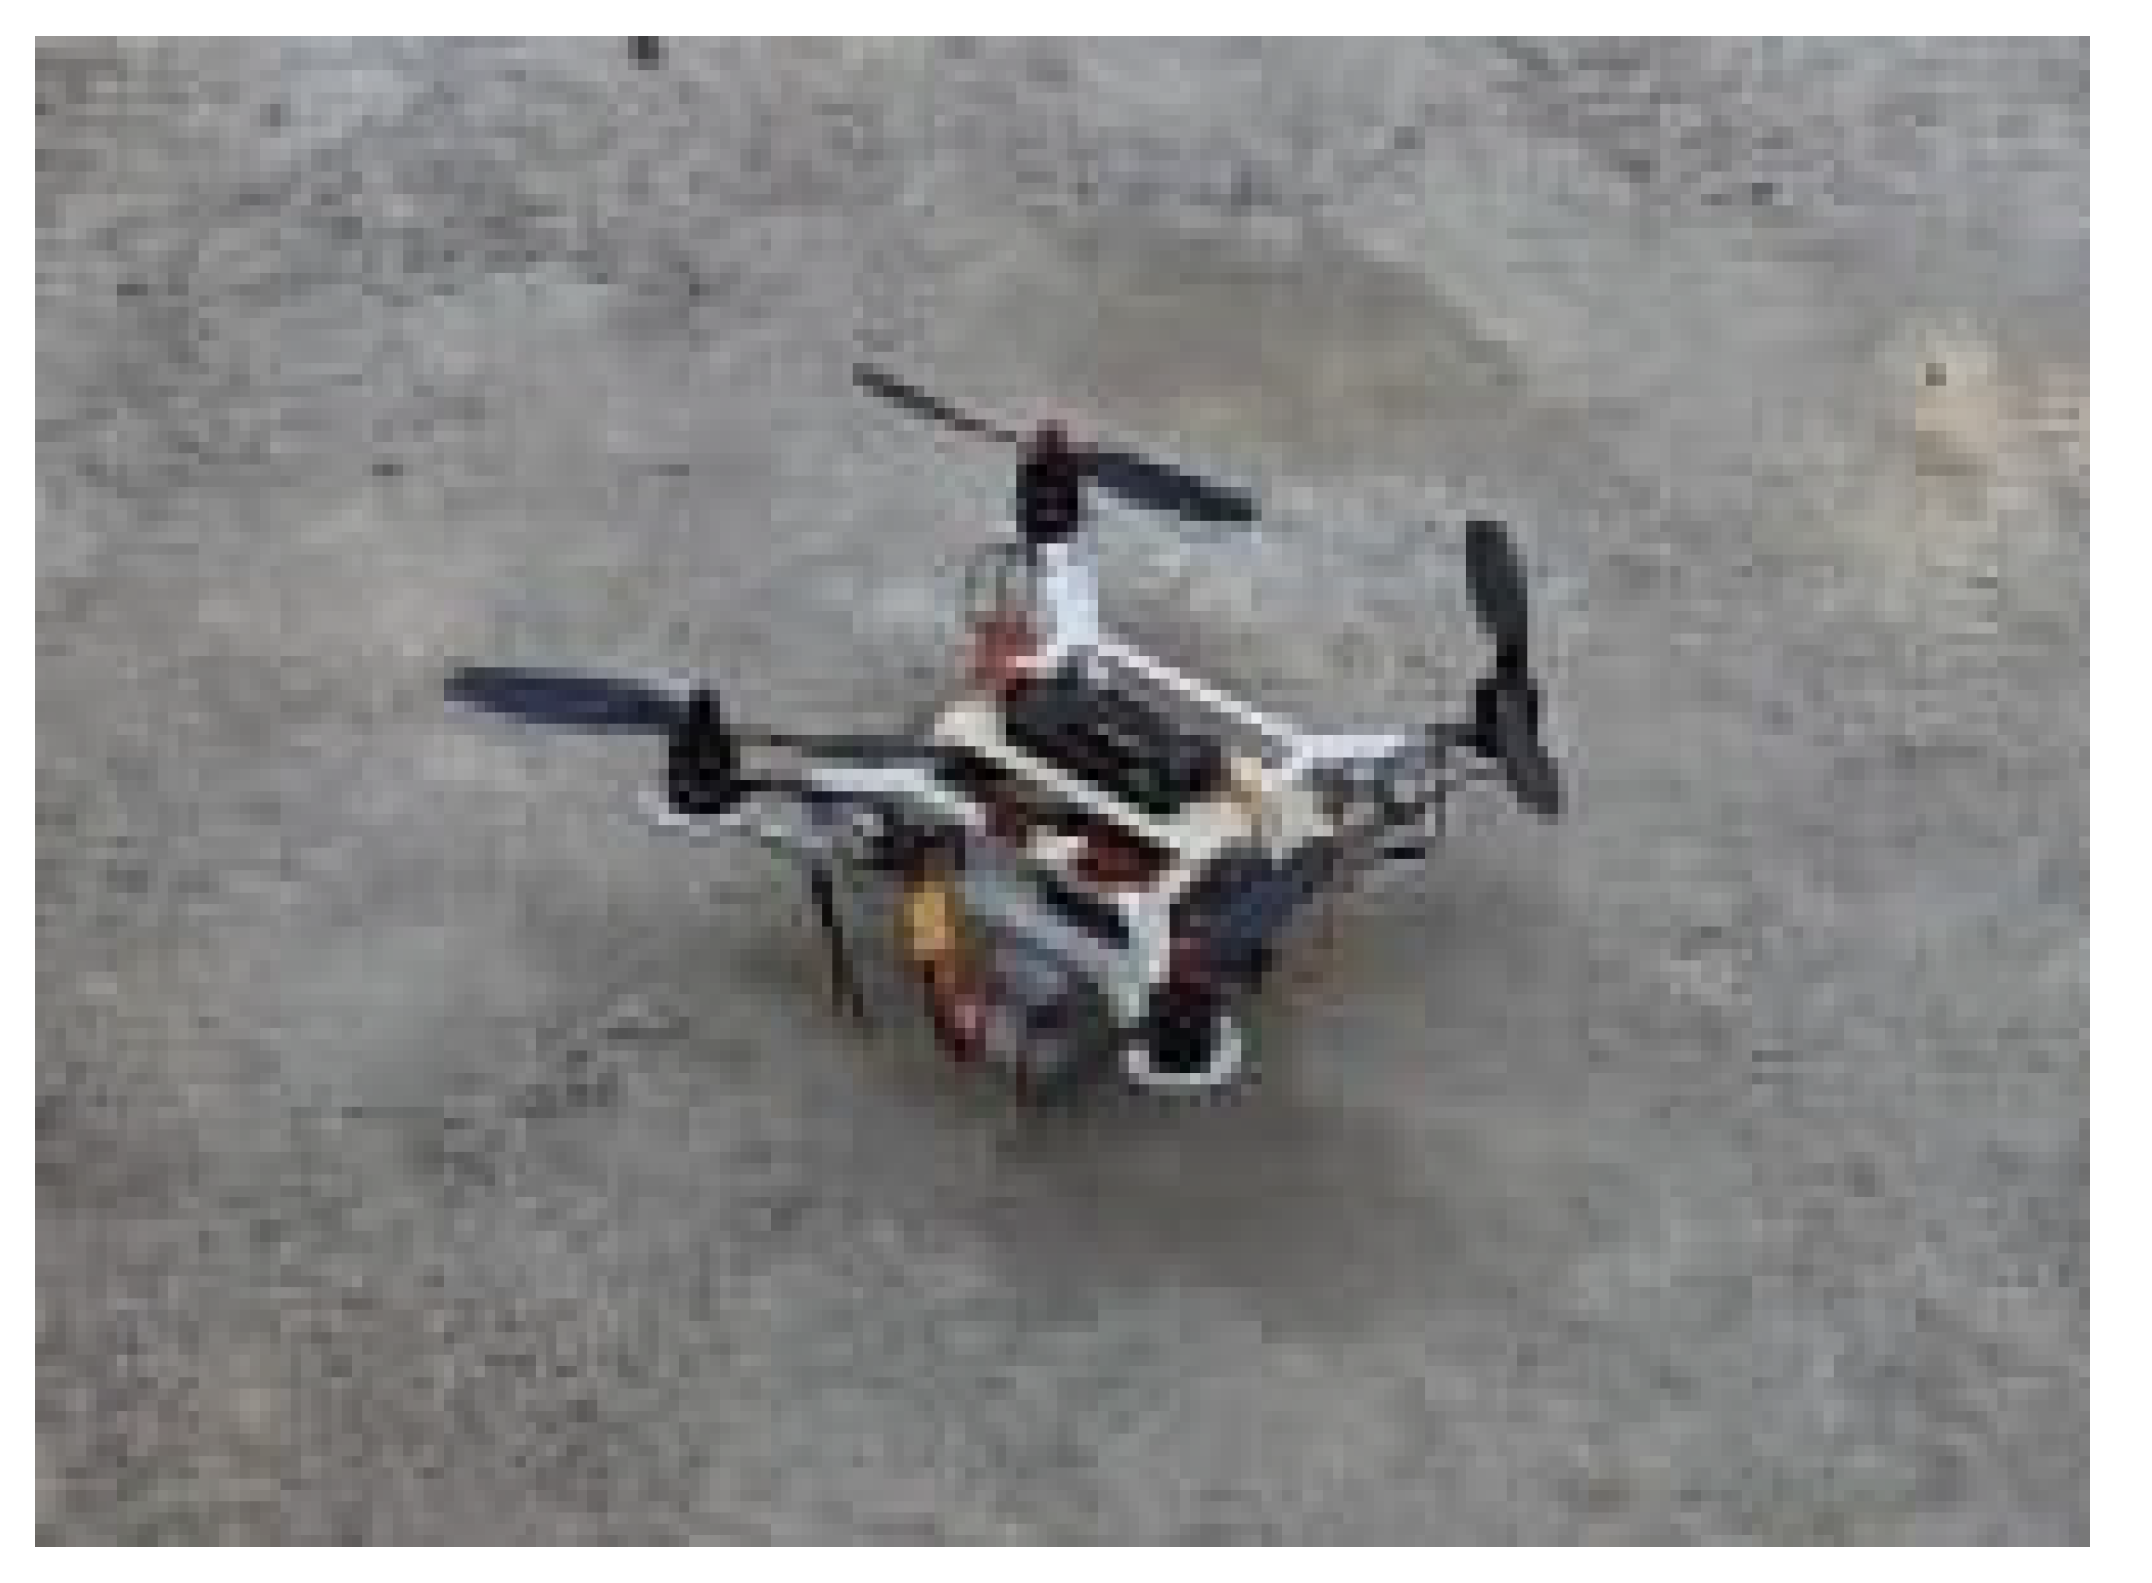
Figure 31.
Field test results. (a) Stability during Yaw, (b) Stability during Pitch, (c) Stability during Roll, (d) Power consumption vs time.
Figure 31.
Field test results. (a) Stability during Yaw, (b) Stability during Pitch, (c) Stability during Roll, (d) Power consumption vs time.


Table 1.
Material properties of ABS.
| Properties | Values |
|---|---|
| Density | 1080 kg/m3 |
| Poisson’s ratio | 0.422 |
| Young’s modulus | 2.9 GPa |
| Tensile strength | 50 MPa |
| Compressive strength | 69 MPa |
| Yield strength | 44.1 MPa |
Table 2.
Equivalent stress and maximum deformation for monocoque model.
| Equivalent Stress (MPa) | Maximum Deformation (mm) | Mass Yielded (kg) |
|---|---|---|
| 0.1 | 0.004 | 9.035 |
Table 3.
Equivalent stress and maximum deformation for topology optimized monocoque Quadcopter frame.
Table 3.
Equivalent stress and maximum deformation for topology optimized monocoque Quadcopter frame.
| Equivalent Stress (MPa) | Maximum Deformation (mm) | Mass Yielded (kg) |
|---|---|---|
| 0.82 | 0.11 | 0.330 |
Table 4.
Equivalent stress and maximum deformation for modified indigenous model.
| Equivalent Stress (MPa) | Maximum Deformation (mm) | Mass Yielded (kg) |
|---|---|---|
| 3.02 | 0.14 | 0.337 |
Table 5.
Comparison of initial and final topology optimized model.
| Initial Model | Modified Model | |
|---|---|---|
| Weight (grams) | 9035 | 337 |
| Maximum deformation (mm) | 0.003 | 0.14 |
| Von-Mises stress (MPa) | 0.09 | 3.02 |
Table 6.
Material properties of filament.
| Property | Value |
|---|---|
| Density (kg/m3) | 1040 |
| Tensile Strength (MPa) | 43 |
| Elongation at Break (%) | 22 |
| Flexural Strength (MPa) | 66 |
| Flexural Modulus (MPa) | 2348 |
| IZOD Impact Strength (kJ/m2) | 19 |
Table 7.
Printing parameters.
| Parameters | Values |
|---|---|
| Layer thickness | 0.2 mm |
| Infill | Rectilinear |
| Infill density | 100% |
| Max overhang angle for supports | 46° |
| Support infill percentage | 20% |
| Printing speed | 45 mm/s |
Table 8.
Specifications of vibration shaker.
| Properties | Values |
|---|---|
| Sine Force Rating | 29.42 kN |
| Random Force Rating | 29.42 kN |
| Shock Rating | 588.40 kN |
| Max. Acceleration (bare table) | 784 m/s2 |
| Displacement | 0.051 m |
| Velocity | 1.8 m/s |
Table 9.
Acceleration levels.
| Frequency (Hz) | Acceleration (g) |
|---|---|
| 5 | 0.05 |
| 10 | 0.20 |
| 15 | 0.45 |
| 20 | 0.80 |
| 25 | 1.25 |
| 30 | 1.8 |
| 35 | 2.46 |
| 40 | 3.22 |
| 45 | 4.07 |
| 50 | 5.03 |
| 55 | 6.08 |
| 60 | 7.24 |
| 65 | 8.50 |
| 70 | 9.86 |
| 75 | 11.32 |
| 80 | 12.88 |
| 85 | 14.54 |
| 90 | 16.30 |
| 95 | 18.16 |
| 100 | 20.12 |
Table 10.
Specification of strain gauge and data acquisition system.
| Model | MX1615B_CH 1 |
|---|---|
| Sensor | Copy of SG 4 wire 350 Ohm |
| Transducer type | SQ quarter bridge 350 Ohm, 4-wire circuit |
| Nominal range | 0–8000 µm/m |
| Filter characteristics | Excitation: 5 V |
| Filter frequency | 10 Hz |
Table 11.
Strain induced during hovering at different throttle conditions.
| Throttle % | Compressive Strain (µm/m) |
|---|---|
| 0 | 0 |
| 16.67 | −17.64 |
| 33.33 | −30.49 |
| 50 | −60.61 |
Table 12.
Strain induced during hovering, yaw, pitch and roll.
| Throttle Position | Compressive Strain (µm/m) |
|---|---|
| Hovering | −17.37 |
| Yaw Left | −23.91 |
| Yaw Right | −17.76 |
| Pitch Up | −37.798 |
| Pitch Down | −17.789 |
| Roll Left | −35.344 |
| Roll Right | −12.611 |
Table 13.
Lift and drag force for different AoA during hovering phase.
| AoA. (Degrees) | Max. Pressure (Pa) | Propeller Tip Velocity (m/s) | Lift Force (N) | Drag Force (N) |
|---|---|---|---|---|
| 0 | 101,333 | 4.97 | 152.19 | 0 |
| 4 | 101,335 | 5.14 | 151.78 | 10.61 |
| 8 | 101,336 | 5.43 | 150.67 | 21.17 |
| 12 | 101,338 | 5.67 | 148.83 | 31.63 |
Table 14.
Lift and drag force for different AoA during forward phase.
| AoA (Degrees) | Max. Pressure (Pa) | Propeller Tip Velocity (m/s) | Lift Force (N) | Drag Force (N) |
|---|---|---|---|---|
| 0 | 101,363 | 10.51 | 152.13 | 0.14 |
| 4 | 101,371 | 10.98 | 151.70 | 10.46 |
| 8 | 101,369 | 10.92 | 150.54 | 21.01 |
| 12 | 101,370 | 10.69 | 148.64 | 31.44 |
Table 15.
Wind tunnel specifications.
| Properties | Values | |
|---|---|---|
| Nozzle and test section | Contraction ratio | 9:1 |
| Contraction length | 1.8 m | |
| Stainless screens | 8 × 16 grid | |
| Test section | 0.6 m × 0.6 m × 2 m | |
| Diffusor section (Axial flow fan) | Diameter | 1.3 m |
| Speed | 1450 rpm | |
| No of Blades | 12 | |
| Fan duct diameter | 1.4 m | |
| Inlet section | Settling chamber | 1.8 m × 1.8 m |
| Honeycomb size | 0.025 m × 0.025 m × 0.2 m |
Table 16.
Drag for various speeds.
| Speed in rpm | Drag in N |
|---|---|
| 150 | 0.48 |
| 250 | 1.35 |
| 350 | 2.58 |
| 450 | 4.16 |
| 550 | 6.35 |
| 600 | 7.56 |
Table 17.
Comparison between simulated and experimental drag.
| Speed of Propeller (rpm) | Drag (N) | |
|---|---|---|
| Simulated | Experimental | |
| 450 | 4.29 | 4.16 |
Publisher’s Note: MDPI stays neutral with regard to jurisdictional claims in published maps and institutional affiliations. |
© 2022 by the authors. Licensee MDPI, Basel, Switzerland. This article is an open access article distributed under the terms and conditions of the Creative Commons Attribution (CC BY) license (https://creativecommons.org/licenses/by/4.0/).
Share and Cite
MDPI and ACS Style
Nvss, S.; Esakki, B.; Yang, L.-J.; Udayagiri, C.; Vepa, K.S. Design and Development of Unibody Quadcopter Structure Using Optimization and Additive Manufacturing Techniques. Designs 2022, 6, 8. https://doi.org/10.3390/designs6010008
AMA Style
Nvss S, Esakki B, Yang L-J, Udayagiri C, Vepa KS. Design and Development of Unibody Quadcopter Structure Using Optimization and Additive Manufacturing Techniques. Designs. 2022; 6(1):8. https://doi.org/10.3390/designs6010008
Chicago/Turabian StyleNvss, Sagar, Balasubramanian Esakki, Lung-Jieh Yang, Chandrasekhar Udayagiri, and Kameswara Sridhar Vepa. 2022. "Design and Development of Unibody Quadcopter Structure Using Optimization and Additive Manufacturing Techniques" Designs 6, no. 1: 8. https://doi.org/10.3390/designs6010008