
Interior Environment Design Method for Positive Mental Health in Lockdown Times: Color, Textures, Objects, Furniture and Equipment


1
Tecnologico de Monterrey, Escuela de Arquitectura, Arte y Diseño, Campus Querétaro, Santiago de Querétaro 76130, Mexico
2
Facultad de Arquitectura, Universidad Anáhuac México, Huixquilucan 52786, Mexico
*
Author to whom correspondence should be addressed.
Designs 2022, 6(2), 35; https://doi.org/10.3390/designs6020035
Submission received: 30 October 2021
/
Revised: 17 January 2022
/
Accepted: 4 February 2022
/
Published: 1 April 2022
(This article belongs to the Special Issue Environmental Futures: Creative Explorations through Science, Engineering, Design, and Art)
Abstract
:In March 2020, the World Health Organization declared the outbreak of a COVID-19 pandemic accompanied by a series of mass lockdowns. Some of the consequences of these lockdowns were (1) psychological problems, (2) development of simultaneous activities in spaces not prepared for it, and (3) indoor spaces that generate negative emotions in people. To improve people’s mental health during times of lockdown, this research proposes a methodology to design positive interior environments through color, texture, objects, furniture, and equipment. For this, 147 qualitative surveys were carried out, the structure of which is based on research methods and tools inherited from marketing discipline (Likert Scale and Customer Satisfaction Score). Several operative graphs were created to make decisions on the design of interior environments. To avoid some of the problems caused by indoor environments during lockdowns it is recommended that users return to paying attention to the design of the interior spaces of their homes. Note that there is no standard solution to this problem, but a method to design interior environments based on people’s positive mental health such as the one presented here can help. The trends found in this work open a field of exploration towards the improvement of interior spaces through neutral colors, natural materials (cotton and wood) and objects with which emotional relationships are created, either with the objects (collections) or because they allow you to connect with other people (technology). It is considered necessary to continue with the research by expanding the sample to incorporate into the analysis the most vulnerable sectors of population during COVID-19 lockdowns.
Keywords:
COVID-19; confinement; way of living; environment design; housing; built environment; color; texture; furniture; object1. The Problem
The first case of coronavirus COVID-19 was reported in Wuhan (China) in December 2019. The new disease began to increase dramatically in Asia and Europe accompanied by a series of mass lockdowns. On 11 March 2020, the World Health Organization (WHO), declared the outbreak a pandemic. Since the first confirmed case, the world has seen more than 50 million COVID-19 infections and more than 1.3 million people have died (15 November 2020) [1].
As a result of lockdowns, three problems are occurring: (1) psychological problems such as stress, depression, feelings of loneliness, etc. (2) spaces inside the houses are not prepared to develop all the activities of life inside them and (3) spaces cause negative emotions because they are not designed for people to be happy inside them.
1.1. Psychological Problems Due to Lockdown
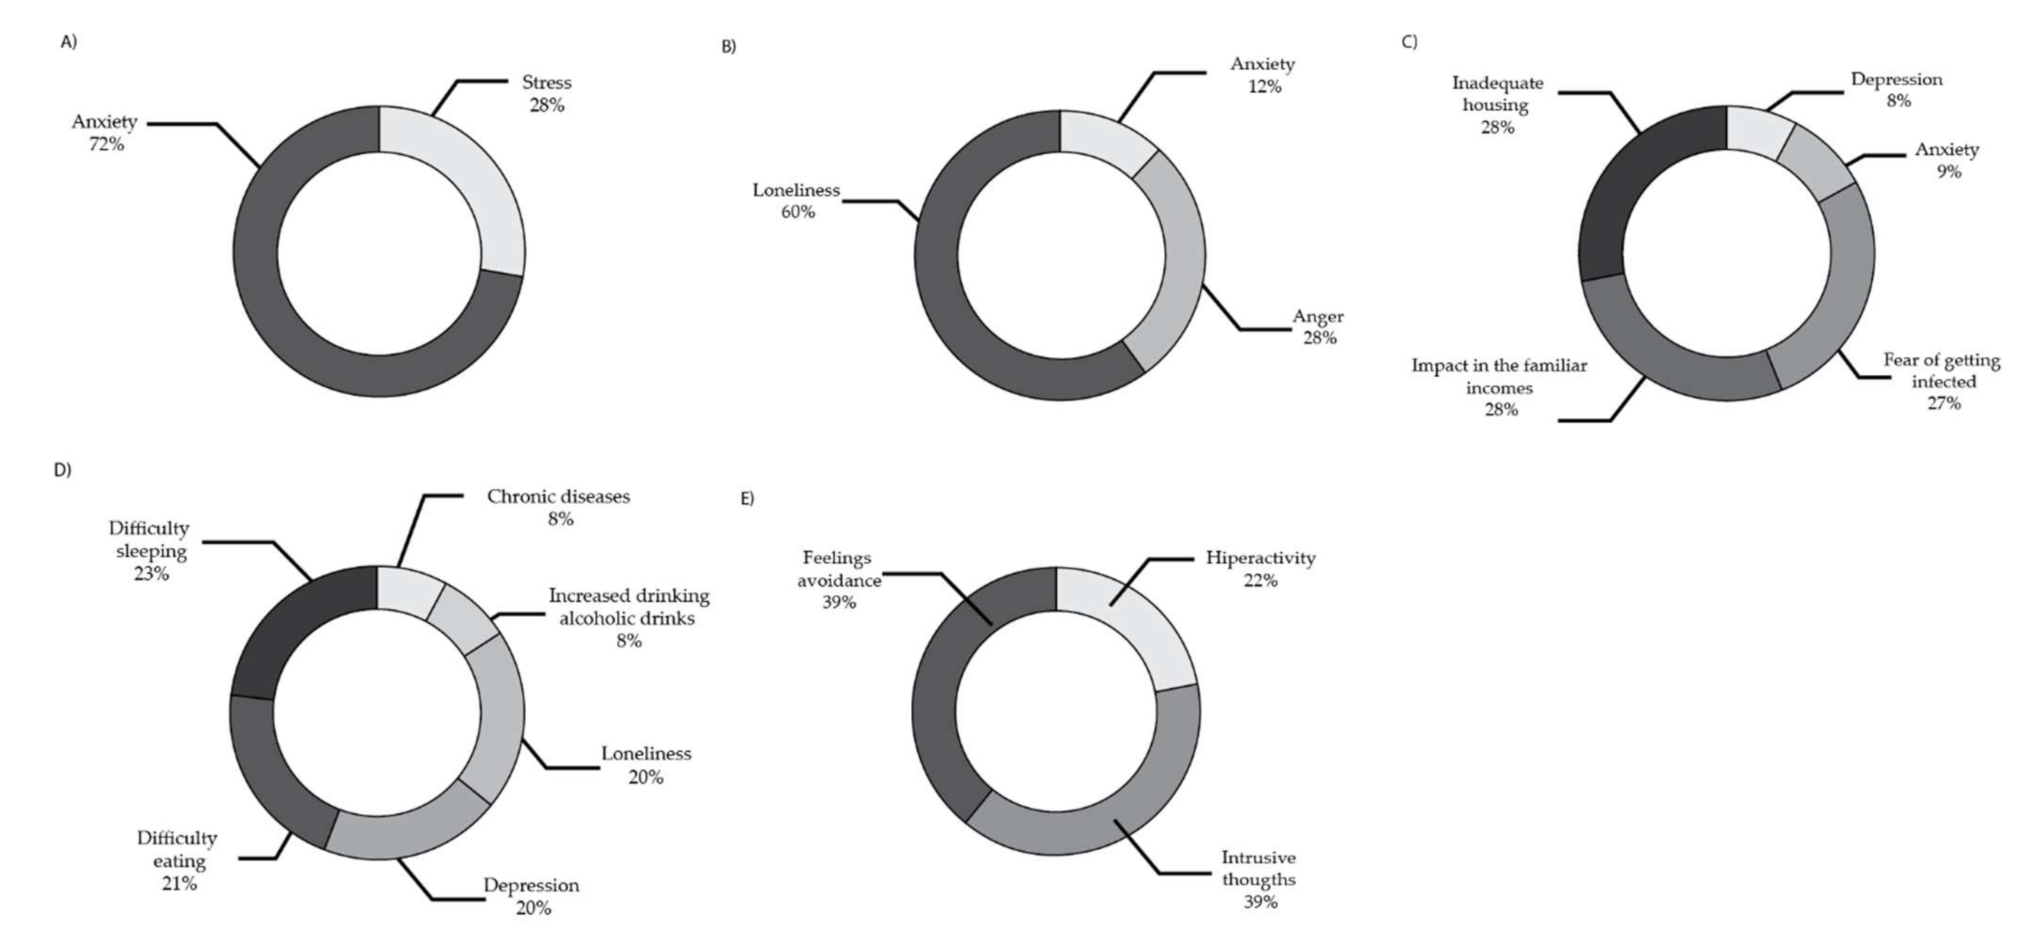
China, United Kingdom, Spain, USA, and Mexico are the countries with most information on the psychological impact of COVID-19 on population (Figure 1).
An analysis of Figure 1 shows that mental problems caused by lockdown are a reality throughout the world. Most common problems are loneliness, depression, and anxiety, associated with difficulty sleeping and eating. People have also suffered from intrusive thoughts and feelings of avoidance, and some have even presented hyperactivity.
1.2. Simultaneous Uses of Unprepared Interior Spaces
Housing that lacks adequate comfort can lead to deterioration of both physical and psychological health. It is claimed that people who have adequate space for work, study, exercise, and personal privacy in their homes have lower stress levels compared to those who lack comfortable accommodation [7].
To decrease COVID-19 infections, the population was forced to stay at home, turning sofas and kitchens into workspaces, living rooms or bedrooms became the perfect backdrop for video calls, and more intimate spaces were opened for public activities [8]. This simultaneity of uses in the same space produced problems of coexistence and many difficulties in reconciling productive and reproductive activities.
1.3. Indoor Spaces That Create Negative Emotions
Spaces were not only not prepared for different simultaneous activities, but they were also not designed to generate positive emotions or feelings in people. It should be noted that this problem is not inherent in the COVID-19 pandemic and that environmental psychology has been studying this issue rigorously for more than sixty years with different purposes.
As Carrasco Mahr points out [9], in normal situations, more than 90% of the time we are awake each day is spent inside buildings. Unfortunately, many of these buildings are not designed to make us feel good. Therefore, there were many problems during lockdowns, since 100% of the time was spent inside dwellings.
According to this situation, it is possible to solve side effects caused by lockdown such as depression, anxiety, or stress, among others, with a method to design indoor environments based on people’s positive mental health.
2. State of the Art
Environmental Psychology is an interdisciplinary field that focuses on the relations between individuals and their surroundings for many purposes. In 1924, Willy Hellpach defined it for the first time in his texts in which, among other aspects, he studied effects of color and form on human activity. In the 1960s Psychology of Architecture was born, focusing its studies on residential satisfaction and quality of life. Since then, numerous scientists have studied the subject exhaustively from numerous approaches: Lewin studies how environment affects people in profound ways [10]; Whittaker analyzes the influence of environment on different human groups and how it affects their behavior [11]; Fleury-Bahi, Pol and Navarro investigate about Environmental Psychology and Quality of Life [12]; etc.
This research is specifically based on Cotton’s idea of “psychosocial stressor” [13] and Lotito’s “sardine can effect” [14]. These concepts indicate that individuals subjected to confinement may suffer from a traumatic, damaging, and stressful experience that generates high levels of aggressiveness. Therefore, the current article focuses on reviewing environmental studies on interior spaces relevant to the COVID-19 pandemic lockdowns.
A search of the Scopus electronic database was undertaken using the search terms “lockdown”, “COVID-19”, “environmental health”, “environmental psychology”, “architecture psychology” and “architecture” in various permutations and combinations. Later the search terms “anxiety”, “depression”, “stress”, “loneliness”, “flexibility”, “daily routine”, “home office”, “color”, “textures”, “furniture” and “objects” were added to complete the search. Of the texts retrieved using this method we excluded those that were available only in Chinese language, those that dealt with other aspects of COVID-19 outbreak and articles that revealed no material relevant to interior environments. A total of 32 citations were retrieved using this method as you can see in Table 1.
Most of the texts selected provide data on COVID-19 and how it psychologically affects the population of different countries [4]. Other texts deal specifically with issues such as Loneliness [5] or Distress and Stress [6] during COVID-19 lockdowns.
There are analyses on daily activities performed during lockdown such as parental activities and home-schooling [35]. There are also other analyses about lockdown impact in built environments with emphasis on gender approach [36].
Numerous studies exist about the effect of residential built environments on mental health during lockdown: some in typological terms [29]; others around technical aspects such as hygrothermal control [30] and lighting [19,20]; others that focus on the importance of linking people with outdoor spaces [28], especially around the interaction with natural environments as a tool that reduces stress and bring benefits to people’s individual well-being [17,23].
For this research it is not considered a niche of opportunity to talk about the mentioned topics. Even though they are very important elements in the relationship of Mental Health, Psychology of Architecture and indoor environments, there are countless texts that review these aspects. A bibliographic gap has been found around the impact of colors, textures, objects, furniture and equipment on the mental health of people during lockdown. Therefore, it has been decided to address these issues in this work, seeking to achieve a new contribution.
When looking for reliable studies on preferences of colors, textures, objects, furniture, and equipment in indoor environments before COVID-19 lockdowns, no research papers or reports were found. Data on the subject have only been located in publications on decoration and trends. It is therefore considered important to carry out this research to obtain more reliable data.
In the review of the documentation, it has been found that in Mexico the favorite colors during 2016–2017 were makeup colors (pale pink, beige, white, turquoise blue, grey, pastel green, vanilla and yellow). Preferred textures were floral and geometric prints. Favorite objects are golden, silver and glass. Additionally, the most chosen furniture and equipment is made of light wood [37]. In 2018 the favorite colors were blue and yellow for women, black and green for men [38], blue for girls, blue and red for boys [39], and red, blue, black, white, and green in general [38]. Preferred textures were wood, clay and concrete. The most chosen furniture and equipment materials were dark wood, cement, metal and rope and the most chosen colors for these were black and chocolate brown, all to achieve an industrial style [40]. In 2019, some of the trends of 2016 and 2017 were repeated. Favorite colors were white, sand, beige, grey, terracotta, blue, red, saffron, yellow, vibrant pink, turquoise green, and olive green. Preferred textures were Terracotta, cork, wood, and botanical and floral prints [41]. The most outstanding objects were dreamcatchers, vases, and decanters of metallic and golden materials. The most chosen materials for furniture and equipment were natural woods such as oak, and velvet, both in light colors, all to achieve a more natural style [42].
3. Research Methodology
3.1. Method Design
The research method is based on Post-Occupancy Evaluations (POE) in which quality of environment is linked to quality of life. This study is focused on a specific population group and their immediate sociophysical environment. The main tool of work is qualitative surveys whose structure is based on customer satisfaction studies of marketing discipline: Likert Scale (method of summative evaluations or rating scale that captures the intensity of respondents’ feelings for a given item, place or service) [43,44]; and Customer Satisfaction Score (an immediate opinion survey sent via e-mail, SMS or WhatsApp that serves to know the descriptive and detailed perception about a given item, place or service allowing to identify patterns) [45]. Both were combined with closed questions, open text questions, ordering and classification questions and photo collection. These surveys are used to identify preferences of 147 people in terms of color, textures, furniture, equipment, and objects that surround them and how much they affect their mood during COVID-19 lockdowns. Based on these preferences, several operational graphs were created as a sample for making interior design decisions.
The method consists of nine phases: Definition of Parameters, Survey Design, Collection of information, elaboration of “Comfortable and uncomfortable spaces” graphs, elaboration of “Word Clouds”, elaboration of chromatic circle, elaboration of texture circle, elaboration of object circle, and elaboration of furniture and equipment circle. Each phase is described in detail in Section 4.
3.2. Hypothesis and Objectives
This research aims to integrate the topics of COVID-19, mental health, and interior design under the same lens.
The working hypothesis holds that being in a properly designed indoor environment for a long time can produce positive emotions. The objective of the work is to create a method to design interior environments that provide positive mental health to people during times of lockdown through color, texture, objects, furniture and equipment. To achieve this, it will be necessary to know the preferences of a confined population in terms of color, textures, furniture, equipment, and the objects that make them happy. Based on these preferences, a series of operational graphs will be developed with the objective of applying them to design interior spaces. This methodology aspires to be used in any lockdown that occurs in the future to help people to be happy in an indoor environment.
3.3. Sample Selection
This first advance of the research is focused on the analysis of designers and people who are interested in interior design of a medium socioeconomic level, between 25 and 64 years old and living in Mexico City. From the beginning, the sample was limited according to these characteristics because it was considered that this population has the interest and the necessary resources to access an interior design project for their homes. Given the relevance of the subject analyzed within the scope of environmental well-being and mental health, it is considered necessary to continue with the research by expanding the sample. It is important to incorporate into the analysis the most vulnerable sectors of the population during COVID-19 lockdowns, such as the elderly, children, and other populations at risk. This increase in the sample will also make it possible to obtain more data that will increase the statistical weight of the research.
This research was conducted in Mexico City, which has a population of 9.2 million inhabitants. Population to be surveyed is in an age range between 25 and 64 years old, of a medium socioeconomic level, which represents 56.3% of the population of Mexico City (1,179,831 men and 1,298,694 women) [46]. Research is focused on people interested in interior design or designers, which represents according to Labor Observatory [47] 28% of the active population of Mexico (7948 men and 17,527 women). Thus, the size of the population to be studied according to ENOE (National Occupation and Employment Survey) is 25,475 people.
The initial goal for this first poll was to survey 150 people. The sample obtained in the study is 147 people, which according to the above data yields a confidence level of 95% and a margin of error of 8%. It is considered that, although the size of the sample surveyed has a limited statistical representation in terms of the entire population of Mexico City, what is presented in this preliminary study is important because it shows clear general trends where the important thing is quality of data and not so much its representativeness.
An ethics committee did not participate in the development of this research. However, when collecting the questionnaire data, an informed consent was attached to it so that the respondents were aware of the management and use of their data and without whose acceptance the responses could not be completed and sent.
3.4. Limitations of the Study
Three main limitations were recognized at the time of developing this study: (1) the impossibility of conducting surveys in person; (2) the difficulty of obtaining a larger sample so far; (3) the low quality of photographs obtained.
One of the most important limitations for carrying out this research was that due to pandemic restrictions, it was not possible to conduct surveys in person, so they were sent via email and WhatsApp. This modification resulted in a loss of qualitative data that were intended to be obtained in face-to-face interviews. At the same time, because of pandemic restrictions, only 147 surveys could be conducted, so what is presented in this preliminary study are general trends.
On the other hand, at the time of taking the photographs of the colors requested in survey, not all people followed the instruction to use a white sheet to correctly determine the color, so that they may not have the expected accuracy. As for the photographs of objects, many times several elements appeared in the same image, so it was difficult to identify which object was being talked about specifically. Finally, due to the way in which some photographs were taken and their lack of sharpness, it is not possible to clearly identify the texture shown.
These problems are currently being reviewed in the methodology so that when increasing the sample there are no difficulties either in the interpretation of photographic material or in the loss of information through surveys. The possibility of simultaneously using a survey and a structured interview through video call platforms is being considered where the interviewee can show all elements in detail while being recorded.
4. Materials and Methods
The method consists of nine phases: (1) Definition of Parameters, (2) Survey Design, (3) Collection of information, (4) Elaboration of “Comfortable and uncomfortable spaces” graphs, (5) Elaboration of “Word Clouds”, (6) Elaboration of Chromatic Circle, (7) Elaboration of Texture Circle, (8) Elaboration of Object Circle, and (9) Elaboration of Furniture and Equipment Circle. This method is designed for any sample. This article shows the results of 147 participants characterized according to Section 3.3.
4.1. Phase 1
- Objective: Definition of parameters to be studied.
- Description: Bibliographic compilation through bibliographic search engines Google Scholar, Scimago and Scopus. Identification of parameters of interior space that allow the development of positive mental health: color, textures, furniture, equipment, and objects.
- Research tools used: bibliographic cards, bibliographic management table and spreadsheets.
- Results: List of analysis parameters, theoretical framework, global statistical data on the impact of the COVID-19 pandemic on mental health, and Figure 1.
4.2. Phase 2
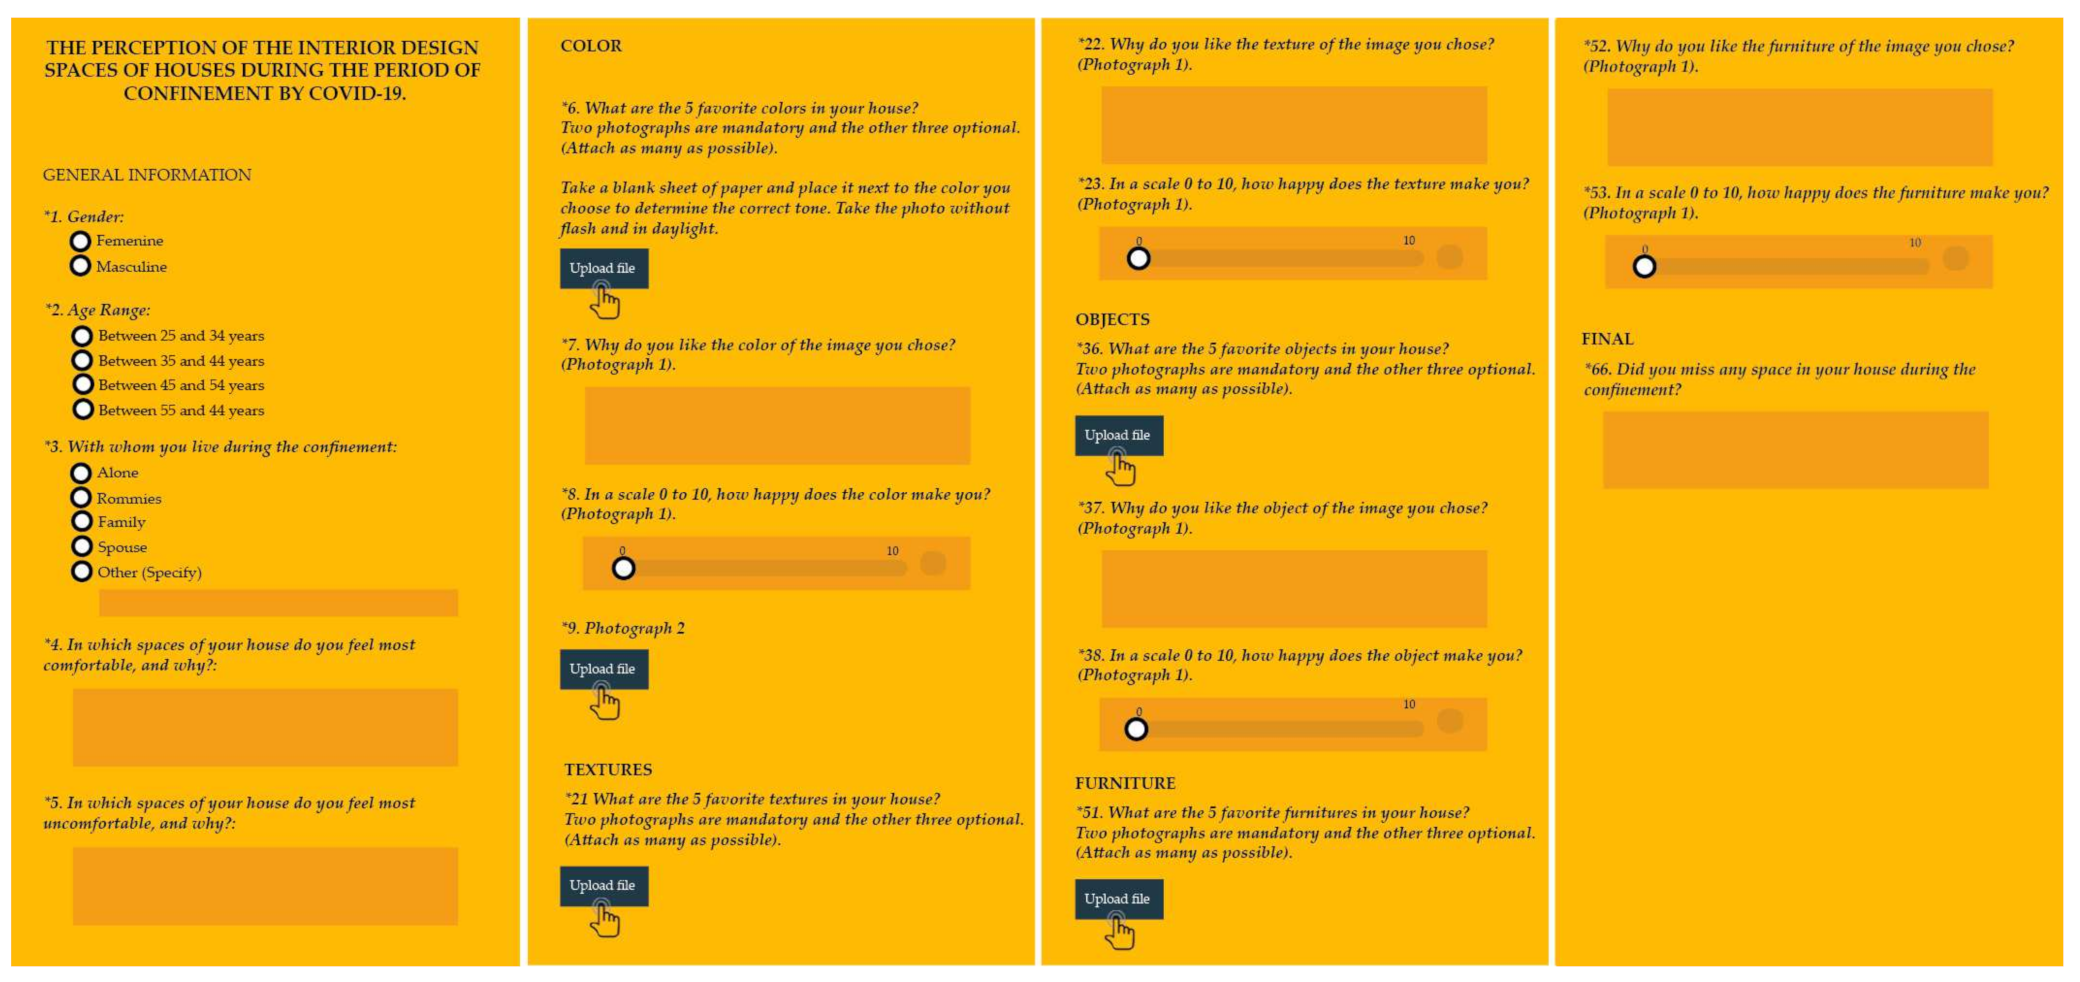
- Objective: Survey Design “Perception of interior design spaces of houses during the period of lockdown by COVID-19”.
- Description: For the construction of this survey, research methods and tools inherited from the marketing discipline were used such as: Likert Scale (scale from zero to ten where ten is the highest rating and zero the lowest); and Customer Satisfaction Score. Both were combined with closed questions, open text questions, ordering and classification questions and photo collection resulting in the survey described below (Figure 2).
In the first part of the survey, users must answer three general information questions: (1) Gender (female or male); (2) Age range (25–34 years; 35–44 years; 45–54 years; or 55–64 years); (3) Who do they live with during lockdown? (Alone, roommates, family, spouse, or other). The second part of the survey indicates spaces where the respondent feels most comfortable or uncomfortable and the reasons for those feelings. The third section of the survey corresponds to the concept of color. In this section, respondents must upload two to five photographs of his or her favorite colors (which should be found in the space where he or she lived in during lockdown). Subsequently, they had to explain why they chose these colors and, on a scale from zero to ten, define how much they liked them. The survey could be answered via WhatsApp or by taking the pictures, saving them on a computer, and answering the survey from there later. This process is repeated three more times as people could share up to five colors (Figure 2).
Next, three sections of the survey refer to concepts of textures, furniture and objects and are divided into the same questions as the color section. First, they must upload a photograph of textures, furnishings, and objects they like the most, followed by an explanation of why they like them and finally a rating of how happy it makes them on a scale from zero to ten. In the last question, respondents must answer if during lockdown they missed some space.
- Research tools used: Likert Scale Survey from LeadQuizzes and on-line surveys from Survey Monkey.
- Sample results: 147 surveys on Perception of interior space of dwellings during the period of lockdown by COVID-19 (Figure 2).
4.3. Phase 3
- Objective: Information gathering.
- Description: Survey software provides its results in a spreadsheet. Table 2 shows a part of the table corresponding to the initial questions and those related to color and texture from one feminine respondent between 45–54 years old. Numbers in cells correspond to Likert Scale where ten is the highest rating and zero is the lowest. Images were saved in a separate folder, referencing them with respondent’s number.
Table 3 shows the responses of the previous respondent corresponding to objects furniture and equipment sections, along with the questions of why she likes the images she sent, how happy they make her, and spaces she missed during lockdown.
4.4. Phase 4
- Objective: Design of “Comfortable and uncomfortable spaces” graphics.
- Description: Based on collected information, the next graphics show responses to the first section of the survey: comfortable and uncomfortable spaces in the dwellings during lockdown. In first column of Table 4 we can see all spaces that are considered comfortable according to respondents. In the next column, the number of people who considered the same space, followed by the percentage that represents that number of people. The following columns show the characteristics with which they describe that space. The number that appears in each cell corresponds to the number of people who chose that characteristic.
Uncomfortable Spaces Table (Table 5) is very similar to Table 4. First column shows all spaces that respondents consider uncomfortable in their homes, followed by the number of people who referred to them and their corresponding percentage. In the following columns are characteristics of why they are considered uncomfortable spaces. The number that appears in each cell corresponds to the number of people who chose that characteristic.
4.5. Phase 5
- Objective: Design of “word clouds”.
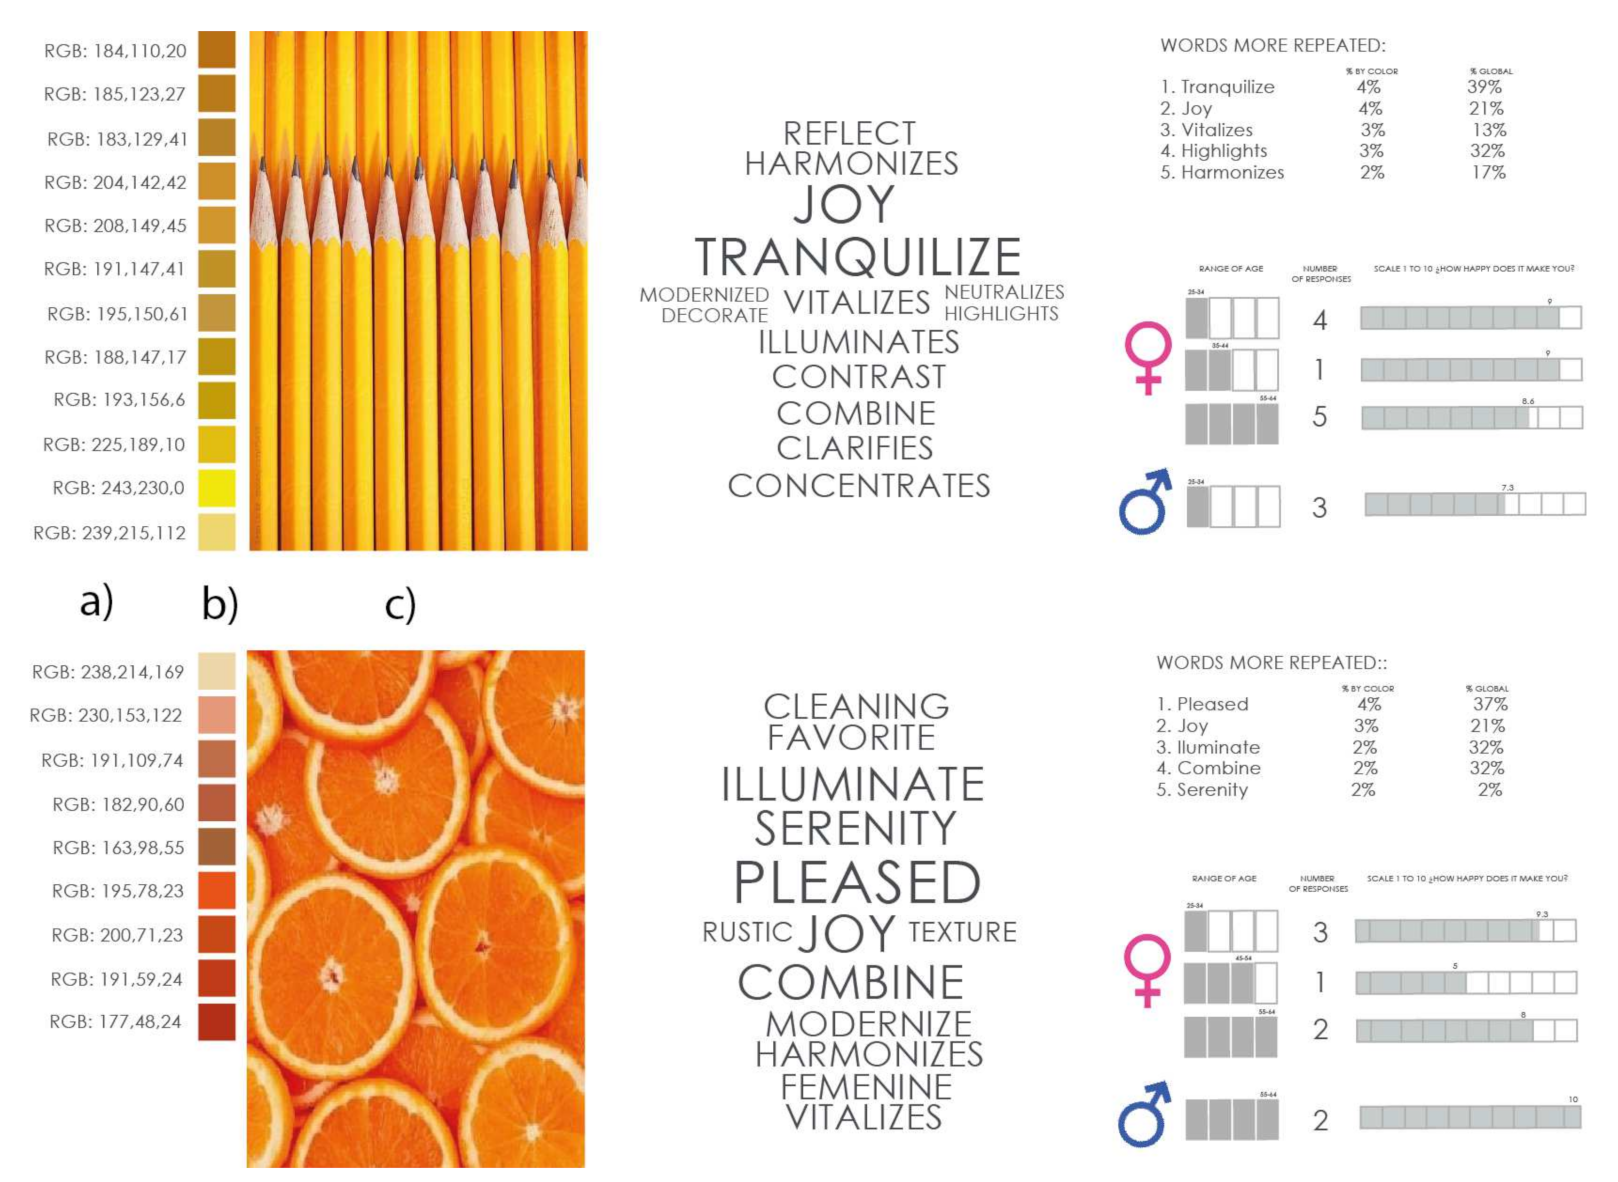
- Description: Based on the information collected we create word clouds that graphically represent the most repeated terms associated with a certain color. They also include range of hues linked to that color, their RGB code, and percentages of how happy they make respondents depending on gender and age (Figure 3).
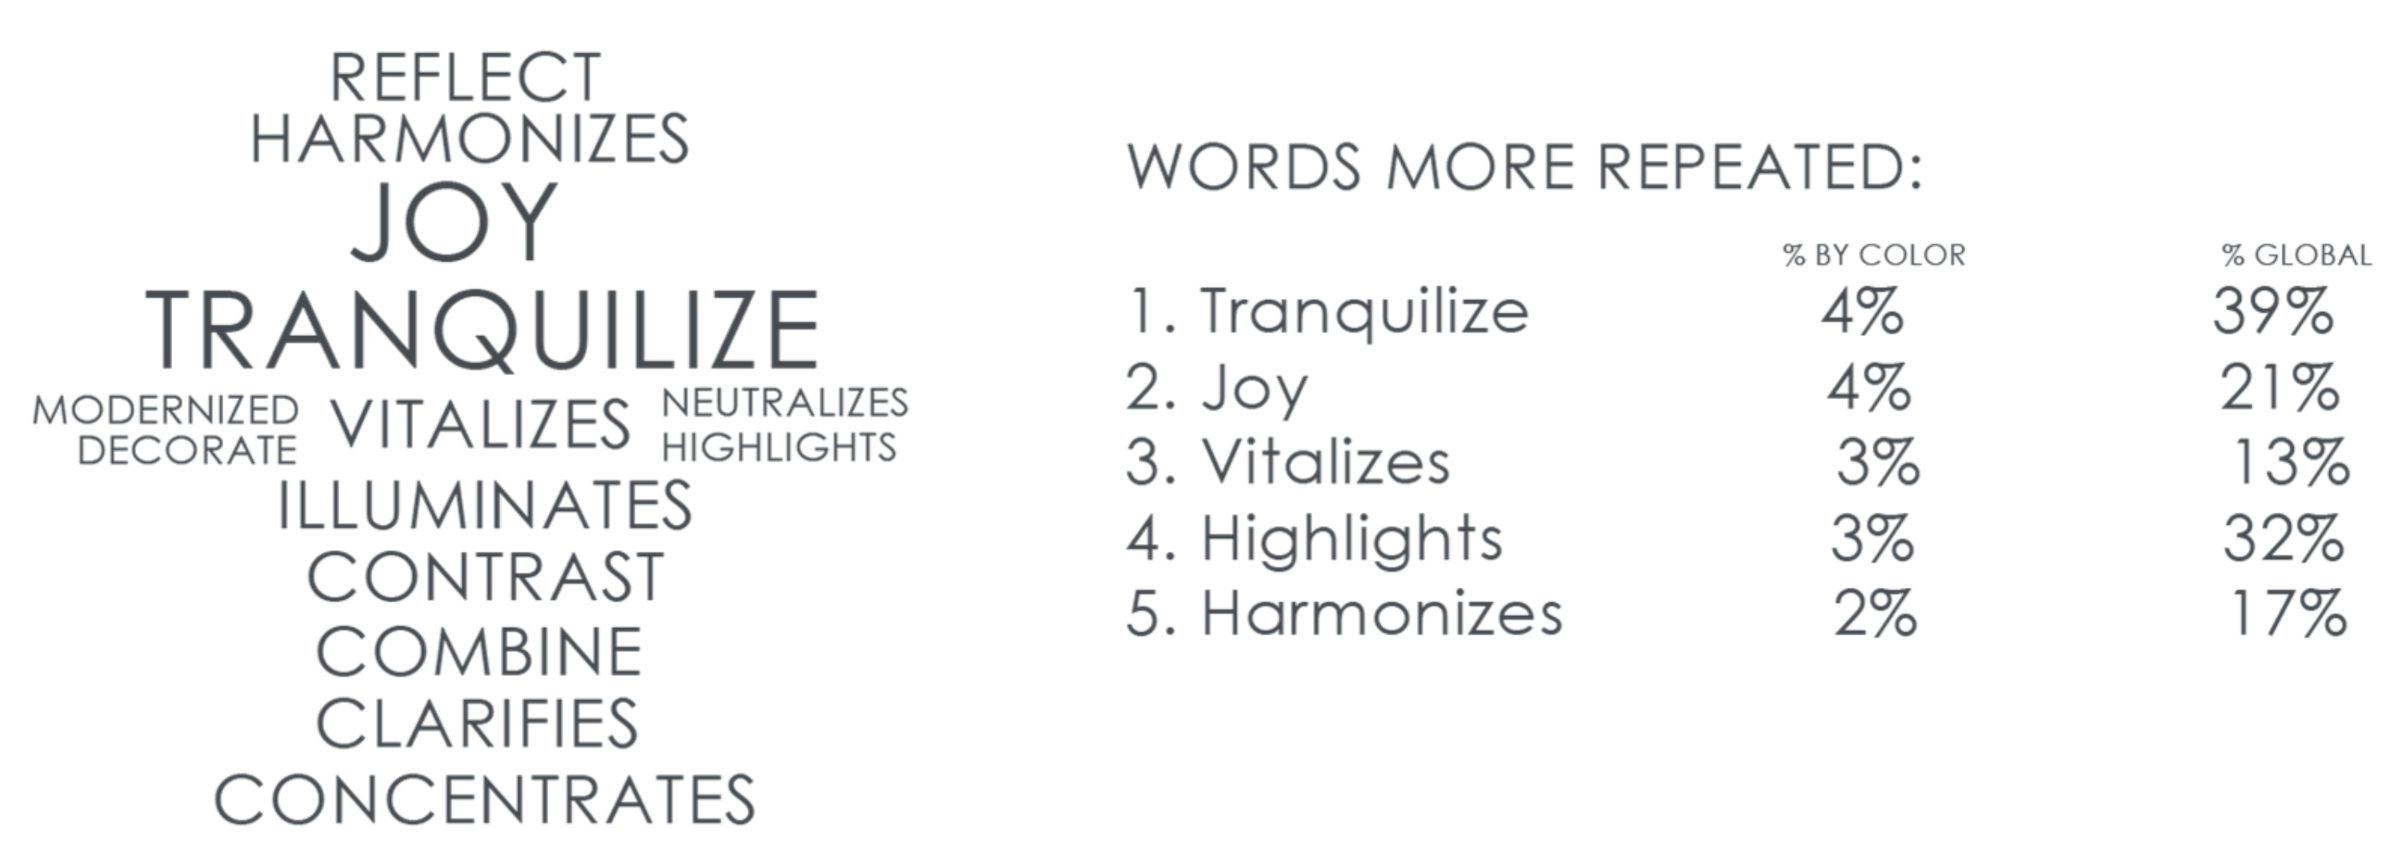
The next part of the graph corresponds to the word cloud itself. It is formed with the most repeated words of answers to open questions. The most cited words appear in a larger size. The next part of the graph is a list of the 5 most repeated words for the color. Two columns follow, one column corresponds to the percentage of people who repeated that word to define the color and the other column shows the percentage of people who used that same word (Figure 4).
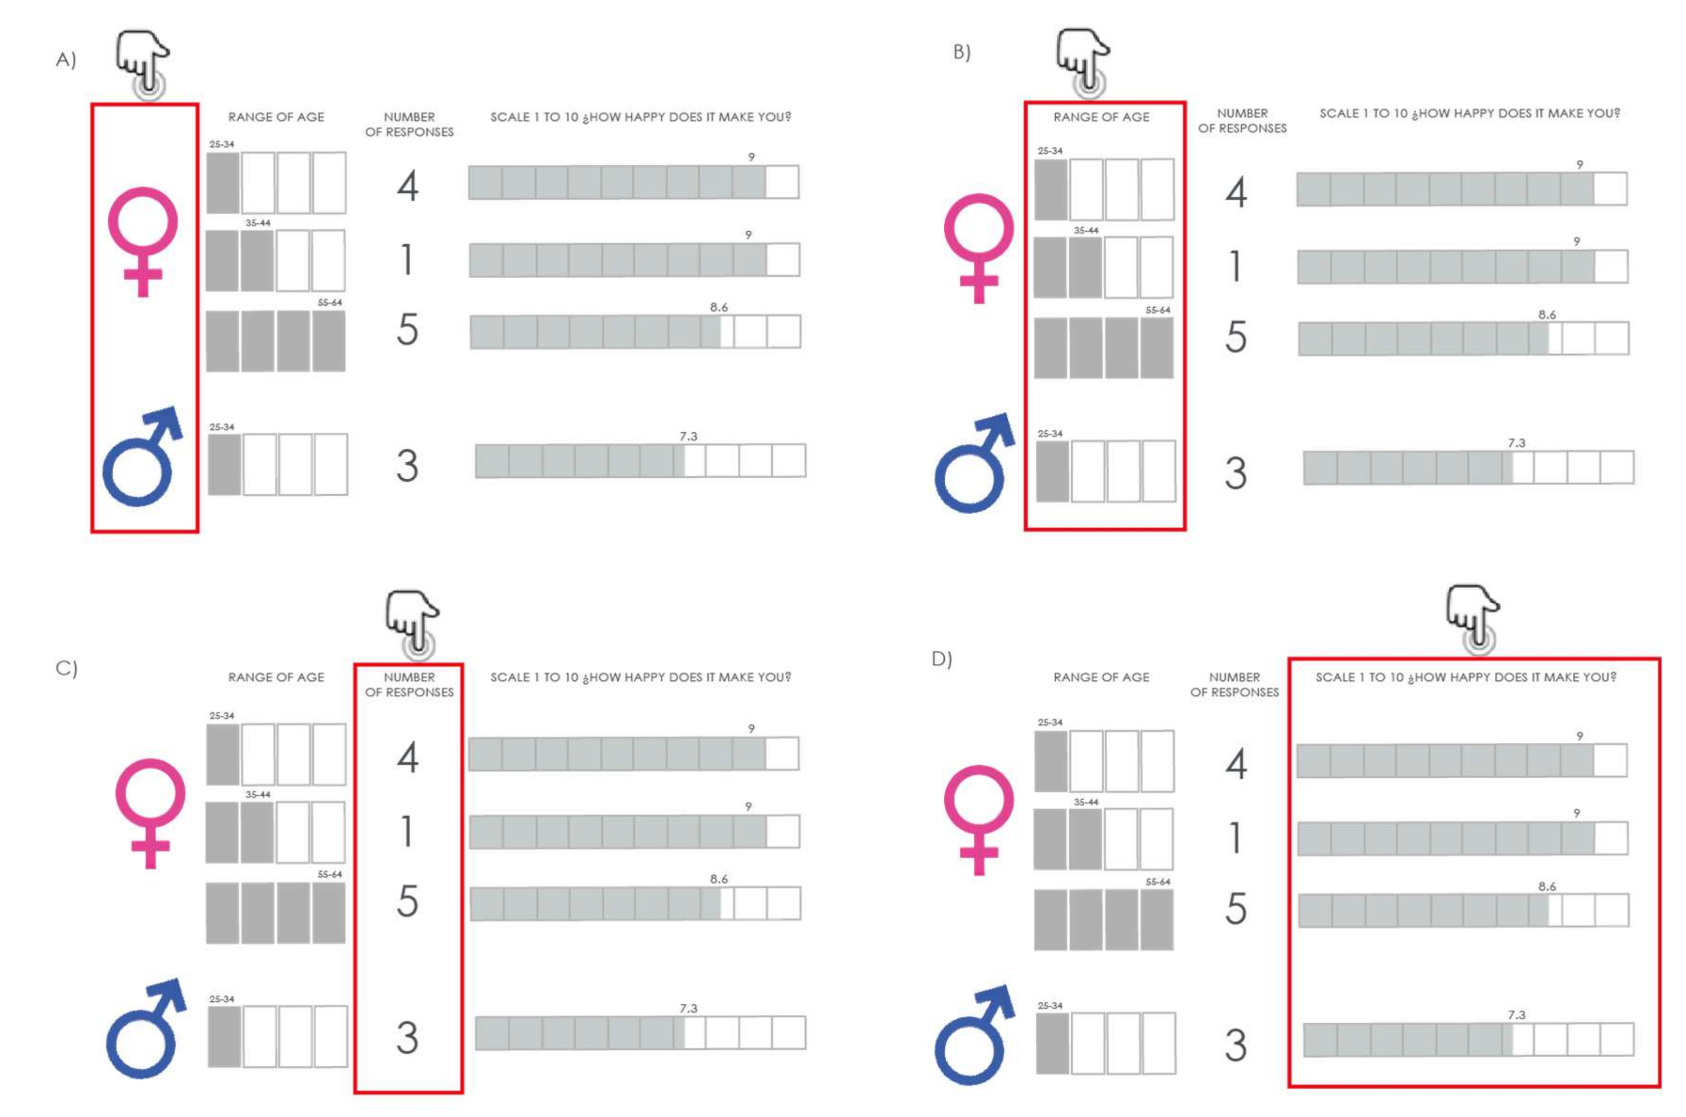
The last section of the graph is divided into four parts. In the first one, we can see symbols corresponding to the respondent’s gender (Figure 5A). In the next column, rectangles colored in gray represent age (Figure 5B). Then we can see a column with the number of people who sent that color (Figure 5C). And finally, the percentage of how happy that color makes the respondents is shown on a scale from 0 to 10 (Figure 5D).
- Research tools used: Word cloud generator and vector graphics editor.
- Sample results: 12 Word clouds of the most frequently submitted colors.
4.6. Phase 6
- Objective: Design of Chromatic Circle.
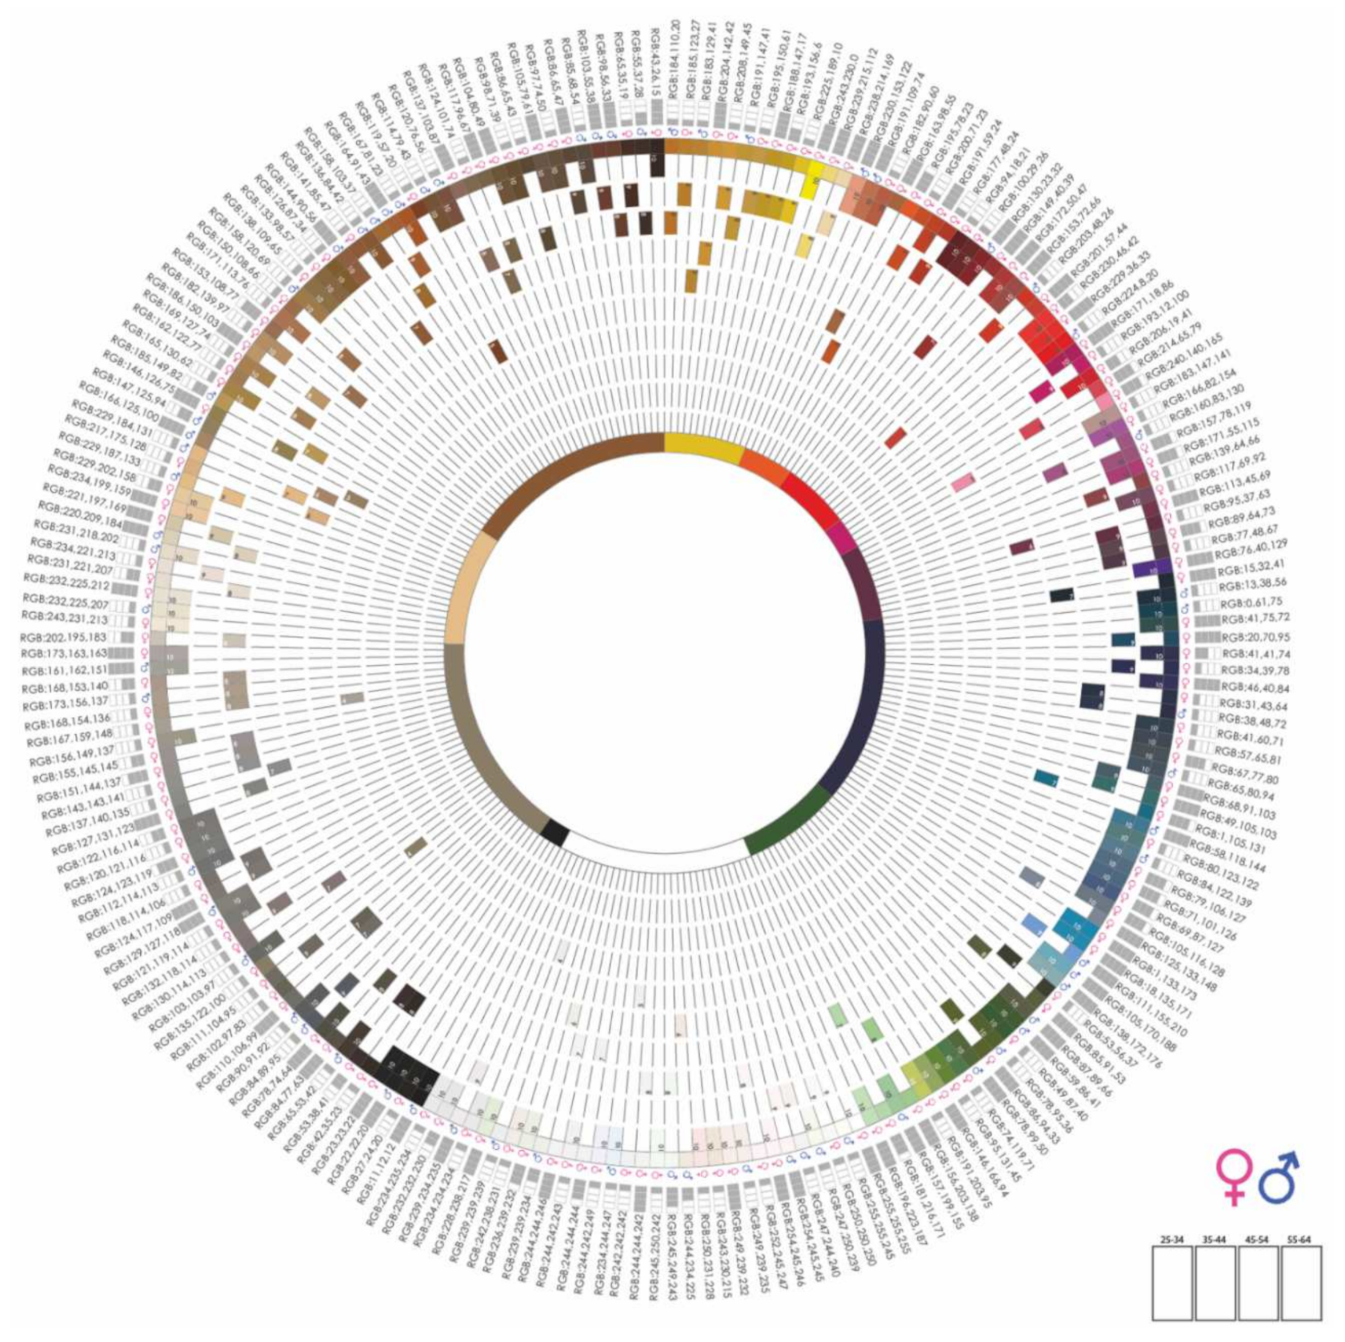
- Description: We considered that the best way to represent all colors was by means of a chromatic circle. A single graph allows you to identify all the hues sent, their RGB codes, the gender and age of the respondents and the percentage of how happy each color makes them.
From outside to inside, the chromatic circle shows the RGB code of different hues (Figure 6A). Next, the age ranges are represented by four rectangles. Depending on the age of the person the rectangles will appear gray, for example, if the person is in the range of 25 to 34 years only the first rectangle will be gray (Figure 6B). Next, the respondent’s gender is shown reduced to the binary standards female or male (Figure 6C).
Then, the full range of hues of the colors sent is represented sorted according to their saturation (Figure 6D).
Using the same hues, the next part of the graph corresponds to the percentage of how happy that color makes them by placing each marker on a scale of 1 to 10 on the radii of the circle (Figure 6E).
In the inner part of the circle are the simplification of the colors that respondents sent in 12 hues (Figure 6F).
- Research tools used: Vector graphics editor.
- Sample results: Chromatic Circle (Figure 7).
4.7. Phase 7
- Objective: Design of the Texture Circle.
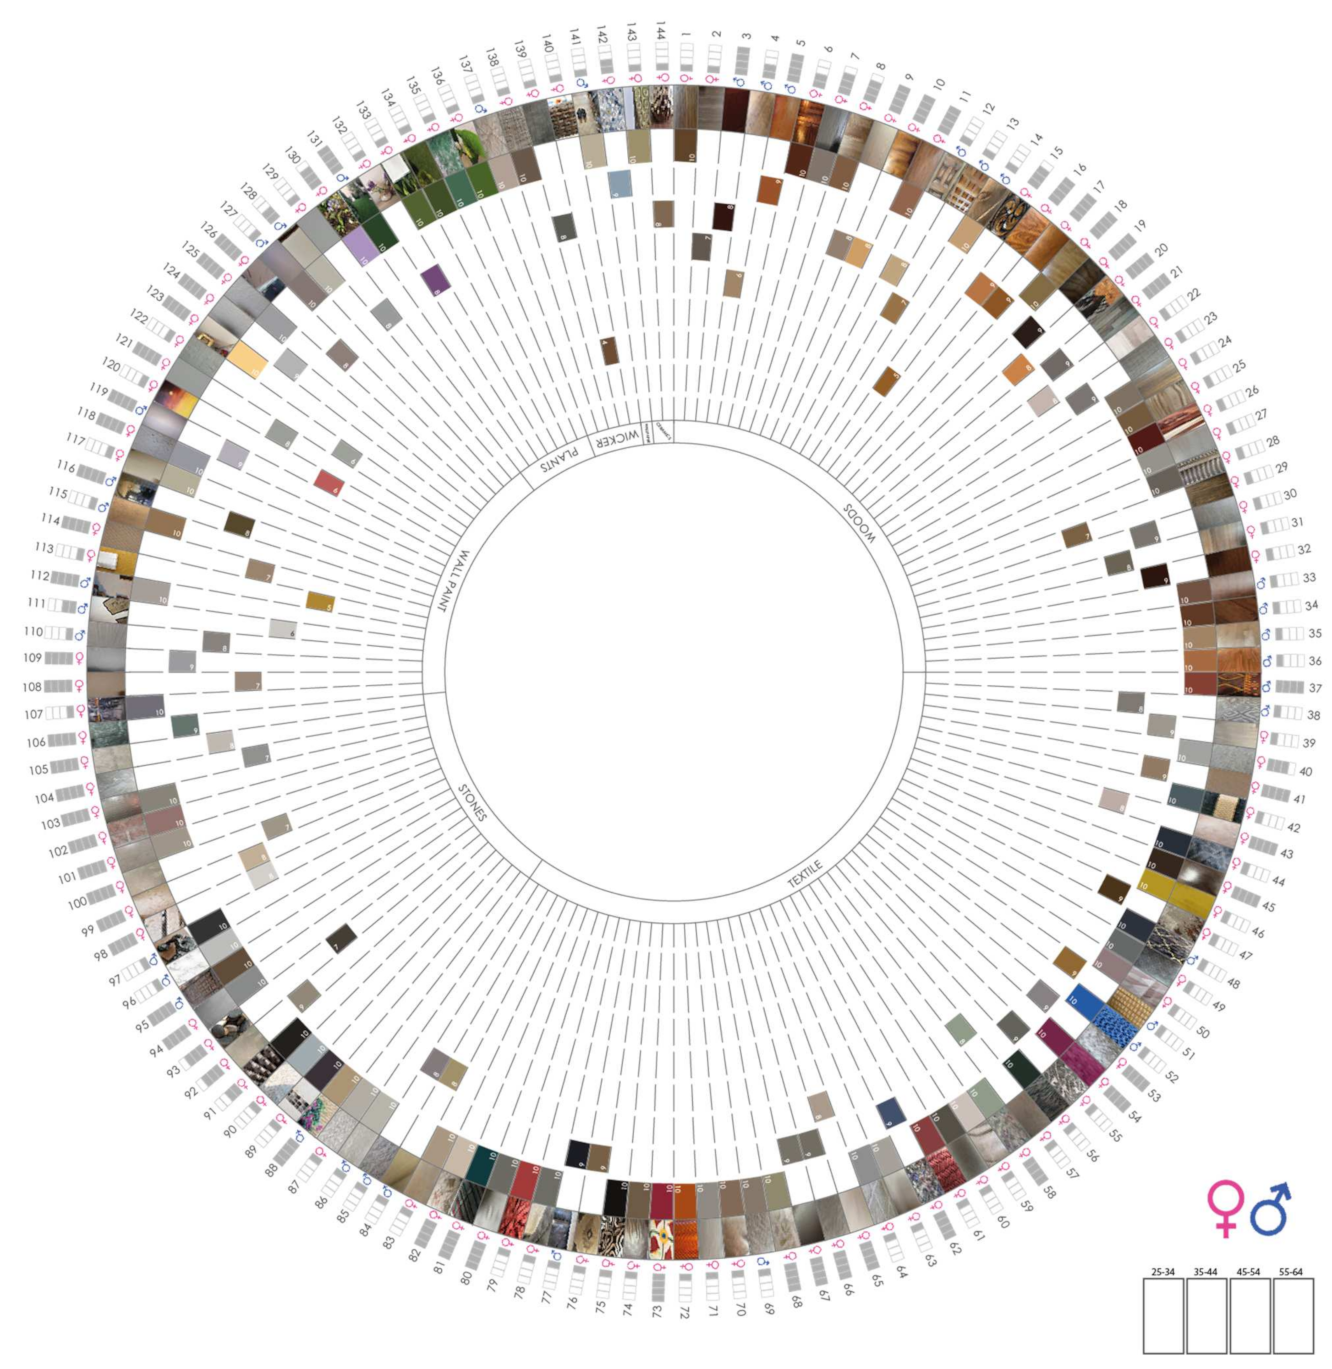
- Description: Following the same idea of the chromatic circle, it was considered to represent in the same way all the images of the textures. In the same graph, all the textures that the respondents sent can be identified, classified according to type, and indicate the gender and age of the respondents and the percentage of how happy it makes them.
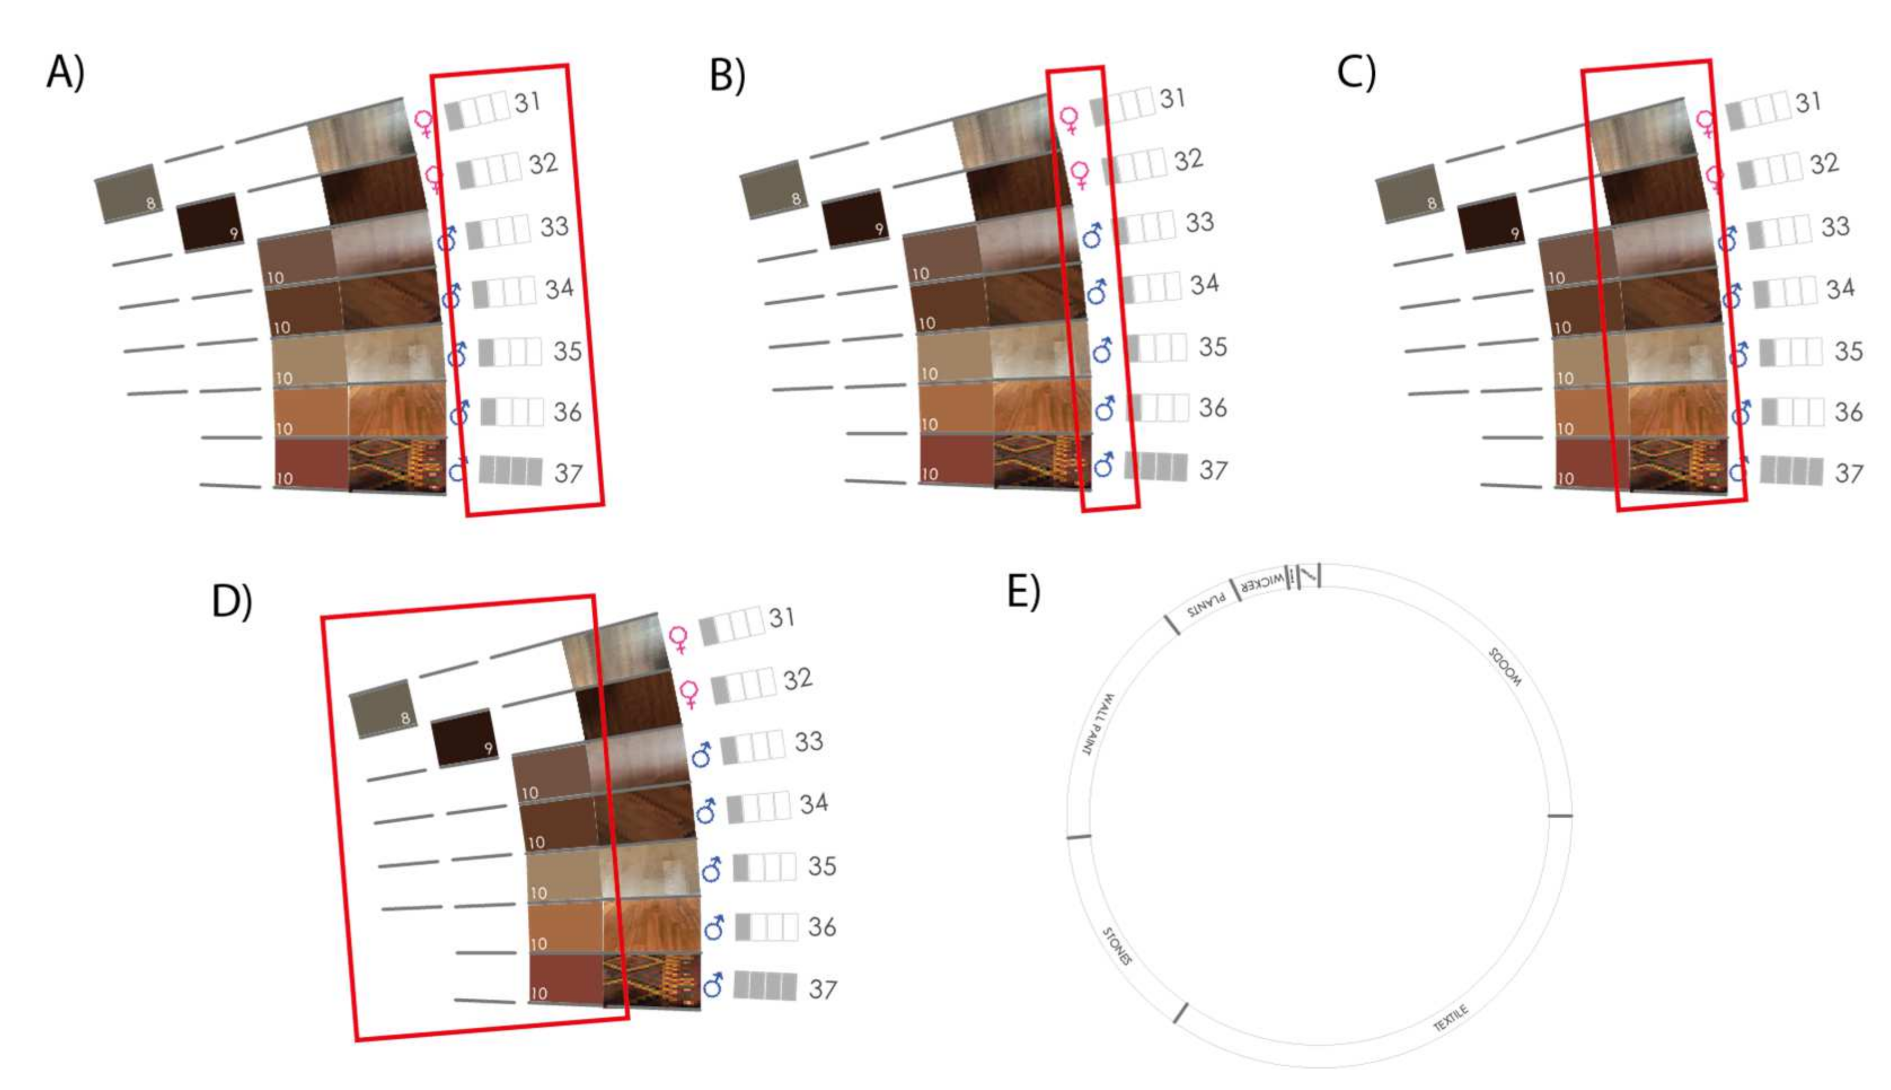
From outside to inside, we first find the numbering that corresponds to the order in which the textures are found in the graph and serves to refer the Texture circle with the images sent (Figure 8A). Then we find the age range, represented in the same way as in the chromatic circle (Figure 8A). Next, the gender of the respondent is indicated (Figure 8B). Then, we show all the textures sent classified depending on the type of texture-woods, textiles, stone, paintings, plants, wicker, wallpaper, and ceramics (Figure 8C). Using the same hues of the textures, the next part of the graph corresponds to the percentage of how happy the texture makes the respondents (Figure 8D). In the inner part of the circle, the eight types of textures are classified (Figure 8E).
- Research tools used: Vector graphics editor.
- Sample results: Texture Circle (Figure 9).
4.8. Phase 8
- Objective: Design of the Objects Circle.
- Description: Following the same idea of the chromatic circle and the circle of textures, all the images of the objects sent by the respondents were represented in the same way. In the same graph, all the objects can be identified, classified according to their type, and indicating the gender and age of the respondents and the percentage of how happy they make them.
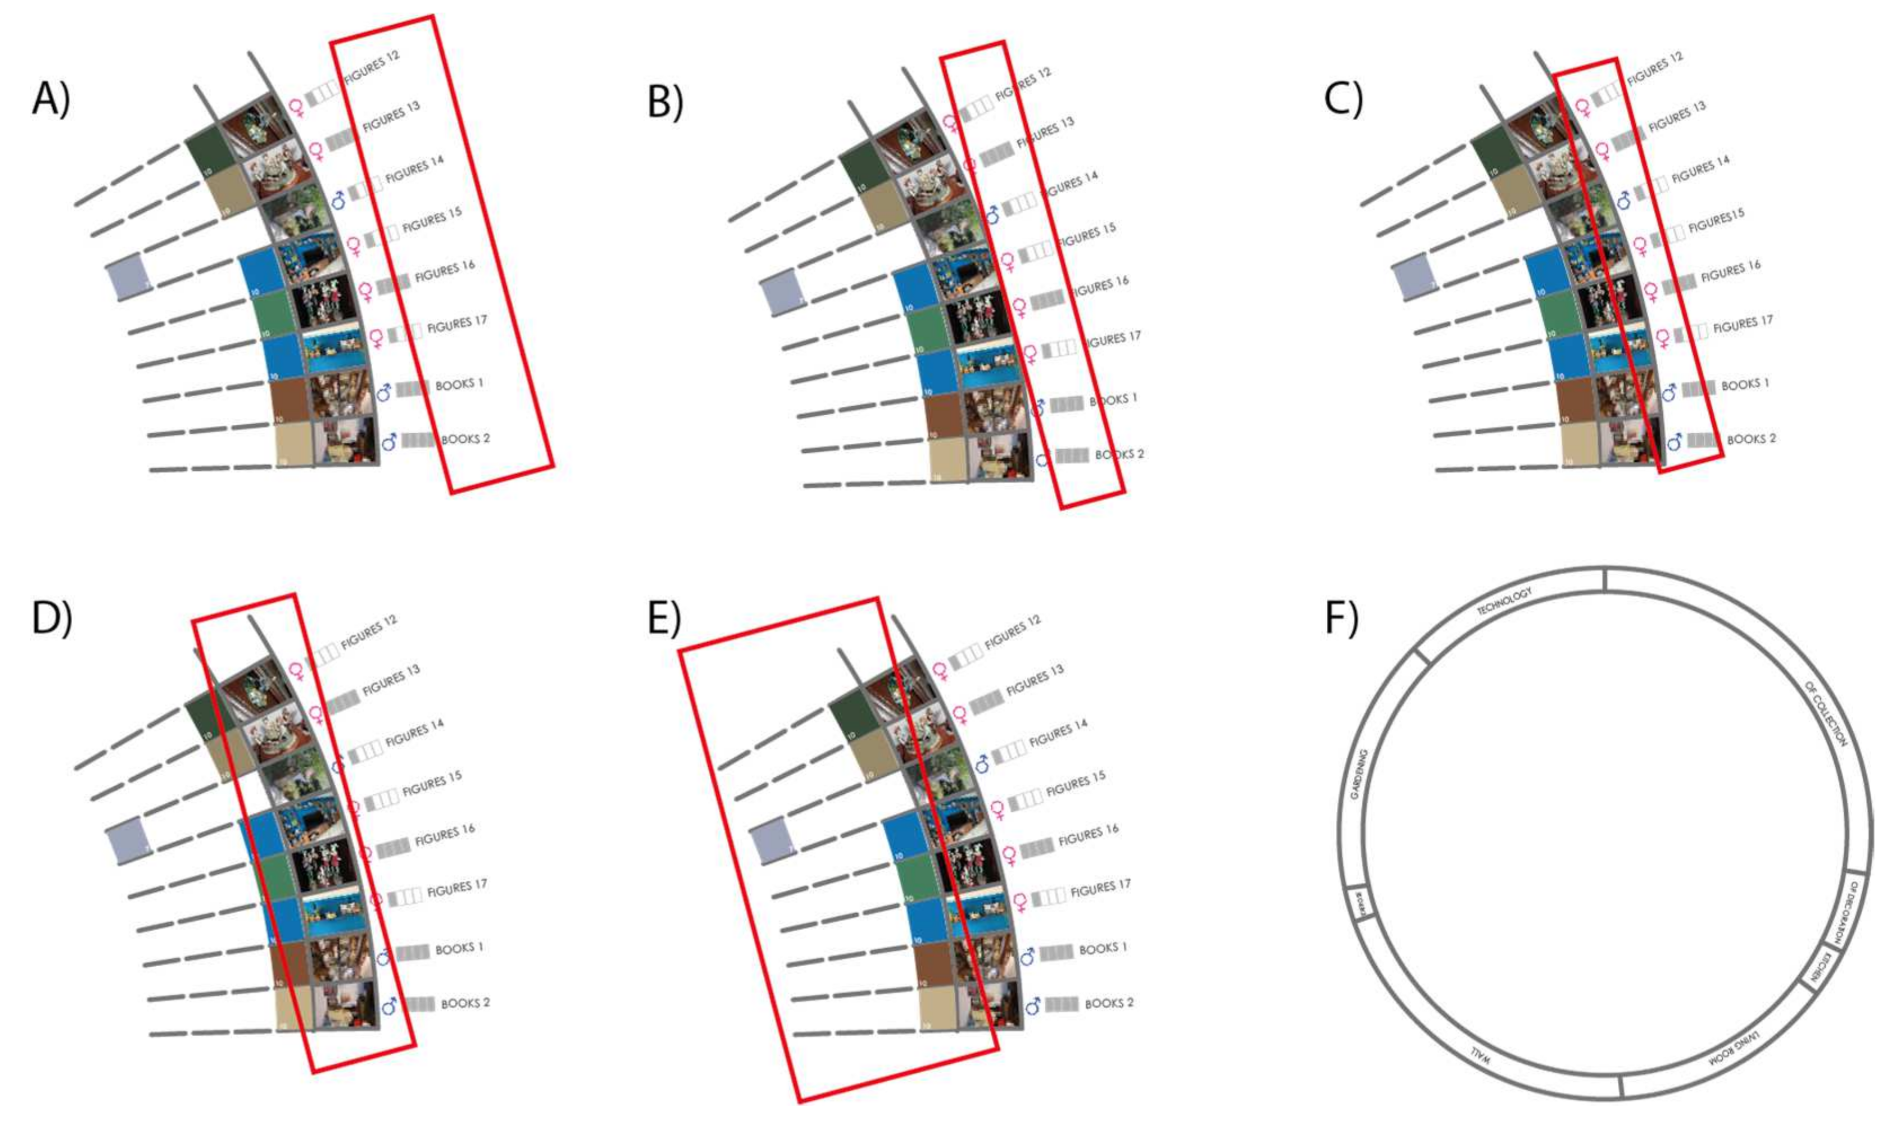
From outside to inside, we begin by indicating the type of object in each image—figures, books, vases, flowerpots, etc. (Figure 10A). This is followed by the age range (Figure 10B) and the gender of the respondent (Figure 10C). Then the figures of all the objects submitted are shown (Figure 10D). Using the same hues of the objects, the next part of the graph corresponds to the percentage of how happy the object makes them (Figure 10E). In the inner part of the circle, the objects are classified into eight types-collectibles, decorative, kitchen, living room, wall, exercise, gardening, and technology (Figure 10F).
- Research tools used: Vector graphics editor.
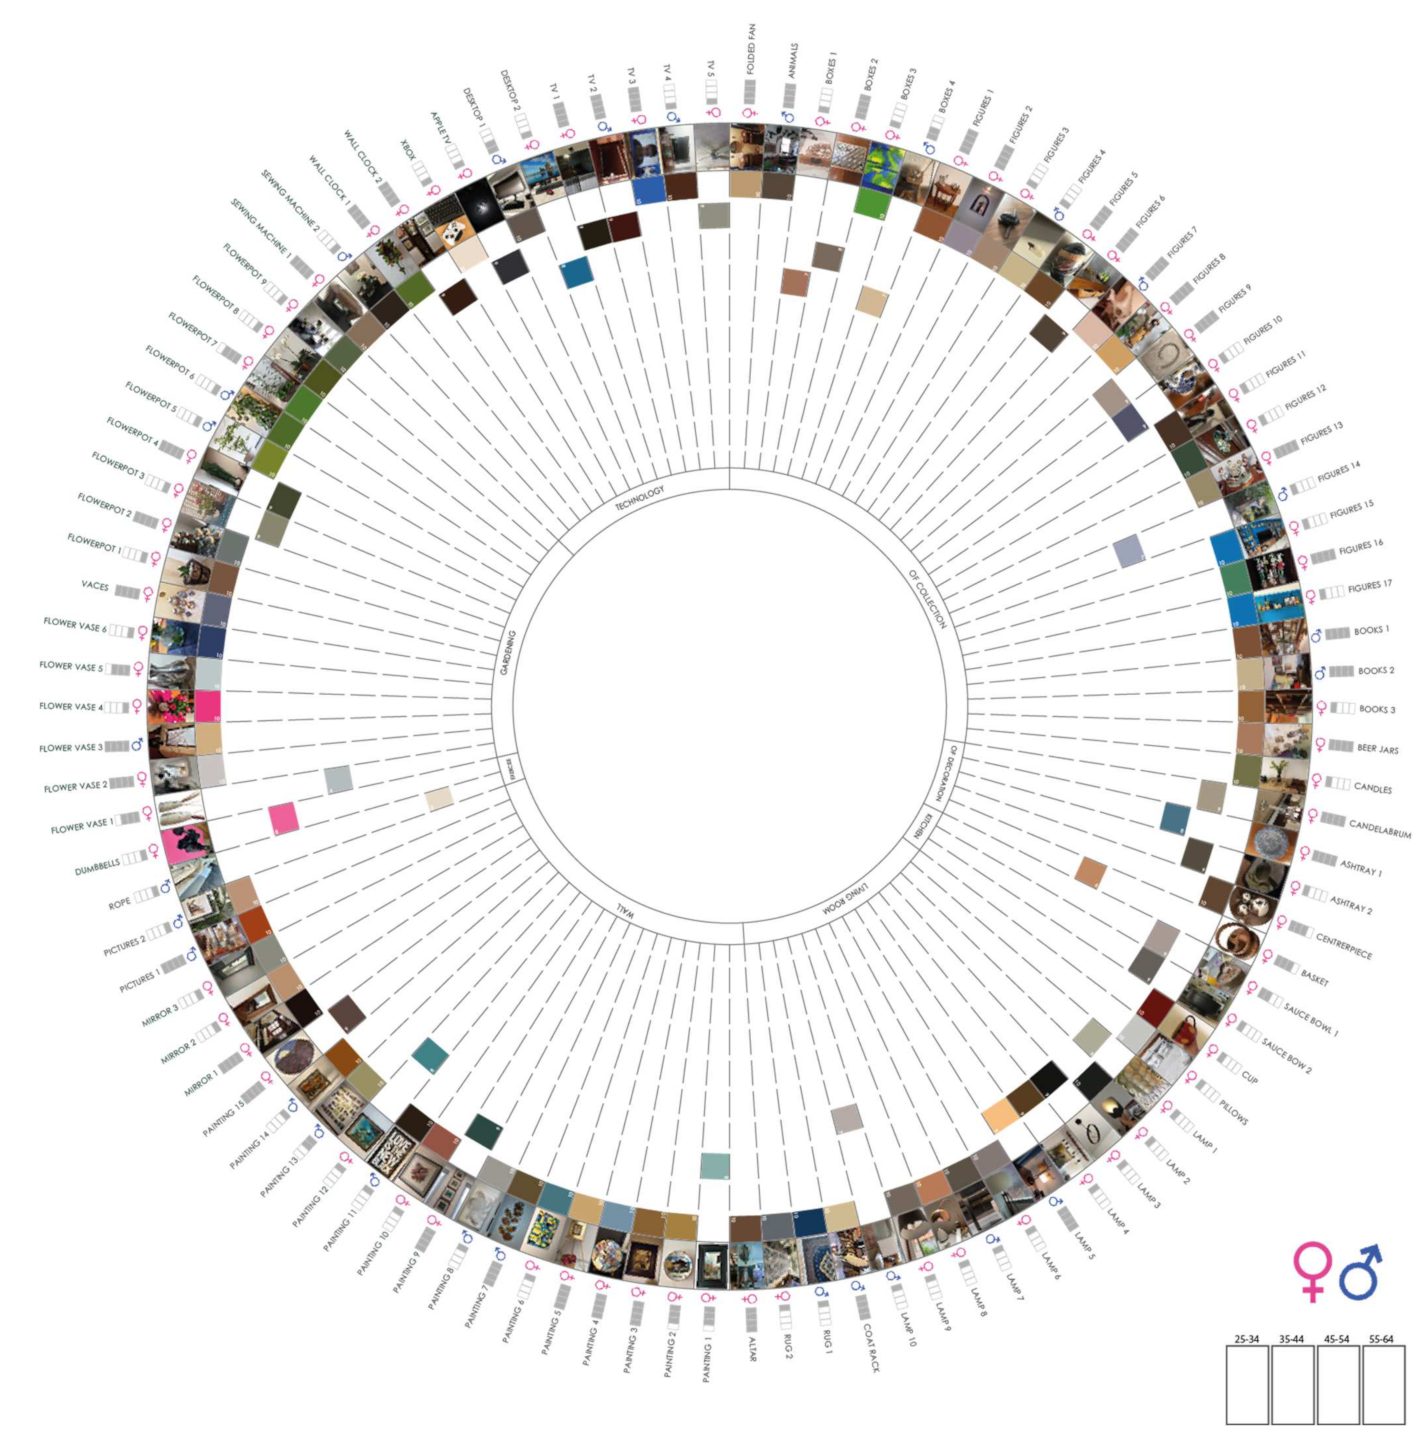
- Sample results: Objects Circle (Figure 11).
4.9. Phase 9
- Objective: Design of the Furniture and Equipment Circle.
- Description: Following the idea of the previous circles, the furniture and equipment was represented in the same way. In the same graph it is possible to identify all the furniture and equipment that the respondents sent classified by type and showing the gender and age of the respondents and the percentage of how happy it makes them.
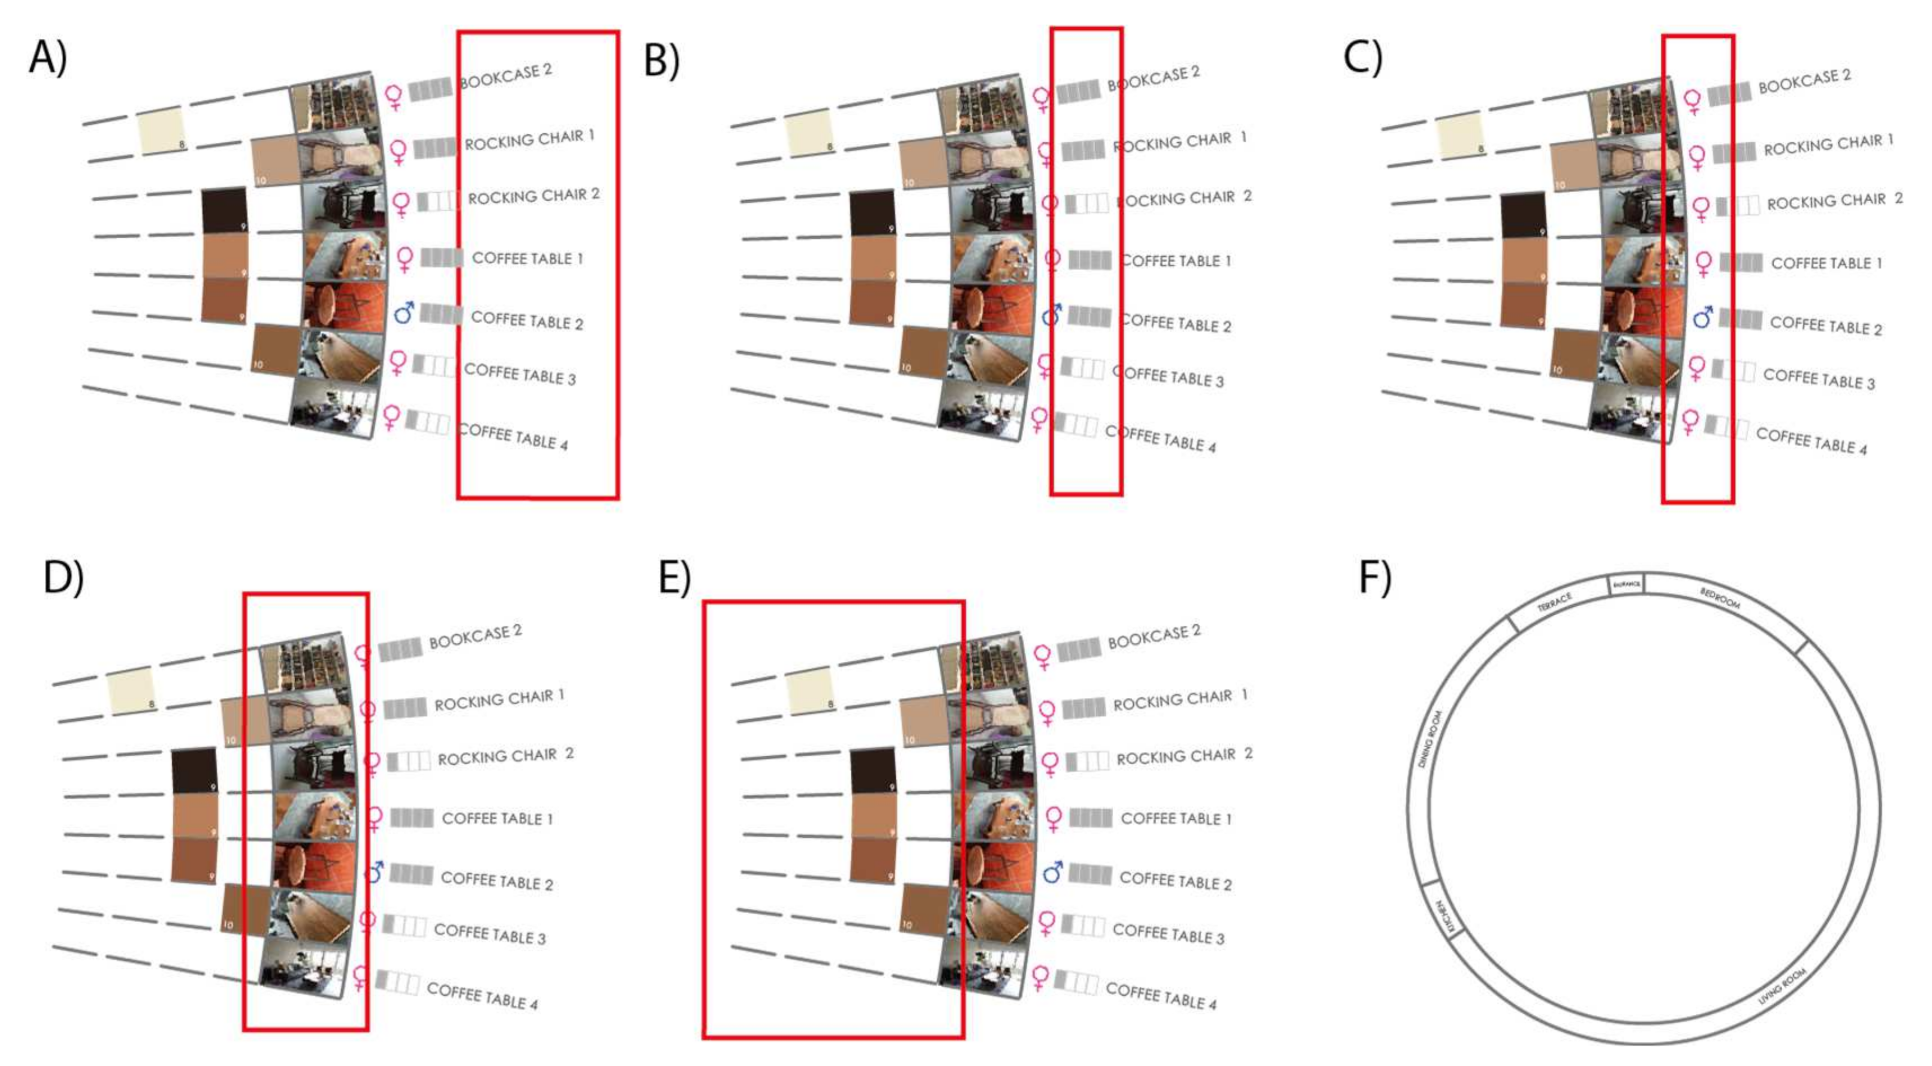
From outside to inside, we start with the type of furniture and equipment shown in the images—bookcase, rocking chair, coffee tables, etc. (Figure 12A). Next are the age range (Figure 12B), the gender of the respondent (Figure 12C), and the images of the furniture and equipment submitted (Figure 12D). Using the same furniture and equipment hue, the next part of the graph corresponds to the percentage of how happy the furniture and equipment make each respondent (Figure 12E). The inner part of the circle indicates the six types of spaces where the furniture and equipment are found—bedroom, living room, kitchen, dining room, terrace, and entryway (Figure 12F).
- Research tools used: Vector graphics editor.
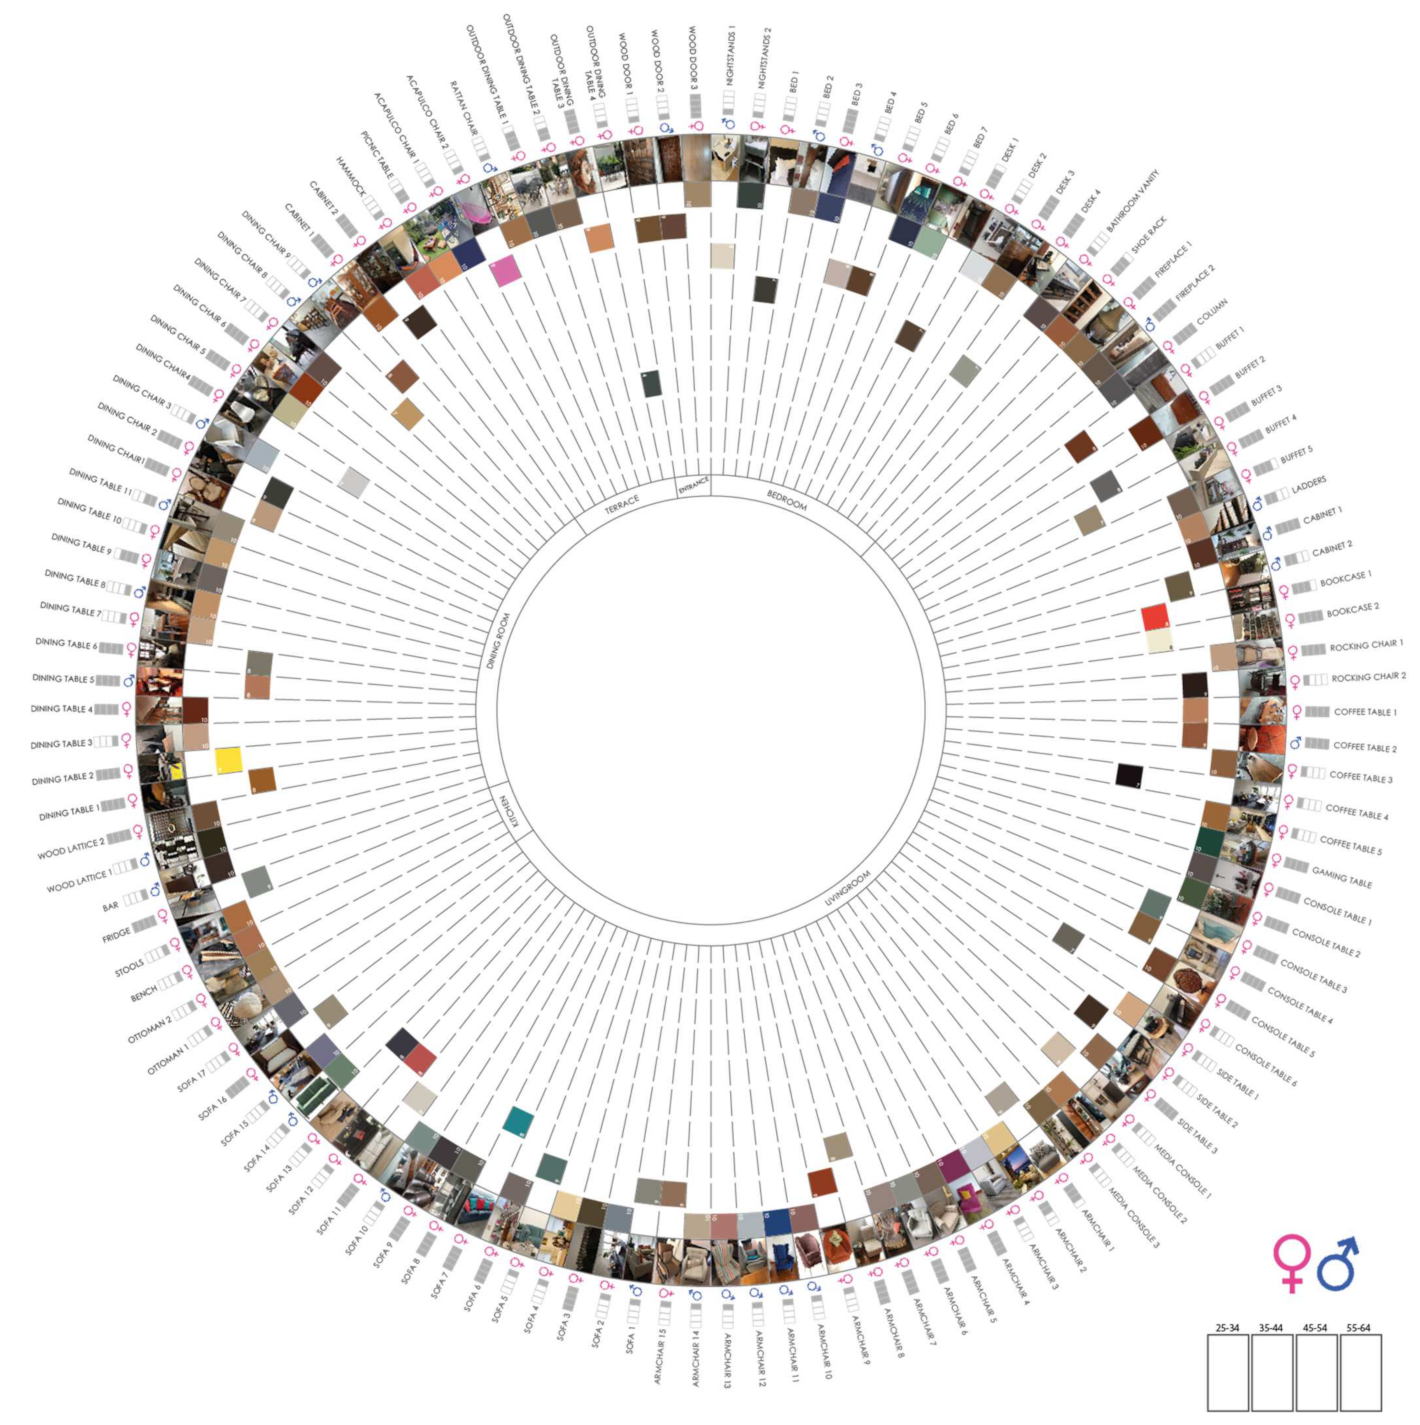
- Sample results: Furniture and Equipment Circle (Figure 13).
5. Results
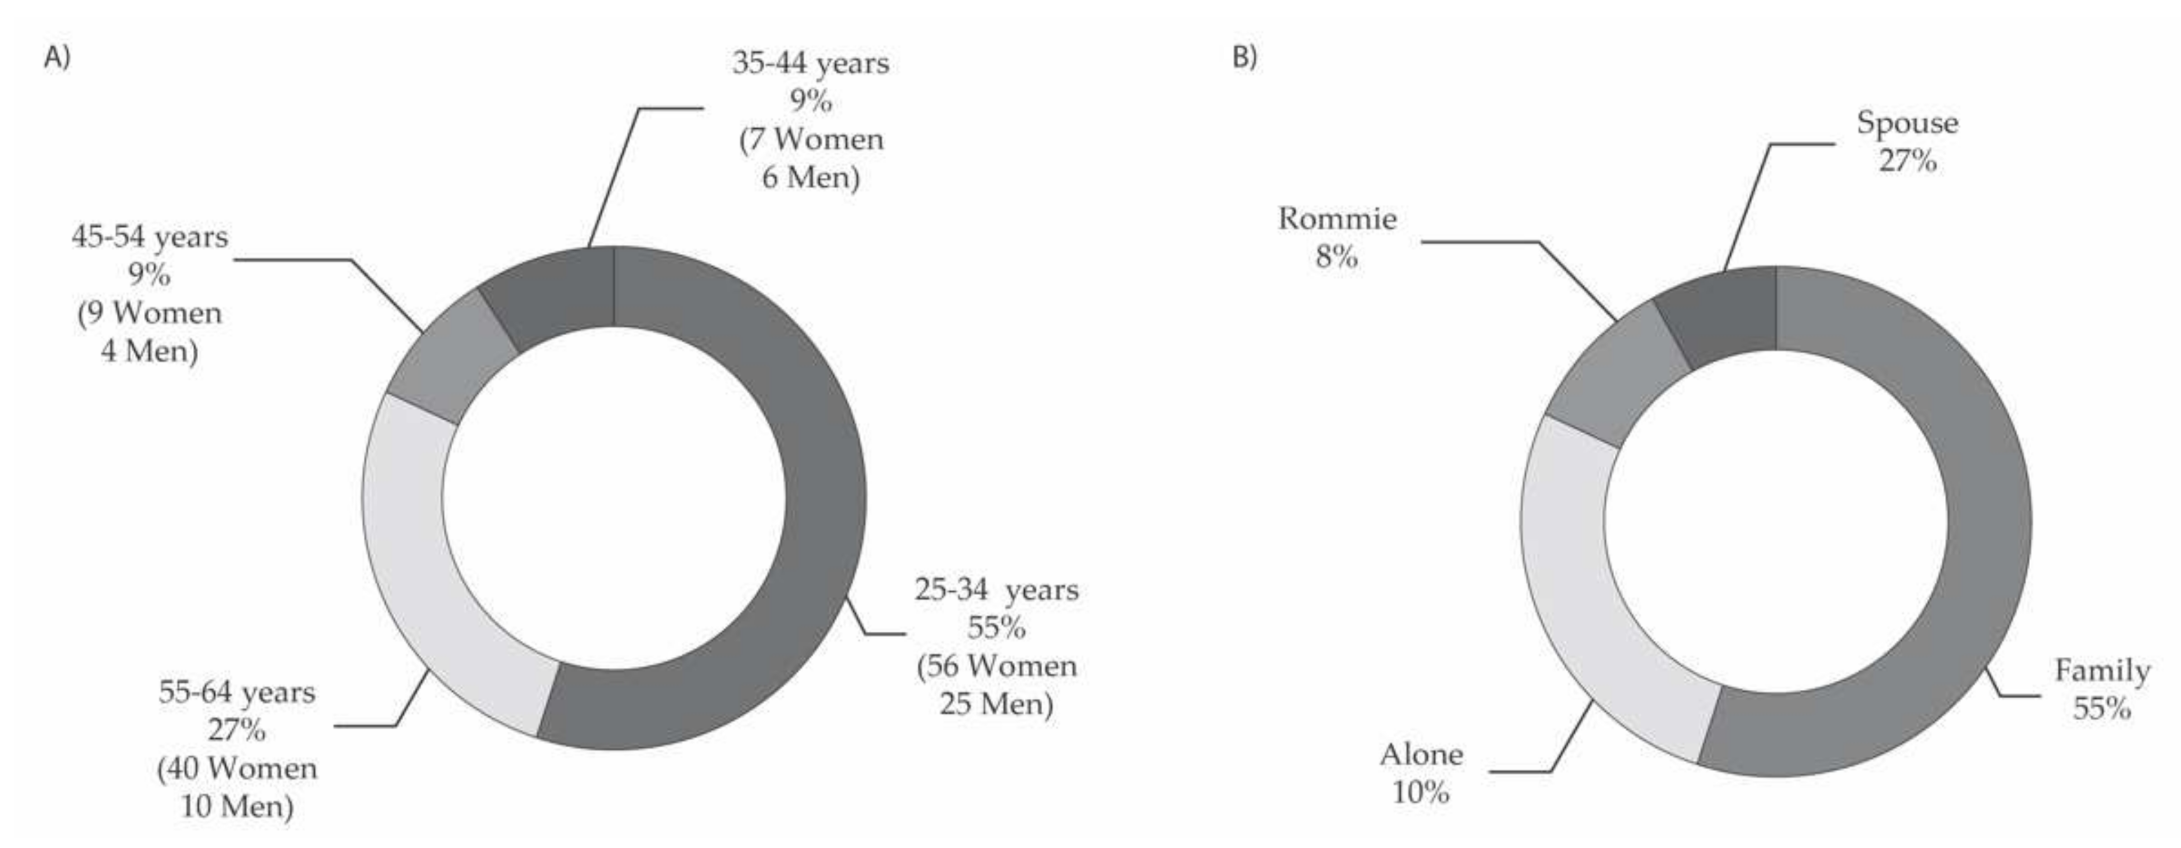
The survey was carried out with 147 people of which 68.71% were women and 31.29% were men. In terms of age range, 55.10% were 25 to 34 years old (56 women and 25 men), 8.84% were 35 to 44 years old (seven women and six men), 8.84% were 45 to 54 years old (nine women and four men) and 27.21% were 55 to 64 years old (30 women and 10 men) (Figure 14A).
Of the 147 respondents, 10.20% were living alone during the COVID-19 lockdown period, 8.16% with someone other than their family, 55.10% with their family, and 26.53% only with their partner (Figure 14B).
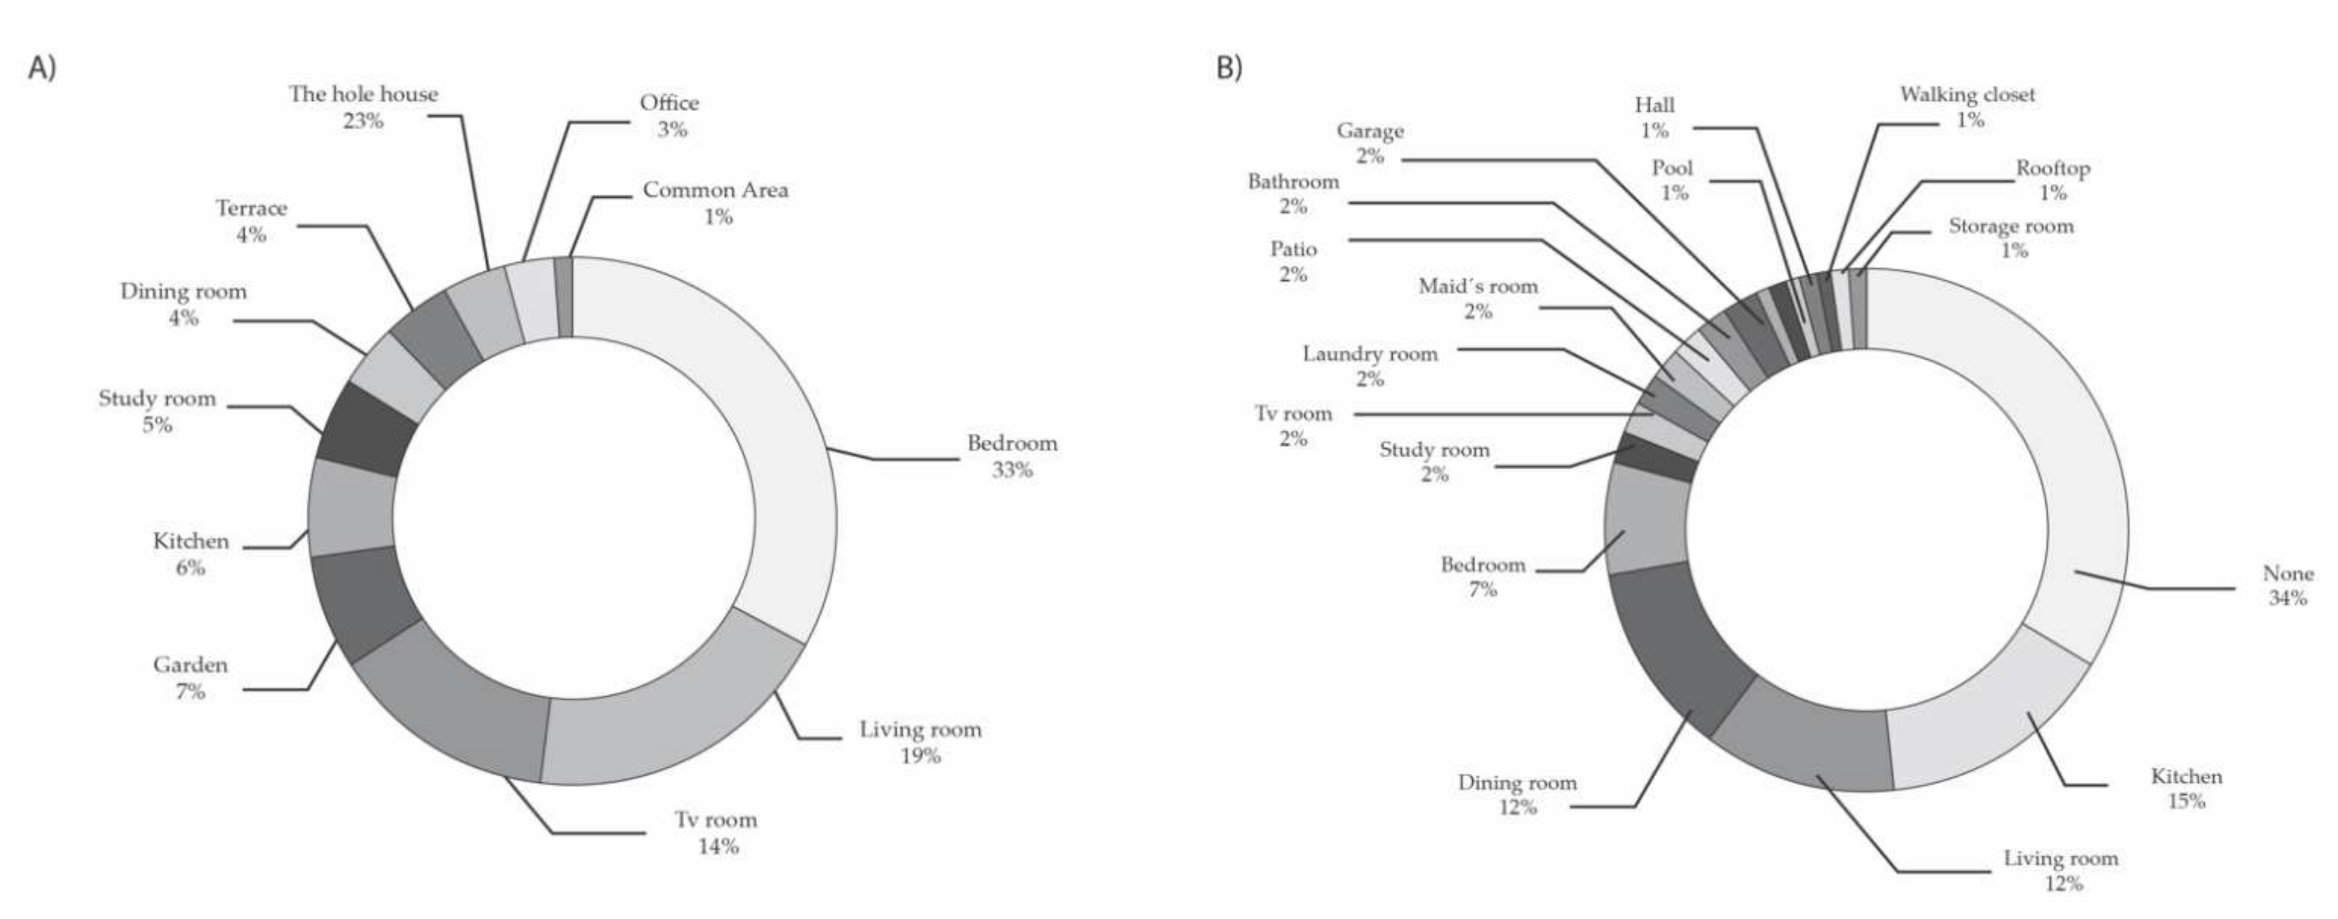
In the question, in which areas of your home do you feel most comfortable? respondents answered that they feel most comfortable in the bedroom (32.14%), followed by the living room (18.45%), the TV room (13.09%), the garden (6.54%), the kitchen (5.95%), the study (4.76%), the terrace and the dining room (4.16%) (Figure 15A). Meanehile only 3.64% feel comfortable in the entire dwelling. A total of 33.96% of the respondents indicated that they do not feel uncomfortable in any space of their home. The kitchen is one of the least preferred places with a percentage of 15.09%, followed by the living room and dining room (12.26%) and the bedroom (6.69%) (Figure 15B).
5.1. Word Clouds Results
After making the Word Cloud graph of the analyzed sample (Figure 3) it can be observed that the five most common colors among the respondents are gray, brown, white, blue, and beige. And the three most repeated words to describe them are “brightens” in the colors gray, white, blue, and beige; “pleases” in the colors brown, white and beige; and “soothes” in the colors, white, blue, and beige. The next five most popular colors are yellow, violet, red, orange, and green. The most repeated word to describe them, appearing in four of the five colors, is “cheers,” which refers to yellow, violet, red and orange. The next most repeated words describing the group of the second most popular colors are: “combines” for green, red, and orange; “illuminates” for green, yellow, and orange and, finally, “vitalizes” for green, yellow and red.
This denotes the importance that respondents attach to elements that symbolically convey “life” and “light” due to the situation of lockdown and the psychological problems resulting from the pandemic.
The colors least named by the respondents are magenta and black. In the case of magenta, the words they used to describe it are illuminates, contrasts, calming, feminine and nature. Meanwhile, for black they are pleasing, fineness, combines, sophisticated and harmonizes.
5.2. Chromatic Circle Results
The five colors most appreciated by respondents are gray, brown, white, blue, and beige. They are followed by green, yellow, violet, red and orange. Magenta and black are the least appreciated colors. Of these, magenta is the only color that only women like, while black is the only color in which the same percentage of both women and men are represented.
The most common preferred colors among those 25–34 years old, both women and men, are: brown, violet, white, gray, orange and beige. Men also indicated a predilection for yellow, red, and blue. In the 35 to 44 age range, the colors most liked by both men and women were beige and white. Women also indicated a predilection for magenta, red, yellow, and blue and men for brown. In the case of women between 45 and 54 years of age, the colors they like most are magenta, blue, violet, orange, green, gray, and brown. The only color in which both men and women agreed was white. Finally, the most common colors in both women and men aged 55 to 64 are red, black, green, blue, beige, orange, brown, white, and gray. Yellow, magenta, and violet are colors only mentioned by women (Figure 7).
5.3. Texture Circle Results
The circle of textures (Figure 9) is divided into eight groups. The texture most repeated by respondents was textiles, followed by woods, paints, stone, plants, wicker, and finally ceramics and wallpaper.
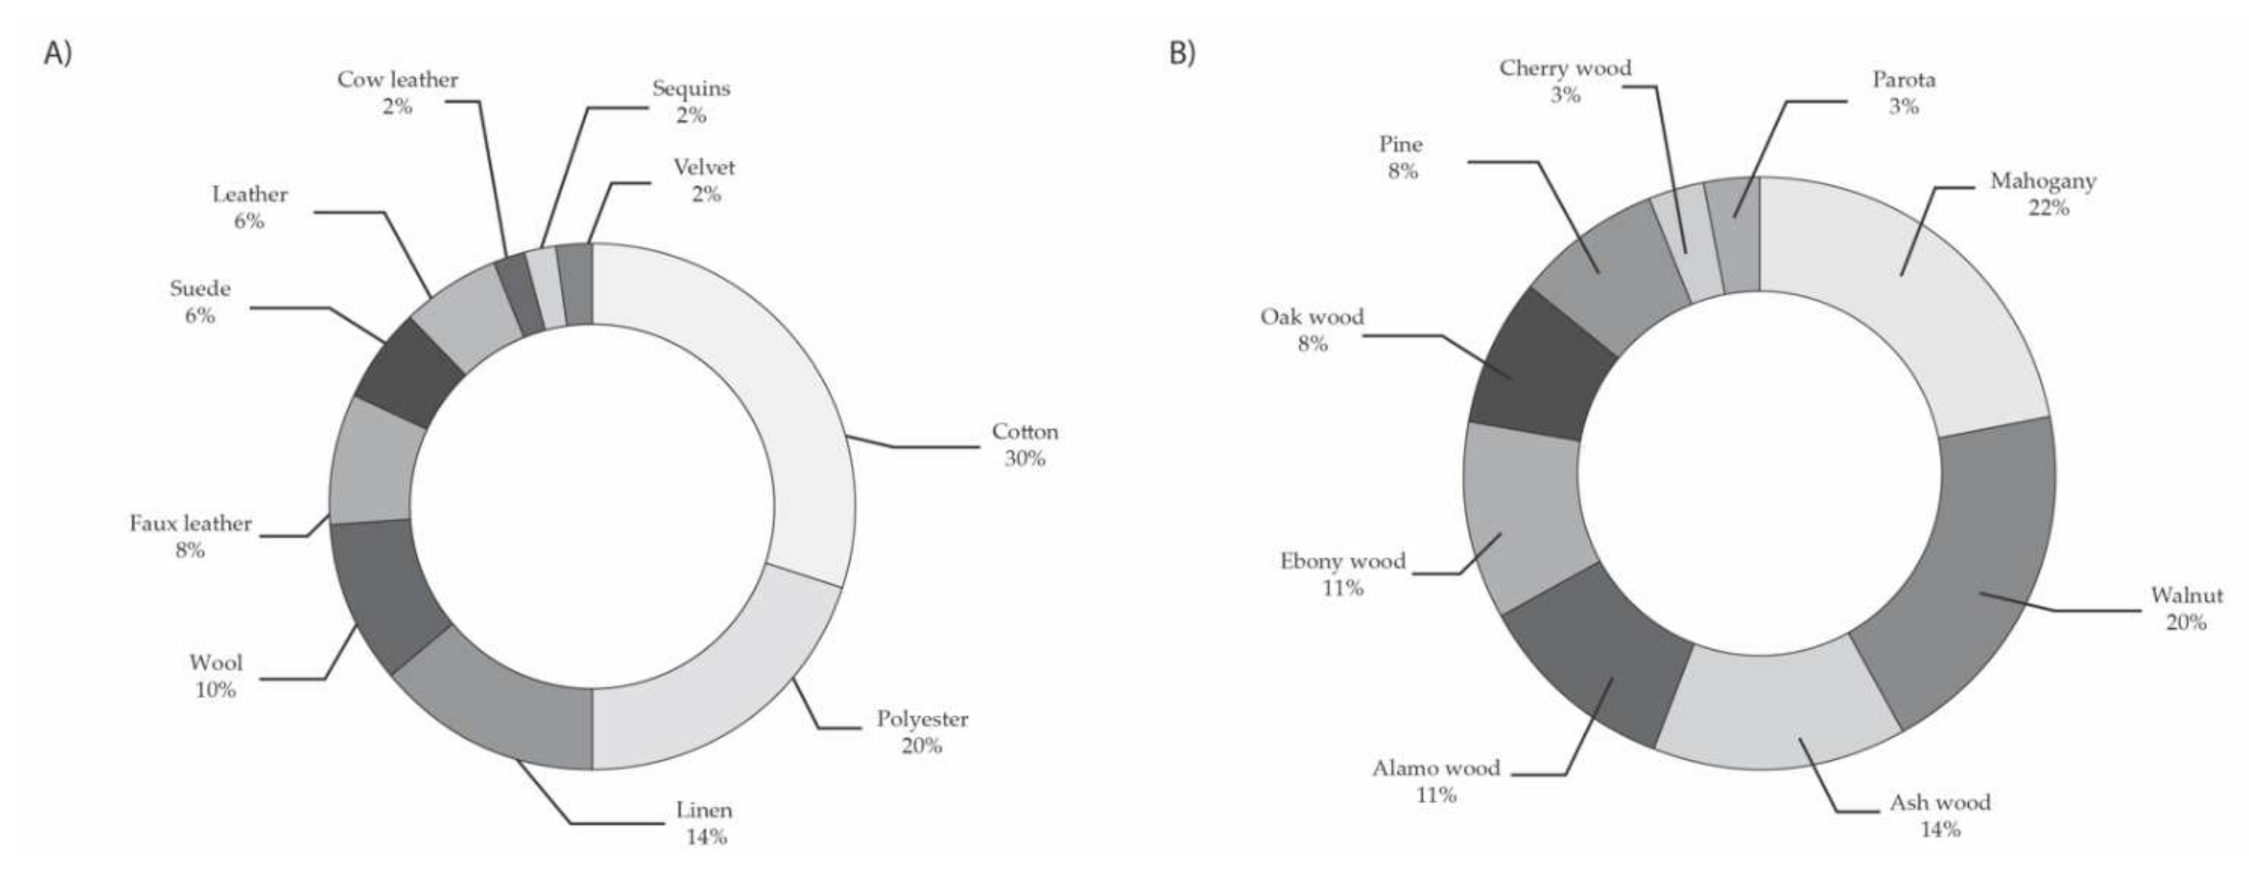
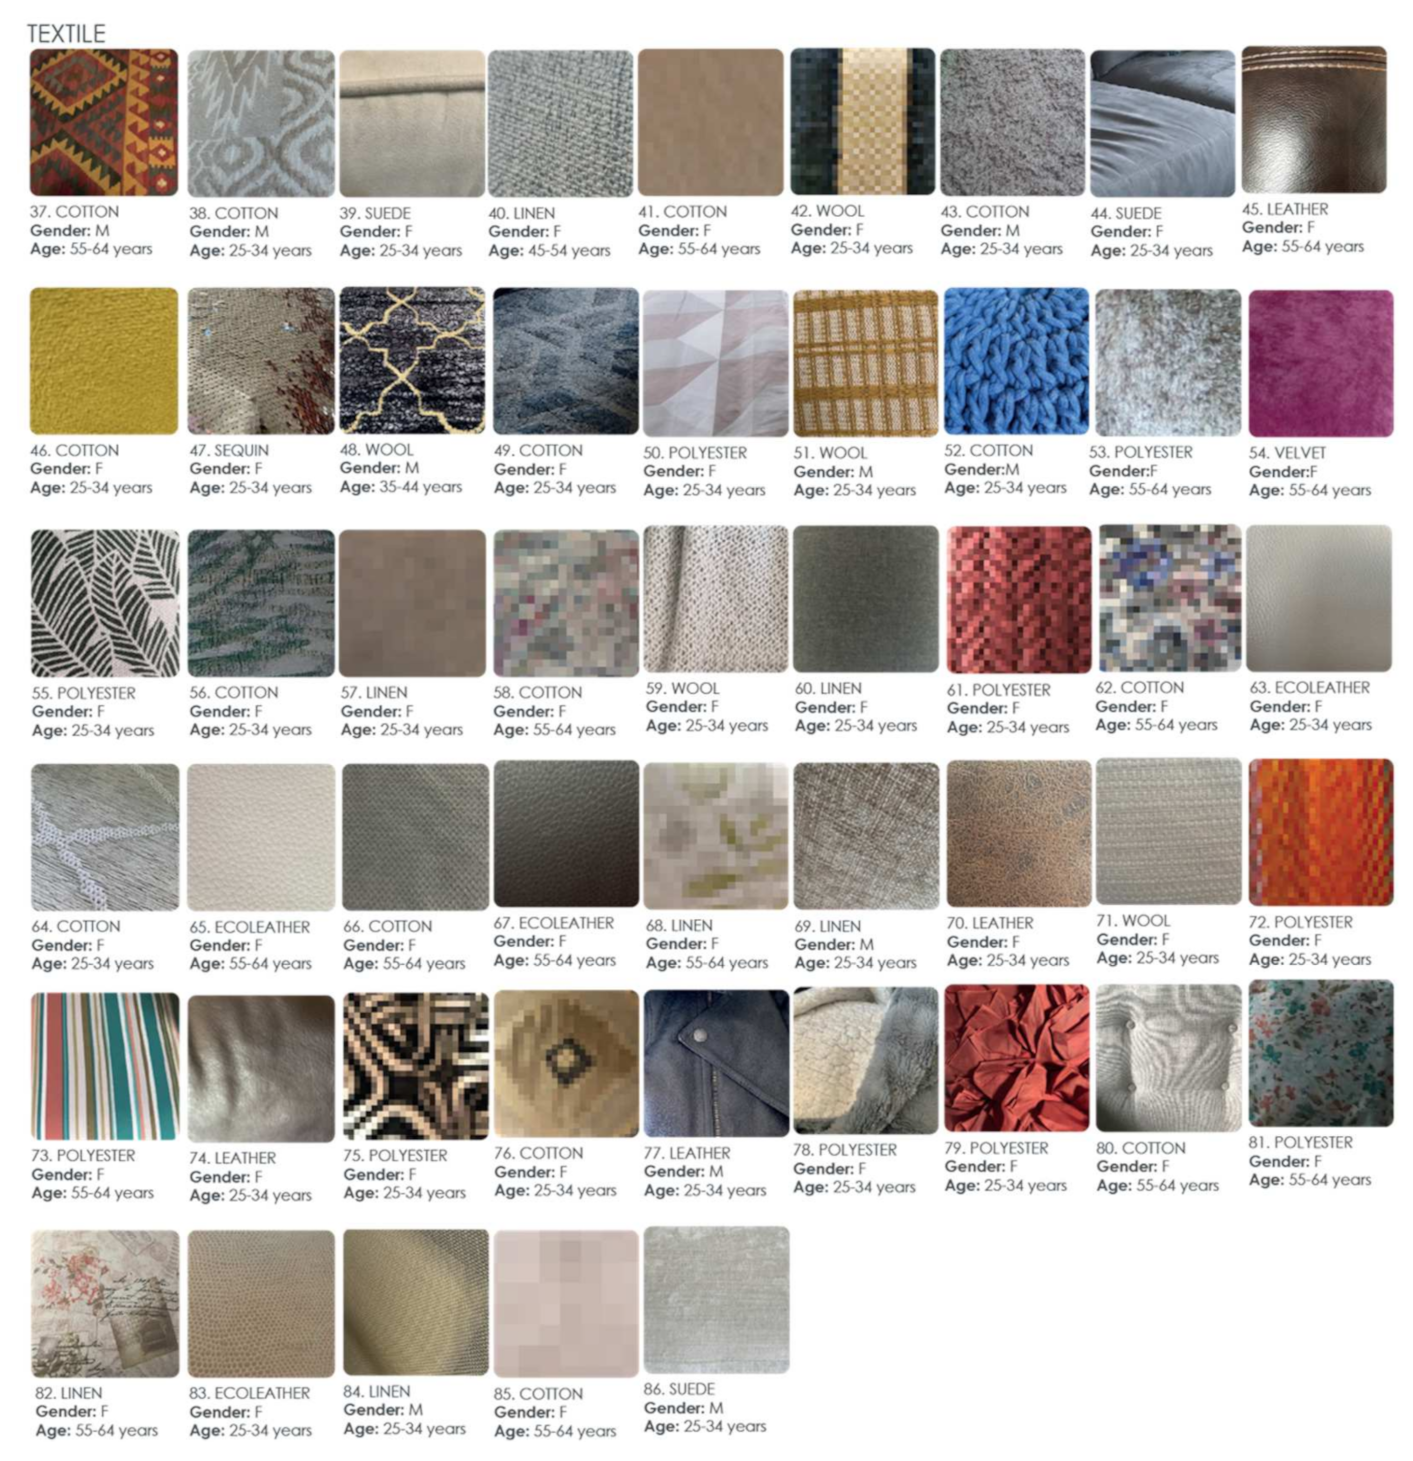
The most popular textile among respondents is cotton, followed by polyester, with velvet being the least popular (Figure 16A). In wood, the most popular among respondents is mahogany, followed by walnut and leaving parotta in last place (Figure 16B).
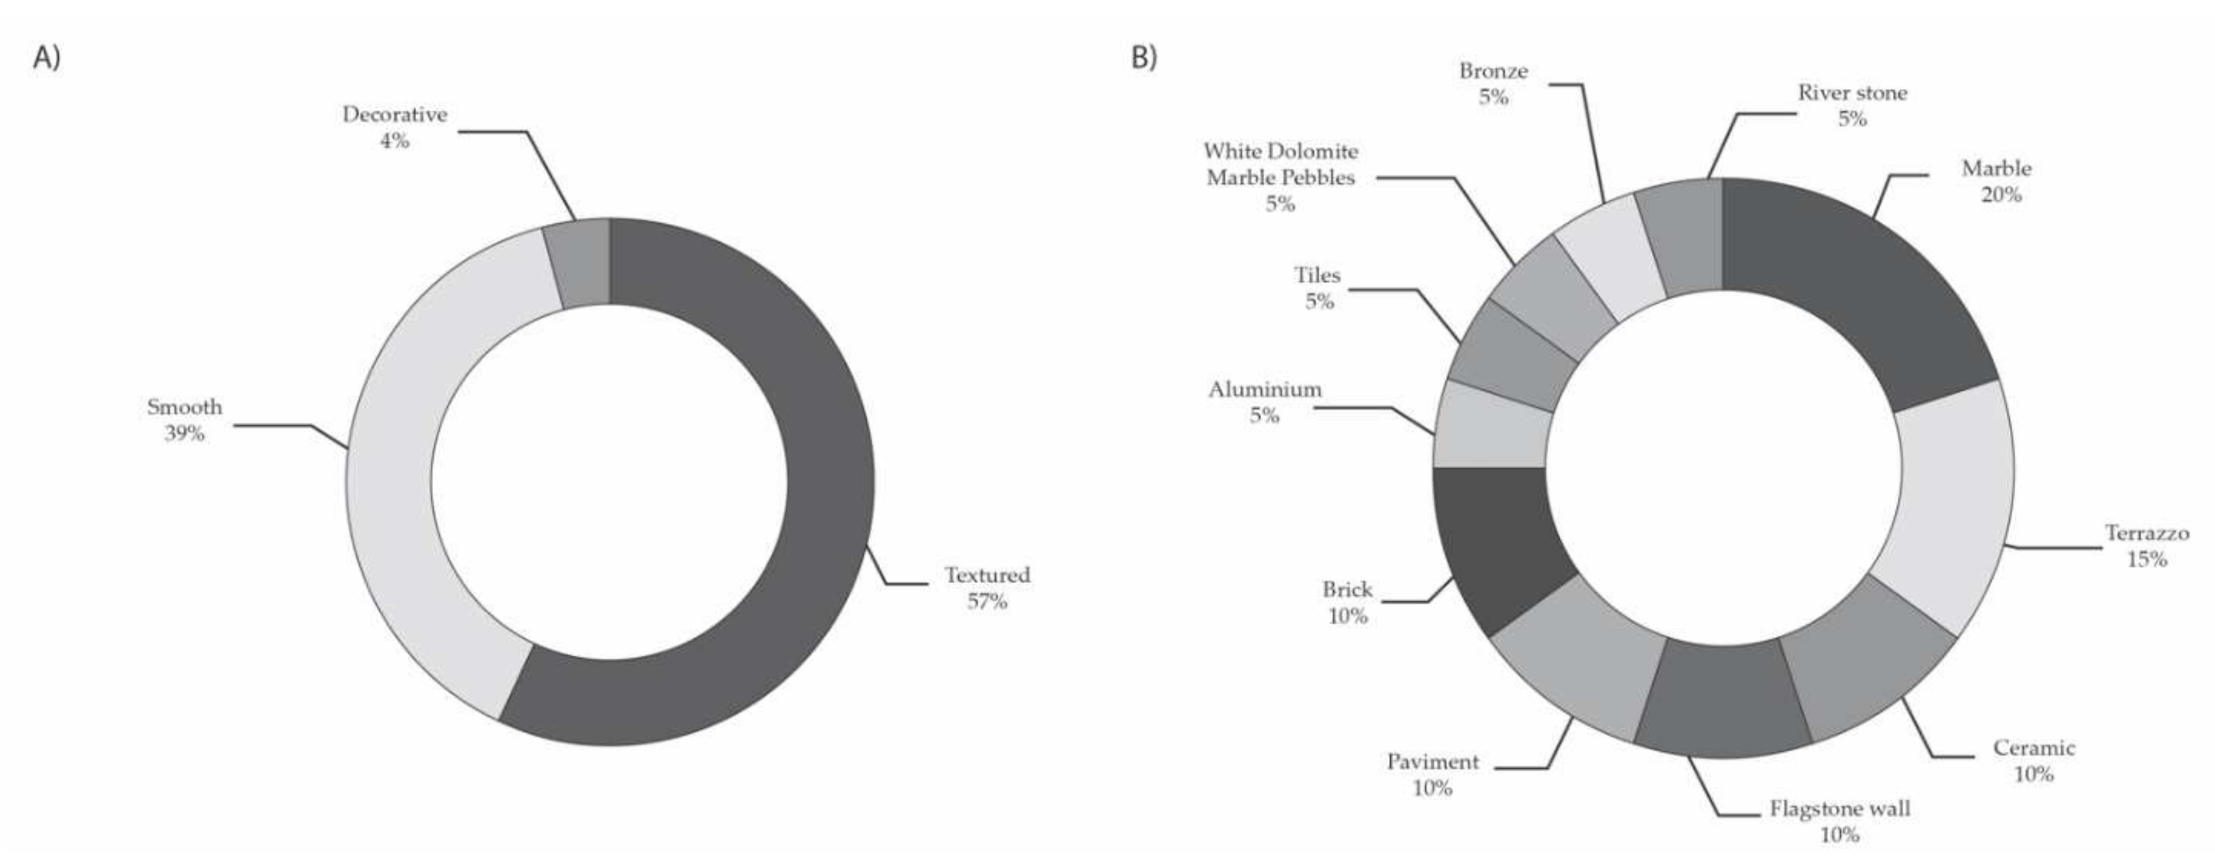
As for the type of paint, considered primarily as the color or texture of the walls, the most common according to the respondents is textured paint, followed by smooth paint and finally decorative paint (Figure 17A). The most popular stone among respondents is marble, followed by terrazzo and ceramic, and finally river stone (Figure 17B).
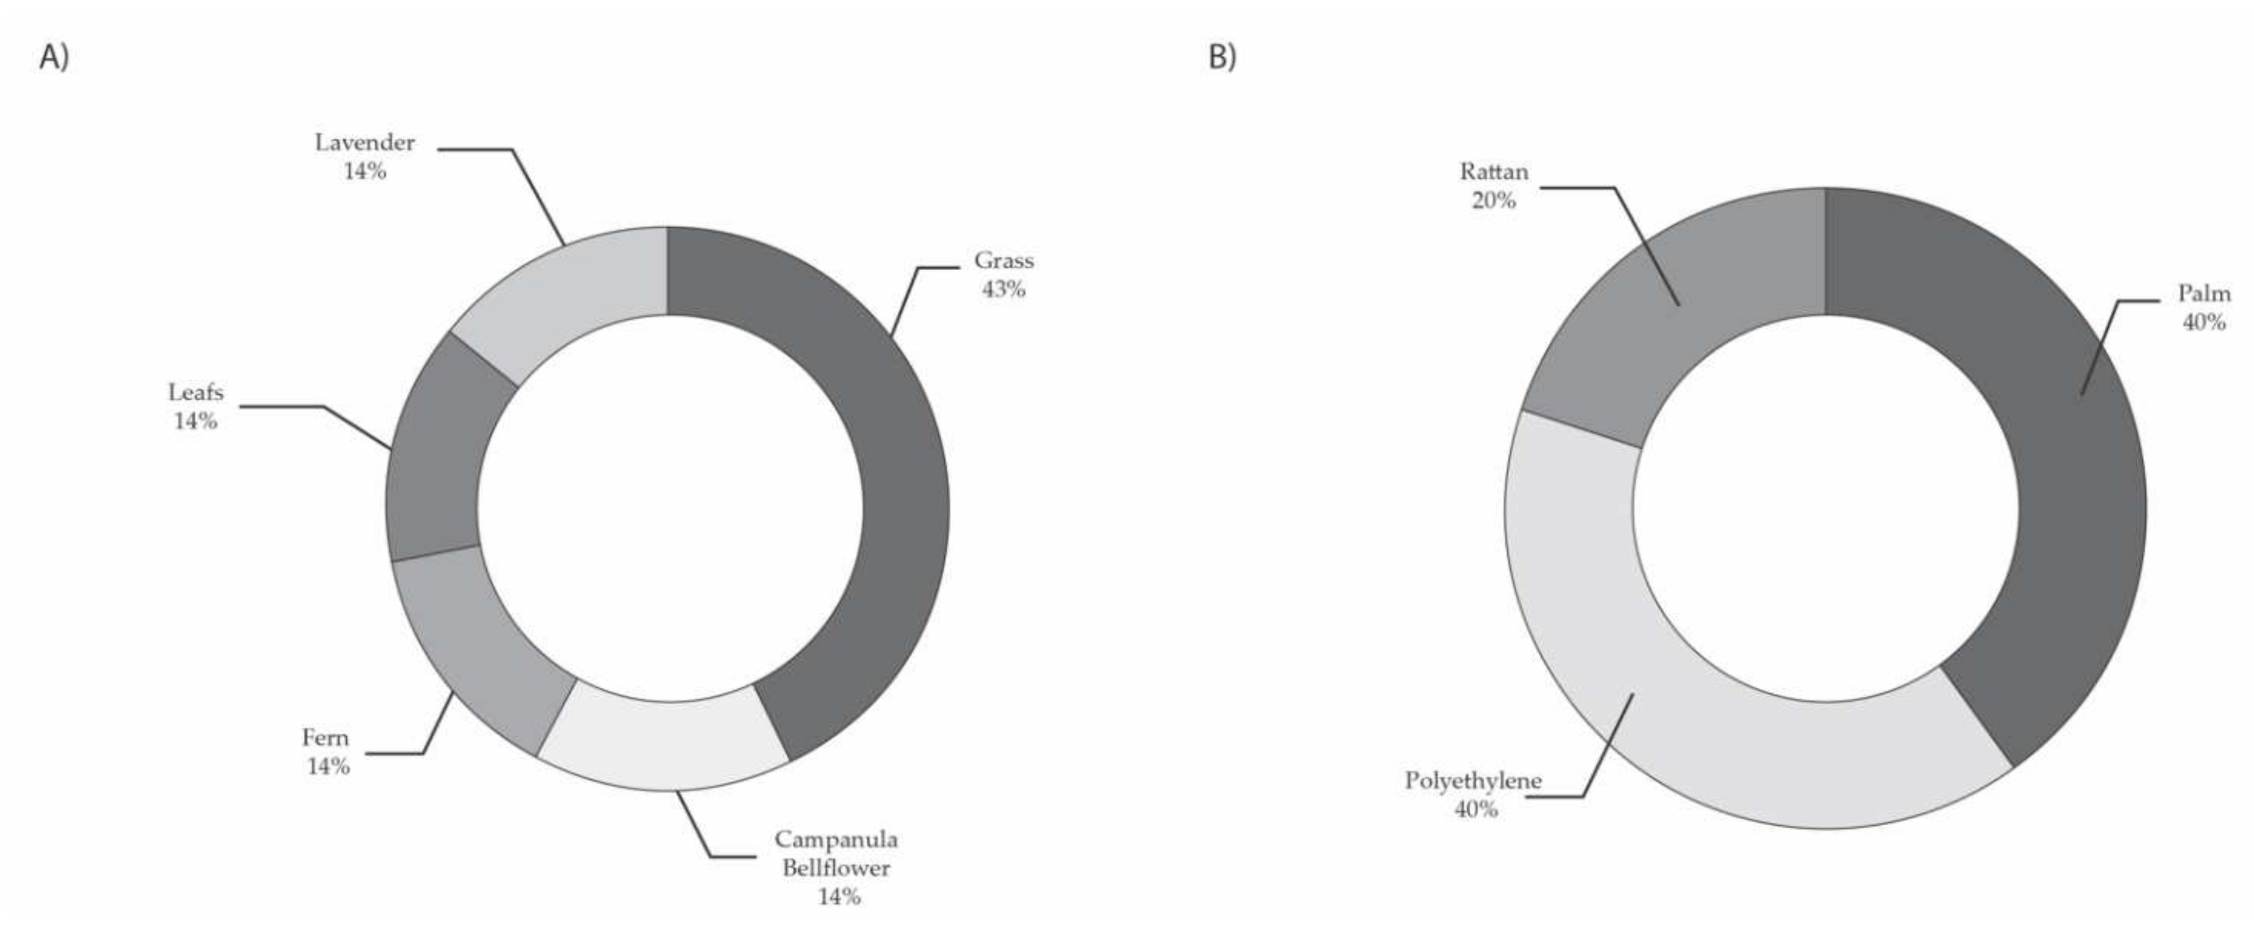
In Figure 18A, we can see that the most common plant among respondents is grass, followed by bluebell. In Figure 18B, we can see that, in the lattice category, the most common textures among respondents are palm, polyethylene and rattan.
In Figure 19, a selection of the images of textile textures submitted by the respondents can be seen more clearly.
5.4. Objects Circle Results
The circle of objects (Figure 11) is divided into eight sections according to the space in which the objects are used. These sections are collection, wall, gardening, living room, technology, decoration, kitchen and, finally, exercise.
The first four most repeated groups of objects are: collection, wall, gardening and living room. Within the collection section there are seven subgroups. These are fans, beer jars, candles, animals, boxes, figurines, and books. In the wall section we have altar, mirrors, pictures, and photos. In gardening objects, we have vases, flower vases and flowerpots. In living room objects we have cushions, lamps, coat racks and rugs.
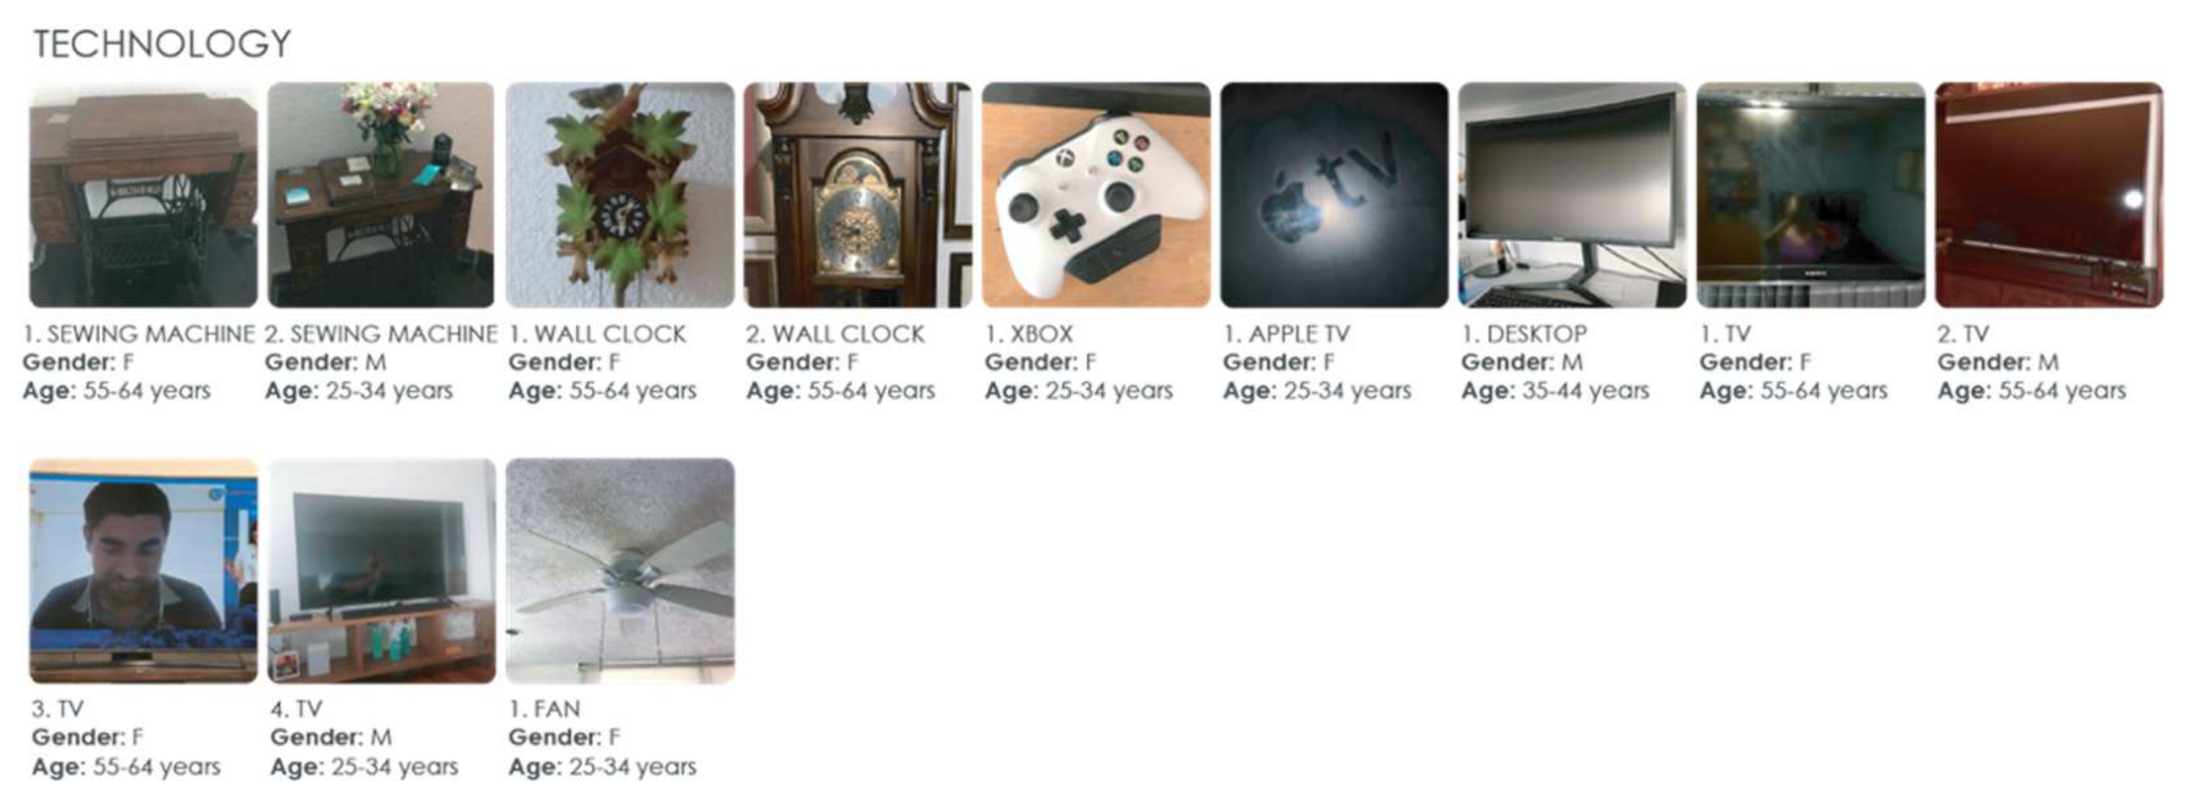
The next most popular items sections are technology, decoration, kitchen, and exercise. If we talk about technology objects, we have sewing machines, watches, Xbox, Apple TV, computers and TV. In the decoration section the objects sent by the respondents were: ashtrays, table centerpieces, baskets, and candlesticks. In the kitchen items section, we found gravy boats and mugs. And finally, we have the group of exercise objects, where we found ropes and dumbbells.
When asked how happy the objects make them, women aged 25–34 averaged 9.4 points versus 8.8 points for men of the same age. Women aged 35–44 scored them 9.0, while men of the same age scored them 8.5 points. Finally, in the 55–64 age range women rated them with 9.5 points and men with 9.8.
In Figure 20, a selection of the images of the technology objects submitted by the respondents can be seen more clearly.
5.5. Furniture and Equipment Circle Results
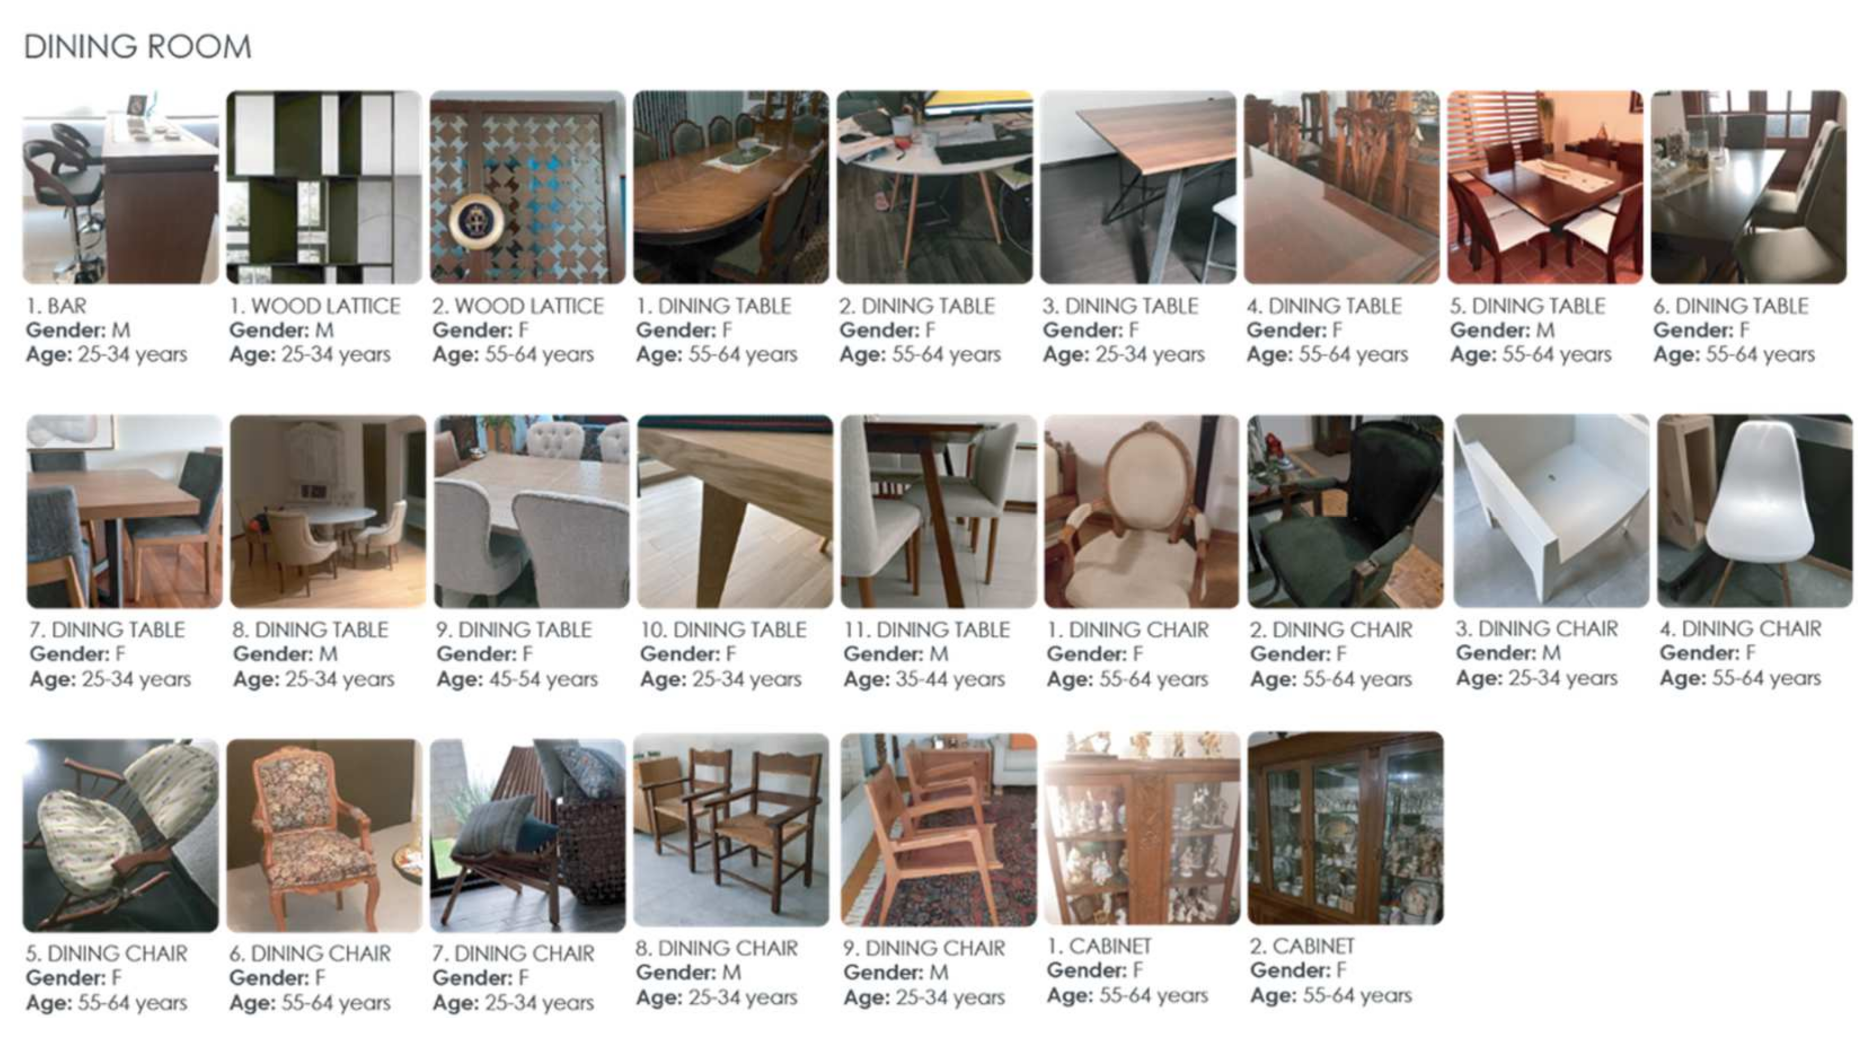
In the living room furniture and equipment section, respondents submitted photographs that can be organized into 12 subgroups: fireplaces, credenzas, bookcases, bookcases, rocking chairs, hall tables, side tables, TV furniture, staircases, corner tables, coffee tables, armchairs, and sofas. In the dining room furniture and equipment section, they sent canteens, lattices, dining tables, chairs, and display cabinets. From the bedroom furniture and equipment section, they sent bureaus, beds, desks, washbasins, and shoe racks. In terrace furniture and equipment: hammocks, picnic tables, Acapulco chairs and rattan chairs. Kitchen furniture and equipment: benches, stoves, and refrigerators. Finally, from the entrance furniture and equipment they sent doors.
Women aged 25 to 34 were very happy with the furniture and equipment they chose, scoring it 9.1, slightly less than men of the same age, who gave it 9.6 points. Men and women aged between 35 and 44 value their furniture and equipment more highly, with women giving it 9.8 points out of 10 and men 9.7 points. While men and women aged 45 to 54 rate it almost one point lower, 9.0 points. Finally, in the 55–64 age range, women and men obtained the same average of 9.3. It should be noted that, during lockdown time, the elements most appreciated by the respondents were those located in the living room and especially the furniture dedicated to rest such as armchairs, beds, hammocks, etc.
In Figure 21, we can see a selection of images of the dining room furniture and equipment sent by respondents.
5.6. General Results
When reviewing the topic from before the pandemic and the lockdowns, we observe that, although there are variations in preferences, these are not very significant, as can be seen in Table 6.
Pre-pandemic years (2016, 2017 and 2019) and pandemic years (2020 and 2021) maintain similar trends. During these periods, the most appreciated by Mexicans were light colors, wood, and natural elements. Year 2018, on the other hand, was a year in which the most sought after was an industrial style with materials such as concrete or steel with darker colors. The main differences between pre-pandemic years and pandemic years with a similar trend are as follows: In terms of color, respondents in the pandemic years selected light and neutral tones, while in previous years, in addition to neutral tones, some more intense colors were always chosen (turquoise, saffron, vibrant pink or olive green). There is more difference in textures. People chose natural textiles and woods (cotton, linen, wool, walnut, poplar, etc.) during the pandemic, while in previous years prints predominated, geometric in 2016 and 2017, and floral and botanical in 2019. This shows a tendency towards material sincerity and natural elements. As for the objects, in the pre-pandemic years, decorative elements of golden material without clear functionality were chosen. During the pandemic, objects were chosen regardless of their materiality. They were objects with which the respondents created an emotional relationship, either with the objects themselves (collections) or because they allow them to connect with other people (technology). Trends in furniture coincide at both times. Respondents preferred light natural wood furniture with light colors.
After this, it can be thought that the options chosen around color, textures and objects may be more variable over the years because it is cheaper to make changes in these aspects. While the changes in terms of furniture and equipment are more expensive and therefore more difficult to change. Likewise, before the pandemic there was already a natural trend with light colors, so it is likely that respondents focused their answers influenced by this trend. Despite this, it is clear that during the time of the pandemic this trend was even more emphasized, seeking a neutrality without stridency and without overloaded or stimulating elements.
6. Conclusions
When a pandemic caused by COVID-19 was declared in March 2020, it was never imagined that lockdowns could have such serious consequences for people’s mental health. The main consequences of lockdowns were loneliness, depression, and anxiety. Many of them originated because the interior spaces were not designed to perform different activities simultaneously. That is, they were not designed for people to be happy, causing negative emotions. Design of interior spaces of many homes has been forgotten in recent years because people spent little time in them. With COVID-19 lockdowns, people have been spending much more time at home and have realized that this situation has caused them psychological problems. Because of that, it is recommended that users return to paying attention to the design of the interior spaces of their homes.
With this work we found the preferences that a certain confined population had in terms of color, textures, objects, furniture and equipment in their interior spaces. However, more importantly, we found how much their spaces affect their mood. For this purpose, we used research methods and tools inherited from marketing discipline. This multidisciplinary approach helped to obtain more reliable data on qualitative aspects that are difficult to evaluate from disciplines linked to the design of built environments.
Note that there is no standard solution to this problem. However, the trends found in this work open a field of exploration towards the improvement of interior spaces through neutral colors, natural materials (cotton and wood) and objects with which emotional relationships are created, either with the objects (collections) or because they allow you to connect with other people (technology).
This research project is only the first step in the discussion of the topic addressed. Preliminary results suggest the importance of continuing research addressing the following issues. Increase the sample by emphasizing vulnerable populations during lockdowns; refine the survey to obtain more reliable data; establish comparisons between moments of confinement and moments without confinement.
The element that generates more positive emotions in respondents within studied concepts – color, textures, objects, furniture and equipment – is texture, especially soft textiles such as cotton, polyester, linen, and wool. It was also found that woods make men happier, although woods such as walnut, poplar and ebony are more appreciated by women. As for the colors that create positive emotions in the people surveyed, we found beige, brown and gray. This can also be seen by looking at the images of textiles, as most of them are in these hues. This is no coincidence, since within the colors that make the surveyed population happiest are the same hues, gray, brown, white, blue, and beige. Within the word cloud, respondents defined these colors with words such as, brightens, pleases, and calms, desirable feelings during the pandemic period.
Objects are also an important factor in people’s mental health during lockdown. Objects were found to be more important for women at all ages, although it is notable that for men aged 55 to 64 years, they are also valuable items. Most of these objects fall into the collectibles and technology classification. However, it should be considered that collectibles are very significant and undoubtedly create positive emotions in people.
Within furniture and equipment, the most appreciated subgroup among respondents was living room furniture and equipment. Sofas and armchairs are the most representative within this subgroup, mostly in beige, gray or blue, the colors that make respondents the happiest.
The interior spaces where people feel more comfortable are the bedroom, the TV room, and the living room, referring to the fact that these are areas where people spend more time during a lockdown, spaces of coexistence with their family, partner or friends that normally generate positive emotions and sensations.
This study sought to integrate the topics of COVID-19, mental health, and the design of indoor environments under the same perspective, since no study was found that united these concepts. When talking about interior environments, the importance of colors, textures, objects, or furniture is often not explained, nor is the effect they can have on the mental health of the people who occupy these spaces considered. It was found that interior environments can be created for positive mental health by integrating elements of easy handling for the users of these environments, so that this research is not only of interest within the disciplinary field but could be of great use to anyone who requires an improvement of the environment in which they live. The colors, textures, objects, and furniture and equipment that surround us in our daily lives affect people’s daily lives since being in a properly designed indoor environment for a long time can produce positive emotions and this, undoubtedly, helps people’s mental health.
Author Contributions
Conceptualization, L.M.L. and A.B.F.D.; methodology, L.M.L. and A.B.F.D.; formal analysis, A.B.F.D.; investigation, A.B.F.D.; data curation, A.B.F.D.; writing—original draft preparation, L.M.L. and A.B.F.D.; writing—review and editing, L.M.L. and A.B.F.D.; visualization, A.B.F.D. All authors have read and agreed to the published version of the manuscript.
Funding
This research received no external funding.
Institutional Review Board Statement
Ethical review and approval were waived for this study due to all necessary participant consent has been obtained, the forms have been archived, and that any participant/sample identifiers included were not known to anyone outside the research group so cannot be used to identify individuals.
Informed Consent Statement
Informed consent was obtained from all subjects involved in the study.
Data Availability Statement
The study did not report any data.
Conflicts of Interest
The authors declare no conflict of interest.
References
- Johns Hopkins University & Medicine. Coronavirus Resource Center. COVID-19 Data in Motion. Available online: https://coronavirus.jhu.edu/ (accessed on 15 November 2020).
- Rajkumar, R.P. COVID-19 and mental health: A review of the existing literature. Asian J. Psychiatry 2020, 52, 102066. [Google Scholar] [CrossRef] [PubMed]
- Brooks, S.K.; Webster, R.K.; Smith, L.E.; Woodland, L.; Wessely, S.; Greenberg, N.; Rubin, G.J. The psychological impact of quarantine and how to reduce it: Rapid review of the evidence. Lancet 2020, 395, 912–920. [Google Scholar] [CrossRef] [Green Version]
- Jacques-Aviñó, C.; López-Jiménez, T.; Medina-Perucha, L.; Bont, J.; Queiroga Gonçalves, A.; Duarte-Salles, T.; Berenguera, A. Gender-based approach on the social impact and mental health in Spain during COVID-19 lockdown: A cross-sectional study. BMJ Open 2020, 10, e044617. [Google Scholar] [CrossRef] [PubMed]
- Rosenberg, M.; Luetke, M.; Hensel, D.; Kianersi, S.; Fu, T.; Herbenick, D. Depression and loneliness during COVID-19 restrictions in the United States, and their associations with frequency of social and sexual connections. medRxiv 2020. [Google Scholar] [CrossRef]
- González Ramírez, L.P.; Martínez Arriaga, R.J.; Hernández-González, M.A.; De la Roca-Chiapas, J.M. Psychological Distress and Signs of Post-Traumatic Stress in Response to the COVID-19 Health Emergency in a Mexican Sample. Psychol. Res. Behav. Manag. 2020, 13, 589–597. [Google Scholar] [CrossRef]
- Tokazhanov, G.; Tleuken, A.; Guney, M.; Turkyilmaz, A.; Karaca, F. How is COVID-19 Experience Transforming Sustainability Requirements of Residential Buildings? A Review. Sustainability 2020, 12, 8732. [Google Scholar] [CrossRef]
- Koozarch. Homescape: The New Commute Superstructure Home-Office. Available online: https://www.koozarch.com/abstractions/superstructure-home-office/ (accessed on 15 November 2020).
- Carrasco Mahr, B.M. Programa de la Asignatura Selectiva: Neuroarquitectura; Universidad Autónoma Metropolitana: Xochimilco, Mexico, 2020. [Google Scholar]
- Lewin, K. Field Theory in Social Science: Selected Theoretical Papers; Harper and Row: New York, NY, USA, 1964. [Google Scholar]
- Whittaker, J. La Psicología Social en el Mundo de Hoy; Editorial Trillas: Ciudad de México, Mexico, 2006. [Google Scholar]
- Fleury-Bahi, G.; Pol, E.; Navarro, O. (Eds.) Handbook of Environmental Psychology and Quality of Life Research; International Handbooks of Quality-of-Life Book Series; Springer: Cham, Switzerland, 2017. [Google Scholar] [CrossRef]
- Cotton, D. Stress Management: An Integrated Approach to Therapy; Brunnel/Mazel Inc.: New York, NY, USA, 1990. [Google Scholar]
- Lotito Catino, F. Arquitectura psicología espacio e individuo. AUS Arquit. Urban. Sustentabilidad 2017, 6, 12–17. [Google Scholar] [CrossRef]
- Zarrabi, M.; Yazdanfar, S.A.; Hosseini, S.B. COVID-19 and healthy home preferences: The case of apartment residents in Tehran. J. Build. Eng. 2021, 35, 102021. [Google Scholar] [CrossRef]
- Lee, S. Subjective Well-being and Mental Health During the Pandemic Outbreak: Exploring the Role of Institutional Trust. Res. Aging 2022, 44, 10–21. [Google Scholar] [CrossRef]
- White, M.P.; Alcock, I.; Grellier, J.; Wheeler, B.W.; Hartig, T.; Warber, S.L.; Bone, A.; Depledge, M.H.; Fleming, L.E. Spending at least 120 minutes a week in nature is associated with good health and wellbeing. Sci. Rep. 2019, 9, 7730. [Google Scholar] [CrossRef] [Green Version]
- Zhang, J.W.; Piff, P.K.; Iyer, R.; Koleva, S.; Keltner, D. An occasion for unselfing: Beautiful nature leads to prosociality. J. Environ. Psychol. 2014, 37, 61–72. [Google Scholar] [CrossRef]
- Konis, K.; Mack, W.J.; Schneider, E.L. Pilot study to examine the effects of indoor daylight exposure on depression and other neuropsychiatric symptoms in people living with dementia in long-term care communities. Clin. Interv. Aging 2018, 13, 1071–1077. [Google Scholar] [CrossRef] [PubMed] [Green Version]
- Lam, R.W.; Levitt, A.J.; Levitan, R.D.; Michalak, E.E.; Cheung, A.H.; Morehouse, R.; Ramasubbu, R.; Yatham, L.N.; Tam, E.M. Efficacy of Bright Light Treatment, Fluoxetine, and the Combination in Patients with Nonseasonal Major Depressive Disorder: A Randomized Clinical Trial. JAMA Psychiatry 2016, 73, 56–63. [Google Scholar] [CrossRef]
- Perera, S.; Eisen, R.; Bhatt, M.; Bhatnagar, N.; De Souza, R.; Thabane, L.; Samaan, Z. Light therapy for non-seasonal depression: Systematic review and meta-analysis. BJPsych Open 2016, 2, 116–126. [Google Scholar] [CrossRef] [Green Version]
- Poldma, T. Learning the Dynamic Processes of Color and Light in Interior Design. J. Inter. Des. 2009, 34, 19–33. [Google Scholar] [CrossRef]
- Ulrich, R.S.; Simons, R.F.; Losito, B.D.; Fiorito, E.; Miles, M.A.; Zelson, M. Stress recovery during exposure to natural and urban environments. J. Environ. Psychol. 1991, 11, 201–230. [Google Scholar] [CrossRef]
- Schauss, A.G. The Physiological Effect of Color on the Suppression of Human Aggression: Research on Baker-Miller Pink. J. Biosoc. Res. 1985, 7, 55–64. [Google Scholar]
- Hiremath, P.; Kowshik, C.S.S.; Manjunath, M.; Shettar, M. COVID 19: Impact of lock-down on mental health and tips to overcome. Asian J. Psychiatry 2020, 51, 102088. [Google Scholar] [CrossRef]
- Dawson, D.L.; Golijani-Moghaddam, N. COVID-19: Psychological flexibility, coping, mental health, and wellbeing in the UK during the pandemic. J. Contextual Behav. Sci. 2020, 17, 126–134. [Google Scholar] [CrossRef]
- Le, K.; Nguyen, M. The psychological consequences of COVID-19 lockdowns. Int. Rev. Appl. Econ. 2021, 35, 147–163. [Google Scholar] [CrossRef]
- Vatavali, F.; Gareiou, Z.; Kehagia, F.; Zervas, E. Impact of COVID-19 on Urban Everyday Life in Greece. Perceptions, Experiences and Practices of the Active Population. Sustainability 2020, 12, 9410. [Google Scholar] [CrossRef]
- Amerio, A.; Brambilla, A.; Morganti, A.; Aguglia, A.; Bianchi, D.; Santi, F.; Costantini, L.; Odone, A.; Costanza, A.; Signorelli, C.; et al. COVID-19 Lockdown: Housing Built Environment’s Effects on Mental Health. Int. J. Environ. Res. Public Health 2020, 17, 5973. [Google Scholar] [CrossRef] [PubMed]
- Cheshmehzangi, A. Housing and health evaluation related to general comfort and indoor thermal comfort satisfaction during the COVID-19 lockdown. J. Hum. Behav. Soc. Environ. 2021, 31, 5. [Google Scholar] [CrossRef]
- Losada-Baltar, A.; Márquez-González, M.; Jiménez-Gonzalo, L.; Pedroso-Chaparro, M.S.; Gallego-Alberto, L.; Fernandes-Pires, J. Diferencias en función de la edad y la autopercepción del envejecimiento en ansiedad, tristeza, soledad y sintomatología comórbida ansioso-depresiva durante el confinamiento por la COVID-19. Rev. Esp. Geriatr. Gerontol. 2020, 55, 272–278. [Google Scholar] [CrossRef] [PubMed]
- Poursafar, Z.; Rama Devi, N.; Raj Rodrigues, L.L. Evaluation of color and lighting preferences in architects’ offices for enhancing productivity. Int. J. Curr. Res. Rev. 2016, 8, 1–6. [Google Scholar]
- Han, S.; Lee, D. The effects of treatment room lighting color on time perception and emotion. J. Phys. Ther. Sci. 2017, 29, 1247–1249. [Google Scholar] [CrossRef] [Green Version]
- Cervio, A. En Cuarentena, en Casa. Prácticas y Emociones Durante el Aislamiento Social, Preventivo y Obligatorio por COVID-19 en Hogares Urbanos de Argentina; CONICET, CICLOP-UBA, CIES: Buenos Aires, Argentina, 2020. [Google Scholar]
- Lee, S.J.; Ward, K.P.; Chang, O.D.; Downing, K.M. Parenting activities and the transition to home-based education during the COVID-19 pandemic. Child. Youth Serv. Rev. 2021, 122, 105585. [Google Scholar] [CrossRef]
- Giorgi, E.; Martín López, L.; Garnica-Monroy, R.; Krstikj, A.; Cobreros, C.; Montoya, M. Co-Housing Response to Social Isolation of COVID-19 Outbreak, with a Focus on Gender Implications. Sustainability 2021, 13, 7203. [Google Scholar] [CrossRef]
- Iterando Developers. Tendencias en Interiorismo 2016/2017. GirlPower. Available online: https://soygirlpower.com/tendencias-interiorismo/ (accessed on 16 January 2022).
- Del Olmo, J. El color como elemento comunicacional. Comun. Rev. Cient. Comun. Educ. 2006, 26, 111–116. [Google Scholar]
- Jonauskaite, D.; Dael, N.; Chèvre, L.; Althaus, B.; Tremea, A.; Charalambides, L.; Mohr, C. Pink for Girls, Red for Boys, and Blue for Both Genders: Colour Preferences in Children and Adults. Sex Roles 2019, 80, 630–642. [Google Scholar] [CrossRef] [Green Version]
- Cano, V. La Tendencia del Mes: Decoración Mexicana. Grupo SAR. Available online: https://gruposar.com/blogs/diseno/la-tendencia-del-mes-decoracion-mexicana (accessed on 16 January 2022).
- Forbes Staff. Las 5 Tendencias en Diseño de Interiores del 2018. Forbes México. Available online: https://www.forbes.com.mx/forbes-life/las-5-tendencias-en-diseno-de-interiores-del-2018/ (accessed on 16 January 2022).
- Redacción Paredro. 5 Tendencias de Diseño de Interiores y Muebles en 2018. Paredro. Available online: https://www.paredro.com/161851-5-tendencias-de-diseno-de-interiores-en-2018/ (accessed on 16 January 2022).
- Allen, I.; Seaman, C. Statistics Roundtable: Likert Scales and Data Analyses. Qual. Prog. 2007, 40, 64–65. [Google Scholar]
- Burns, A.C.; Bush, R.F. Basic Marketing Research Using Microsoft Excel Data Analysis, 2nd ed.; Pearson Education: London, UK, 2008. [Google Scholar]
- Coelho, P.S.; Esteves, S.P. The choice between a five-point and a ten-point scale in the framework of customer satisfaction measurement. Int. J. Mark. Res. 2007, 49, 313–339. [Google Scholar] [CrossRef]
- Instituto Nacional de Estadística y Geografía (INEGI). Censo de Población y Vivienda. Available online: https://www.inegi.org.mx/programas/ccpv/2020/#Resultados_generales (accessed on 6 March 2021).
- Observatorio Laboral. Estadísticas de Carreras Profesionales por Área. Artes. Available online: https://www.observatoriolaboral.gob.mx/static/estudios-publicaciones/Artes.html (accessed on 6 March 2021).
Figure 1.
Main psychological problems during COVID-19 lockdowns. (A) China [2]; (B) United Kingdom [3]; (C) Spain [4]; (D) USA [5]; (E) Mexico [6]. Own elaboration from the data of the texts [2,3,4,5,6], 2021.

Figure 2.
Survey “Perception of interior design spaces of houses during the period of lockdown by COVID-19”. Own elaboration, 2021.
Figure 2.
Survey “Perception of interior design spaces of houses during the period of lockdown by COVID-19”. Own elaboration, 2021.

Figure 3.
Yellow and orange word clouds. The first part of the graph indicates the RGB code of each hue (a). RGB code is the color composition in terms of primary colors light intensity. The next part of the graph shows color hues that people shared in the survey (b). The third part of the graph illustrates the color with a representative image (c). Own elaboration, 2021.

Figure 4.
Word cloud parts:Cloud and Most repeated words. Own elaboration, 2021.

Figure 5.
Word cloud parts (A) Gender; (B) Range of age; (C) Number of responses; (D) How happy does it make you? Own elaboration, 2021.
Figure 5.
Word cloud parts (A) Gender; (B) Range of age; (C) Number of responses; (D) How happy does it make you? Own elaboration, 2021.

Figure 6.
Chromatic Circle parts: (A) RGB Code; (B) Range of Age; (C) Gender; (D) Colors; (E) How happy does that color makes you? (F) 12 Color hues. Own elaboration, 2021.
Figure 6.
Chromatic Circle parts: (A) RGB Code; (B) Range of Age; (C) Gender; (D) Colors; (E) How happy does that color makes you? (F) 12 Color hues. Own elaboration, 2021.

Figure 7.
Chromatic circle. Own elaboration, 2021.

Figure 8.
Parts of the Texture Circle (A) Range of age. (B) Gender. (C) Texture images. (D) How happy does that texture makes you? (E) Type of textures. Own elaboration, 2021.
Figure 8.
Parts of the Texture Circle (A) Range of age. (B) Gender. (C) Texture images. (D) How happy does that texture makes you? (E) Type of textures. Own elaboration, 2021.

Figure 9.
Texture Circle. Own elaboration, 2021.

Figure 10.
Parts of the Objects Circle (A) Type of objects (B) Range of age. (C) Gender. (D) Objects images. (E) How happy does that object makes you? (F) Objects classification. Own elaboration, 2021.
Figure 10.
Parts of the Objects Circle (A) Type of objects (B) Range of age. (C) Gender. (D) Objects images. (E) How happy does that object makes you? (F) Objects classification. Own elaboration, 2021.

Figure 11.
Objects Circle. Own elaboration, 2021.

Figure 12.
Parts of the Furniture and Equipment Circle. (A) Type of furniture and equipment. (B) Range of age. (C) Gender. (D) Objects images. (E) How happy does that furniture and equipment make you? (F) Type of furniture and equipment. Own elaboration, 2021.
Figure 12.
Parts of the Furniture and Equipment Circle. (A) Type of furniture and equipment. (B) Range of age. (C) Gender. (D) Objects images. (E) How happy does that furniture and equipment make you? (F) Type of furniture and equipment. Own elaboration, 2021.

Figure 13.
Furniture and Equipment Circle. Own elaboration, 2021.

Figure 14.
(A) Gender and range age of the respondents. (B) Who do you live with during lockdown? Own elaboration, 2021.
Figure 14.
(A) Gender and range age of the respondents. (B) Who do you live with during lockdown? Own elaboration, 2021.

Figure 15.
(A) In which spaces of your house do you feel more comfortable? (B) In which spaces of your house do you feel more uncomfortable? Own elaboration, 2021.
Figure 15.
(A) In which spaces of your house do you feel more comfortable? (B) In which spaces of your house do you feel more uncomfortable? Own elaboration, 2021.

Figure 16.
(A) Most popular textiles. (B) Most popular woods. Own elaboration, 2021.

Figure 17.
(A) Most popular paint. (B) Most popular stones. Own elaboration, 2021.

Figure 18.
(A) Most popular plants. (B) Most popular framework. Own elaboration, 2021.

Figure 19.
Selection of photographs of textiles submitted by respondents. Own elaboration, 2021.

Figure 20.
Selection of photographs of technology objects submitted by respondents. Own elaboration, 2021.
Figure 20.
Selection of photographs of technology objects submitted by respondents. Own elaboration, 2021.

Figure 21.
Selection of photographs of dining room furniture and equipment submitted by respondents. Own elaboration, 2021.
Figure 21.
Selection of photographs of dining room furniture and equipment submitted by respondents. Own elaboration, 2021.


Table 1.
Table of retrieved texts for current investigation. Topics of interest: (1) lockdown; (2) mental health and COVID-19; (3) anxiety and COVID-19; (4) depression and COVID-19; (5) stress and COVID-19; (6) loneliness and COVID-19; (7) flexibility, architecture, and COVID-19; (8) daily routine, architecture, and COVID-19; (9) home office and COVID-19; (10) color and architecture; (11) textures and architecture; (12) furniture and architecture; (13) objects and architecture; (14) environmental health and architecture. Own elaboration, 2021.
| Title | Year | Keywords | Topics | Impact | Reference |
|---|---|---|---|---|---|
| COVID-19 and healthy home preferences: The case of apartment residents in Tehran | 2021 | Architecture, interior spaces, lockdown, COVID-19 | 1; 7; 8; 9 | Q1 | [15] |
| Co-Housing Response to Social Isolation of COVID-19 Outbreak, with a Focus on Gender Implications | 2021 | COVID-19, enviromental health, anxiety, depression | 1; 3; 4; 5; 6; 7; 8; 9 | Q1 | [12] |
| Loneliness in the UK during the COVID-19 pandemic: Cross-sectional results from the COVID-19 Psychological Wellbeing Study | 2020 | Loneliness; COVID-19 | 1; 2; 6 | Q1 | [10] |
| The psychological impact of quarantine and how to reduce it: Rapid review of the evidence. | 2020 | Lockdown, COVID-19, mental health | 1; 2; 3; 4; 5; 6 | Q1 | [3] |
| Gender-based approach on the social impact and mental health in Spain during COVID-19 lockdown: a cross-sectional study | 2020 | Lockdown, COVID-19, mental health | 1; 2; 3; 4; 5; 6 | Q1 | [4] |
| Subjective Well-being and Mental Health During the Pandemic Outbreak: Exploring the Role of Institutional Trust | 2022 | pandemic, material and financial difficulty, subjective well-being, mental health, institutional trust, Europe | 1; 2; 3; 4; 5; 6 | Q1 | [16] |
| Parenting activities and the transition to home-based education during the COVID-19 pandemic | 2020 | Lockdown, COVID-19, mental health, interior space | 1; 5; 7; 8; 9 | Q1 | [11] |
| Depression and loneliness during COVID-19 restrictions in the United States, and their associations with frequency of social and sexual connections | 2020 | Depression, loneliness, COVID-19 | 1; 4; 6 | Q1 | [5] |
| Spending at least 120 min a week in nature is associated with good health and wellbeing | 2019 | Mental health, enviromental health | 3; 4; 5; 6 | Q1 | [17] |
| An occasion for unselfing: Beautiful nature leads to prosociality. | 2014 | Nature, Positive emotions, Judgment of natures’ beauty, Generosity, Wellness, enviromental health | 3; 4; 5; 6 | Q1 | [18] |
| Pilot study to examine the effects of indoor daylight exposure on depression and other neuropsychiatric symptoms in people living with dementia in long-term care communities | 2018 | Depression, interior lighting | 3; 4; 5 | Q1 | [19] |
| Efficacy of Bright Light Treatment, Fluoxetine, and the Combination in Patients with Nonseasonal Major Depressive Disorder: A Randomized Clinical Trial | 2016 | Depression, interior lighting | 4 | Q1 | [20] |
| Light therapy for non-seasonal depression: systematic review and meta-analysis | 2016 | Depression, interior lighting | 4 | Q1 | [21] |
| Learning the Dynamic Processes of Color and Light in Interior Design | 2009 | Color, objects | 10; 13; 14 | Q1 | [22] |
| Stress recovery during exposure to natural and urban environments. | 1991 | Mental health, enviromental health | 3; 4; 5; 6 | Q1 | [23] |
| The Physiological Effect of Color on the Suppression of Human Aggression: Research on Baker-Miller Pink | 1985 | Color, Psychology | 10; 14 | Q1 | [24] |
| COVID-19 and mental health: A review of the existing literature | 2020 | COVID-19, mental health | 1; 3; 4; 5; 6 | Q2 | [2] |
| COVID 19: Impact of lock-down on mental health and tips to overcome | 2020 | COVID 19, Lockdown, Mental health, Anxiety | 1; 3; 4; 5; 6 | Q2 | [25] |
| COVID-19: Psychological flexibility, coping, mental health, and wellbeing in the UK during the pandemic | 2020 | COVID-19, mental health | 1; 3; 4; 5; 6 | Q2 | [26] |
| Psychological Distress and Signs of Post-Traumatic Stress in Response to the COVID-19 Health Emergency in a Mexican Sample | 2020 | COVID-19, Lockdown, Stress | 1; 3; 4; 5; 6 | Q2 | [6] |
| The psychological consequences of COVID-19 lockdowns | 2020 | Lockdown, COVID-19, mental health | 1; 3; 4; 5; 6 | Q2 | [27] |
| Impact of COVID-19 on Urban Everyday Life in Greece. Perceptions, Experiences and Practices of the Active Population | 2020 | COVID-19, Lockdown, outdoor spaces, Daily routine | 1; 7; 8; 9 | Q2 | [28] |
| How is COVID-19 Experience Transforming Sustainability Requirements of Residential Buildings? A Review | 2020 | COVID-19, architecture, lockdown, interior spaces | 1; 7; 8 | Q2 | [7] |
| COVID-19 Lockdown: Housing Built Environment’s Effects on Mental Health. | 2020 | COVID-19, lockdown, architecture, interior spaces | 1; 3; 4; 5; 6; 8 | Q2 | [29] |
| Housing and health evaluation related to general comfort and indoor thermal comfort satisfaction during the COVID-19 lockdown | 2020 | COVID-19, lockdown, architecture, interior spaces | 1; 7; 8 | Q2 | [30] |
| Diferencias en función de la edad y la autopercepción del envejecimiento en ansiedad, tristeza, soledad y sintomatología comórbida ansioso-depresiva durante el confinamiento por la COVID-19 | 2020 | Lockdown, COVID-19, mental health | 1; 3; 4; 5; 6 | Q3 | [31] |
| Evaluation of color and lighting preferences in architects offices for enhancing productivity | 2016 | Color, interior spaces, lighting | 10; 14 | Q4 | [32] |
| The effects of treatment room lighting color on time perception and emotion | 2017 | Color, lighting, mental health | 3; 4; 5; 6; 10; 14 | Scopus | [33] |
| En cuarentena, en casa. Prácticas y emociones durante el Aislamiento Social, Preventivo y Obligatorio por COVID-19 en hogares urbanos de Argentina | 2020 | COVID-19, lockdown, architecture, mental health, interior spaces | 1; 3; 4; 5; 6; 7; 8; 9; 11; 13 | Book | [34] |
| Handbook of Environmental Psychology and Quality of Life Research | 2017 | Enviromental health, architecture | 14 | Book | [12] |
Table 2.
Information Gathering from one feminine respondent between 45 and 54 years old on Colors and Textures. Own elaboration, 2021.
Table 2.
Information Gathering from one feminine respondent between 45 and 54 years old on Colors and Textures. Own elaboration, 2021.
| Gender | Age | With Whom You Live with | Favorites Colors | Why? | How Happy That Color Makes You | Favorites Textures | Why | How Happy That Texture Makes You |
|---|---|---|---|---|---|---|---|---|
| Femenine | 45–54 years | Family | Blue | It’s a colour that gives me peace and calm. Reminds me of heaven. | 10 | Smooth. Wooden floor | Cozy, homey and clean. | 10 |
| Grey | It’s a easy color to combine, it’s neutral and elegent. | 8 | Rough. Quarry | Rustic, practical and easy to clean. | 9 | |||
| Brown/Wood | I love the wood grains, it’s a hommy color. | 7 | Plants | They give my life, joy and I enjoy the garden with my family. | 10 | |||
| Burgundy | I’m happy when I see it. It gives warmth to the space. | 9 | Stones | Reminds me of the beach and vacations. | 7 | |||
| Pink/Red | It’s femenine, romatic, subtle, and it’s easy to combine. | 8 | Gurved wood | It’s handmade and involves a lot of effort. I value the artisans work. | 5 |
Table 3.
Information Gathering from one feminine respondent between 45 and54 years old on Objects, Furniture, Equipment, and missing spaces. Own elaboration, 2021.
Table 3.
Information Gathering from one feminine respondent between 45 and54 years old on Objects, Furniture, Equipment, and missing spaces. Own elaboration, 2021.
| Favorites Objects | Why? | How Happy That Color Makes You? | Favorites Furnitures | Why? | How Happy That Texture Makes You? | Space That You Miss during Confinement? |
|---|---|---|---|---|---|---|
| Flowers vases | I like the organic shape they have, and the simplicity of them. | 6 | Accent c hair | It’s very comfortabe, I love its color, and the place where I received all my guests. | 9 | A garden with a pool, to enjoy with my family. |
| Circular picture | It reminds me to the place where my dad born. Brings me good memories. | 10 | Outdoor dining table | It’s outdoors, I can read a book with my coffee and spend evening. | 10 | |
| Rectangular picture | It’s hand painted by my mother in law. It was a gift. | 8 | Shoerack | I like the order. The shoes are always visible and it’s very practiced. | 10 | |
| Center piece (mirror balls) | I’m happy when I see it. It gives warmth to the space. | 9 | bookshelf | I love to read. It’s where I have all my favorites book. | 8 | |
| Carved basket | It’s feminine, romatic, subtle, and it’s easy to combine. | 6 | Desk | It’s the place where I’m working during the confinement. It’s very comfortable and it has daylight. | 7 |
Table 4.
Comfortable Spaces and characteristics that define them according to respondents. Characteristics: (i) Spacious rooms; (ii) Interior spaces with nature; (iii) Space where you can spend time with family; (iv) Space where you can play; (v) Space where you can watch TV; (vi) Cozy spaces, furniture, etc.; (vii) Comfortable spaces, furniture, etc.; (viii) Place where you can cook; (ix) Quiet space where you can concentrate; (x) Space where you can work; (xi) Space personalized, very authentic or unique; (xii) Space where you can relax; (xiii) Illuminated space where interior lighting is comfortable; (xiv) Space where furniture is the most important piece in the room; (xv) A clean interior space; (xvi) Space where privacy is the most important thing; (xvii) Peaceful and quiet indoor space; (xviii) Space where you can breathe clean air; (xix) Space where air can circulate; (xx) Space where you can perform your favorite activities or hobbies; (xxi) Space where you can rest, relax and be calm; (xxii) Space where you can read; (xxiii) Space where you can exercise or play; (xxiv) Most used space; (xxv) Space where order predominates; (xxvi) Distraction-free space; (xxvii) Space with a great view; (xxviii) Space where facetime is the most common activity; (xxix) Space where music is the most common activity. Own elaboration, 2021.
| Comfortable Spaces | ||||||||||||||||||||||||||||||||
|---|---|---|---|---|---|---|---|---|---|---|---|---|---|---|---|---|---|---|---|---|---|---|---|---|---|---|---|---|---|---|---|---|
| Interior Spaces | Q. | % | i | ii | iii | iv | v | vi | vii | viii | ix | x | xi | xii | xiii | xiv | xv | xvi | xvii | xviii | xix | xx | xxi | xxii | xxiii | xxiv | xxv | xxvi | xxvii | xxviii | xxix | |
| 1 | Living Room | 31 | 18.45 | 3 | 2 | 5 | 2 | 4 | 1 | 6 | 2 | 0 | 1 | 0 | 1 | 7 | 2 | 0 | 0 | 2 | 1 | 1 | 0 | 0 | 3 | 1 | 1 | 0 | 0 | 1 | 1 | 0 |
| 2 | Dining Room | 7 | 4.16 | 2 | 2 | 1 | 0 | 2 | 0 | 1 | 2 | 0 | 2 | 1 | 0 | 2 | 1 | 0 | 0 | 0 | 1 | 0 | 1 | 0 | 1 | 0 | 0 | 0 | 0 | 1 | 1 | 0 |
| 3 | TV Room | 22 | 13.09 | 1 | 0 | 4 | 1 | 5 | 0 | 3 | 1 | 0 | 3 | 0 | 1 | 2 | 0 | 0 | 0 | 1 | 0 | 0 | 0 | 3 | 1 | 2 | 0 | 1 | 1 | 1 | 0 | 0 |
| 4 | Bedroom | 54 | 32.14 | 4 | 0 | 1 | 0 | 4 | 1 | 7 | 0 | 2 | 4 | 4 | 6 | 2 | 1 | 0 | 7 | 2 | 1 | 1 | 1 | 8 | 2 | 0 | 4 | 1 | 0 | 0 | 0 | 0 |
| 5 | Homeoffice | 8 | 4.76 | 0 | 0 | 0 | 0 | 0 | 0 | 2 | 0 | 0 | 3 | 0 | 1 | 0 | 0 | 0 | 2 | 2 | 0 | 0 | 0 | 0 | 1 | 0 | 2 | 0 | 0 | 0 | 0 | 1 |
| 6 | Common Area | 1 | 0.59 | 0 | 0 | 0 | 0 | 0 | 0 | 0 | 0 | 0 | 0 | 0 | 0 | 0 | 0 | 0 | 0 | 0 | 0 | 0 | 0 | 0 | 0 | 0 | 0 | 0 | 0 | 0 | 0 | 0 |
| 7 | Garden | 11 | 6.54 | 1 | 3 | 0 | 0 | 0 | 0 | 1 | 0 | 0 | 1 | 0 | 1 | 0 | 0 | 0 | 0 | 1 | 3 | 0 | 0 | 1 | 0 | 0 | 0 | 0 | 0 | 0 | 0 | 0 |
| 8 | Roofgarden | 1 | 0.59 | 0 | 0 | 0 | 0 | 0 | 0 | 0 | 0 | 0 | 0 | 0 | 0 | 0 | 0 | 0 | 0 | 0 | 1 | 0 | 0 | 0 | 0 | 0 | 0 | 0 | 0 | 0 | 0 | 0 |
| 9 | Kitchen | 10 | 5.95 | 0 | 0 | 1 | 0 | 0 | 0 | 1 | 3 | 0 | 0 | 0 | 0 | 0 | 0 | 0 | 0 | 0 | 0 | 0 | 0 | 0 | 0 | 0 | 2 | 0 | 0 | 0 | 0 | 0 |
| 10 | Toilet | 1 | 0.59 | 0 | 0 | 0 | 0 | 0 | 0 | 0 | 0 | 0 | 0 | 0 | 1 | 0 | 0 | 0 | 0 | 0 | 0 | 0 | 0 | 0 | 0 | 0 | 0 | 0 | 0 | 0 | 0 | 0 |
| 11 | Gyn | 1 | 0.59 | 0 | 0 | 0 | 0 | 0 | 0 | 0 | 0 | 0 | 0 | 0 | 0 | 0 | 0 | 0 | 0 | 0 | 0 | 0 | 0 | 0 | 0 | 0 | 1 | 0 | 0 | 0 | 0 | 0 |
| 12 | Breakfast Area | 2 | 1.19 | 0 | 0 | 1 | 0 | 0 | 0 | 0 | 0 | 0 | 0 | 0 | 0 | 0 | 0 | 0 | 0 | 0 | 0 | 0 | 0 | 0 | 0 | 0 | 0 | 0 | 0 | 0 | 0 | 0 |
| 13 | Office | 5 | 2.97 | 0 | 0 | 0 | 0 | 0 | 0 | 0 | 0 | 0 | 2 | 0 | 0 | 0 | 0 | 0 | 0 | 0 | 0 | 0 | 0 | 0 | 0 | 0 | 1 | 0 | 0 | 0 | 0 | |
| 14 | Terrace | 7 | 4.16 | 0 | 2 | 0 | 0 | 0 | 0 | 0 | 0 | 0 | 0 | 0 | 0 | 0 | 0 | 0 | 0 | 2 | 8 | 0 | 0 | 0 | 1 | 0 | 0 | 0 | 0 | 1 | 0 | 0 |
| 15 | Library | 1 | 0.59 | 0 | 0 | 0 | 0 | 0 | 0 | 0 | 0 | 0 | 0 | 0 | 0 | 0 | 0 | 0 | 0 | 0 | 0 | 0 | 0 | 1 | 0 | 0 | 0 | 0 | 0 | 0 | 0 | 0 |
| 16 | The Hole House | 6 | 3.64 | 0 | 0 | 0 | 0 | 0 | 0 | 0 | 0 | 0 | 0 | 0 | 0 | 0 | 0 | 1 | 0 | 0 | 0 | 0 | 0 | 0 | 0 | 0 | 0 | 0 | 0 | 0 | 0 | 0 |
| 100% | 11 | 9 | 13 | 3 | 15 | 2 | 21 | 8 | 2 | 16 | 5 | 11 | 13 | 4 | 1 | 9 | 10 | 15 | 2 | 2 | 13 | 9 | 3 | 11 | 2 | 1 | 4 | 2 | 1 | |||
Table 5.
Uncomfortable Spaces and characteristics that define them according to respondents. Characteristics: (i) Space that produces fear of being infected with COVID-19 through food; (ii) Space that produces fear of being infected with COVID-19; (iii) Small space; (iv) Big spaces that produce a feeling of emptiness; (v) Impersonal or soulless space; (vi) Uncomfortable space or furniture; (vii) Messy space, disordered or chaotic; (viii) Dirty, grubby or unclean space; (ix) Space that is not used because furniture is inadequate, uncomfortable or ugly; (x) A boring space, monotonous or repetitive; (xi) Stressful work-related space; (xii) Space with loud noises; (xiii) Space with uncomfortable cabinets; (xiv) Dark space; (xv) Humid space; (xvi) Space that transmits loneliness; (xvii) Space that produces fear of being infected with COVID-19 through cooking; (xviii) Crowded pace; (xix) Space that transmits sadness; (xx) Space too formal; (xxi) Not peaceful space because you have to live with your ex; (xxii) Closed and oppressive space; (xxiii) Space too bright or with dazzle; (xxiv) Space not used; (xxv) Space exposed to excess ventilation; (xxvi) Cold space; (xxvii) Hot space; (xxviii) Space that makes you hungry and anxious; (xxix) Low privacy space; (xxx) Space that causes you anxiety, fear or worry. Own elaboration, 2021.
| Uncomfortable Spaces | |||||||||||||||||||||||||||||||||
|---|---|---|---|---|---|---|---|---|---|---|---|---|---|---|---|---|---|---|---|---|---|---|---|---|---|---|---|---|---|---|---|---|---|
| Interior Spaces | Q. | % | i | ii | iii | iv | v | vi | vii | viii | ix | x | xi | xii | xiii | xiv | xv | xvi | xvii | xviii | xix | xx | xxi | xxii | xxiii | xxiv | xxv | xxvi | xxvii | xxviii | xxix | xxx | |
| 1 | Kitchen | 16 | 15.09 | 1 | 1 | 5 | 0 | 0 | 0 | 1 | 4 | 4 | 0 | 1 | 0 | 1 | 0 | 0 | 0 | 2 | 2 | 0 | 0 | 0 | 0 | 0 | 0 | 0 | 0 | 0 | 1 | 0 | 0 |
| 2 | Bedroom | 7 | 6.69 | 0 | 0 | 2 | 0 | 0 | 0 | 0 | 0 | 0 | 1 | 0 | 0 | 0 | 0 | 0 | 0 | 0 | 1 | 0 | 0 | 0 | 1 | 0 | 0 | 0 | 0 | 0 | 0 | 0 | 1 |
| 3 | None | 36 | 33.96 | 0 | 0 | 0 | 0 | 0 | 0 | 0 | 0 | 0 | 0 | 0 | 0 | 0 | 0 | 0 | 0 | 0 | 0 | 0 | 0 | 0 | 0 | 0 | 0 | 0 | 0 | 0 | 0 | 0 | 0 |
| 4 | Living Room | 13 | 12.26 | 0 | 0 | 0 | 1 | 1 | 1 | 0 | 0 | 1 | 1 | 0 | 1 | 0 | 0 | 0 | 0 | 0 | 1 | 1 | 0 | 1 | 1 | 1 | 2 | 0 | 0 | 0 | 0 | 1 | 0 |
| 5 | Dining Room | 13 | 12.26 | 0 | 1 | 0 | 3 | 0 | 1 | 0 | 0 | 4 | 1 | 2 | 0 | 0 | 0 | 0 | 2 | 0 | 0 | 0 | 2 | 1 | 1 | 0 | 0 | 0 | 1 | 0 | 0 | 0 | 0 |
| 6 | Studio | 2 | 1.88 | 0 | 0 | 0 | 0 | 0 | 0 | 1 | 1 | 1 | 0 | 0 | 0 | 0 | 0 | 0 | 0 | 0 | 0 | 0 | 0 | 0 | 0 | 0 | 0 | 0 | 0 | 0 | 0 | 0 | 0 |
| 7 | TV Room | 2 | 1.88 | 0 | 0 | 0 | 0 | 0 | 0 | 0 | 0 | 1 | 1 | 0 | 0 | 0 | 1 | 0 | 0 | 0 | 0 | 0 | 0 | 0 | 0 | 0 | 0 | 0 | 0 | 1 | 0 | 0 | 0 |
| 8 | Laundry | 2 | 1.88 | 0 | 0 | 2 | 0 | 0 | 0 | 0 | 0 | 1 | 0 | 0 | 0 | 0 | 0 | 0 | 0 | 0 | 0 | 0 | 0 | 0 | 0 | 0 | 0 | 0 | 0 | 0 | 0 | 0 | 0 |
| 9 | Maid’s Room | 2 | 1.88 | 0 | 0 | 1 | 0 | 0 | 0 | 2 | 0 | 0 | 0 | 0 | 0 | 0 | 0 | 0 | 0 | 0 | 0 | 0 | 0 | 0 | 0 | 0 | 0 | 0 | 0 | 0 | 0 | 0 | 0 |
| 10 | Hall | 1 | 0.94 | 0 | 0 | 1 | 0 | 0 | 0 | 0 | 0 | 0 | 0 | 0 | 0 | 0 | 0 | 0 | 0 | 0 | 0 | 0 | 0 | 0 | 0 | 0 | 0 | 0 | 0 | 0 | 0 | 0 | 0 |
| 11 | Storage Room | 1 | 0.94 | 0 | 0 | 0 | 0 | 0 | 0 | 1 | 0 | 0 | 0 | 0 | 0 | 0 | 0 | 0 | 0 | 0 | 0 | 0 | 0 | 0 | 0 | 0 | 0 | 0 | 0 | 0 | 0 | 0 | 0 |
| 12 | Walking Closet | 1 | 0.94 | 0 | 0 | 0 | 0 | 0 | 0 | 1 | 1 | 0 | 0 | 0 | 0 | 0 | 1 | 1 | 0 | 0 | 0 | 0 | 0 | 0 | 0 | 0 | 0 | 0 | 0 | 0 | 0 | 0 | 0 |
| 13 | Couriyard | 2 | 1.88 | 0 | 0 | 1 | 0 | 0 | 0 | 0 | 0 | 0 | 0 | 0 | 0 | 0 | 0 | 0 | 0 | 0 | 0 | 0 | 0 | 0 | 0 | 0 | 0 | 0 | 0 | 0 | 0 | 0 | 0 |
| 14 | Bathtoom | 2 | 1.88 | 0 | 0 | 0 | 0 | 0 | 0 | 0 | 0 | 0 | 0 | 0 | 0 | 0 | 1 | 0 | 0 | 0 | 0 | 0 | 0 | 0 | 0 | 0 | 0 | 1 | 0 | 0 | 0 | 0 | 0 |
| 15 | Breakfast Room | 1 | 0.94 | 0 | 0 | 0 | 0 | 0 | 0 | 0 | 0 | 0 | 0 | 0 | 0 | 0 | 1 | 0 | 0 | 0 | 0 | 0 | 0 | 0 | 0 | 0 | 0 | 0 | 0 | 0 | 0 | 0 | 0 |
| 16 | Garage | 2 | 1.88 | 0 | 0 | 0 | 0 | 0 | 0 | 0 | 0 | 0 | 0 | 0 | 0 | 0 | 0 | 0 | 0 | 0 | 0 | 0 | 0 | 0 | 0 | 0 | 0 | 0 | 1 | 0 | 0 | 0 | 0 |
| 17 | Pool | 1 | 0.94 | 0 | 0 | 0 | 0 | 0 | 0 | 0 | 0 | 0 | 0 | 0 | 0 | 0 | 0 | 0 | 0 | 0 | 0 | 0 | 0 | 0 | 0 | 0 | 1 | 0 | 0 | 0 | 0 | 0 | 0 |
| 18 | Guest’s Room | 1 | 0.94 | 0 | 0 | 0 | 0 | 0 | 1 | 0 | 0 | 0 | 0 | 0 | 0 | 0 | 0 | 0 | 0 | 0 | 0 | 0 | 0 | 0 | 0 | 0 | 0 | 0 | 0 | 0 | 0 | 0 | 0 |
| 19 | Roof | 1 | 0.94 | 0 | 0 | 0 | 0 | 0 | 0 | 0 | 0 | 0 | 0 | 0 | 0 | 0 | 0 | 0 | 0 | 0 | 0 | 0 | 0 | 0 | 0 | 0 | 0 | 0 | 0 | 0 | 0 | 0 | 0 |
| 100% | 1 | 2 | 12 | 4 | 1 | 3 | 6 | 6 | 12 | 3 | 3 | 1 | 1 | 4 | 1 | 2 | 2 | 4 | 1 | 2 | 2 | 4 | 1 | 3 | 1 | 2 | 1 | 1 | 1 | 1 | |||
Table 6.
Table of pre-pandemic (2016–2019) and pandemic (2020–2021) trends in colors, textures, objects, furniture, and equipment. Own elaboration from the data obtained in the surveys of this work and the texts [37,38,39,40,41,42], 2022.
| Year | Colors | Textures | Objects | Fumiture and equipment | Trends | |||||
|---|---|---|---|---|---|---|---|---|---|---|
| Type | Color | Type | Material | Type | Material | Color | ||||
| prepandemic | 2016 2017 | Pale pink, beige, white, turquoise blue, grey, pastel green, vanilla and yellow | Floral and geometric prints | (Not found) | (Not found) | Golden, silver, crystal | (Not found) | Light wood | (Not found) | Make-up trend |
| 2018 | Blue, yellow (women), Black, green (men), blue (girls), blue, red (bous), red, blue, black, white, green (general) | Wood, clay. concrete | (Not found) | (Not found) | (Not found) | (Not found) | Dark wood, cement, metal, rope | Black, chocolate brown | Urban-industrial trend | |
| 2019 | White, sand, beige, grey, terracotta, blue, red, saffron, yellow, vibrant pink, turquoise gree and olive green | Terracotta, cork, wood, botanical and floral prints | (Not found) | Dream catches, vases, decanters | Metallic, golden | (Not found) | Natural wood (oak), velvet | Light colors | Natural trend | |
| 2020 2021 | Gray, brown, white, blue, and beige | Soft textiles (cotton, polyester, linen, wool), woods (walnut, poplar, ebony) | Beige, beown and gray | Collectibles and technology | (unanalyzed) | Sofas and armchairs) | Textitles, woods | Beige, gray, blue | Pandemic trend | |
Publisher’s Note: MDPI stays neutral with regard to jurisdictional claims in published maps and institutional affiliations. |
© 2022 by the authors. Licensee MDPI, Basel, Switzerland. This article is an open access article distributed under the terms and conditions of the Creative Commons Attribution (CC BY) license (https://creativecommons.org/licenses/by/4.0/).
Share and Cite
MDPI and ACS Style
Martín López, L.; Fernández Díaz, A.B. Interior Environment Design Method for Positive Mental Health in Lockdown Times: Color, Textures, Objects, Furniture and Equipment. Designs 2022, 6, 35. https://doi.org/10.3390/designs6020035
AMA Style
Martín López L, Fernández Díaz AB. Interior Environment Design Method for Positive Mental Health in Lockdown Times: Color, Textures, Objects, Furniture and Equipment. Designs. 2022; 6(2):35. https://doi.org/10.3390/designs6020035
Chicago/Turabian StyleMartín López, Lucía, and Ana Belén Fernández Díaz. 2022. "Interior Environment Design Method for Positive Mental Health in Lockdown Times: Color, Textures, Objects, Furniture and Equipment" Designs 6, no. 2: 35. https://doi.org/10.3390/designs6020035