
Design of Cyber-Physical Waste Management Systems Focusing on Energy Efficiency and Sustainability


1
Institute of Logistics, University of Miskolc, 3515 Miskolc, Hungary
2
Faculty of Information Technology, Damascus University, Damascus, Syria
*
Author to whom correspondence should be addressed.
Designs 2022, 6(2), 39; https://doi.org/10.3390/designs6020039
Submission received: 4 March 2022
/
Revised: 31 March 2022
/
Accepted: 2 April 2022
/
Published: 13 April 2022
(This article belongs to the Section Mechanical Engineering Design)
Abstract
:Industry 4.0 tools, such as the Internet of Things, artificial intelligence, digital twinning, and cloud computing, create a technological revolution that accelerates efforts to optimize the efficiency of cyber-physical operations and services. The waste management system requires a critical share of city logistics optimization, especially when using cyber-physical systems. Modern tools reduce the required municipal waste handling, such as loading and unloading, transportation, and warehousing, which leads to an increase in efficiency and flexibility, saving energy and time, and protecting the environment. In this paper, we present a cyber-physical waste management system solution by providing a cyber-physical model design and description, mathematical modeling, and two cases to investigate the impact on energy consumption and emissions. After an introduction and literature review, we describe the design of the cyber-physical model and tackle the first echelon. The designed system incorporates the IoT, smart bins with multi-percentage sensors, data and information analysis, vehicles’ actual routes, energy and emissions optimization, multi-echelon systems, time windows, and flexibility. Mathematical modeling equations for the optimized total energy consumption are presented. Thirty and twenty smart bins located in VIII District in Budapest are detailed as two case studies, where solutions for the optimized real routes and energy consumption are found using three metaheuristic algorithms: genetic, particle swarm, and simulated annealing optimization algorithms. The accrued emissions of CO, NMHC, CH4, NOx, and PM for the optimized solutions are calculated. Finally, the results are compared with a random traditional solution to measure the effectiveness.
1. Introduction and Theoretical Background
Solid waste management is an increasingly complex task, requiring a huge number of resources and having a major environmental impact [1]. Industry 4.0 presents many applications to be researched and implemented in the waste management area [2] that may increase efficiency and sustainability, while at the same time reducing expenses, pollution, and energy spent. It is crucial to describe the main scientific results so far, identify the main topics, and define the scientific gaps in this research area to augment the specific aim of this research and its scientific contribution.
Among the papers in a survey on the strategic and tactical issues of solid waste management operations research [1], very few have addressed the use of stochastic parameters, such as waste generation or travel times, while the majority of tactical models were oriented towards minimizing costs, which makes sense because waste management usually involves large financial sums. The mentioned study stated that other important issues should be considered more carefully, such as environmental conservation. In addition to the environmental aspect, congestion and CO2 emissions cause external transport costs [3] that are not usually considered, because these costs are not typically borne by the user or infrastructure operator. Although digitalization in manufacturing contributes positively to environmental sustainability by increasing resource and information efficiency, it is important to realize that digitalization has negative environmental consequences [4] due to the increased resource and energy use, as well as waste and emissions. Cyber-physical systems (CPSs) showed good contributions to and possibilities for more sustainable development implementation by applying Industry 4.0 tools to promote a circular economy [5] in addition to the potential improvement from an environmental point of view [6]. Additionally, in a survey about using the Internet of Things (IoT) within the smart waste management concept in 2017 [7], more advanced ways of sensing, analyzing, collecting, and processing data were suggested to effectively handle solid waste with IoT applications. Regarding IoT technology as a main application within real-time data monitoring, many developments have been researched accordingly. Low-cost and low-power components were described [8] for a sensor node that is supported by a single-chip microcontroller to measure the filling level of trash bins using ultrasounds; a data transmission module where the effectiveness was presented showed the achieved lifetime was about 502 days.
Many articles have tackled the development of waste management systems. The developed systems aimed to reduce total transportation costs, maximize recycled revenue, or achieve both objectives together. A case study in South Korea [9] used various approaches to find the optimal route for waste carrier vehicles. Another study [10] tackled the collected waste value as an uncertain parameter to reflect the uncertain value that can be recovered from each trash bin due to the uncertain condition and quality of waste. A waste separation center used as a connection point between the sub-models was also tackled [11] by using four metaheuristic algorithms, simulated annealing (SA), genetic algorithm, genetic algorithm–simulated annealing, and genetic algorithm–particle swarm optimization. Like the previously mentioned study, optimization algorithms were used frequently, especially metaheuristic algorithms, because they provided effective results for vehicle routing, which can easily be a complex problem; for example, a case study in Argentina [12], where simulated annealing algorithms showed the best results in computational experimentation compared to large neighborhood search and genetic algorithms. As a summary of the operational management approaches to smart waste collection routing [13], the model that incorporated the choice between the bins to be visited, their fill levels, and their location led to higher values of profit and fewer pollutant gas emissions, whereas minimizing only the distance might not be the most efficient solution. For instance, collecting waste from non-full containers located near a full container can be more efficient. Therefore, it can be useful to make the waste system flexible regarding the waste bins’ limit when considering the waste containers to be collected.
In contrast, the waste management systems that tackled sustainable aspects, such as energy efficiency and emissions, were less frequent. A study [14] showed that variable routing optimization, which considered the real-time data of the waste bins, achieved a 17.60% carbon emission reduction when a 70% fill level was considered for collecting the waste, compared to fixed routing optimization, where, in this case, the operators did not know the fill level and weight of the waste bins in advance. In another study [15], the results after four days of optimizing the route based on the bins’ waste level showed a 36.80% distance reduction for 91.40% of the total waste collection. Additionally, using electric vehicles showed promising potential from the environmental aspect, but their limited delivery capacity and limited battery power introduced big challenges, which encouraged research into the optimization of battery recharging stations [16] with a hybrid metaheuristic algorithm, which showed savings in the transportation costs. However, recharging stations are still an obstacle due to implementation costs and practical usage. In a case study in Istanbul [17], electric garbage trucks were considered for a waste collection process optimization approach with real road information data consideration. However, this real road information was used as indirect entry data, which means a non-flexible implementation.
The literature review is summarized in the following points:
- Waste management is considered a complex problem with direct and indirect impacts on various aspects such as transportation, environment, economy, social life, urban area planning, and waste treatment, which influence many stakeholders.
- Industry 4.0 tools, especially the IoT and cloud computing, provide big developments in waste management. Different aspects of these tools are actively being researched. However, due to its modernity and various adoption forms, more deep and focused research is needed.
- Waste management optimization research focused mainly on vehicle routing to minimize the total route distance, while energy efficiency and environment aspects were less commonly tackled. This expresses a research gap to cover, especially with the various available Industry 4.0 tools. Additionally, most articles utilized direct Euclidean lines to calculate the distances, which means that the results were unrealistic.
- Optimization algorithms provide efficient results in waste management systems. However, their results and execution times are still in the research phase, and specific algorithms have not been determined as the most efficient ones for specific models.
- One of the promising solutions for raising sustainability in waste management is electric vehicles. However, various operational operators, such as limited capacity and distances alongside battery power, pose significant challenges in adopting this solution.
This study is divided as follows: The cyber-physical waste management system is designed and discussed with a focus on its first echelon, followed by the chosen algorithms and this study’s scientific contribution, in Section 2. Section 3 describes the mathematical modeling of the mentioned system with its considerations and constraints to calculate the optimized total energy consumption. Section 4 examines two case studies of thirty and twenty smart bins located in the VIII District in Budapest. The optimized total energy consumption and accrued emissions of CO, NMHC, CH4, NOx, and PM are calculated using three metaheuristic algorithms for the two cases. Section 5 deals with the results and demonstrates a comparison with a random solution to outline the impact and effectiveness of the system, as well as possible future research directions. Finally, a summary of this work is outlined in the last chapter.
2. System Description and Methodology
A developed cyber-physical waste management system is presented in this chapter. The actual waste amounts as real-time data, cloud computing, and waste collection time are considered within this system. This waste management system is considered a cyber-physical system, because it contains a physical component of sensors, tools, and hardware that exists, in reality, to measure, collect, and transfer the waste, in addition to a cyber component that stores and analyzes data. The cyber component is represented by cyber management.
2.1. System Description
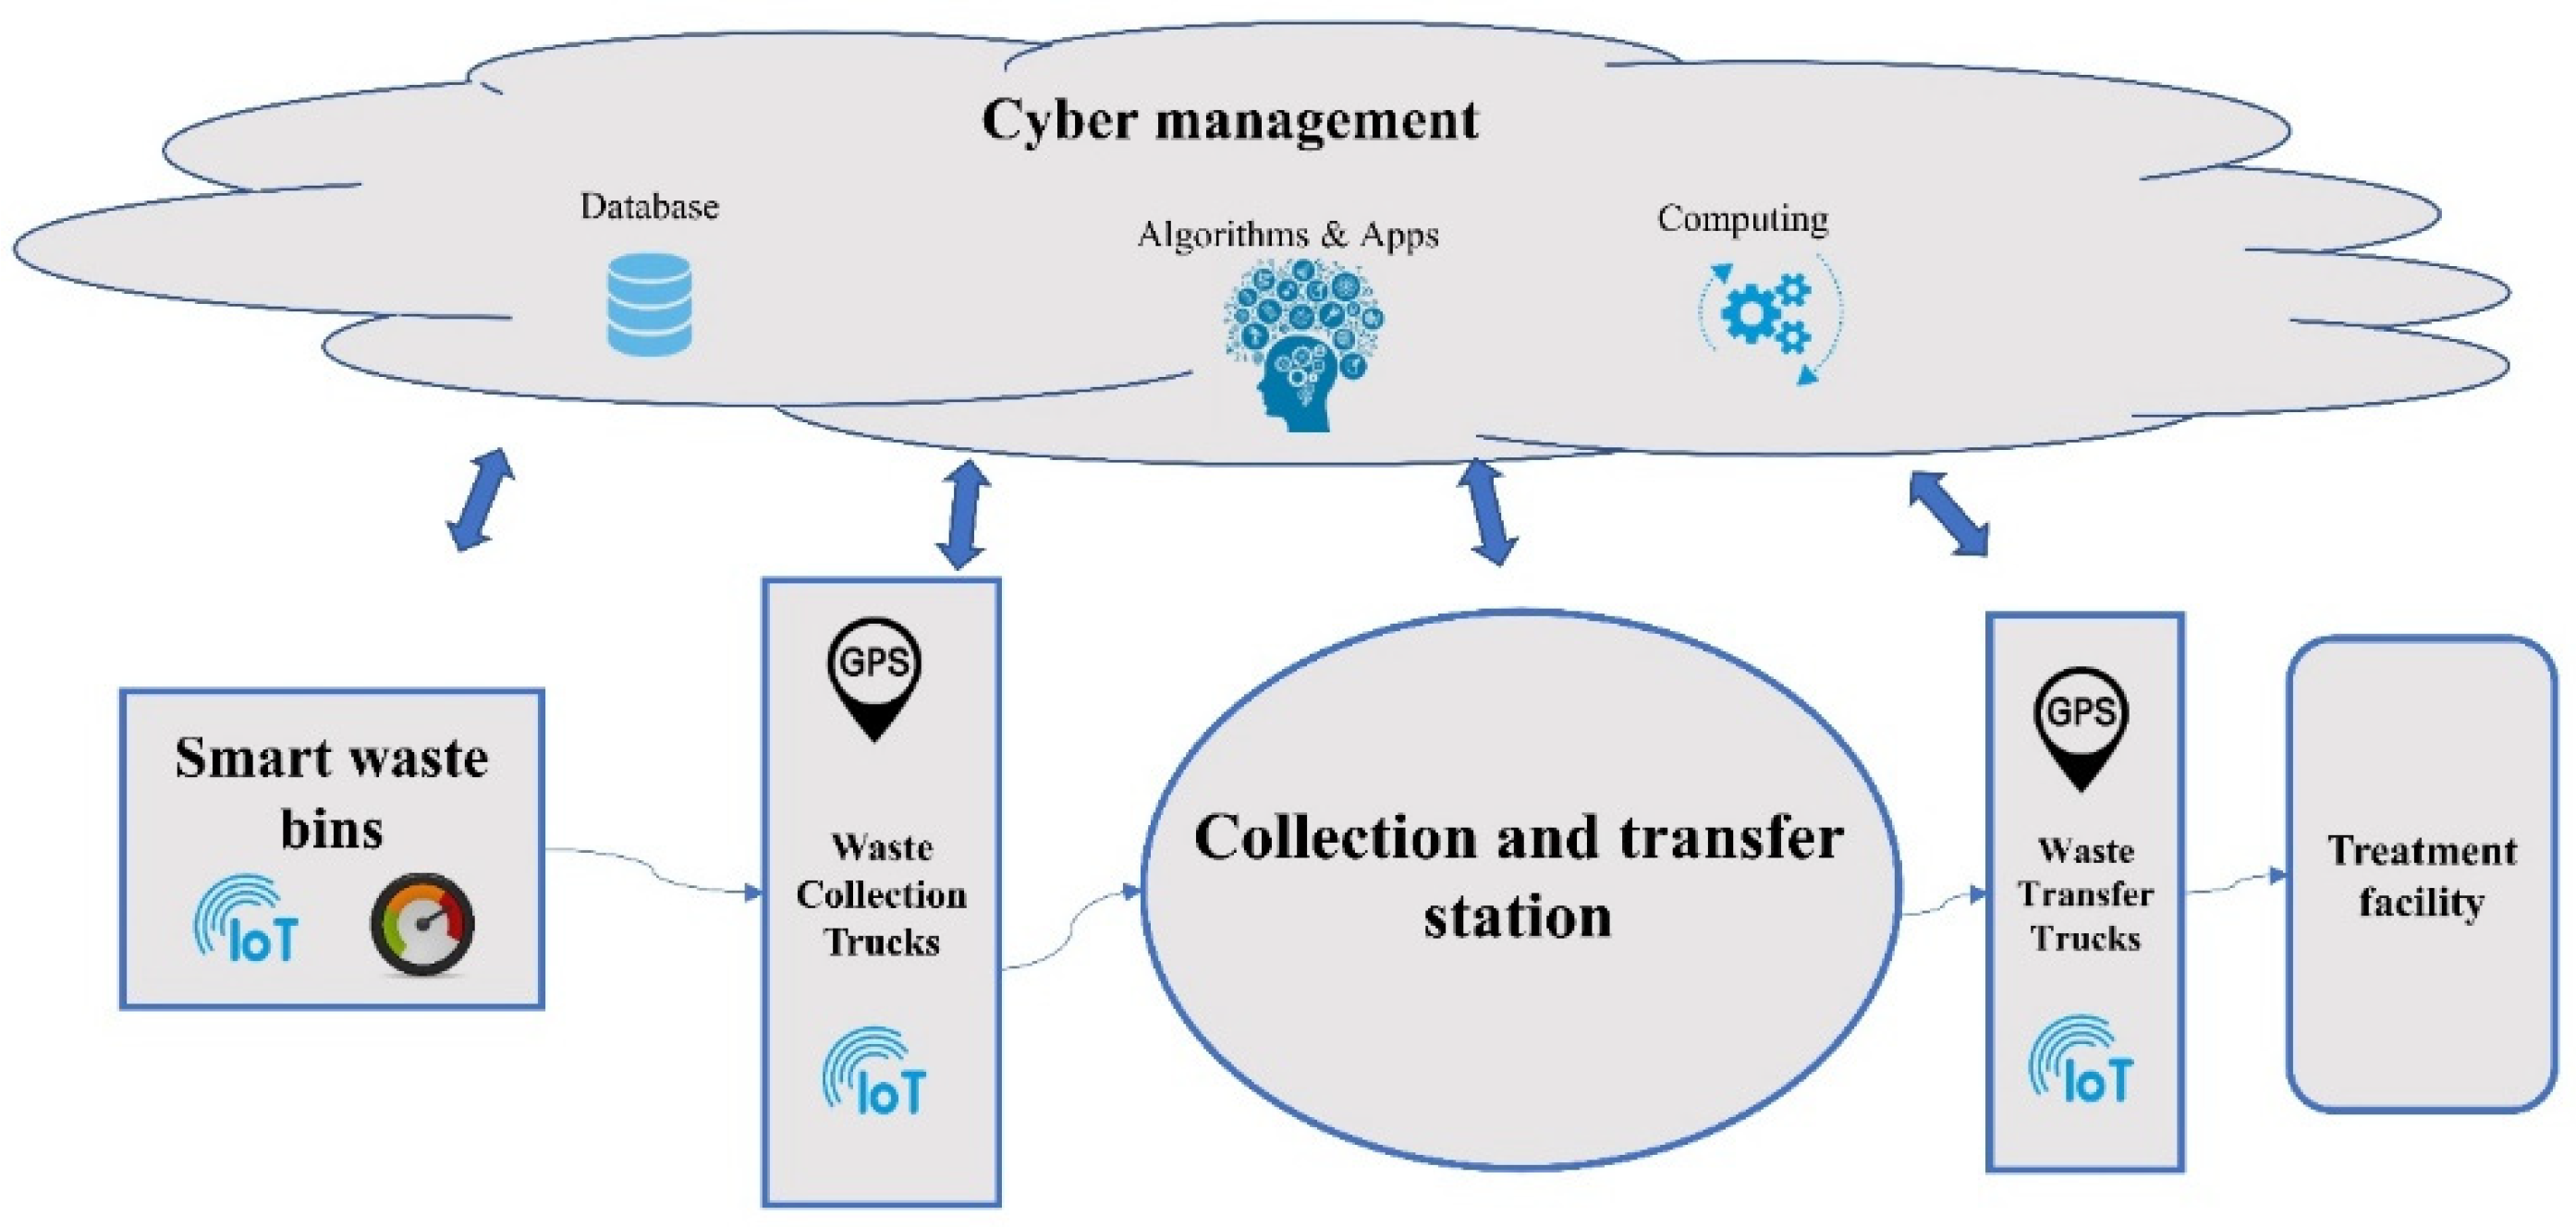
Using a multi-echelon system in city logistics creates an advantage by raising the efficiency of distribution tasks [18]. As a two-echelon, cyber-physical waste collection system, the collection and transfer station is the connection point between the two echelons. The first echelon starts from the smart waste bins that provide real-time waste amounts using the IoT to the collection and transfer station where the waste is stored, organized, and/or separated. This station gives the system the required flexibility by identifying its task and location depending on the situation being tackled. The smart bin’s sensor is represented by the colors green, orange, and red depending on the waste percentage. Green means the percentage is higher than 50%, orange means the percentage is higher than 70%, and red means the percentage is higher than 90%. The second echelon starts from the collection and transfer station to the treatment facility, where the waste is processed. The treatment facility varies from landfilling to other types such as recycling, dismantling, or incineration. The system components for waste collection, transportation, and treatment are directly connected to cyber management, where data are stored and computing processes are executed. Figure 1 illustrates the described system.
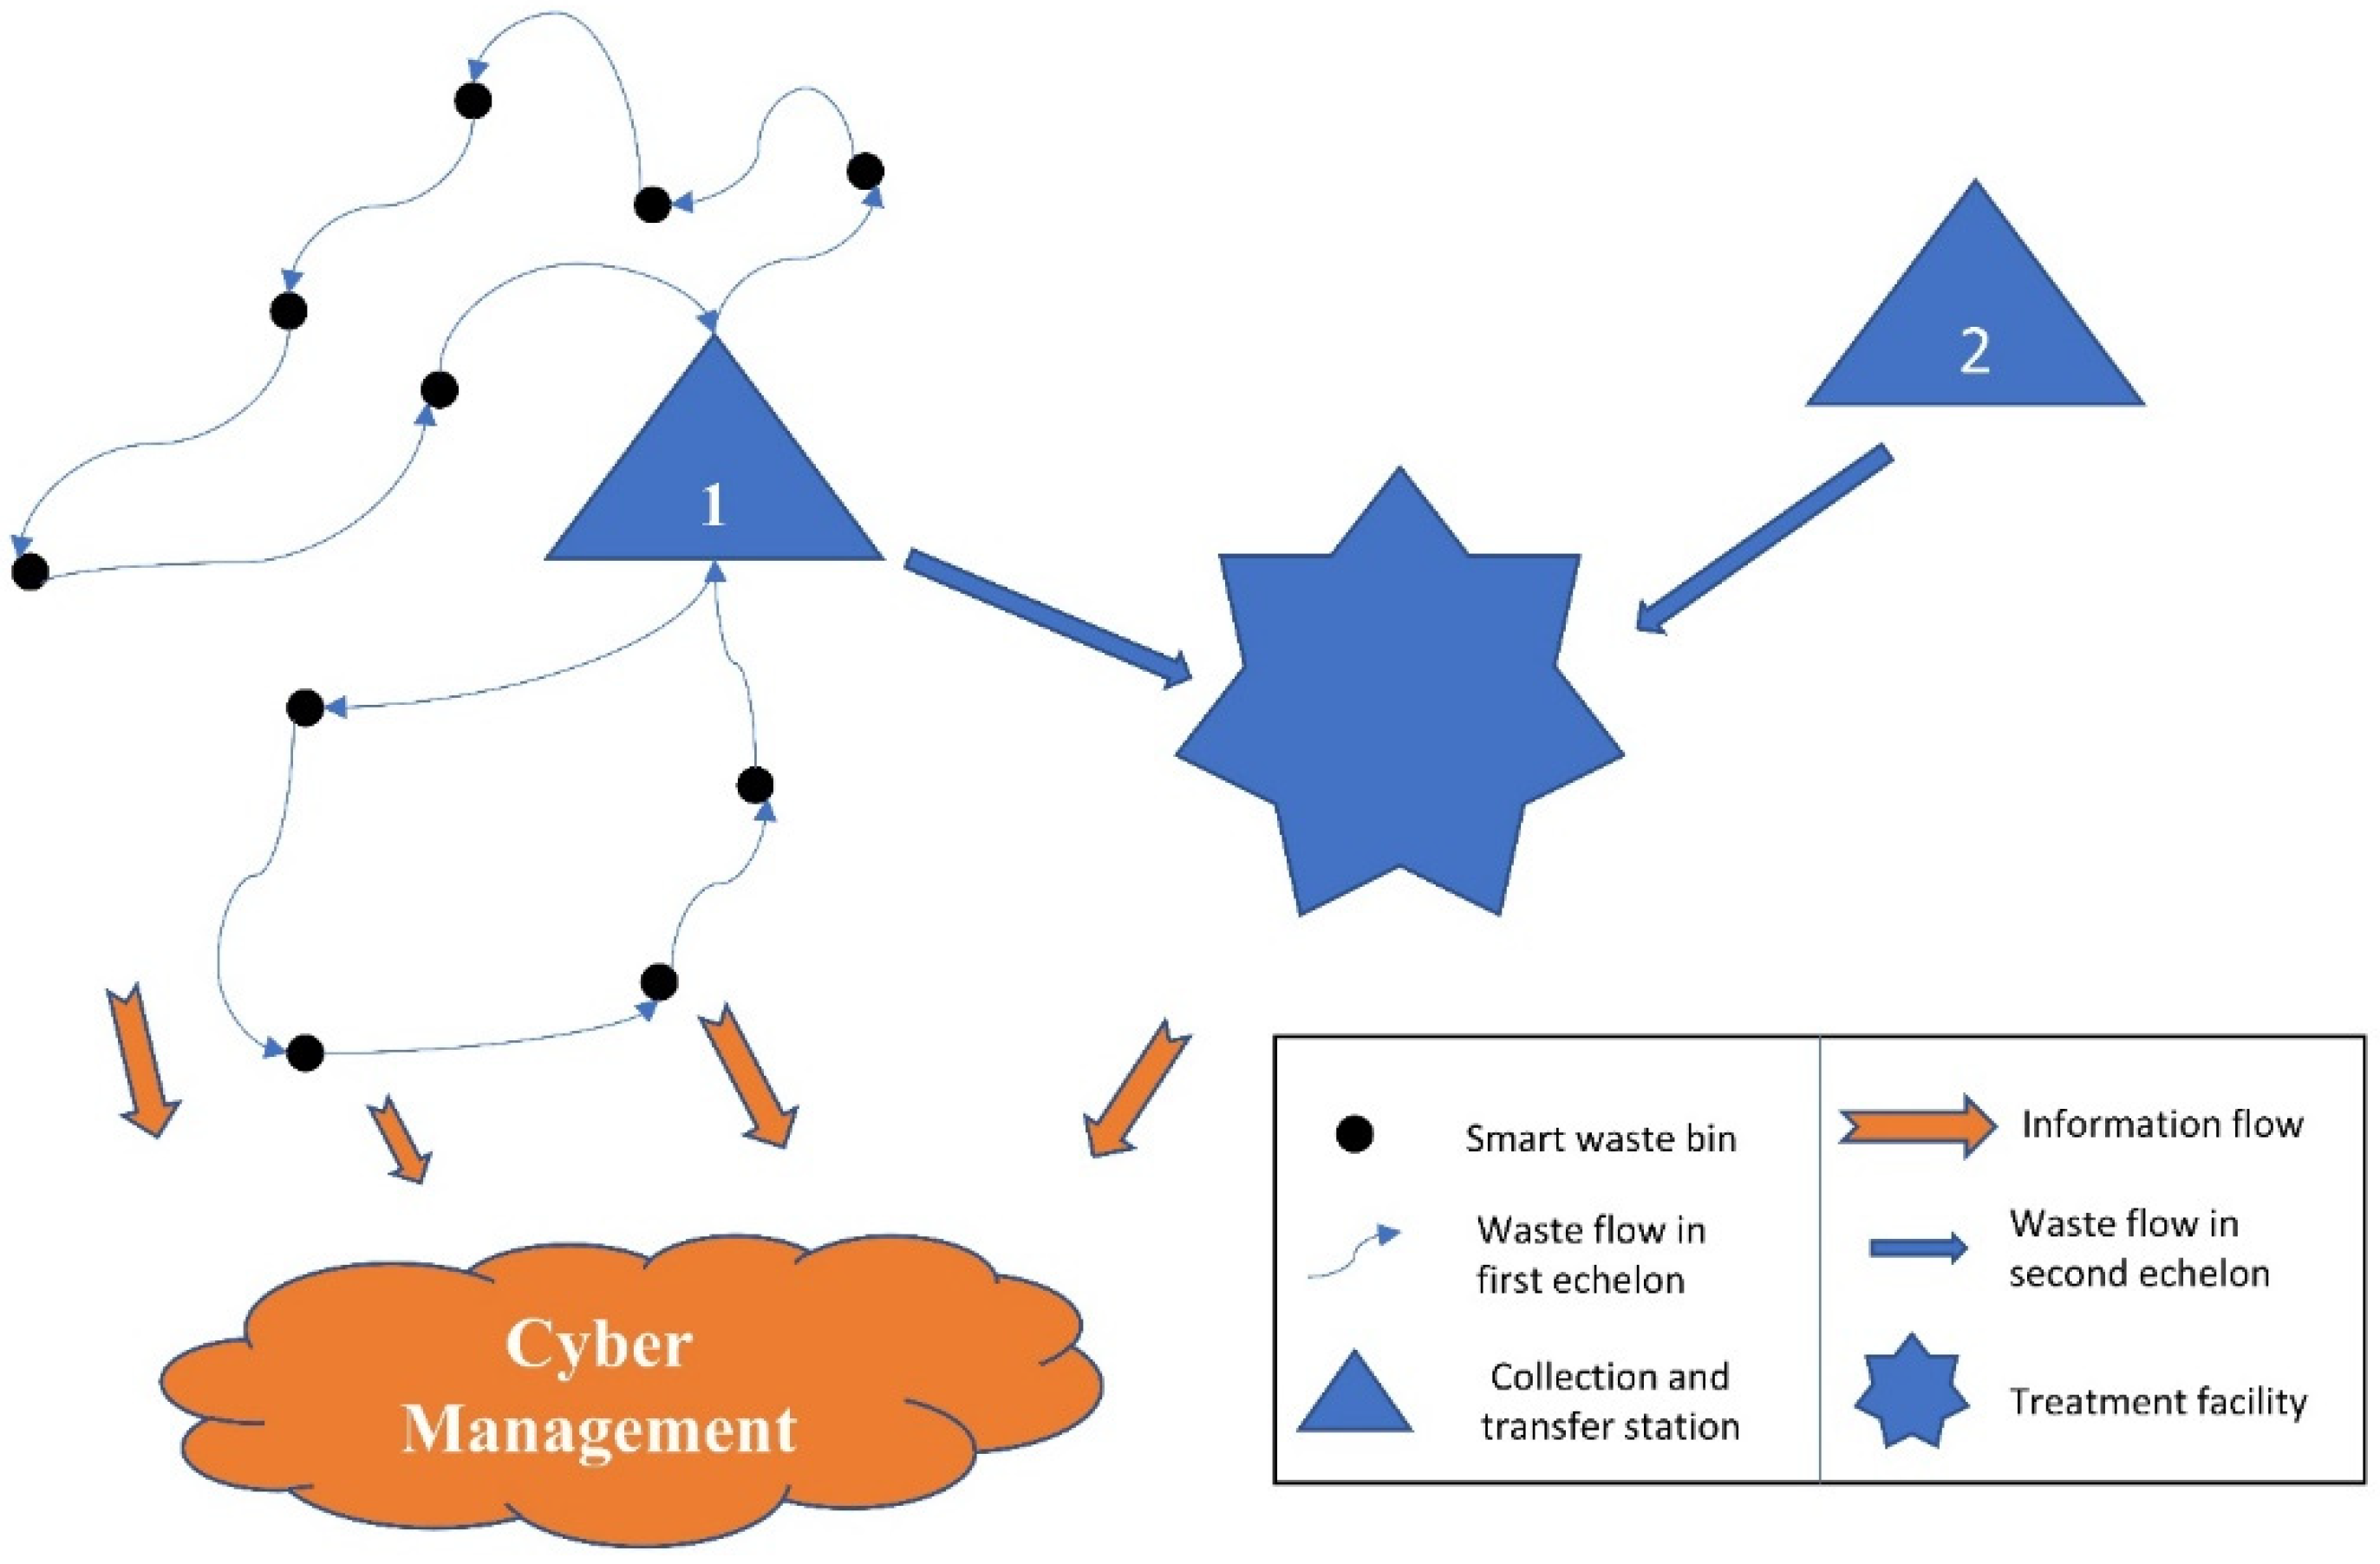
Many collection and transfer stations may exist in the system depending on the urban area, since each station covers a relatively small area. In a small urban area, it is possible to have one collection and transfer station. Each station’s location and tasks are adjustable based on the specific case. For instance, waste trucks can park there, so the station would be their start-off location. Figure 2 shows the information and waste flow in the designed system.
The collection and transfer station’s tasks vary from waste storage to waste separation and/or dismantling, which reflects higher flexibility and potential. For instance, it is possible to ignore some of the stations depending on the smart waste bins’ percentages and locations when it is more effective to do so or due to operational needs. This first echelon is tackled in detail within this study with the implementation of collecting waste up to the collection and transfer station. All bins with a waste percentage of less than 50% were ignored. The waste collection process was also carried out in a specific time span. The routes and time taken were calculated using Open Route Service, which was developed by HeiGIT gGmbH [19]. It gives the required real distances and time in which vehicles move between given locations.
2.2. Used Algorithms
The use of heuristic and metaheuristic algorithms has accelerated the progress of finding optimum solutions in various applications, particularly in logistics and supply chains [20]. Three metaheuristic algorithms were used in this research. The selection of such algorithms usually depends on the nature of the problem being solved. In general, optimization problems are categorized as continuous or combinatorial. In our case, the capacitated vehicle routing problem (CVRP) falls under the latter category; hence, and according to the aforementioned literature review, both the genetic algorithm (GA) and simulated annealing (SA) algorithm were chosen due to their effectiveness in solving these types of problems. Additionally, the particle swarm optimization (PSO) algorithm was selected even though its equations can only work with real numbers and continuous domains because fortunately, it can be adapted to discrete versions [21]. Another criterion that influenced our choice of the algorithms above is the metaheuristic classification of single-solution vs. population-based algorithms. Both GA and PSO are classified as population-based algorithms, whereas SA is a single-solution algorithm. This, in turn, helps to introduce a slight variation for better comparative analysis.
2.3. Scientific Contribution
The scientific contribution of this research is summarized as follows:
- Designing a flexible, two-echelon, cyber-physical waste management system that can be adjusted depending on the given urban area.
- Providing a detailed description of mathematical modeling based on the energy efficiency and sustainability of the cyber-physical system. While part of the mathematical modeling was adopted from previous research [22], another part was developed and adopted within this research.
- Presenting a modern method of using actual routes in city logistics locations instead of the traditional direct lines between the examined locations. Additionally, two case studies of thirty and twenty smart bins’ real locations in the VIII District in Budapest are discussed and analyzed.
- Calculating optimized energy consumption and accrued emissions based on actual routes using three metaheuristic algorithms (GA, PSO, and SA) with a clear comparison and discussion of the cost optimization and execution time.
Additionally, this study’s interdisciplinary approach among city logistics, sustainability, energy efficiency, transportation, and IT heighten its importance.
3. Mathematical Modeling
The vehicle routing problem (VRP) addresses the operation of serving a set of customers in reduced travel distance routes by starting in and returning to the same location [23]. The VRP is also known as the node routing problem (NRP), and it has been the focus of much research attention in many applications, including but not limited to waste collection. However, some researchers consider the waste collection problem to be an arc routing problem (ARP). The main difference is that in the arc routing problem, the focus is on the routes instead of nodes because the vehicle/vehicles carry out the service while traversing the routes. In other words, in the waste collection problem, from an arc point of view, the customers are located along the routes, not at the nodes [24]. However, this was not the case in this study, since there is was specific set of smart bins with known locations that should have been serviced/emptied; hence, the VRP model was chosen. Moreover, in certain cases, the density of the points along a street is so large that the natural way to approach the corresponding routing problem is to adopt the ARP instead of the VRP [25]. Such cases did not apply in this study, where the locations of the bins were sparsely scattered around the city.
The CVRP is an extension of the VRP with capacity constraints. The CVRP in solid waste collection is defined as collecting waste from a set of bins by a homogeneous or heterogeneous fleet of trucks with fixed capacities that cannot be violated; each of them starts from and returns to the same point [15]. The CVRP model in this study is explained below, where is the number of smart bins and is the number of trucks, with the set of homogeneous trucks defined as , each of which is initially stationed at the collection and transfer station. The index set corresponds to the smart bins, where , and corresponds to the start point location. Each smart bin contains a non-negative waste quantity , and a non-negative value represents the real distance from bin to bin , where .
The CVRP model in this study considered both the capacity of the trucks and the smart bins, where:
- represents the maximum waste capacity that each of the trucks can transport along their specified routes.
- represents the maximum waste capacity that can be carried by the truck’s mounted crane during material handling operations.
- refers to the maximum capacity that each smart bin can hold.
Additionally, the model also imposes a time limit, where:
- represents the maximum allocated time for the whole waste collection process.
- corresponds to the time taken by truck k to complete its assigned route and return to the collection and transfer station.
The objective function is to minimize the total energy consumption () of the used trucks in kWh during the waste collection and transportation, which is calculated depending on the route length, required material handling operations (waste loading), and specific fuel consumption rate [22]. The model includes two decision variables. First, is defined as 1 if vehicle moves from bin to bin ; otherwise, it is 0. Second, is defined as 1 if bin belongs to the route of vehicle ; otherwise, it is 0.
The total energy function is expressed as follows:
where is the energy consumption of the transportation process and is the energy consumption of material handling (waste loading) operations at the bins’ locations. The energy consumption of the transportation process is
where is the specific fuel consumption of the transportation process that is calculated as
where and are the lower and upper bounds of the specific fuel consumption of transportation depending on the loading waste weight, and represents truck waste load after moving from bin .
The energy consumption of the waste loading operations performed by the truck’s mounted crane is given by
where is the specific fuel consumption of material handling operations that is calculated as
where and are the lower and upper bounds of the specific fuel consumption of material handling operations depending on the loading waste weight, and is the waste quantity of bin .
The optimization model, which aims to minimize the total energy consumption, is described in Equation (1) and is formulated as follows:
Subject to the following constraints:
where represents the waste load amount picked up by truck when moving from bin to bin . Equations (7) and (8) specify that truck starts the tour from the start point carrying no load. Equation (9) states that each bin is visited by only one vehicle. Equation (10) ensures the continuity condition. Equation (11) ensures that the vehicle empties the visited bins. Equation (12) shows that the total collected waste from all visited bins in a tour must not exceed the vehicle capacity. After the tour, the truck returns to the depot according to Equation (13). Equation (14) states that the total waste amount of the aimed smart bins is less than the total capacity of the used trucks. Equation (15) ensures that the time taken by all trucks does not exceed the total time span allocated for the waste collection process. Equation (16) states that all the considered bins for waste collection have a waste amount equal to or larger than 50%. The mathematical notations used are explained in Table 1.
4. Case Studies in Budapest
Two case studies of thirty and twenty smart bins in the VIII District in Budapest were considered to validate the mathematical model. The optimized energy consumption of the total used vehicles was calculated based on actual routes in kWh. The optimized solutions were calculated using three metaheuristic algorithms: GA, PSO, and SA. The solutions are compared with a random solution to outline their effectiveness. We assume that the used trucks complied with Euro VI European emission standards. We used the values in Table 2 to calculate the accrued emissions of CO, NMHC, CH4, NOx, and PM for Euro VI under the WHSC test for heavy-duty and transit testing [26] in g/kWh depending on energy consumption.
In this study, we considered the lower and upper bounds of the specific fuel consumption of transportation and the lower and upper bounds of specific material handling, similar to a previous study [22], for an average speed of 25 km/h. The values are shown in Table 3. Each bin’s capacity was 100 kg. The maximum allocated time span = 3 h.
In order to obtain the smart bins’ location data, two geographical locations were chosen. These two locations served as geographical boundaries for the generation of location data within the area of study in Budapest. The distance between those two locations, which would be the diameter, was calculated using the Haversine formula. Additionally, the central location along the segment between the two boundaries was also calculated; hence, a circle/ellipse was formed. The locations were then randomly generated within the circle boundary. The random locations were generated from a uniform distribution. All the locations were checked on the map to ensure that they represented convenient locations, and some of them were manually adjusted. The waste values for each smart bin were also randomly generated following a uniform distribution. Smart bins’ locations and waste amounts are shown in Table 4.
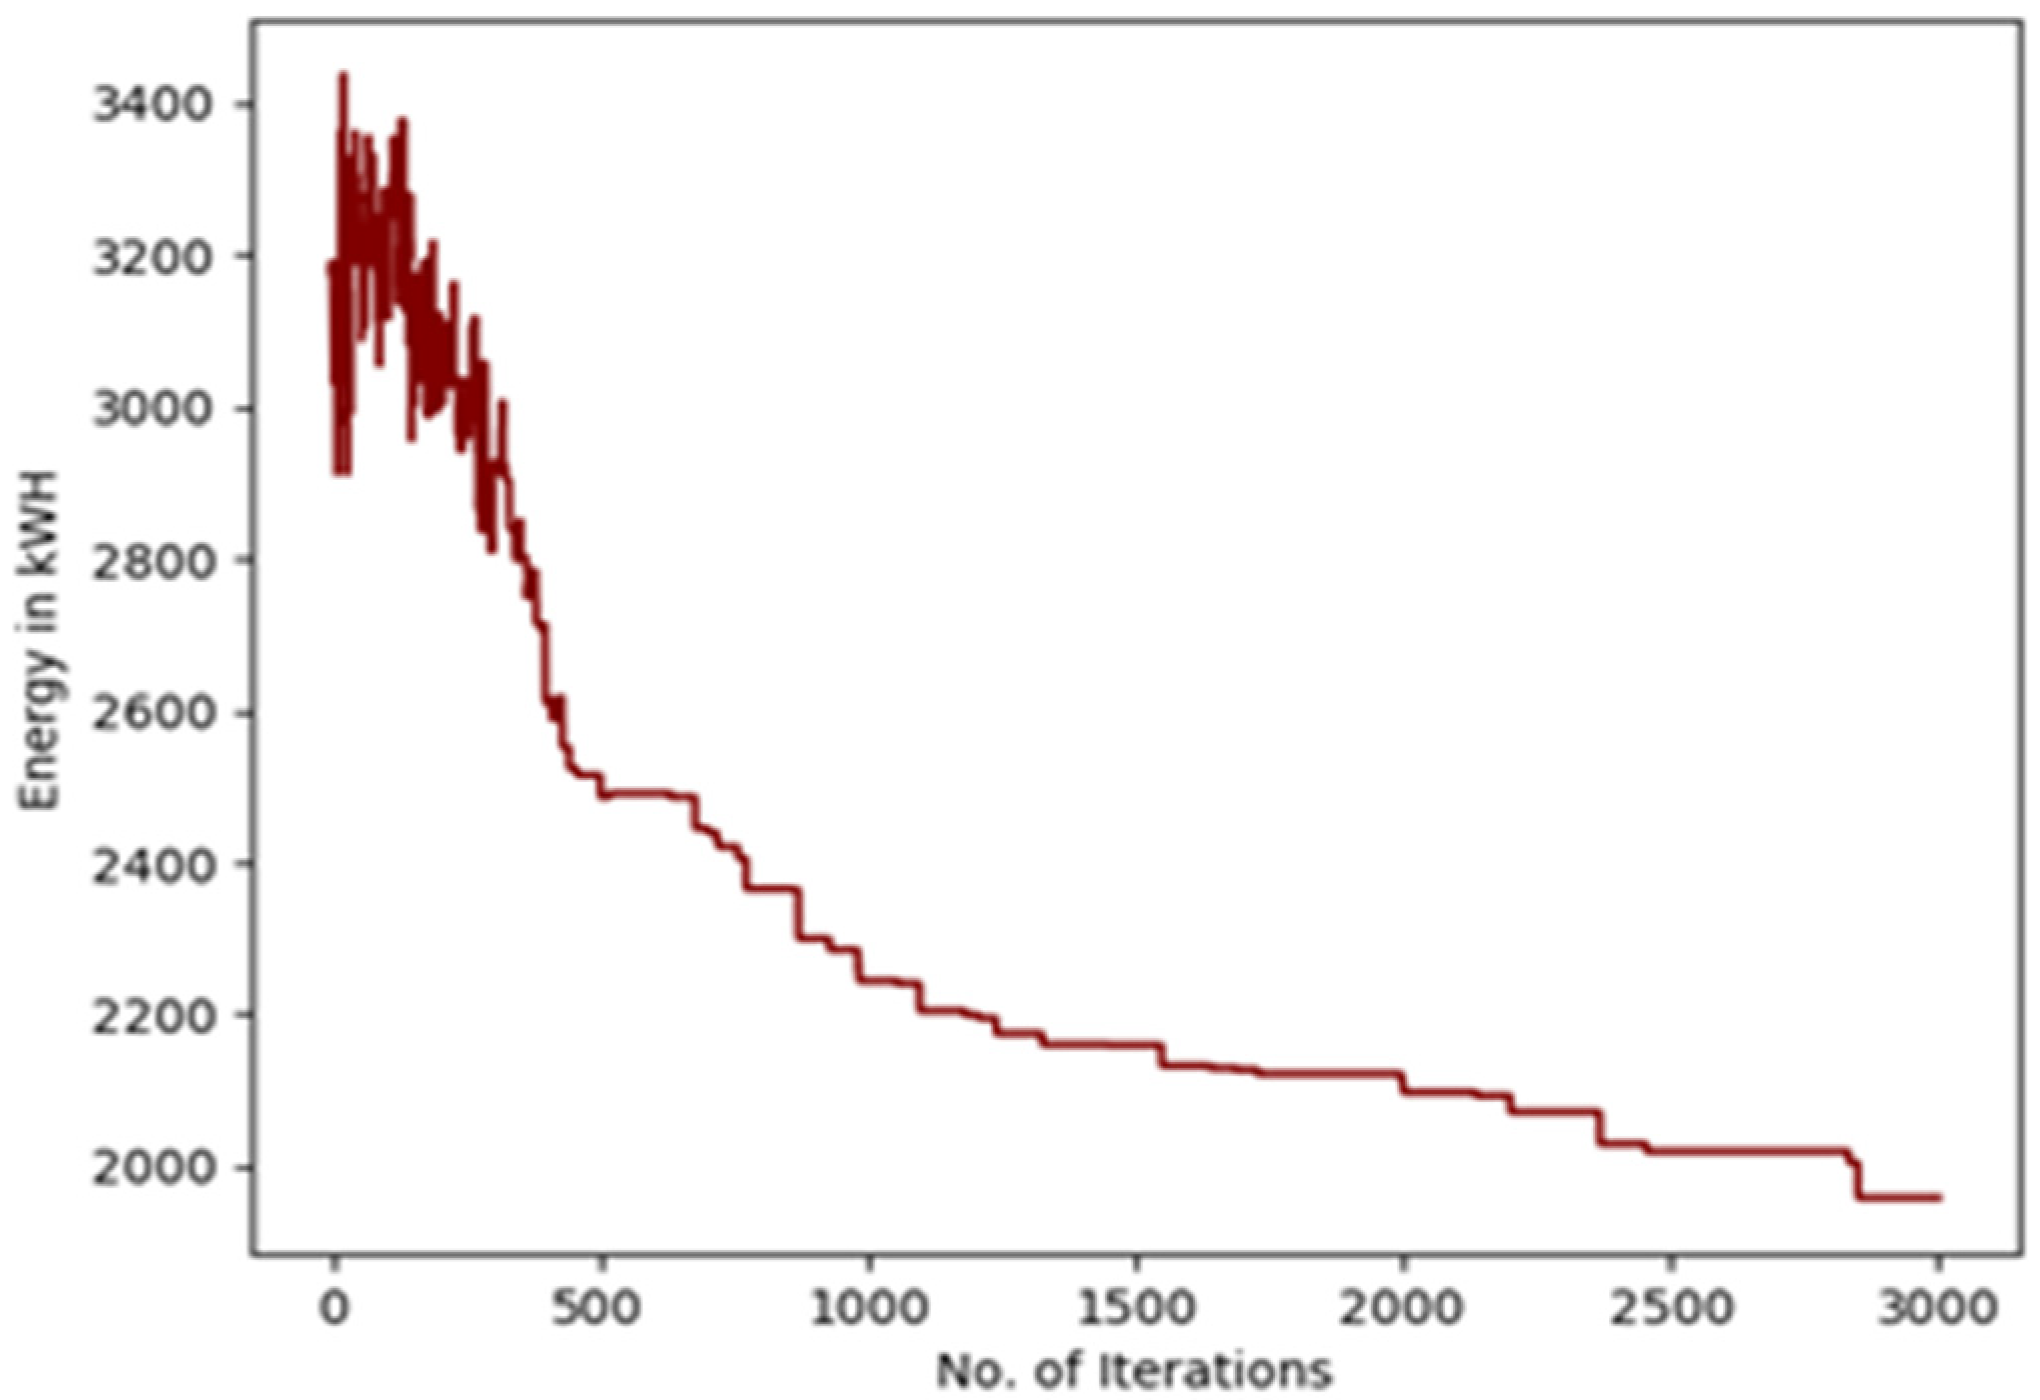
Regarding the parameters used for the implementation of the algorithms, in the case of GA optimization, the number of iterations was 600, cross over probability pc was 1, mutation probability pm was 0.08, population size was 300, elite size was 40, and the selection methods were fitness proportionate selection, the reverse sequence mutation method, and the ordered cross over method. In the case of PSO, the number of iterations was 500, the number of particles was 400, c2 was 0.1, and c1 was 0.9. In the case of SA, the number of iterations was 3000, the starting temperature was 140, the stopping temperature was 10−12, and the temperature cooling rate α was 0.991. The machine used had an i7-8750H 2.20 GHz processor, 16 GB of RAM, and a Windows 10 Home operating system.
5. Results and Discussion
According to the described smart bins and waste management system in the previous chapter, two cases are discussed. The first case considered the mentioned thirty smart bins in Table 4. The second case only considered the first twenty smart bins in the same table.
5.1. First Case of Thirty Smart Bins in Budapest
The execution time, the total consumed energy, and the total distances for this case are summarized in Table 5. The results were calculated using the three aforementioned algorithms next to a random solution (RS) without optimization.
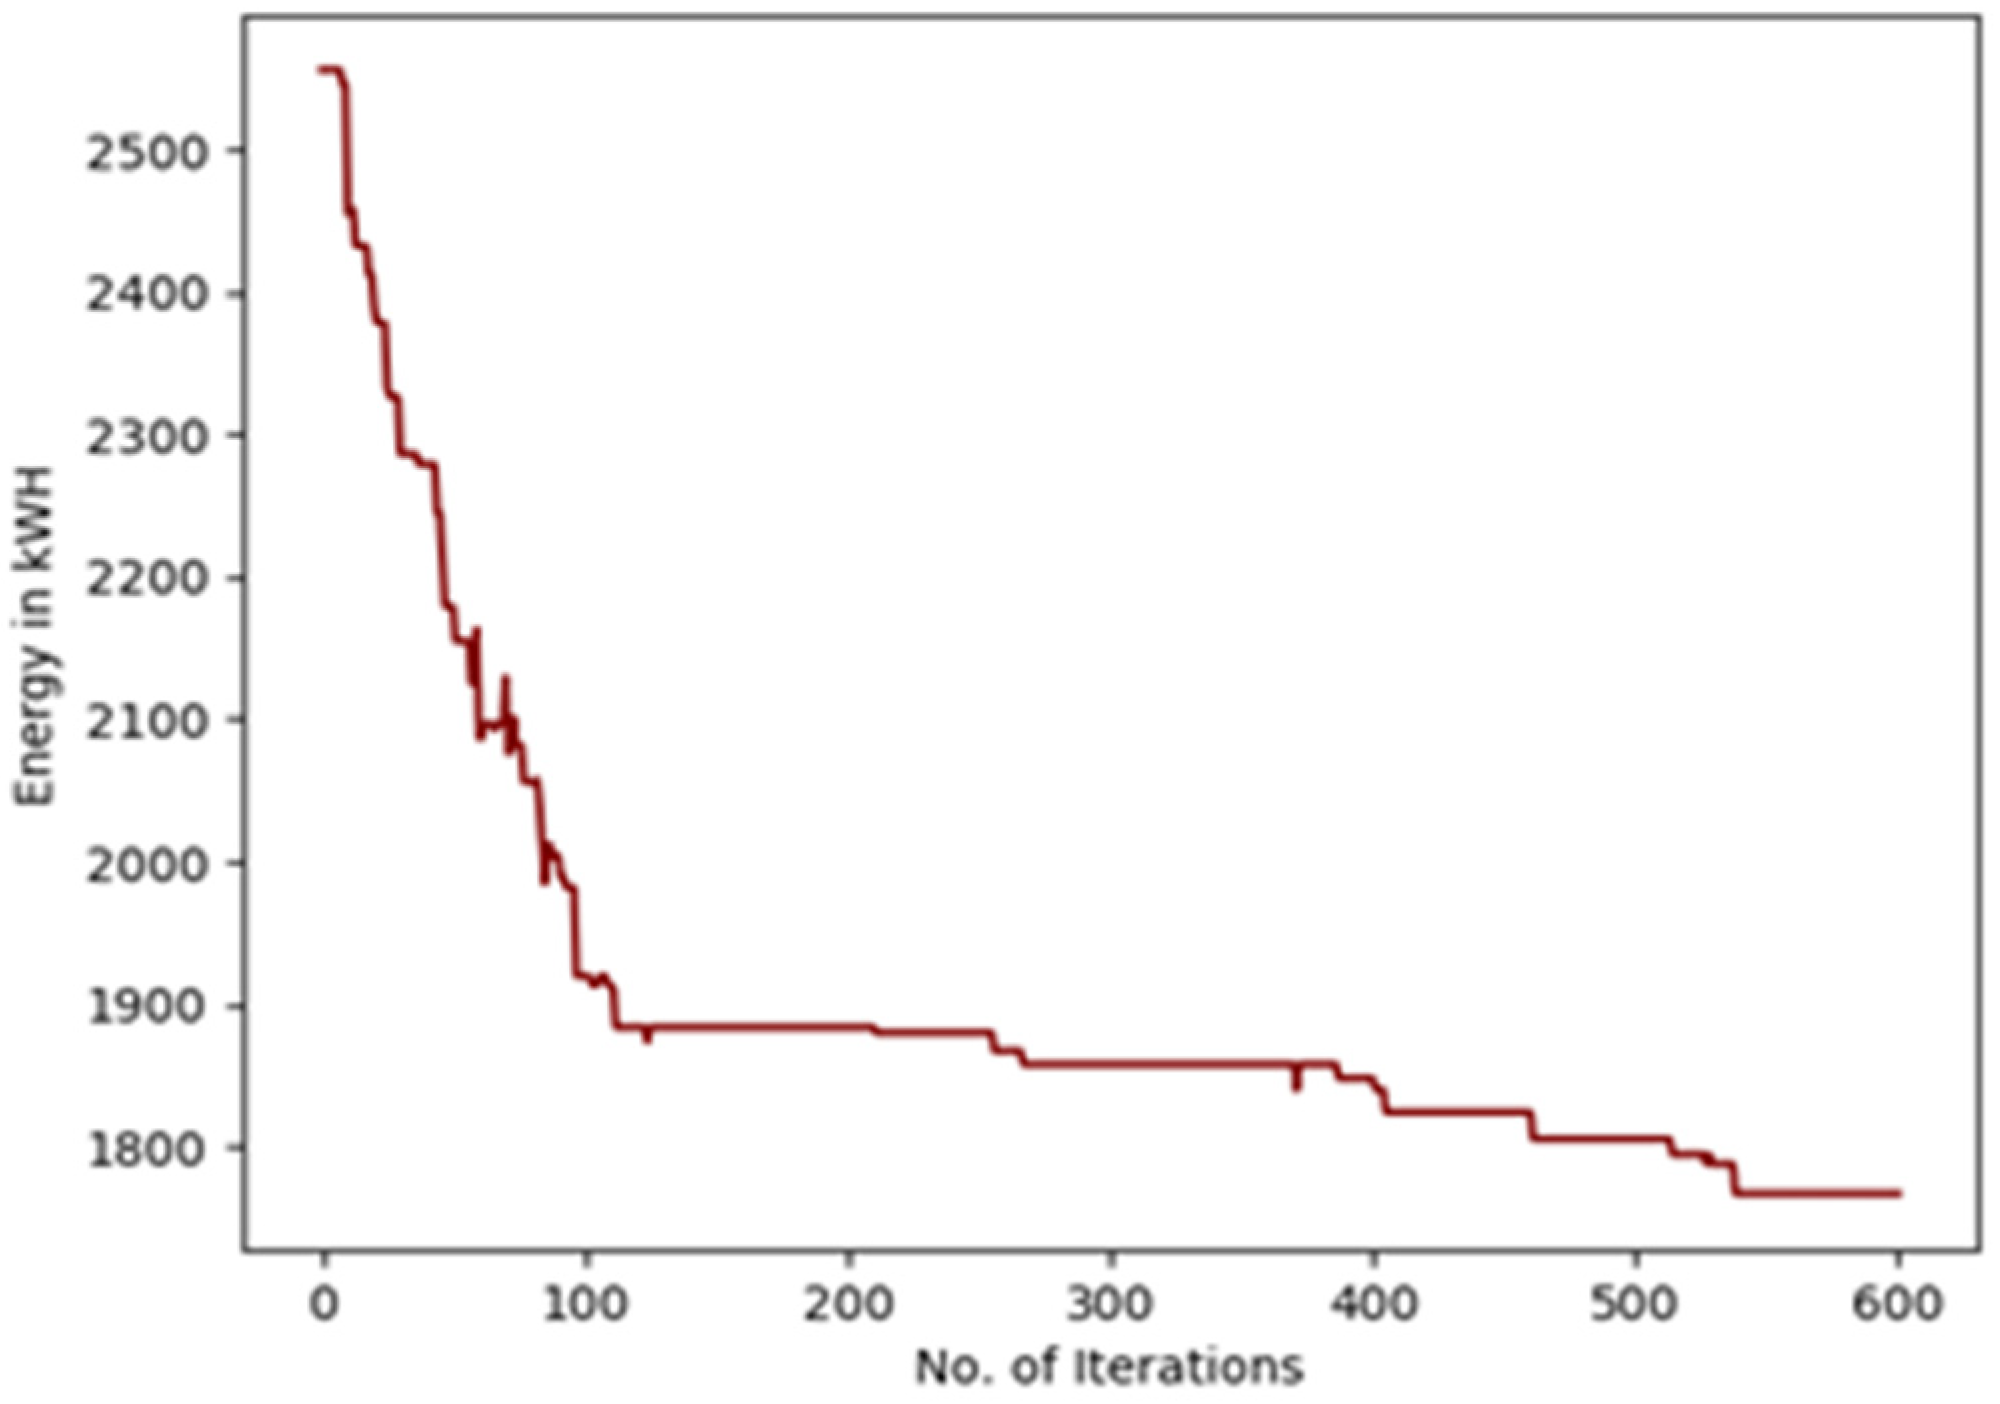
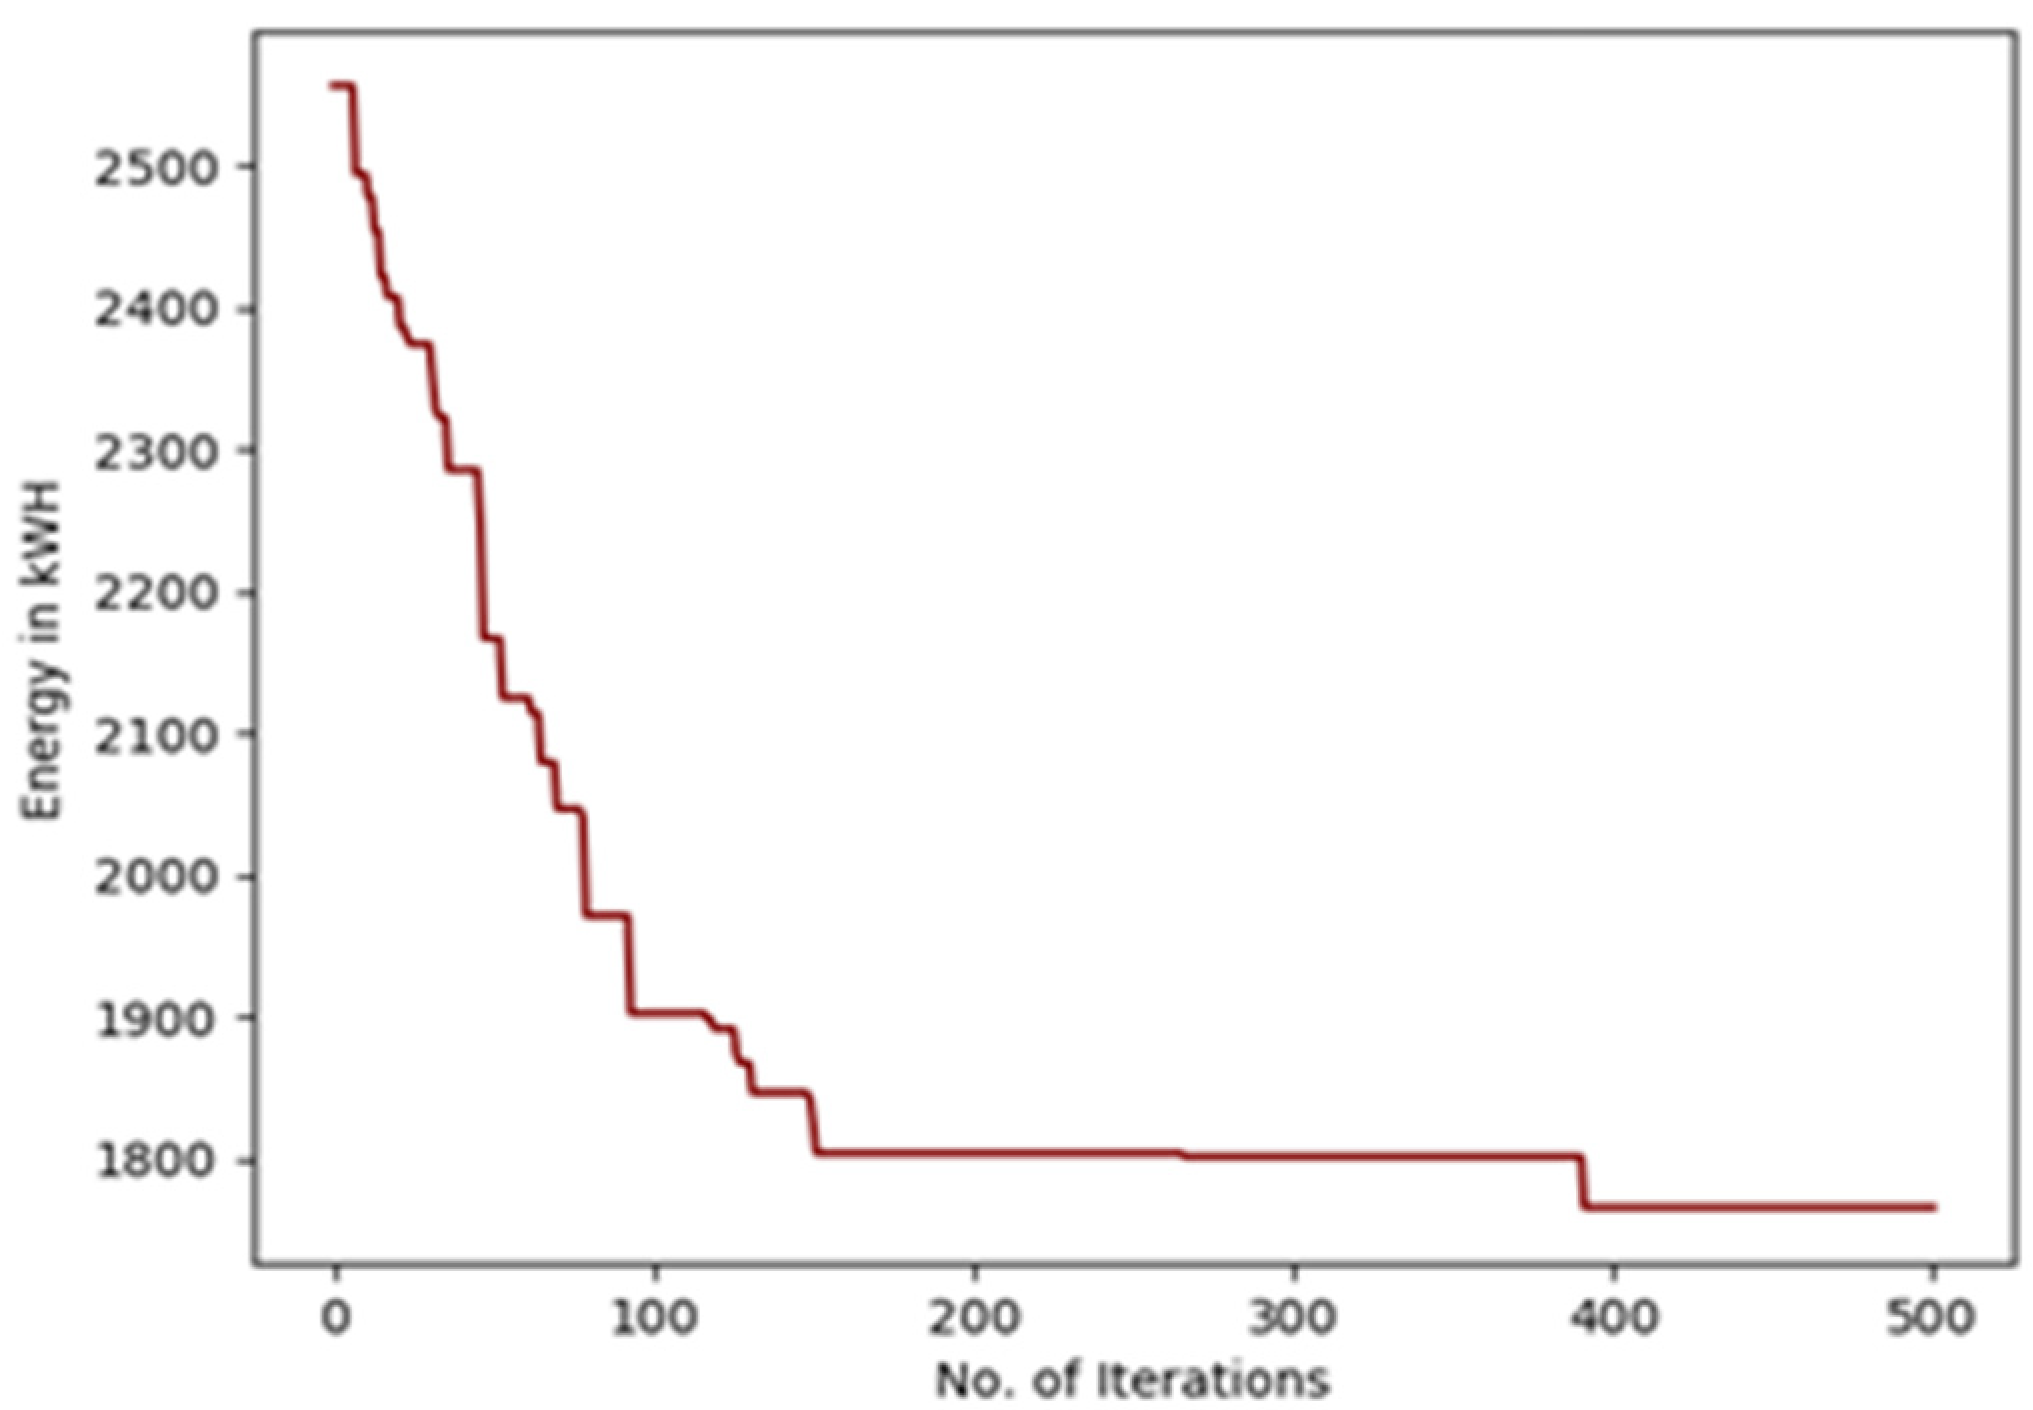
Figure 3, Figure 4 and Figure 5 show the results of the total energy consumed by the three trucks for each iteration.
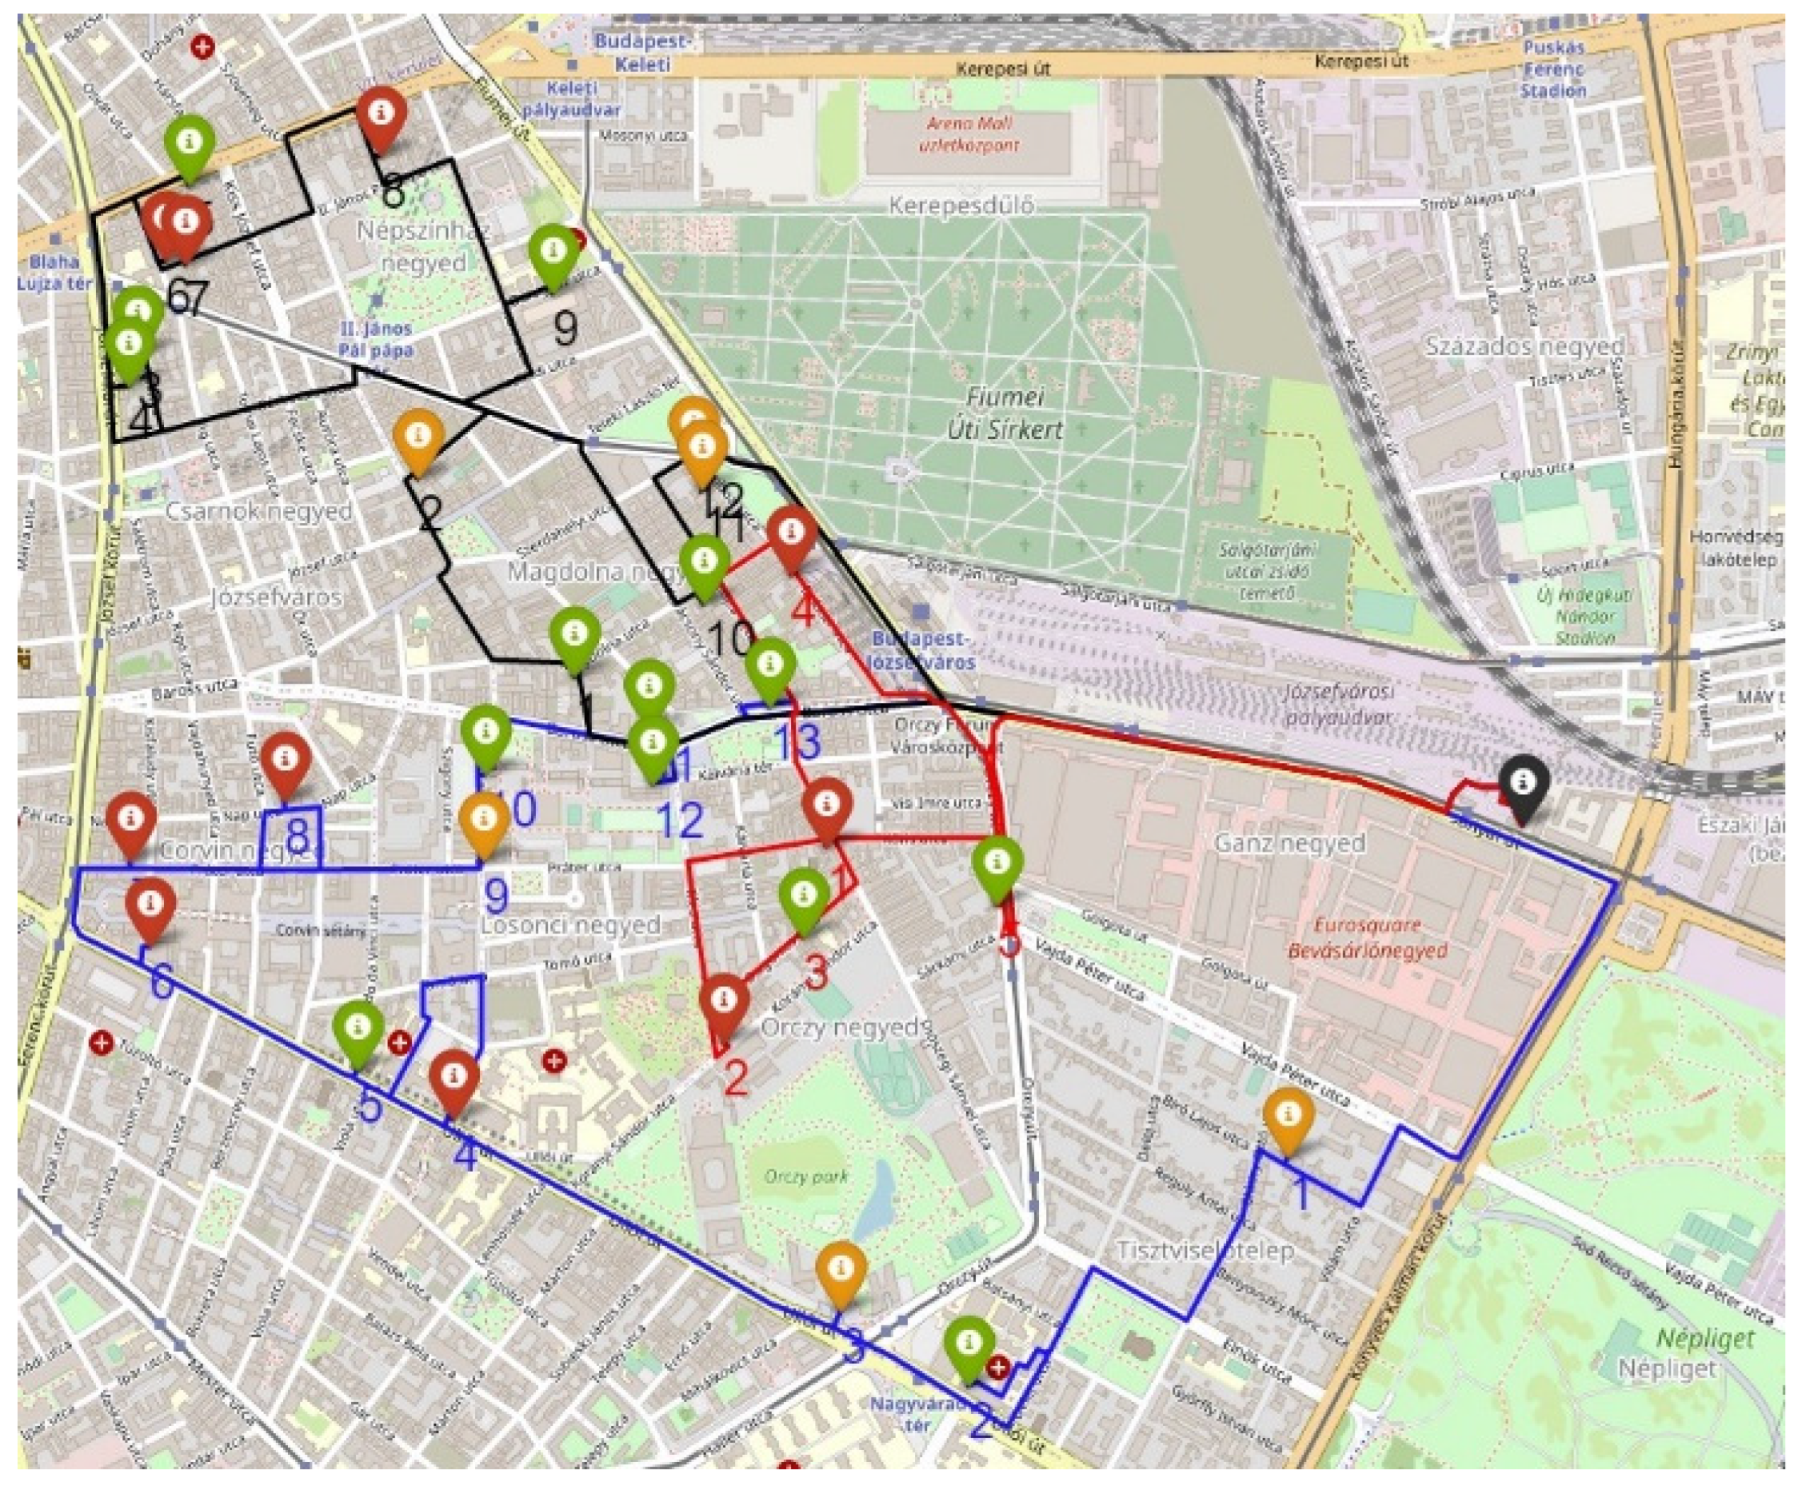
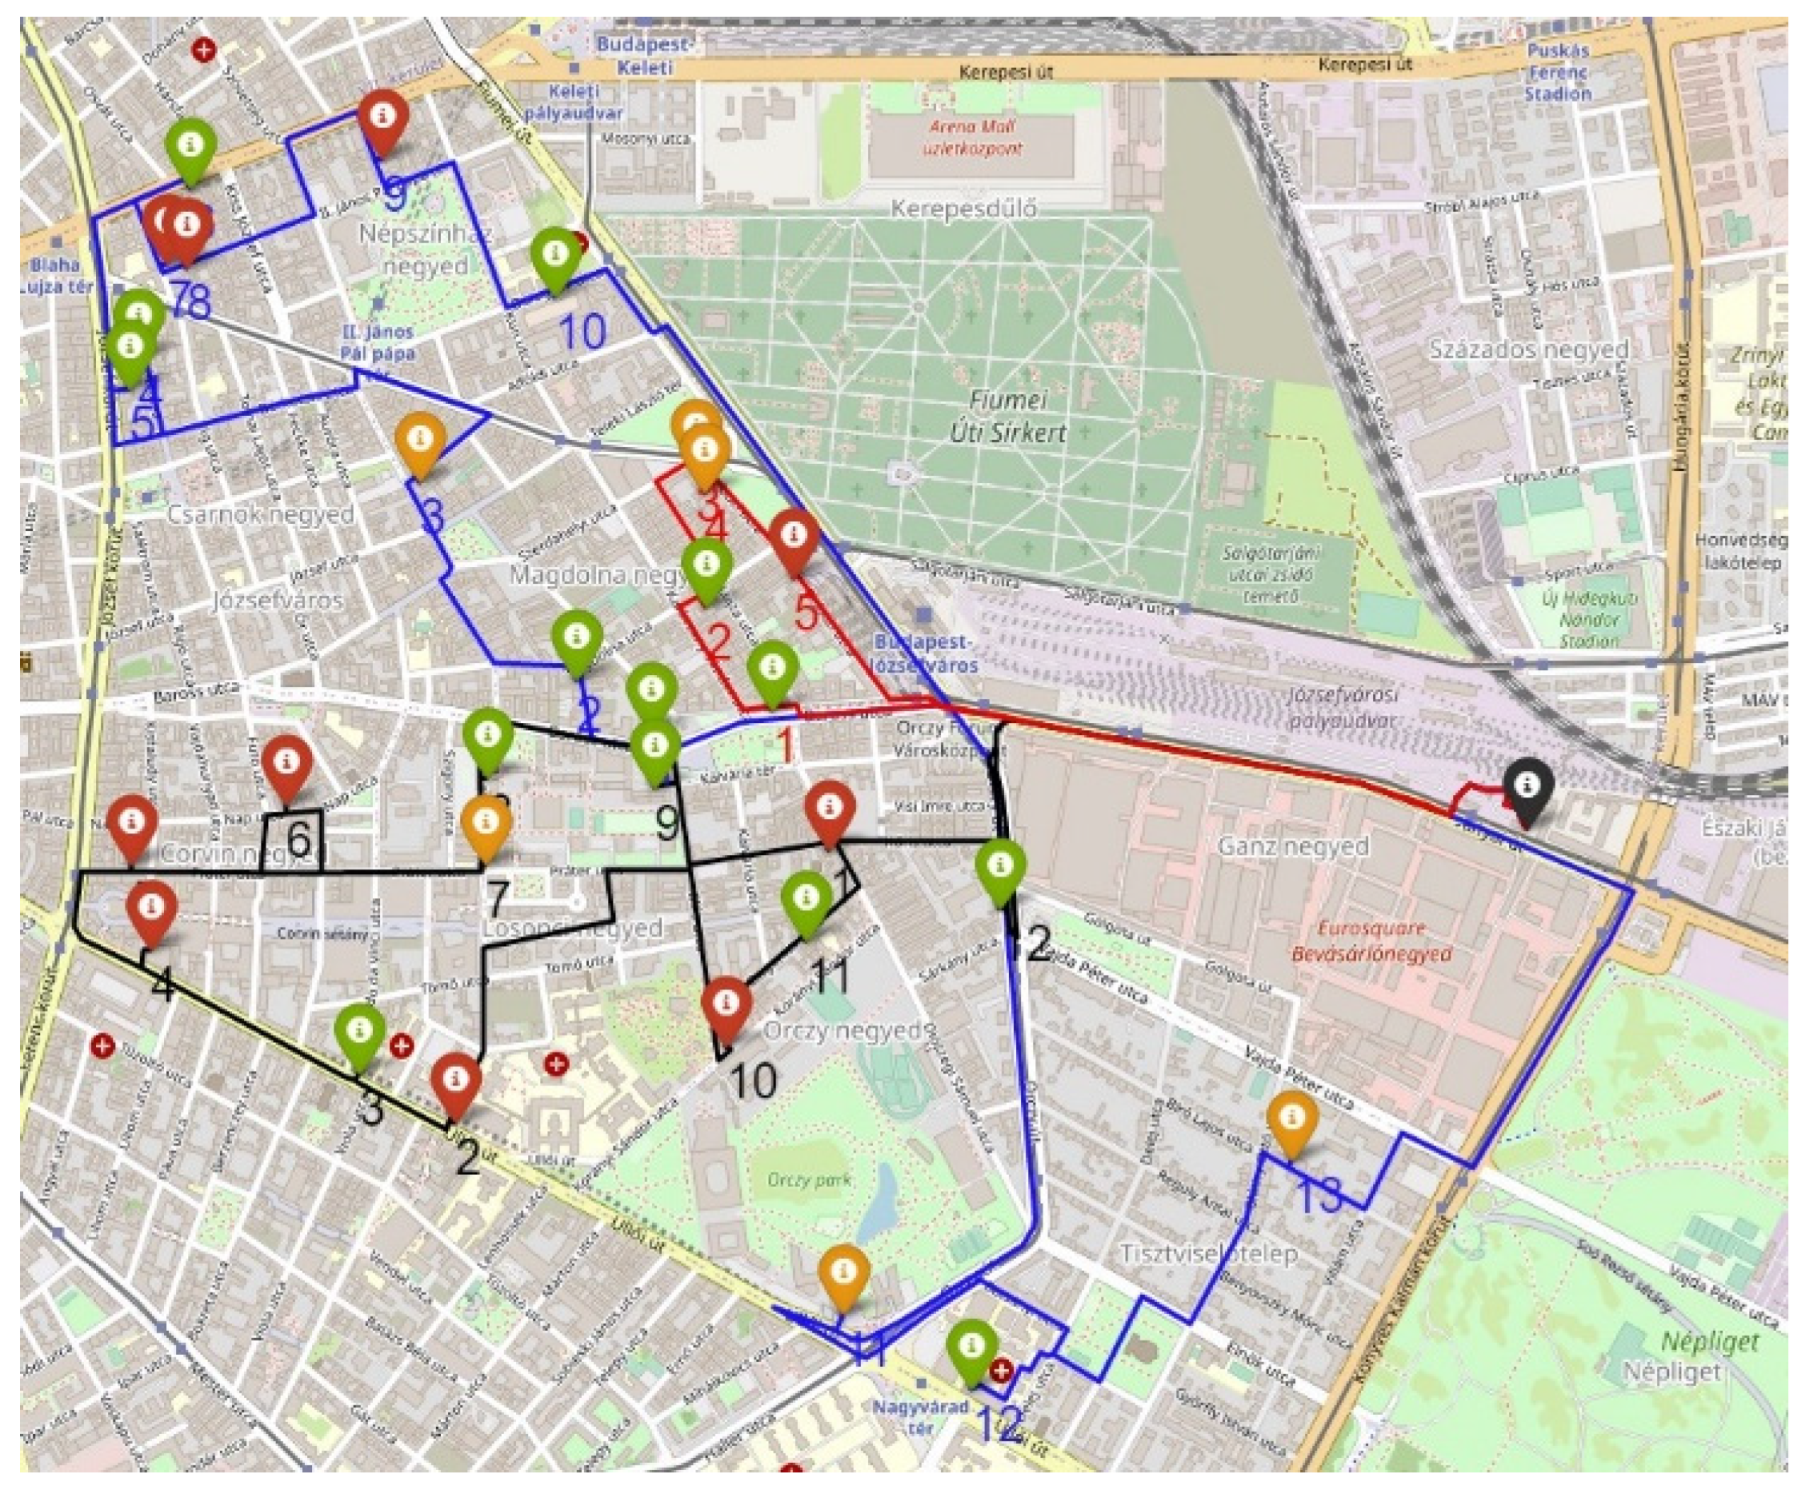
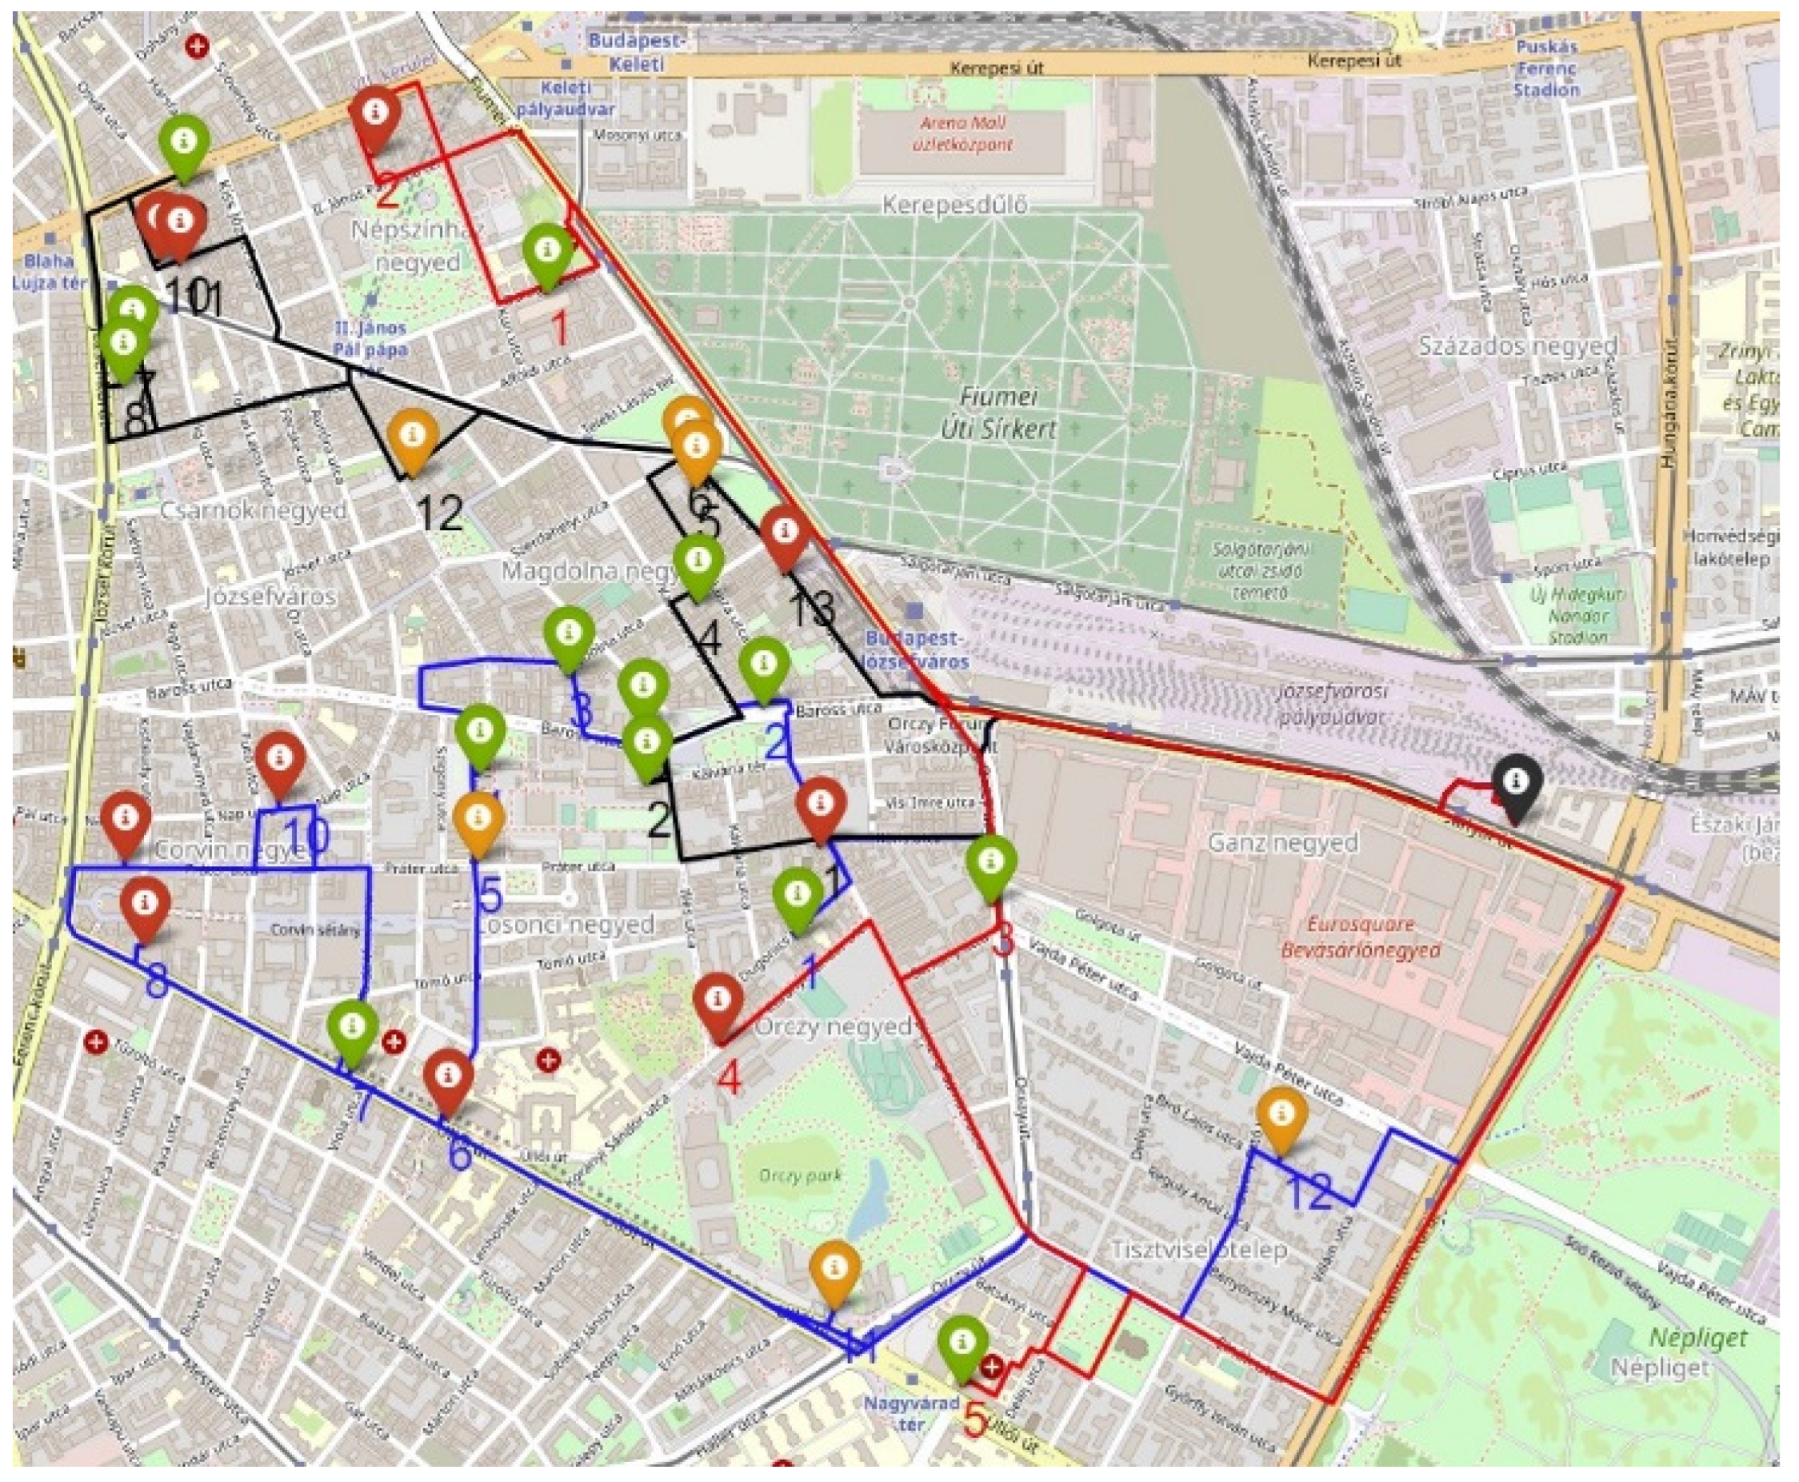
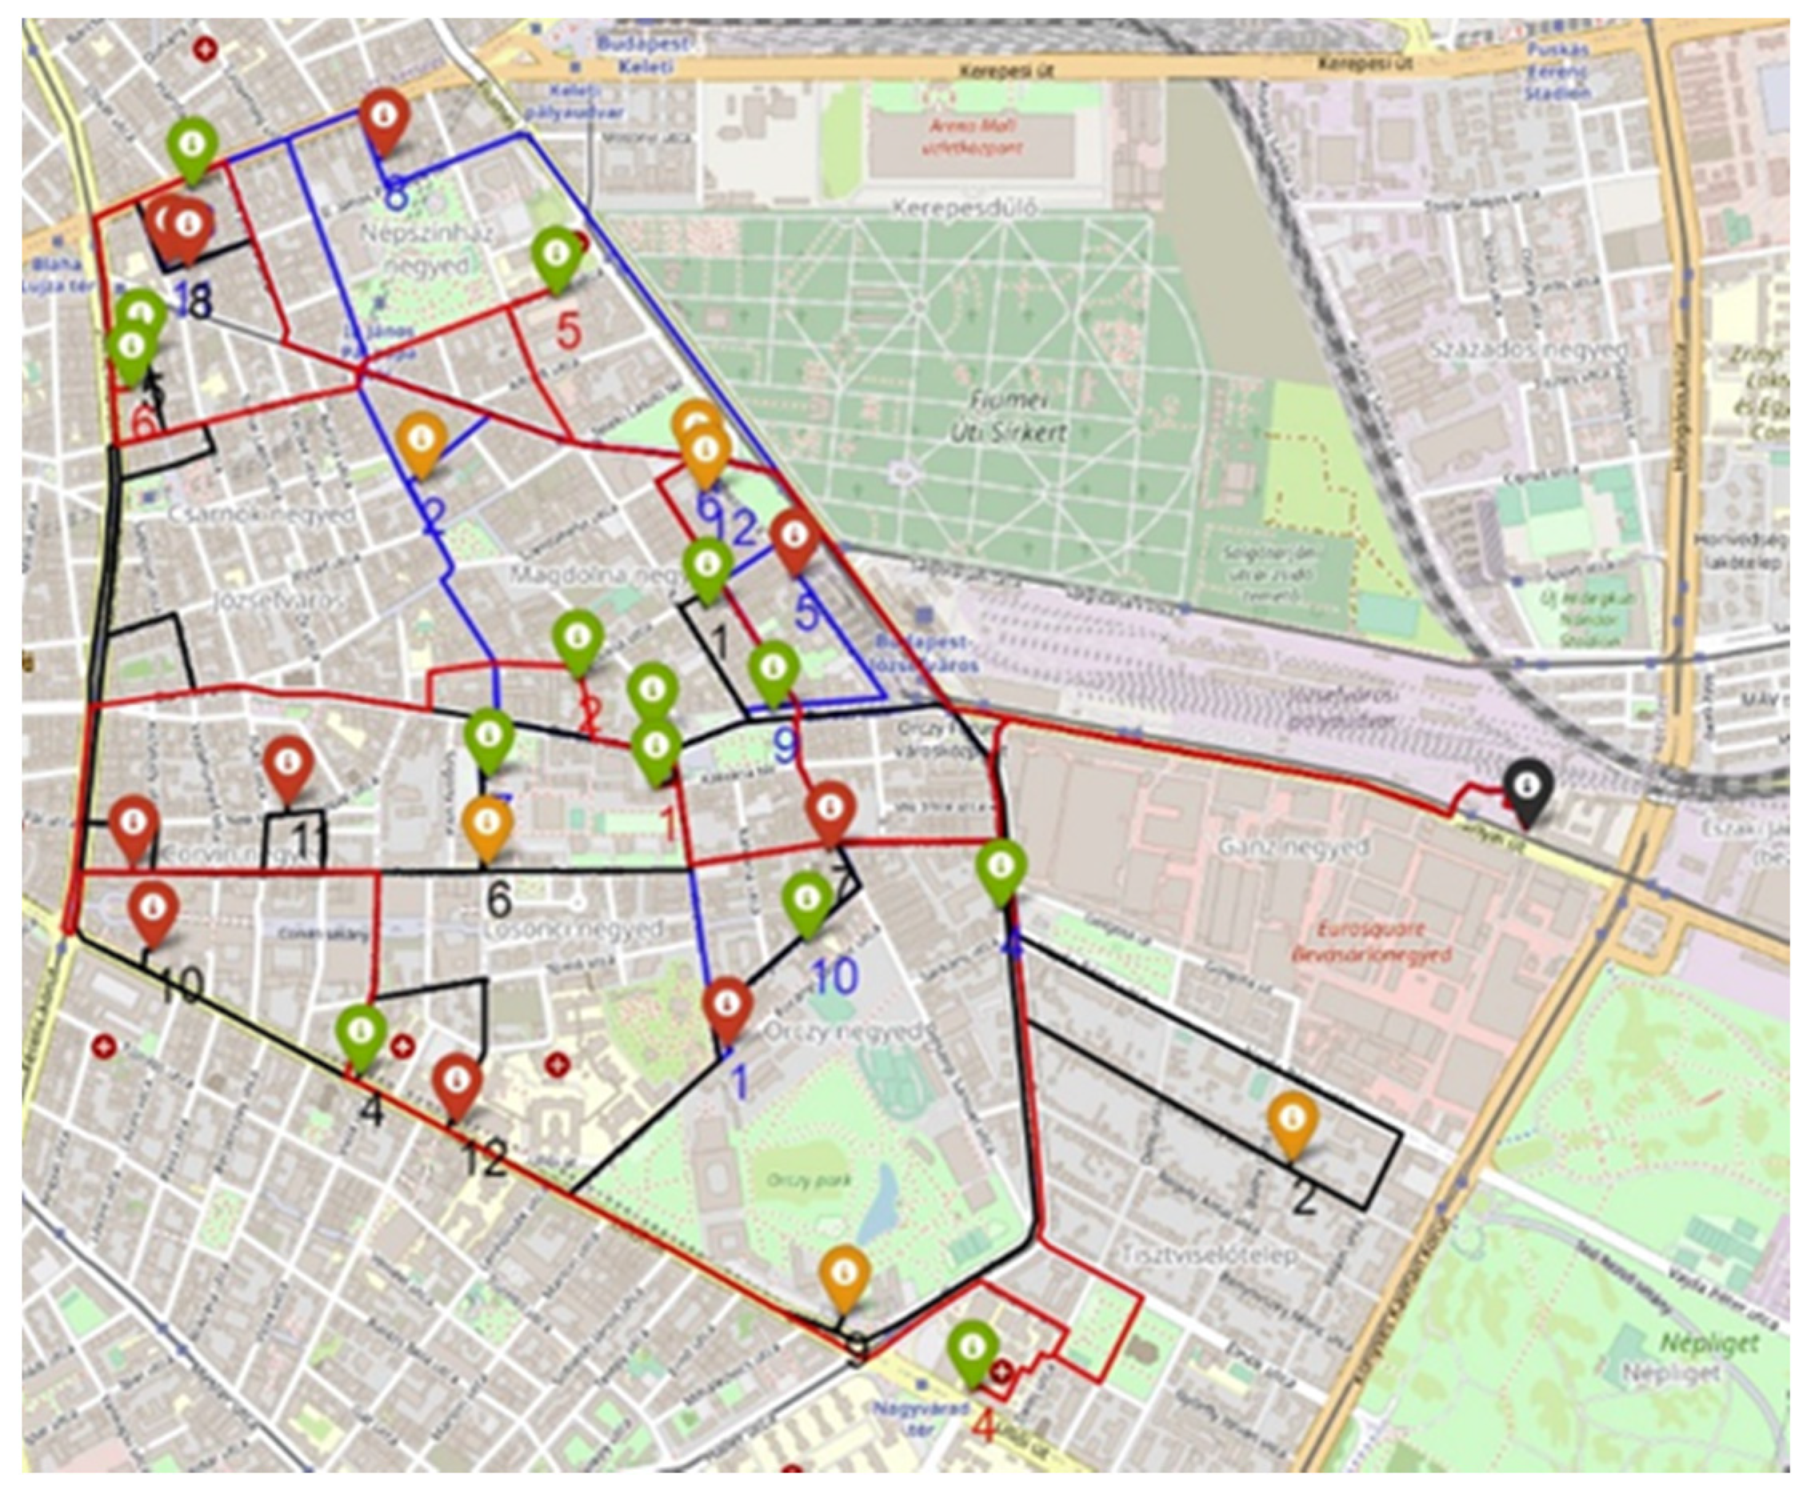
Figure 6, Figure 7 and Figure 8 show the actual routes taken by the three trucks when using the three algorithms next to a random solution without optimization. The black location represents the collection and transfer location where the trucks start from and return to. Green, orange, and red locations represent the smart bins, marking the waste percentage for each one. The three trucks’ lines are represented by blue, red, and black colors.
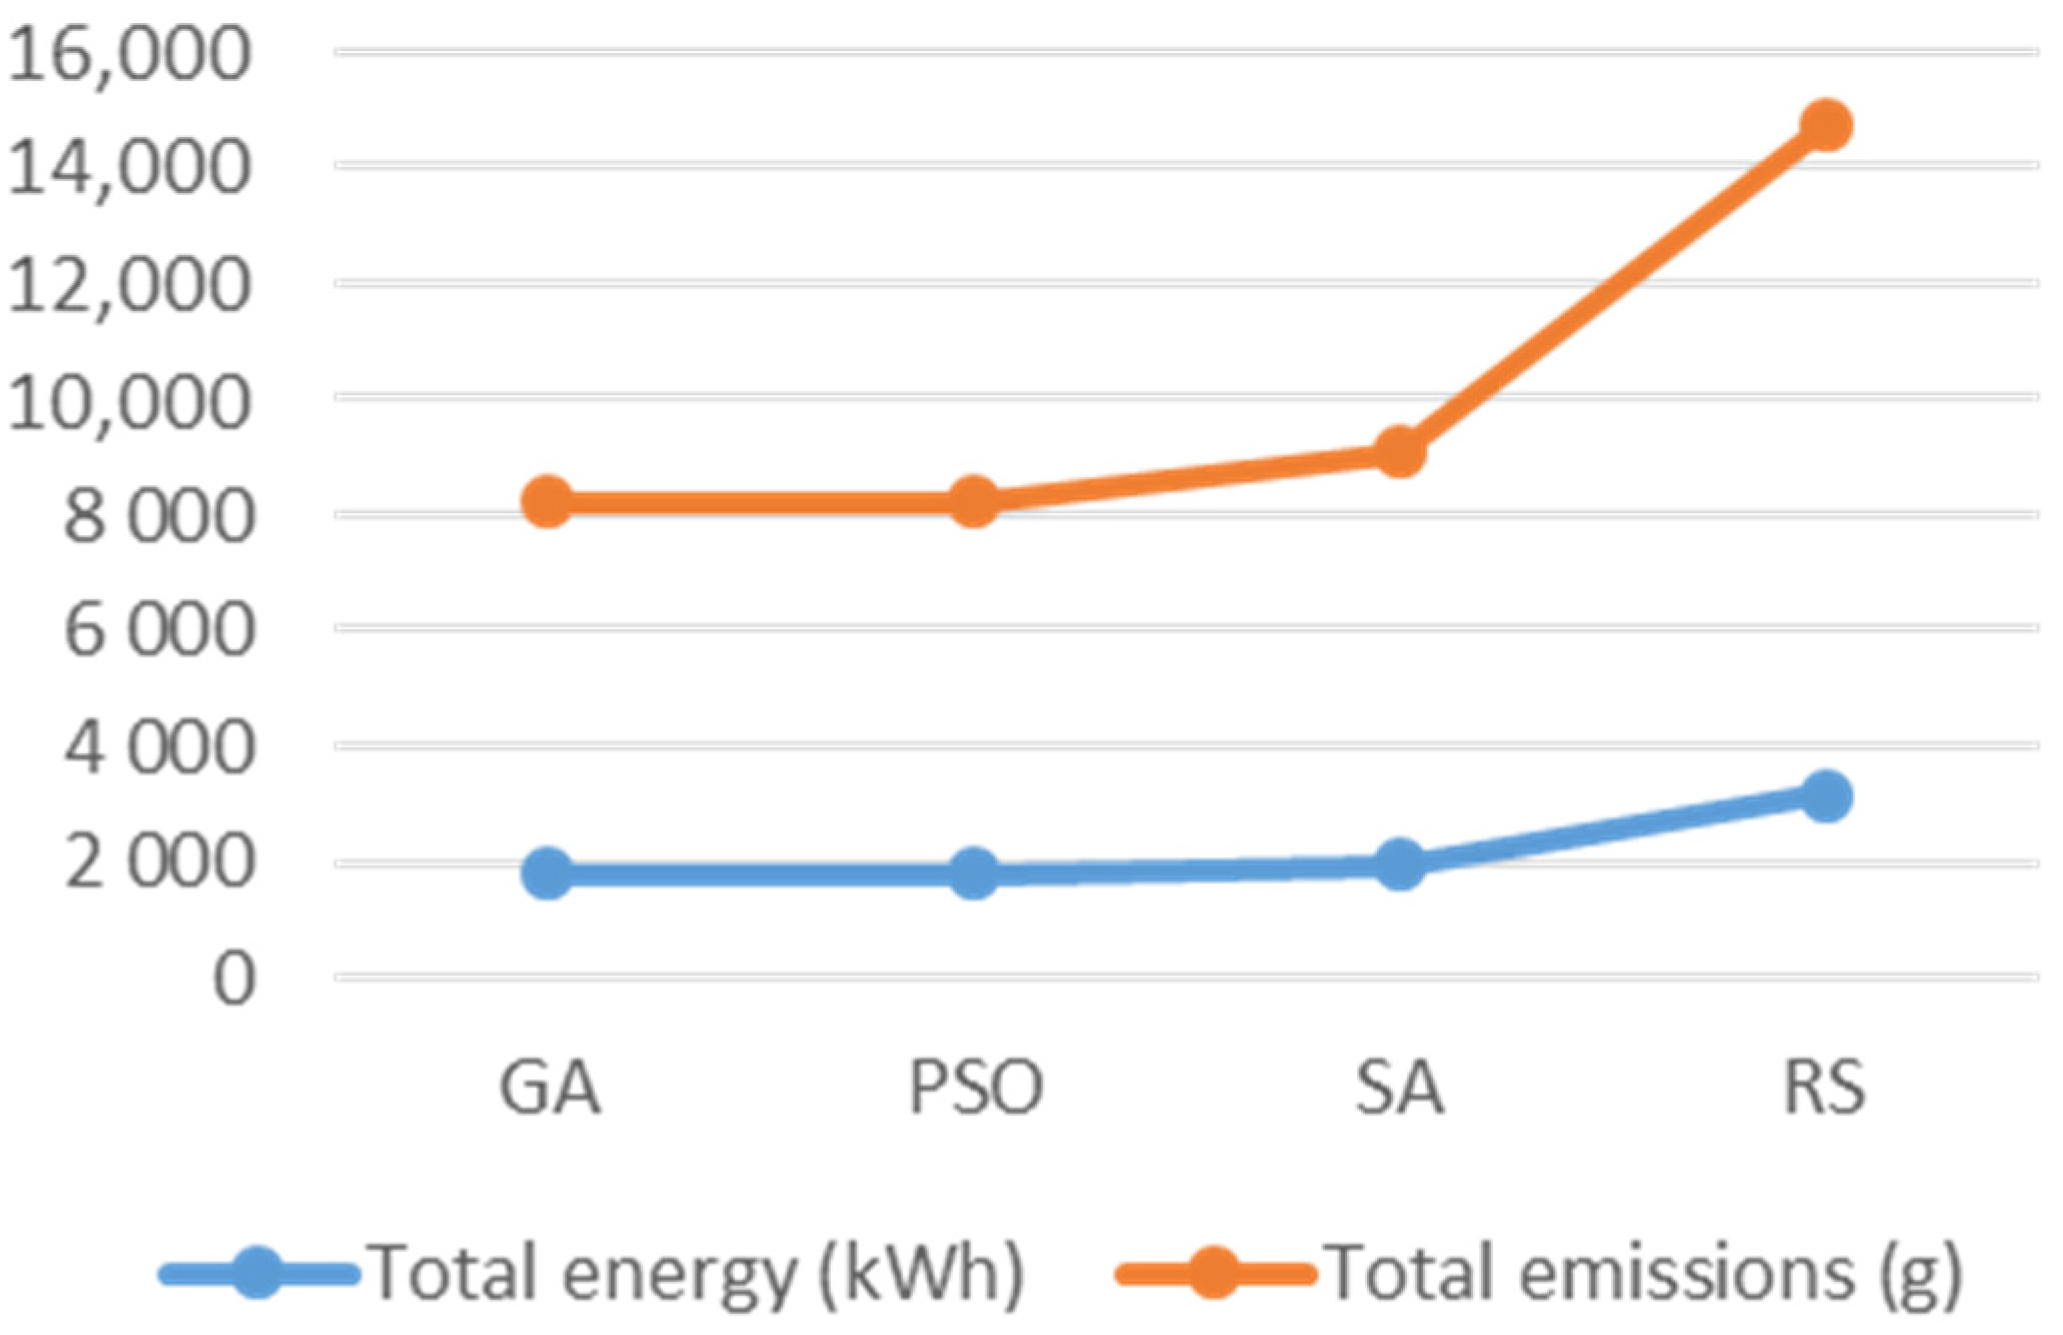
The random solution in Figure 9 shows many overlaps in the routes, which reflects the causes of its increase in results compared to the optimized results. Table 6 shows the estimated accrued emissions. Additionally, Figure 10 shows the total energy and emissions of the three optimized results and the random solution.
Among the three algorithms, GA demonstrated the best results. It achieved a 44.4% reduction in total consumed energy and emissions and a 58.5% decrease in the total distance compared to the random solution. PSO showed a similar reduction of 44.4% of total consumed energy and emissions and a 58.7% decrease in the total distance compared to the random solution. Although both GA and PSO achieved a similar reduction in consumed energy and emissions, GA was computationally faster; it saved a third of the total execution time. SA demonstrated a 38.4% reduction in total consumed energy and emissions and a 50.7% decrease in the total distance compared to the random solution. However, SA was much faster than both GA and PSO. In conclusion, GA achieved the best results, while SA achieved less optimized results with the shortest execution time.
5.2. Second Case of Twenty Smart Bins in Budapest
The execution time, the total consumed energy, and the total distances for this case are summarized in Table 7. Table 8 shows the estimated accrued emissions.
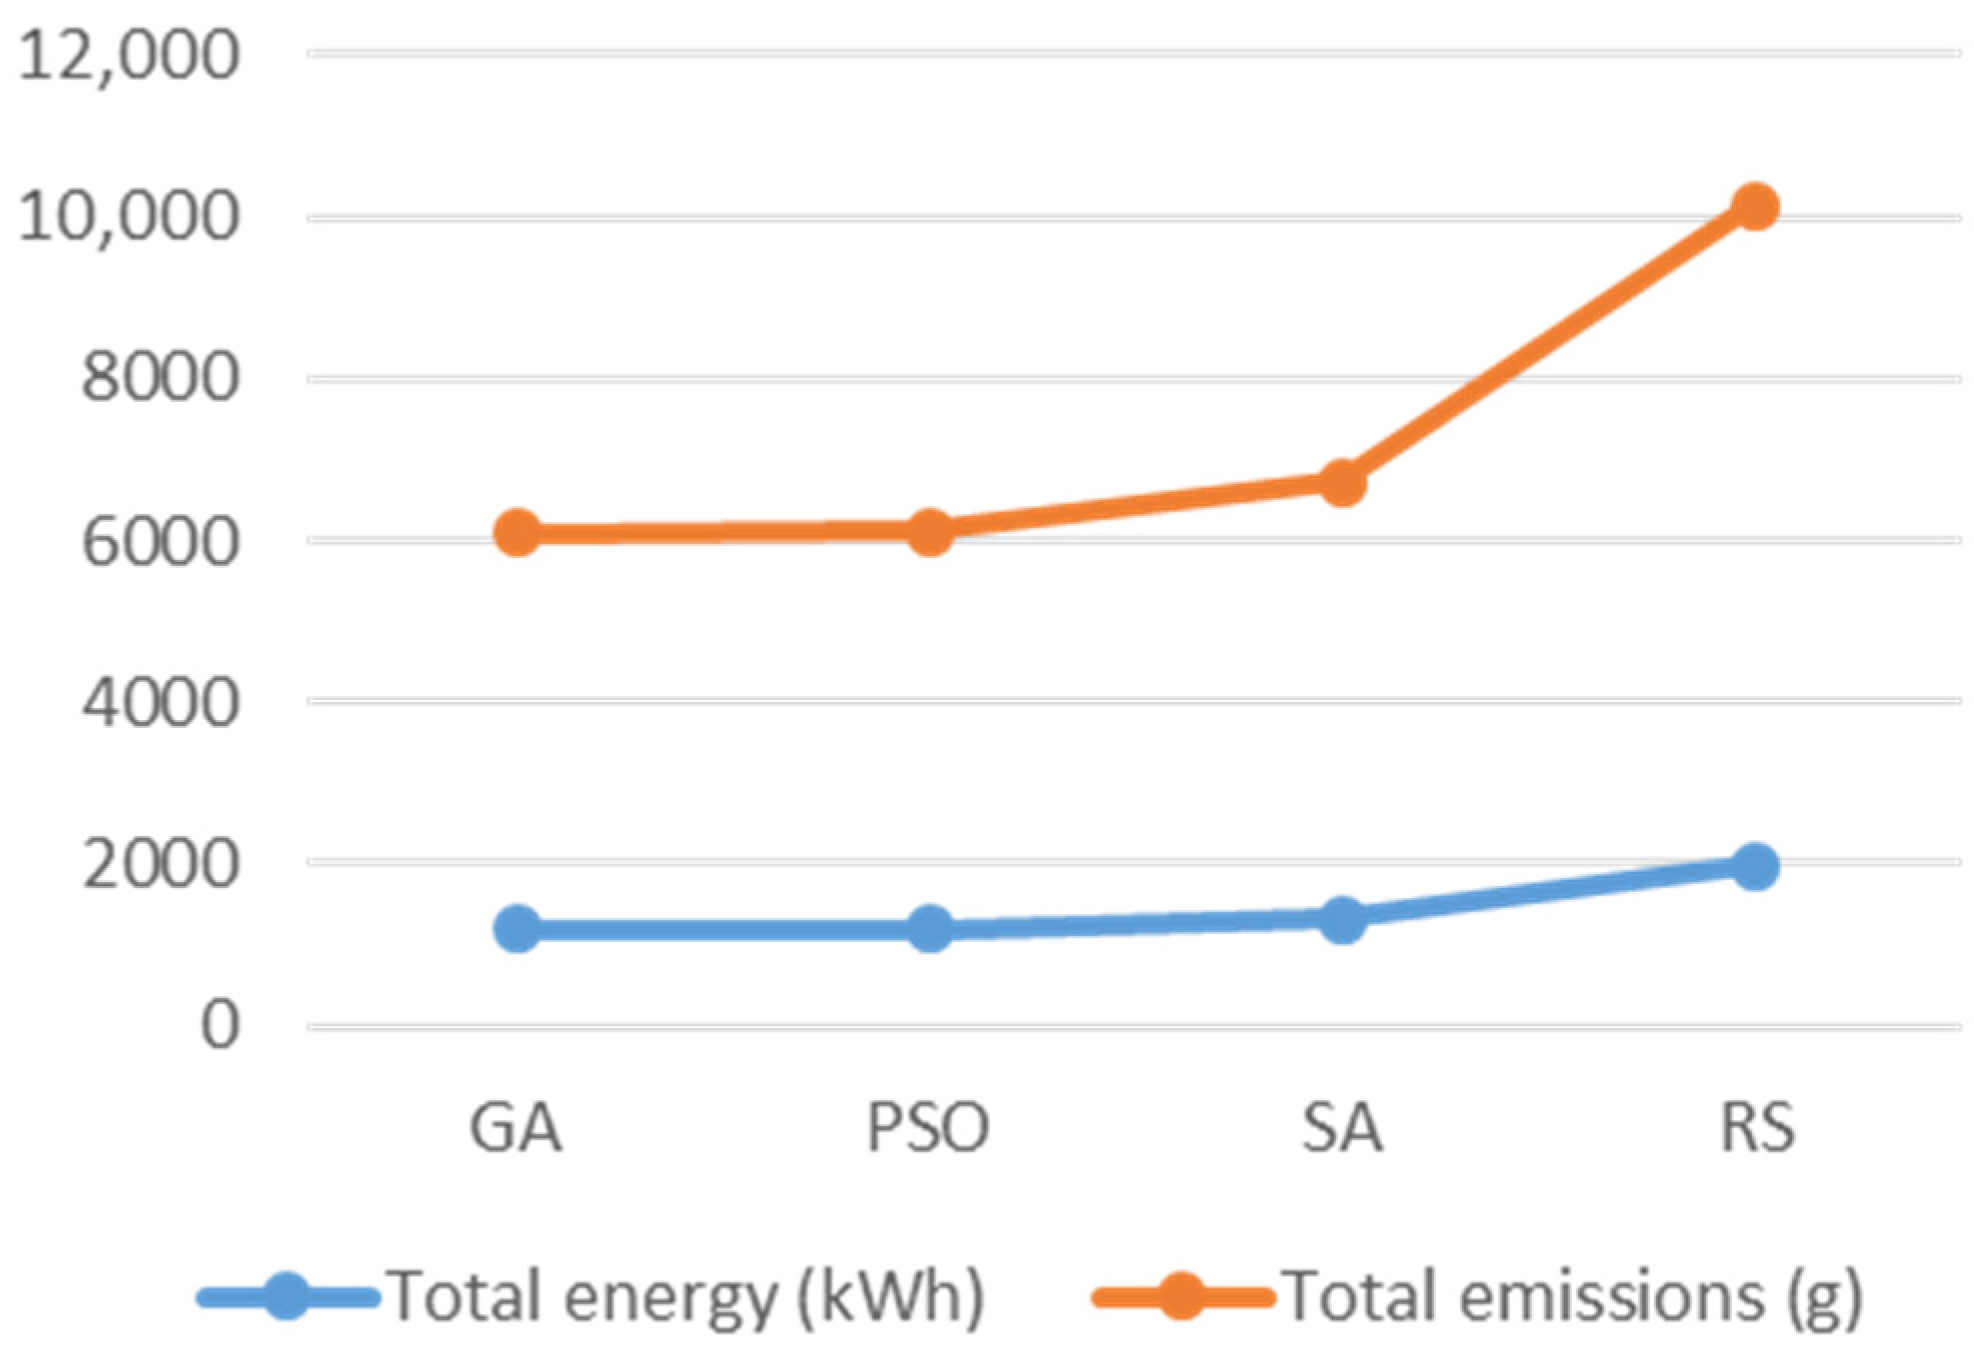
Figure 11 shows the total energy and emissions results.
Similar to the case of thirty bins, both GA and PSO achieved the best results in minimizing the total energy and emissions, with 39.8% and 39.7% decreases in total consumed energy and emissions compared to the random solution, respectively. Additionally, 53.6% and 53.3% decreases in total distance were shown compared to the random solution. SA showed a decrease of 33.59% in total consumed energy and emissions compared to the random solution and a decrease of 45.2% in total distance compared to the random solution. Moreover, SA was much faster in terms of execution time than both PSO and GA.
5.3. Discussion and Further Research
While the three algorithms showed great results in optimizing energy efficiency and raising sustainability, there was evident variation in the execution time in favor of SA. Therefore, SA is recommended to be used in situations where time efficiency is essential. Its speed of execution can be attributed to its simplicity. GA and PSO showed more optimized results than SA. The execution time was the longest in PSO in the first case, while it was the longest in GA in the second case. This difference may be explained due to the case’s data size. It is important to consider this, because it is possible to have a huge increase in the execution time for PSO in cases with big data sizes.
The designed system encompassed the following aspects: the IoT, smart bins with multi-percentage sensors, data and information analysis, vehicles’ actual routes, energy and emissions optimization, multi-echelon system, time windows, and flexibility. The system’s flexibility was demonstrated through the dynamic nature of the collection and transfer station’s tasks based on the given situation. For instance, this station can be used as a waste separation center. Therefore, this paper only dealt with the first echelon since the second echelon’s application may vary from one case to another. The mathematical modeling was detailed and developed to optimize the energy consumption. Using the actual routes made the results more realistic and factual than the traditional direct lines. Three metaheuristic algorithms were used to validate the mathematical modeling in two case studies in Budapest for energy consumption and emissions optimization. A comparison between the three results and a random solution next to the execution time was made.
Further research work is advised in four directions. First, the second echelon of the system should be modeled and validated, where the allocation of the collection and transfer station next to its tasks can be considered. Second, optimization is a continuous operation that does not stop at a specific point; therefore, improvements in the mathematical modeling and the used metaheuristic algorithms can be researched. Hybrid algorithms specifically showed promising results in other cases [20]. Third, using case studies with a bigger number of smart bins seems promising to gain more reliable results. For instance, there was a big difference in the PSO execution time between the two cases in this study. Fourth, electric vehicles can be directly adopted in this system; however, further research in this direction considering battery recharging stations is also promising.
6. Summary
Within this study, a cyber-physical waste management system was designed and described with a focus on its first echelon. The mathematical modeling of the mentioned system with its main considerations and constraints was developed and enhanced for the optimization of the total energy consumption. The results of the total optimized energy consumption were calculated for two case studies of thirty and twenty smart bins located randomly in the VIII District in Budapest by using three metaheuristic algorithms, GA, PSO, and SA, next to a random solution to compare the solutions and discuss their impact and effectiveness. Accrued emissions of CO, NMHC, CH4, NOx, and PM were calculated.
The results showed a big advantage in optimizing the total consumed energy and emissions with a reduction ranging between 33.59% and 44.4% compared to the random solution depending on the algorithm and study case used. In short, SA is recommended to be used when time efficiency is essential. GA and PSO showed more optimized results than SA. The execution time was the longest in PSO in the first case, while it was the longest in GA in the second case. This difference may be explained due to the case’s data size. It is important to consider this, because it is possible to have a huge increase in the execution time for PSO in cases with big data sizes.
Author Contributions
Conceptualization, M.Z.A. and T.B.; methodology, M.Z.A. and T.B.; software, M.Z.A. and S.H.; validation, M.Z.A. and S.H.; formal analysis, M.Z.A., T.B., and S.H.; investigation, M.Z.A. and S.H.; resources, M.Z.A. and T.B.; data curation, M.Z.A. and S.H.; writing—original draft preparation, M.Z.A.; writing—review and editing, M.Z.A. and T.B.; visualization, M.Z.A.; supervision, T.B.; funding acquisition, T.B. All authors have read and agreed to the published version of the manuscript.
Funding
This research received no external funding.
Institutional Review Board Statement
Not applicable.
Informed Consent Statement
Not applicable.
Data Availability Statement
Not applicable.
Acknowledgments
This work is supported by the ÚNKP-21-3 new national excellence program of the ministry for innovation and technology from the source of the national research, development and innovation fund.
Conflicts of Interest
The authors declare no conflict of interest.
References
- Ghiani, G.; Laganà, D.; Manni, E.; Musmanno, R.; Vigo, D. Operations research in solid waste management: A survey of strategic and tactical issues. Comput. Oper. Res. 2014, 44, 22–32. [Google Scholar] [CrossRef]
- Dobos, P.; Tamás, P.; Illés, B.; Balogh, R. Application possibilities of the Big Data concept in Industry 4.0. IOP Conf. Ser. Mater. Sci. Eng. 2018, 448, 012011. [Google Scholar] [CrossRef]
- Euchi, J.; Kallel, A. Internalization of external congestion and CO2 emissions costs related to road transport: The case of Tunisia. Renew. Sustain. Energy Rev. 2021, 142, 110858. [Google Scholar] [CrossRef]
- Chen, X.; Despeisse, M.; Johansson, B. Environmental sustainability of digitalization in manufacturing: A review. Sustainability 2020, 12, 10298. [Google Scholar] [CrossRef]
- Ahmed, A.A.; Nazzal, M.A.; Darras, B.M. Cyber-Physical Systems as an Enabler of Circular Economy to Achieve Sustainable Development Goals: A Comprehensive Review. Int. J. Precis. Eng. Manuf. Green Technol. 2021, 1–21. [Google Scholar] [CrossRef]
- Thiede, S. Environmental Sustainability of Cyber Physical Production Systems. Procedia CIRP 2018, 69, 644–649. [Google Scholar] [CrossRef]
- Fallavi, K.N.; Ravi Kumar, V.; Chaithra, B.M. Smart Waste Management Using Internet of Things: A Survey. In Proceedings of the International Conference on IoT in Social, Mobile, Analytics and Cloud, I-SMAC, Palladam, India, 10–11 February 2017; Institute of Electrical and Electronics Engineers Inc.: Palladam, India, 2017; pp. 60–64. [Google Scholar] [CrossRef]
- Cerchecci, M.; Luti, F.; Mecocci, A.; Parrino, S.; Peruzzi, G.; Pozzebon, A. A low power IoT sensor node architecture for waste management within smart cities context. Sensors 2018, 18, 1282. [Google Scholar] [CrossRef] [PubMed] [Green Version]
- Ahmad, S.; Imran, J.F.; Iqbal, N.; Kim, D. Optimal route recommendation for waste carrier vehicles for efficient waste collection: A step forward towards sustainable cities. IEEE Access 2020, 8, 77875–77887. [Google Scholar] [CrossRef]
- Jatinkumar Shah, P.; Anagnostopoulos, T.; Zaslavsky, A.; Behdad, S. A stochastic optimization framework for planning of waste collection and value recovery operations in smart and sustainable cities. Waste Manag. 2018, 78, 104–114. [Google Scholar] [CrossRef] [PubMed]
- Akbarpour, N.; Salehi-Amiri, A.; Hajiaghaei-Keshteli, M.; Oliva, D. An innovative waste management system in a smart city under stochastic optimization using vehicle routing problem. Soft Comput. 2021, 25, 6707–6727. [Google Scholar] [CrossRef]
- Rossit, D.G.; Toncovich, A.A.; Fermani, M.; Rossit, D.G.; Toncovich, A.A.; Fermani, M. Routing in waste collection: A simulated annealing algorithm for an Argentinean case study. Math. Biosci. Eng. 2021, 18, 9579–9605. [Google Scholar] [CrossRef] [PubMed]
- Ramos, T.R.P.; de Morais, C.S.; Barbosa-Póvoa, A.P. The smart waste collection routing problem: Alternative operational management approaches. Expert Syst. Appl. 2018, 103, 146–158. [Google Scholar] [CrossRef] [Green Version]
- Hannan, M.A.; Begum, R.A.; Al-Shetwi, A.Q.; Ker, P.J.; al Mamun, M.A.; Hussain, A.; Basri, H.; Mahlia, T.M.I. Waste collection route optimisation model for linking cost saving and emission reduction to achieve sustainable development goals. Sustain. Cities Soc. 2020, 62, 102393. [Google Scholar] [CrossRef]
- Akhtar, M.; Hannan, M.A.; Begum, R.A.; Basri, H.; Scavino, E. Backtracking search algorithm in CVRP models for efficient solid waste collection and route optimization. Waste Manag. 2017, 61, 117–128. [Google Scholar] [CrossRef] [PubMed]
- Euchi, J.; Yassine, A. A hybrid metaheuristic algorithm to solve the electric vehicle routing problem with battery recharging stations for sustainable environmental and energy optimization. Energy Syst. 2022, 1–25. [Google Scholar] [CrossRef]
- Erdinç, O.; Yetilmezsoy, K.; Erenoğlu, A.K.; Erdinç, O. Route optimization of an electric garbage truck fleet for sustainable environmental and energy management. J. Clean. Prod. 2019, 234, 1275–1286. [Google Scholar] [CrossRef]
- Akkad, M.Z.; Bányai, T. Cyber-Physical Waste Collection System: A Logistics Approach. In Solutions for Sustainable Development, Proceedings of the 1st International Conference on Engineering Solutions for Sustainable Development, ICES2D 2019, Miskolc, Hungary, 3–4 October 2019; CRC Press: Boca Raton, FL, USA, 2020; pp. 160–168. [Google Scholar]
- Openrouteservice. Available online: https://openrouteservice.org/ (accessed on 14 February 2022).
- Akkad, M.Z.; Bányai, T. Analytical Review on the Modern Optimization Algorithms in Logistics. Adv. Logist. Syst. Theory Pract. 2020, 14, 25–31. [Google Scholar] [CrossRef]
- Wang, K.P.; Huang, L.; Zhou, C.G.; Pang, W. Particle swarm optimization for traveling salesman problem. In Proceedings of the 2003 International Conference on Machine Learning and Cybernetics (IEEE Cat. No.03EX693), Xi’an, China, 5 November 2003. [Google Scholar] [CrossRef]
- Akkad, M.Z.; Bányai, T. Multi-objective approach for optimization of city logistics considering energy efficiency. Sustainability 2020, 12, 7366. [Google Scholar] [CrossRef]
- Ai, T.J.; Kachitvichyanukul, V. Particle swarm optimization and two solution representations for solving the capacitated vehicle routing problem. Comput. Ind. Eng. 2009, 56, 380–387. [Google Scholar] [CrossRef]
- Mohammad, Z.H.I.; Ramli, F. Capacitated Arc Routing Problem with Time Window. 2008, pp. 25–34. Available online: https://core.ac.uk/download/pdf/11792158.pdf (accessed on 12 February 2022).
- De Maio, A.; Laganà, D.; Musmanno, R.; Vocaturo, F. Arc routing under uncertainty: Introduction and literature review. Comput. Oper. Res. 2021, 135, 105442. [Google Scholar] [CrossRef]
- Emission Standards: Europe: Heavy-Duty Truck and Bus Engines. Available online: https://dieselnet.com/standards/eu/hd.php (accessed on 14 February 2022).
Figure 1.
Cyber-physical waste management system scheme.

Figure 2.
Information and waste flow.

Figure 3.
Total energy consumed by the three trucks (GA).

Figure 4.
Total energy consumed by the three trucks (PSO).

Figure 5.
Total energy consumed by the three trucks (SA).

Figure 6.
Actual routes when using GA.

Figure 7.
Actual routes when using PSO.

Figure 8.
Actual routes when using SA.

Figure 9.
Actual routes when using a random solution.

Figure 10.
Total energy and emissions of the case of thirty bins.

Figure 11.
Total energy and emissions of the case of twenty bins.


Table 1.
Mathematical notations used.
| Mathematical Notation | Description |
|---|---|
| The total number of smart bins. | |
| The total number of trucks. | |
| The set of indices representing all trucks. | |
| The set of indices representing all smart bins. | |
| Two arbitrary indices, each of which denotes a smart bin. | |
| An arbitrary index that denotes a truck. | |
| A non-negative value that represents the waste quantity of bin . | |
| A non-negative value that represents the truck waste load after moving from bin . | |
| A non-negative value that represents the waste load amount picked up by truck when moving from bin to bin . | |
| C | The maximum waste capacity of the truck. |
| The maximum waste loading capacity of the truck. | |
| The maximum allocated time span for the whole waste collection process. | |
| The taken time by truck to complete its assigned route and return to the collection and transfer station. | |
| The maximum waste capacity for the smart bin. | |
| A decision variable is defined as 1 if vehicle moves from bin to bin , and 0 otherwise. | |
| A decision variable is defined as 1 if bin belongs to the route of vehicle , and 0 otherwise. | |
| The energy consumption of all transportation processes. | |
| The energy consumption of all waste loading operations. | |
| The total energy consumption of the system. | |
| The specific fuel consumption of the transportation process for truck after moving from bin . | |
| The specific fuel consumption of material handling operations for truck at bin . | |
| The lower bound for the specific fuel consumption of material handling operations. | |
| The upper bound for the specific fuel consumption of material handling operations. | |
| The lower bound for the specific fuel consumption of the transportation process. | |
| The upper bound for the specific fuel consumption of the transportation process. |
Table 2.
EU VI emission standards for heavy-duty and transit testing in g/kWh.
| CO | NMHC | CH4 | NOx | PM |
|---|---|---|---|---|
| 4 | 0.16 | 0.5 | 0.46 | 0.01 |
Table 3.
Truck specifications.
| 41 kWh/km | 52 kWh/km | 25 kWh | 37 kWh | 200 kg |
Table 4.
Bins’ locations and waste amounts.
| ID | Latitude | Longitude | Waste Amount |
|---|---|---|---|
| 0 | 47.487448 | 19.105228 | - |
| 1 | 47.483984 | 19.085934 | 98 kg |
| 2 | 47.492993 | 19.078542 | 75 kg |
| 3 | 47.497693 | 19.072976 | 66 kg |
| 4 | 47.48618 | 19.092511 | 70 kg |
| 5 | 47.491468 | 19.087551 | 99 kg |
| 6 | 47.493208 | 19.085197 | 79 kg |
| 7 | 47.488254 | 19.080151 | 67 kg |
| 8 | 47.49816 | 19.077611 | 97 kg |
| 9 | 47.489349 | 19.087007 | 73 kg |
| 10 | 47.485646 | 19.08784 | 66 kg |
| 11 | 47.496471 | 19.072441 | 94 kg |
| 12 | 47.49282 | 19.085386 | 78 kg |
| 13 | 47.490987 | 19.085437 | 72 kg |
| 14 | 47.482154 | 19.09956 | 75 kg |
| 15 | 47.488997 | 19.084106 | 54 kg |
| 16 | 47.483539 | 19.077086 | 65 kg |
| 17 | 47.494968 | 19.071751 | 69 kg |
| 18 | 47.486889 | 19.080102 | 89 kg |
| 19 | 47.487093 | 19.088391 | 91 kg |
| 20 | 47.496417 | 19.072926 | 90 kg |
| 21 | 47.478491 | 19.091825 | 56 kg |
| 22 | 47.479669 | 19.088727 | 83 kg |
| 23 | 47.495945 | 19.08181 | 68 kg |
| 24 | 47.487821 | 19.075307 | 96 kg |
| 25 | 47.486882 | 19.071569 | 92 kg |
| 26 | 47.485501 | 19.072039 | 93 kg |
| 27 | 47.488094 | 19.084196 | 57 kg |
| 28 | 47.489819 | 19.082287 | 64 kg |
| 29 | 47.494475 | 19.071527 | 66 kg |
| 30 | 47.48275 | 19.07939 | 90 kg |
Table 5.
Execution results of the case of thirty bins.
| Ex. Time (s) | Total Energy (kWh) | Total Distance (km) | |
|---|---|---|---|
| GA | 17.5616664 | 1766.8860 | 24.19838 |
| PSO | 25.9850608 | 1765.9722 | 24.16504 |
| SA | 0.7237922 | 1958.02908 | 28.75177 |
| RS | - | 3176.2595 | 58.3101 |
Table 6.
Estimated accrued emissions in g of the case of thirty bins.
| CO | NMHC | CH4 | NOx | PM | Total | |
|---|---|---|---|---|---|---|
| GA | 7067.5 | 282.70 | 282.70 | 282.70 | 282.70 | 8198.4 |
| PSO | 7063.9 | 282.56 | 282.56 | 282.56 | 282.56 | 8194.1 |
| SA | 7832.1 | 313.28 | 313.28 | 313.28 | 313.28 | 9085.2 |
| RS | 12705 | 508.20 | 508.20 | 508.20 | 508.20 | 14738 |
Table 7.
Execution results.
| Ex. Time (s) | Total Energy (kWh) | Total Distance (Km) | |
|---|---|---|---|
| GA | 14.4321162 | 1188.3266 | 16.4887 |
| PSO | 6.459 | 1190.7251 | 16.5891 |
| SA | 0.2832 | 1311.2013 | 19.4575 |
| RS | - | 1974.3287 | 35.5153 |
Table 8.
Estimated accrued emissions in g of the case of twenty bins.
| CO | NMHC | CH4 | NOx | PM | Total | |
|---|---|---|---|---|---|---|
| GA | 4753.3 | 190.1 | 594.2 | 546.6 | 11.88 | 6096.1 |
| PSO | 4762.9 | 190.5 | 595.4 | 547.7 | 11.91 | 6108.4 |
| SA | 5244.8 | 209.8 | 655.6 | 603.2 | 13.11 | 6726.5 |
| RS | 7897.3 | 315.9 | 987.2 | 908.2 | 19.74 | 10,128 |
Publisher’s Note: MDPI stays neutral with regard to jurisdictional claims in published maps and institutional affiliations. |
© 2022 by the authors. Licensee MDPI, Basel, Switzerland. This article is an open access article distributed under the terms and conditions of the Creative Commons Attribution (CC BY) license (https://creativecommons.org/licenses/by/4.0/).
Share and Cite
MDPI and ACS Style
Akkad, M.Z.; Haidar, S.; Bányai, T. Design of Cyber-Physical Waste Management Systems Focusing on Energy Efficiency and Sustainability. Designs 2022, 6, 39. https://doi.org/10.3390/designs6020039
AMA Style
Akkad MZ, Haidar S, Bányai T. Design of Cyber-Physical Waste Management Systems Focusing on Energy Efficiency and Sustainability. Designs. 2022; 6(2):39. https://doi.org/10.3390/designs6020039
Chicago/Turabian StyleAkkad, Mohammad Zaher, Sameh Haidar, and Tamás Bányai. 2022. "Design of Cyber-Physical Waste Management Systems Focusing on Energy Efficiency and Sustainability" Designs 6, no. 2: 39. https://doi.org/10.3390/designs6020039