Operational Excellence in a Biogas Plant through Integration of Lean Six Sigma Methodology


1
Circular Resource Engineering and Management, Hamburg University of Technology, Blohmstr. 15, 21079 Hamburg, Germany
2
Key Values GmbH & Co. KG Innovation Consultancy, 20354 Hamburg, Germany
*
Author to whom correspondence should be addressed.
Designs 2022, 6(4), 61; https://doi.org/10.3390/designs6040061
Submission received: 12 April 2022
/
Revised: 18 June 2022
/
Accepted: 27 June 2022
/
Published: 29 June 2022
Abstract
:Process optimization with Lean Six Sigma (LSS) has become more popular every day for years in almost every kind of industry. This integration has brought an even wider variety of possible application areas for industries and research institutes. Recently, the use of LSS for process optimization in biological fields has become more and more common. In this study, LSS methodology is used for process optimization in an industrial scale biogas plant in Hamburg, Germany. The methodology used includes all the DMAIC cycle and related tools. Hypothesis tests were used to calculate the p-value of each experiment for the LSS interpretation. Due to the experimental factors, one-way ANOVA and 1-sample Z-test were used to determine the p-values. By conducting hypothesis testing after the analysis phase of this study, it was found that particle size, freshness of the substrate, and the amount of sand content in the substrate had a significant effect on the desired amount of biogas produced with a p-value of less than 0.01. These root causes led to approaches that focused on high quality feedstock and sufficient pretreatment methods. This paper represents a pioneering example of integrating Lean Six Sigma into biogas plant operation.
1. Introduction
Global warming and the resulting climate changes are largely the result of anthropogenic energy and resource consumption. For this reason, Germany is increasingly focusing on the use of renewable energies. The aim is to reduce greenhouse gas emissions by substituting fossil fuels with renewable energy sources [1]. In order to minimize further negative effects of the climate crisis, the climate conference in Paris set the goal of limiting the temperature increase to 1.5 °C [2].
Decades of research have focused on the question of how to reduce the impact of climate change on the environment. Renewable energy and related technologies such as biogas production could be considered as measures to reduce the effects of climate change on the environment due to their lower CO2 emissions compared to fossil resources [2]. Anaerobic fermentation is the degradation of organic material by the microorganisms in an anaerobic (oxygen-free) environment. The biogas produced during the anaerobic digestion process consists mainly of methane (CH4) and carbon dioxide (CO2). Three different products can be used in any area: (1) biomethane after implementing methane upgrade to the biogas, (2) electricity as a product of the processing biogas in a CHP (Combined Heat and Power), and (3) heat as the side product of the process at CHP. These products can substitute fossil energy sources in several areas [3].
To the authors’ knowledge, there has not been any study about Lean Six Sigma appli-cation in anaerobic digestion, biogas plant, or any biological sciences. However, process optimization in biogas technologies is gaining importance every day and there have been several studies of this topic.
Anaerobic digestion (AD) is the biological degradation of complex organic materials in an oxygen-free environment by anaerobic bacteria to produce biogas and a mixture of biomass. This biochemical process has four sequential steps: hydrolysis, acido-genesis, acetogenesis, and methanogenesis. The first stage of the process, hydrolysis, is where complex organic materials are converted to amino acids, sugar, and fatty acids. The acidogenic bacteria transform the amino acids, sugar, and fatty acids to lower fatty acids during acidogenesis, the second stage of the anaerobic digestion process. Afterwards the outputs of the acidogenesis stage are converted to the main requirements of biogas production such as acetic acid, hydrogen, and carbon dioxide during acetogenesis. Finally, the biogas is produced along with methane and carbon dioxide during the methanogenesis stage [4].
AD is a complex process in which living organisms have an enormous role, making monitoring and controlling the process challenging. Nonetheless, there are several operational parameters that affect biogas production. With the harmonization of these parameters, it is possible to maintain an optimum environment for biological processes such as biogas production. To illustrate this, characteristics of the feedstock—such as composition, ratio of Total Organic Carbon (TOC) and Total Nitrogen (TN), particle size, total solids—as well as parameters during the process—including temperature, Organic Loading Rate (OLR), Hydraulic Retention Time (HRT), mixing, and pH—could be considered some of the operational parameters that affect the process capability [5,6,7,8,9,10,11]. Recent research has shown that temperature has a major effect on biogas production. Önen et al. conducted a study in 2018 to design the optimum operating environment for biogas production in terms of the temperature in an industrial scale biogas plant [12]. Likewise, the temperature fluctuations and their effect on biogas production have been studied in a laboratory scale. In general, temperature increases resulted in an increase in the hydrolysis rate of substrate [9,13,14]. In addition to temperature, the effect of stirring has also been studied in different scales of biogas production. Different stirring scenarios have been tested in an industrial scale biogas plant over a period of six years by Nsair et al. in 2019. The outcomes showed that the optimum stirring scenarios depend on the specific biogas plant, and that the negative impact of intensive stirring on the contact between substrate and microorganisms must be considered [9,10]. Additionally, numerous studies have been conducted to find out the effect of feeding type and amount of substrate on biogas production. Yield of biogas production in different scenarios with mixtures of food and green waste were determined by Liu et al. [15]. Another study aimed to improve biogas production using rumen fluid in mesophilic conditions [16]. In other words, biogas production with different types of feedstocks and scenarios has been intensively researched in laboratory and industrial scale biogas plants [9,17,18,19]. Moreover, the effect of other operational parameters such as OLR, pH, and HRT on biogas production and sometimes even on each other has been tested in various stages of AD, with different scales of applications and for numerous types of scenarios [20,21,22,23,24]. The efficiency of the process strongly depends on the content and characteristics of the substrate mixture. The amount of biogas produced and the methane content of biogas result from the content of the chosen substrate and the suitable amount of substrate for a specific process. As can be seen, there has been plenty of research and studies about the process parameters of AD and their effects on biogas production. Moreover, Sukpanchoren and Phetyim (2021) worked on process optimization in biogas technologies to improve green hydrogen and electrical power [25]. In 2017, Chen et al. worked on cost–benefit analysis for the value chain of a biogas project in Beijing. China’s Paris Agreement commitment is to use 20% non-fossil fuels by 2030. China’s biomass should make bioenergy a major non-fossil energy source. In this investigation, a Beijing biogas project (DQY) and its entire value chain are analyzed. China has never used 100% chicken dung for a large-scale biogas project. DQY receives RMB 8 million annually from the Clean Development Mechanism for producing 14 million KWh of power from 80,000 tonnes of chicken manure and 100,000 tonnes of sewage (CDM). DQY’s sustainable bioenergy models are part of the new rural energy plan because they use recycled resources and consider animal welfare. DQY’s circular economy approach reduces emissions, pollution, and unemployment. This paper analyses China’s traditional demonstration approach (DQY) to biogas generation and gives recommendations [26]. A case study with 2 years of operation data from a biogas plant has investigated the potential for development. Like the further research mentioned in this paper, the aim was also to try to optimize biogas, energy, and environmental benefits. The plant’s energy and environmental impact were estimated and found to be positive. The study shows that by optimizing the plant’s functioning, the amount of produced methane and generated power may be increased [27]. Additionally, another study in Italy examines the development and future of biogas in the European Union (EU) and its member states for energy, heat, and transportation. Biogas production in the EU reached 18 billion m3 methane (654 PJ) in 2015, approximately half of the global total. The EU leads the world in biogas energy production, with 10 GW installed and 17,400 biogas plants, compared to 15 GW globally in 2015. In 2015, biogas produced 127 TJ of heat and 61 TWh of electricity in the EU; 50% of biogas usage was for heat. Europe is the world’s top producer of biomethane for use as a vehicle fuel or injection into the natural gas system, with 459 plants producing 1.2 billion m3 in 2015 and 340 plants injecting 1.5 million m3. A total of 697 biomethane filling stations fueled 160 million m3 of biomethane in 2015 [28].
Since biogas technologies can be considered as a vital renewable energy source, it is important to focus on its usage and development. Due to the living organisms involved, dynamic conditions of the AD challenge the process optimization in biogas plants. Each industrial plant behaves differently. Sometimes, only the plant operator’s experience and monitoring data can guarantee success. Due to fermentation’s ambiguity, biological processes can only be presented using functional equations. In 2019, Wahmkow investigated the possible use of a neural network and fuzzy logic algorithm for process optimization in biogas technology. A solution-finding controller was chosen in light of the given conditions. The Neural Network Predictive Controller is a blend of Neural Network, Fuzzy logic, and optimization. The complexity could be reduced, since the Fuzzy control identifies diffuse trends and evaluates linguistic expertise [29].
Lean Six Sigma is the combination of Lean Methodology, a set of techniques and corporate behavior to eliminate all types of waste from the operation. Six Sigma is a statis-tical approach for operational excellence through better quality and more optimized processes [30,31,32].
As mentioned above, the Lean Six Sigma approach has previously been used in different sectors. Singh and Rathi have performed detailed literature research from 2000 to 2018 for various scales and types of business that summarized numerous applications [31].
Under the scope of Green Lean Six Sigma (GLS), several projects for environmental sustainability have been conducted. For instance, Kaswan and Rathi have investigated the implementation of GLS with the help of Interpretive Structural Modeling (ISM) [33]. In another study, Kaswan and Rathi have also worked on feasibility and readiness of GLS approach on organizations in 2020 and conducted a concrete integration of GLS and classical DMAIC (Define, Measure, Analyze, Improve, Control) methodology from the well-known Lean Six Sigma approach [34].
Use of statistics in any field with the help of Lean Six Sigma can lead to the reaping of the benefits of modern methods such as machine learning, predictive analytics, and big data. In this study, extensive literature research has been done for this topic [11,35]. For instance, De Clercq et al. developed a machine learning model to predict biogas production and created a graphical user interface with the help of operational data from two industrial scale biogas plants in China [36]. In another study, the flexibility of temperature fluctuations and its effect on biogas production has been predicted using machine learning models in a laboratory environment; different models have been compared and evaluated to find the best accuracy [37].
All in all, it can be seen that process optimization in biogas plants has been one of the main topics for a while. Process optimization has been separately studied within various types of operational parameters for years. However, structural methodology from classical methods such as Lean Six Sigma has not been applied to this sector. The approach of this paper allows us to combine different operational and environmental parameters. Usage of this methodology could bring an effective overview of the process and allow us to see weak points and improvement potentials. Most importantly, following this methodology could allow us to define the root cause of the problems so that sustainable process optimization can be achieved. In the scope of this paper, a case study has been conducted to investigate the benefit of Lean Six Sigma methodology in biogas plants. As it can be seen in the Define phase in the Section 2, the aim of this project is improving the amount of produced biogas.
2. Materials and Methods
This study was launched with cooperation from an industrial scale biogas plant. After the ‘Define’ and ‘Measure’ phases, several experiments were conducted in the institute’s laboratory with collected samples from the biogas plant. As can be seen in the next sections, this study used a traditional methodology of Lean Six Sigma with the DMAIC cycle (Define-Measure-Analyze-Improve-Control), which was mainly used in the manufacturing environment to enable structural and continuous process optimization in biogas plants. The tools required for each phase of the DMAIC were briefly explained, and the application of these tools can be modified for other projects with different data.
2.1. Studied Industrial-Scale Biogas Plant
The studied biogas plant is located in Northern Germany. The anaerobic digestion plant and composting plant operated by this company are built to process approximately 40,000 ton a−1 of biowaste collected from the area. The Figure 1 shows the whole treatment process of biowaste at the site.
The plant’s operation can be considered a traditional biogas technology, with a collection of biowaste in the first storage area, pre-treatment of the biowaste with the help of conveyors, feeding, dry AD in the fermenter, gas stored in gas storage, and solid digestion stored in a solid digestate storage tank. Biowaste is collected by garbage trucks and unloaded at the storage area. A wheel loader picks up the waste to feed the biowaste into a feed hopper. Biowaste is transported for pre-treatment by conveyor belts. The biowaste is then loaded onto a trommel screen that screens the biowaste according to different sizes: <60 mm, 60–120 mm, and >120 mm. A fraction with the size <60 mm will be sent for AD as treatment, whereas fraction with size >60 mm will be sent for composting as treatment.
Afterwards, biowaste with size fraction <60 mm after pre-treatment will be stored in a substrate tank to ensure semi-continuous feeding of fermenter at any time. Then, the liquid digestate will be mixed with percolate water and leachate in the mixer for digester. The AD process takes place in digester with an operation temperature of 55 °C and with the HRT of approximately 21 days. Produced biogas is pretreated before going to a combined heat and power (CHP) unit to produce electricity.
2.2. Lean Six Sigma Methodology
As mentioned above, this study aims to apply Lean Six Sigma methodology to biogas technologies. Six Sigma refers to a quality assurance and improvement programme at Motorola at the end of the 1980s. In its origins, the term “Six Sigma” stands for the description of a statistical quality target: customer specifications are met 99.99999976% of the time. The central element of Six Sigma is the combination of a phase-based, tool-oriented, and structured approach. This has changed over time, with the statistics becoming more application-oriented. On the other hand, it has become a methodology with five project phases (DMAIC) to have a structured, systematic and common understanding of project management for optimization and quality projects [30,32].
In the Lean philosophy, like Six Sigma, process optimization is also conducted through the combination of different tools. The main focus of the lean principle is to sustainably eliminate waste during the process as a team of all the organization members [30].
Although the Lean and Six Sigma methodologies have different approaches for process optimization, a lot of companies have combined both for a better repertoire and the easier application of the processes.
In the scope of this paper, all the methodologies will be explained using examples of our applications for each phase for a better understanding of the process in the next sections.
2.2.1. Define
In the Define phase, the aim is a detailed definition of the problem, customers’ expectations, start and end date of the project, stakeholders, process steps, possible opportunities and risks, and the project scope. For a common understanding and expectation of the project for all the stakeholders, the Define phase must be conducted carefully and in a way that is understandable for everyone [30,32,38].
Like in the classical project management approach, each phase of the DMAIC cycle has some requirements to be fulfilled regarding the completeness of the process. For the Define phase, they can be listed as: Project Charter, Project Scope, Time Plan, SIPOC (Supplier, Input, Process, Output, Control), Tool 1 (CTC Matrix), Stakeholder Analysis, Risk Analysis, and Opportunity Estimation [30,32].
In this phase, the business environment and the background to the problem are described. In this context, the significance or importance of the project must be emphasized. It must be justified why the project should be carried out in a timely manner and, if necessary, it must be shown the possible consequences if the project is not carried out.
For this project, the following project charter was created with the help of a workshop that took place in the biogas plant with all the stakeholders.
In “Business Case”, it was mentioned why the project was selected, with some background information about the company and project itself. The company is located in the north of the city of Hamburg. The company operates an AD plant and also a composting plant. Almost half of the collected biowaste (<60 mm fraction), about 20,000 tons a−1 from a city district, are utilized for biogas generation through AD, whereas the other half (>60 mm fraction) is sent for composting. The fermenter technology applied at the company is a plug flow reactor (1950 m3), as the type of AD takes place is dry-fermentation at thermophilic region (55 °C). The HRT of the fermentation is approximately 21–28 days (average 25 days). The fermenter is designed to generate 250 m3 h−1 of biogas that is later stored in a pressurized gas tank of 1500 m3 volume. The biogas is pre-treated to exclude sulfur components and condensate before being channeled into CHP station for electricity generation. However, the biogas generated does not always achieve this target. Therefore, the end goal of this project would be to boost the overall efficiency of the biogas plant.
For problem and target definition, SMART (specific, measurable, achievable, reasonable, time-bound) criteria must be considered. The following problem definition could give a clear understanding to all stakeholders in the project. According to inline-measurement data from 1 January 2020 (time 00:00:00) to 31 December 2020 (time 23:59:59), the average volumetric flowrate of biogas generated was 180.37 m3 h−1. The targeted biogas production was 229.17 m3 h−1. The difference between the biogas generated and the targeted biogas generation was as high as 21.29%. It was found that the biogas production during spring (March, April, and May) was exceptionally low. The biogas produced during spring contributed about 22.48% of the total share of biogas produced in the year 2020. Biogas production during autumn and winter are the highest among other seasons due to increased garden waste.
Regarding the defined problem, the target was also shaped through SMART criteria; from January to December 2022, it is expected that there will be a minimum of 1% (15,843.52 m3 a−1) increase in total biogas production compared with the biogas produced during January to December 2020 (1,584,352 m3 a−1). By increasing the process efficiency via implementing various measures, the biogas generated would increase proportionally.
In order to focus on value-added topics, the content and direction of the project must be delineated clearly to be able to exclude non-project issues to generate a common understanding of the project scope among all the team members.
The scope of this project can be listed as: AD process in fermenter, biogas treatment, combustion heat power (CHP), dewatering of digestate, central storage of liquid digestate, biowaste composition, storage of solid digestate, storage of leachate, gas storage, substrate tank, mixer, and pretreatment of the biowaste. Waste air treatment, compost post-treatment, incineration, composting, and electricity grid are out of this project’s scope.
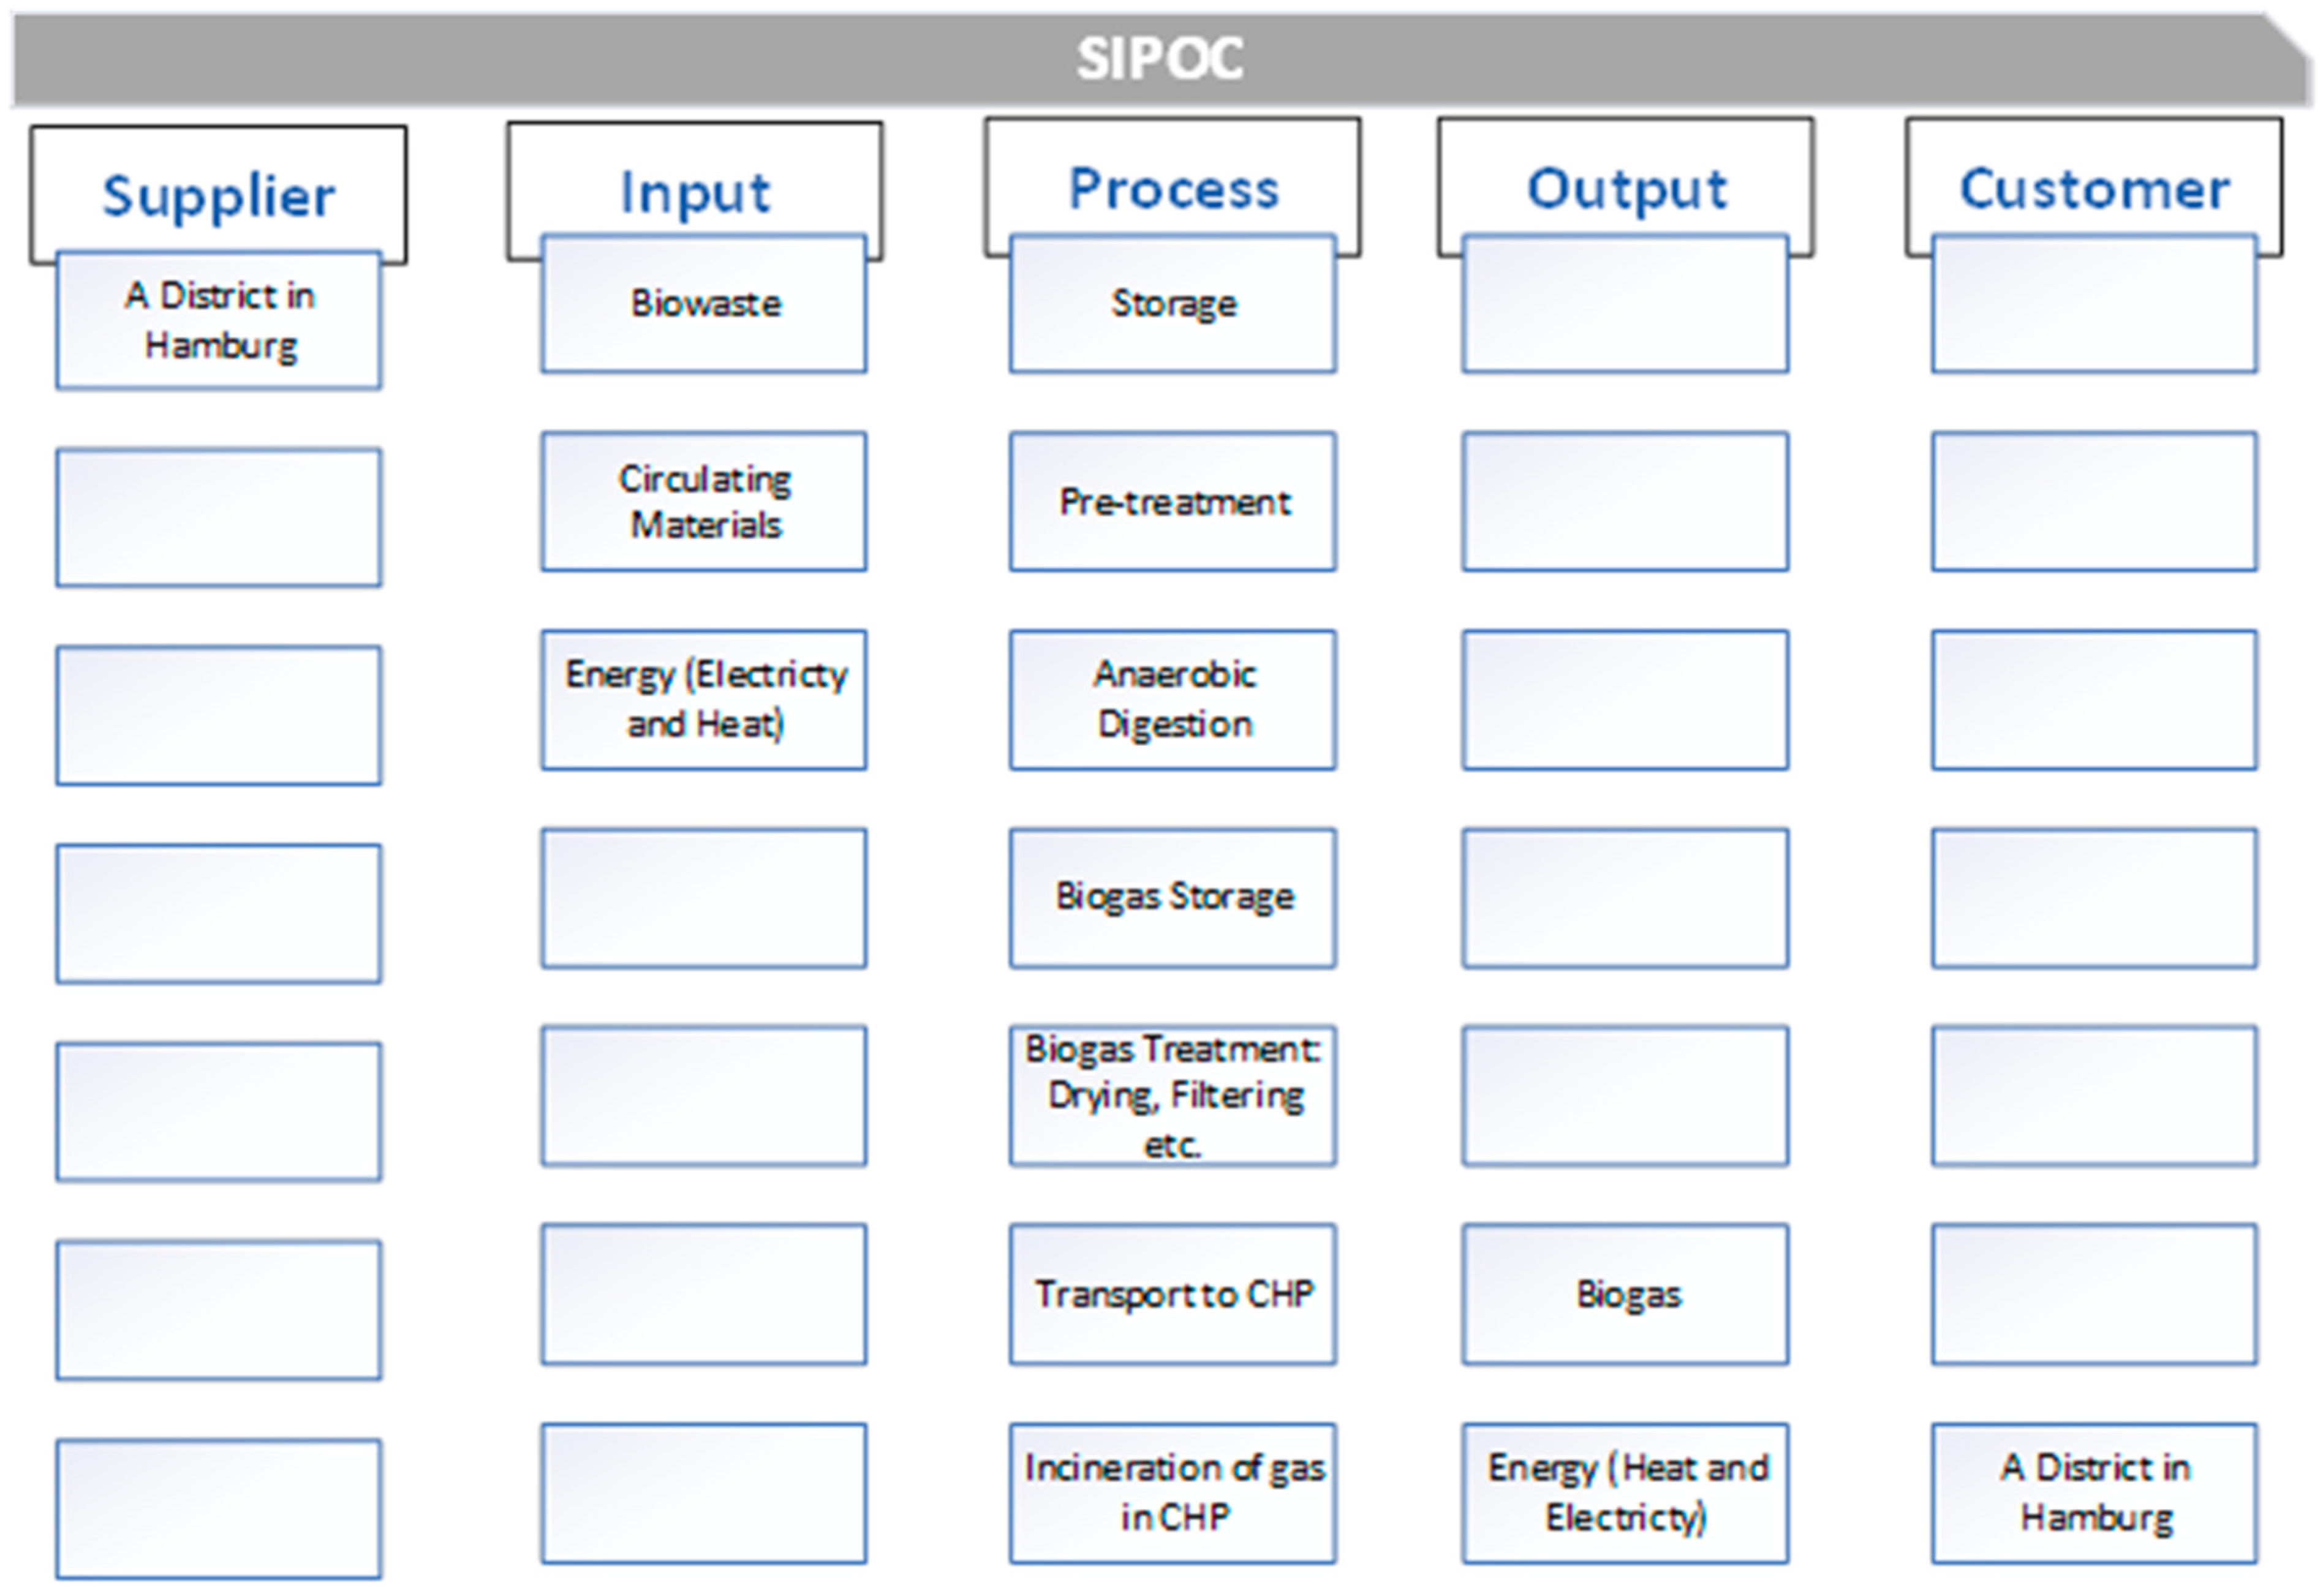
After defining the project’s scope, it has to be ensured that everyone has a common understanding of the process. This leads us to another SIPOC tool with which we can have a basic insight of the project inputs, outputs and process. The SIPOC method (Supplier, Inputs, Process, Outputs, Customer) depicts processes and procedures quickly and clearly, with a rough level of detail. The process under consideration is roughly divided into five to seven steps. Input and output variables as well as suppliers and customers are identified for each step. When analyzing the process presented in this way, problems, inconsistencies, and gaps are identified. These can then be further investigated or solved using other methods. Representation of the SIPOC for this project is illustrated in Figure 2.
The process should be defined in five to seven process steps. The key inputs, relevant suppliers of the inputs, and key process outputs must be determined. Then, important customers as recipients of the essential output must be named. This step also forms the basis for the Tool 1–CTC Matrix which will be shown in the next section.
The reason for the requirement of Tool 1 is actually the converting of the voice of the customers (VoC) to measurable parameters, which also allows a measurable tracking and managing of the progress during the project. As an output of the CTC Matrix, output metrics for the measurement phase needed to be determined. In this project, the Voice of Customer was formulated as “Produced biogas amount is much lesser than expected.” With the core aspect of increasing average biogas output, the CTC (critical to customer) can be gained as biogas production amount (m3).
The output of this step has a significant role to start with the Measure phase, since critical-to-customer depicts the output of the process that can be used as an input for the Measure phase.
2.2.2. Measure
The Measure phase mostly concerns highlighting the importance of the problem through the CTCs and CTQs that were defined at the end of the Define phase. As mentioned in the previous section, the output of the process would be used for the Measure phase. The following tools are required to fulfill the Measure phase: Tool 2 (metrics matrix), operational definition, data gathering plan, and process capability report [30,32,38].
In order to use Tool 2, all the CTCs and CTBs from Tool 1 should be compared with the output metrics to ensure that all the output metrics represent all the CTCs/CTBs. In this project, there is only one CTC that should be compared to possible output metrics, and this is shown in Table 1.
This tool indicates that the amount of biogas produced is, at first glance, the correct output metric for this project.
An operational definition serves to ensure that everyone has the same understanding of the metrics and the measurement methods to avoid ambiguities in data collection and interpretation of the results [30]. To proceed with the process, metrics to be measured, and the measuring device, measurement methods, and decision criteria should be defined. In this project, it can be summarized as in Table 2.
After having an operational definition, it is time to shape a data gathering plan for the project. The Measurement phase, as mentioned, requires just the output data. In the following Table 3, the data gathering plan is summarized.
The nature of the data, e.g., whether they are continuous or discrete as well as the method by which they are gathered, give us the rough direction of the tools to be used.
After defining the data gathering plan, it is possible to gain insight to data for the first time for a possible exploratory data analysis. For this project, Minitab software was used during the Measure, Analyze, and Control phases. As mentioned above, the data type helps us to understand the variation. Understanding the variation requires the definitions of common cause and special cause variation.
Common cause variation is caused by random causes that are expected to occur. On the other hand, special cause variation results from non-random and unexpected causes. For the common cause variation, the process optimization is needed, and for the special cause variation, the emergency management as one-time and targeted action is required [30].
Table 4 illustrates the collection of methods and tools for understanding the variation.
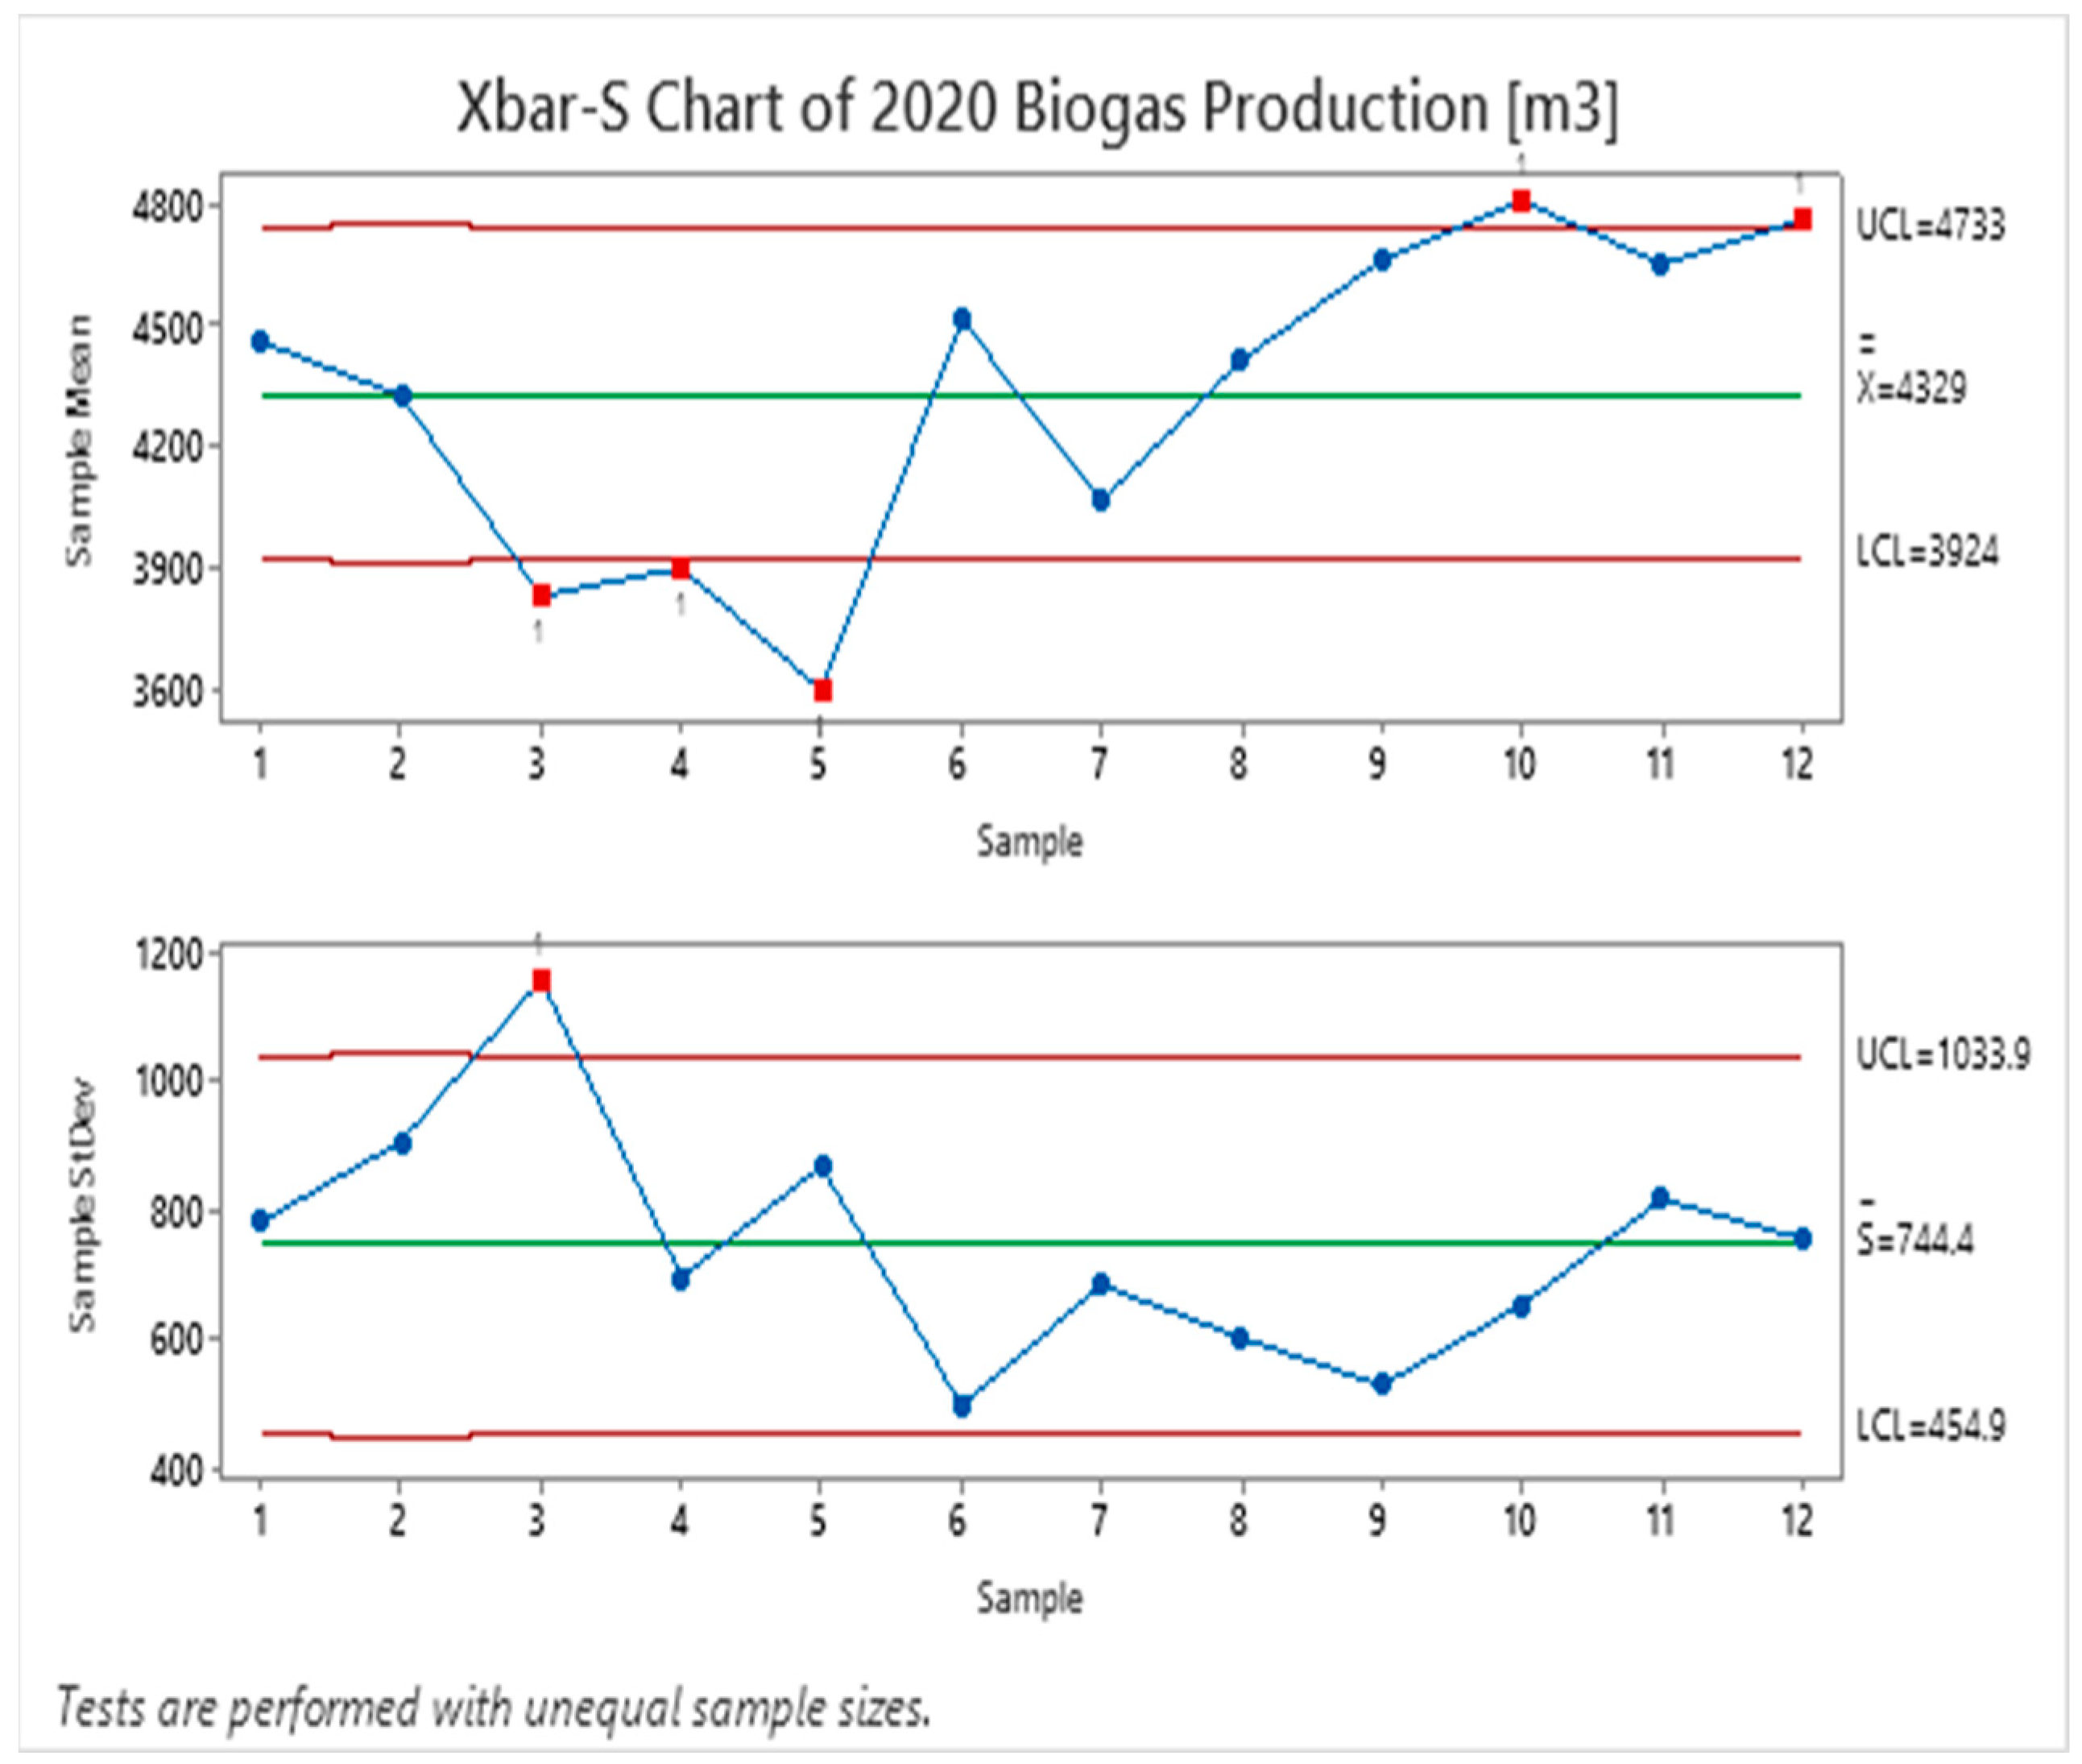
Due to the nature of the dataset in this project, the Xbar-S chart has been used as the control chart, as shown in Figure 3.
From the Xbar-S Chart, it can be seen that the Upper Control Limit (UCL) and Lower Control Limit (LCL) were partially exceeded. This points out that the process needs optimization.
2.2.3. Analyze
After describing the CTC/CTB and defining the process capability, it is possible to search for the root cause of the problem. In the Analysis phase, like in the other phases, several tools can structure the search for the root cause of the problem. From defining the possible causes to deciding the root causes, the following tools are used for this project: Fishbone Diagram, Tool 3 (Input–Process Matrix), Process Analysis (Value Stream Mapping, Swimlane, Makigami, Spaghetti Diagram, Time Analysis, etc.), and Data Analysis (passive and active data analysis) [30,32,38].
To collect the potential causes, a fishbone diagram has been launched during a workshop with all the stakeholders. A fishbone diagram helps visualize all the possible topics that can cause the main problem defined by CTC during the Define phase. With the help of a fishbone diagram (Figure 4), a structural way of working during brainstorming and connecting the possible causes could be ensured.
After defining possible cause during the workshop, the next filter (C: Constant, N: Noise, X: Variable) could be implemented to define which possible causes can be worked. After applying the fishbone diagram and C, N, and X filter on possible causes, all the potential causes were summarized in the following table (Table 5).
Defining all these potential causes allows us to use the launch Tool 3 (Input–Process Matrix) to define the impact factor of each cause.
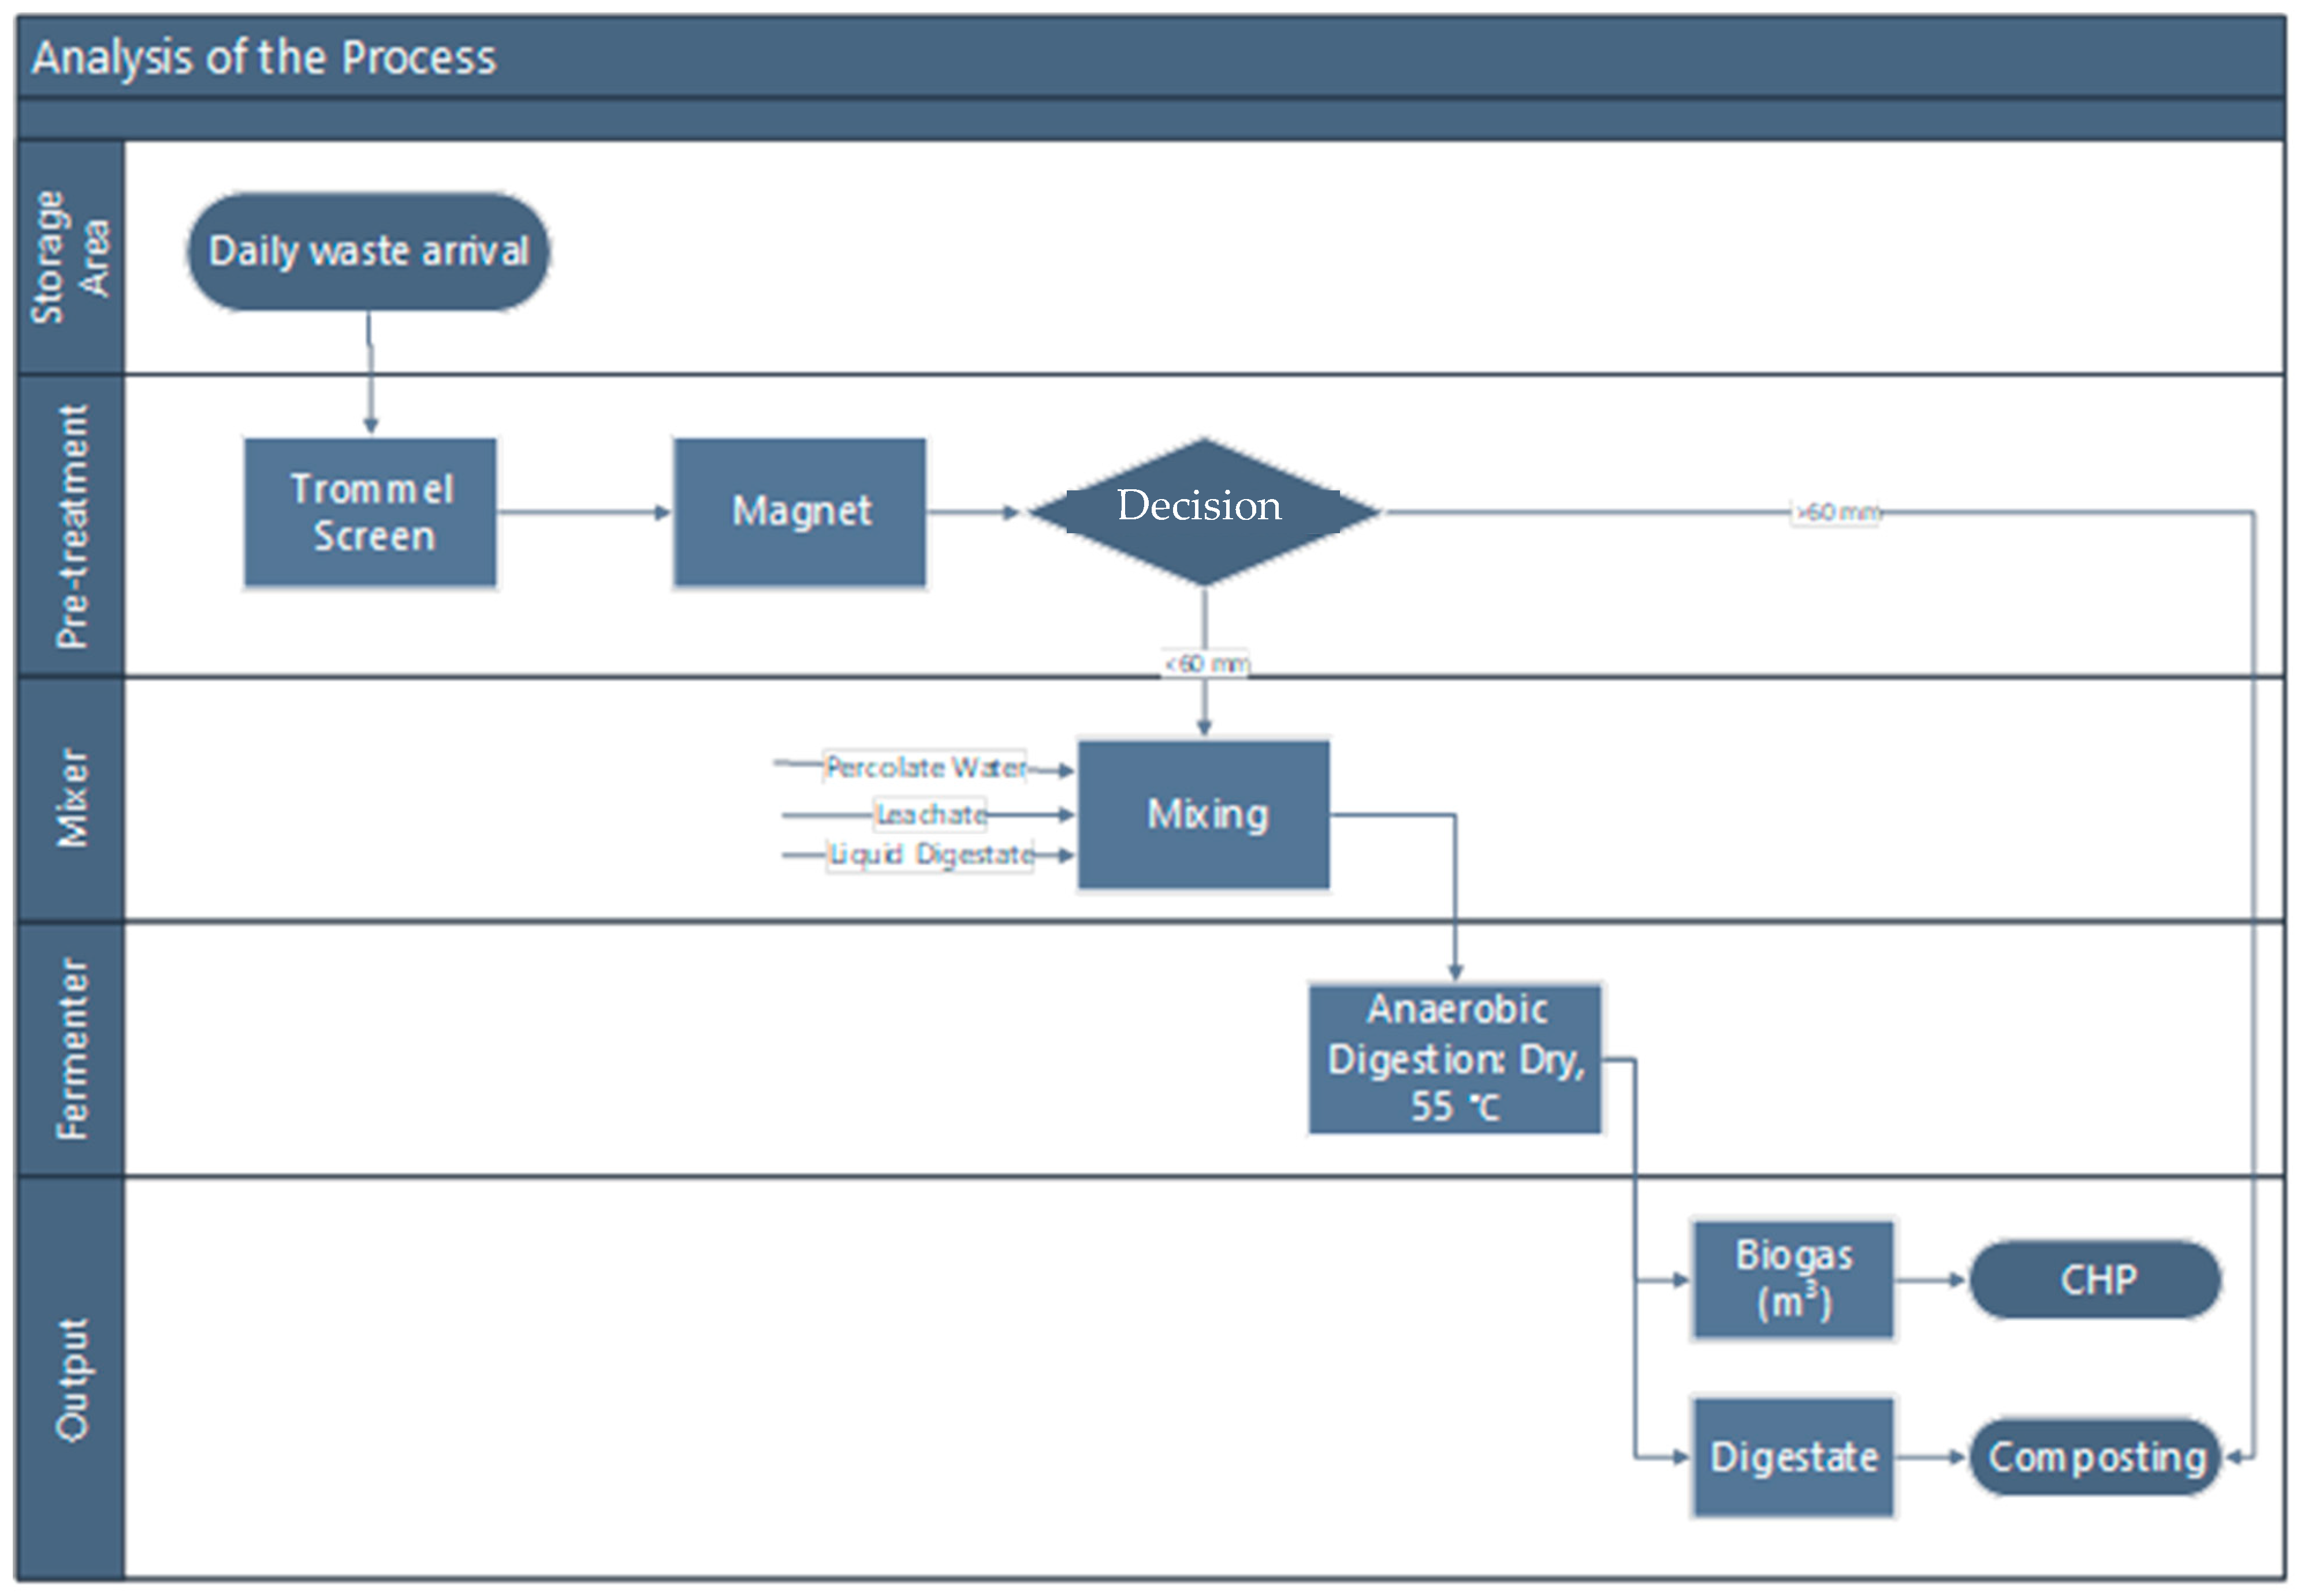
A general outline of the process is necessary to achieve a common understanding of the process for all stakeholders. In the following, Figure 5, a process flow diagram/process function diagram can be seen:
The whole process, from receiving the waste to the CHP Unit, has been illustrated above in Figure 5.
To create a process diagram, the target must be defined clearly, and the process must be recorded and visualized due to the analysis of value, time, and capacity.
For the data analysis part, it is possible to talk about two different types of analysis at the first stage: passive and active data analysis. For passive data analysis, the dataset must be available and ready to use; on the other hand, if the data generation and/or gathering is necessary specifically for the analysis phase, then active data analytics is needed.
In this project, these two concepts were combined, since the scale of the biogas plant did not allow to simulate some of the possible causes through some experiences. That is why some laboratory experiments were conducted with the sample collected from the biogas plant itself.
With seven different experiment setups, all the potential causes (X: variables) were covered for the Analyze phase. In the following table (Table 6), a general visualization of the experiments and the causes covered by these experiments can be seen (BMP: Biomethane Potential and AMTS II: The system used for BMP Test, TS: Total Solids in % w/w, VS: Volatile Solids %TS w/w).
Since some assumptions have been made based on root cause analysis, it is necessary to validate them with the help of a hypothesis test according to the results of the experiments. Like in every statistical process, we will use null and alternative hypotheses for the observation. The null hypothesis (H0) describes the assumption that a tested parameter is equal to a given value or other parameters in the test. The null hypothesis always describes equality. The alternative hypothesis (HA), on the other hand, describes the hypothesis that a tested parameter is not to any given value or other parameters which are compared. The H0 and HA hypotheses could be decided through p-value based on the nature of each experiment of the factors.
For each result of p-value calculation that is smaller than 0.05, null hypothesis is rejected (“if p is low, H0 must go”), which shows that the significant difference does not exist between the parameters. Possible causes with a p-value smaller than 0.05 could be further improved in the Improvement phase.
2.2.4. Improve
For all the defined root causes, the top solutions must be defined to achieve project goals during the Improvement phase. For this purpose, solution ideas based on the core causes are derived, evaluated, and selected for the deployment on all the systems. In this phase, the tools from Lean Management also support the elimination of defined root causes for the process optimization. The accomplishment and sustainability of the project’s goals are ensured by validating and verifying the solution approaches and their combinations. To initiate the Improvement phase, the possible solutions must be defined and checked for feasibility, and then the monitoring and control strategy must be prepared and deployed with the new process [30,32,38].
For the defined root causes, the following potential solutions have been defined through some literature research and workshops with the process experts and stakeholders in the project:
- Usage of fresh substrate only;
- Increasing the capacity of fermenter;
- Addition of the thermal pre-treatment;
- Vibratory sand separator to remove sand;
- Self-screening bins to remove sand;
- In the waste truck screening to remove sand;
- Magnet and shredder for particle size reduction;
- Trommel screen to remove sand content;
- Install grid chamber;
- Install wet fermentation;
- Install hydrocyclone.
One of the quality tools from the Lean repertoire, Poka-Yoke, has been used as an inspiration for developing some of the ideas in this project. The Japanese term “Poka-Yoke” stands for the concept of continuous quality improvement by avoiding unintentional defects. It was developed by Shigeo Shingo, who was involved in statistical quality control (SQC) as part of the Toyota Production System (TPS). It is a method of preventive quality assurance to improve product quality and process quality of production [30,32,38]. In particular, the impurities caused by the sand content in the biowaste have been attempted to be avoided with the new design ideas using Poka-Yoke.
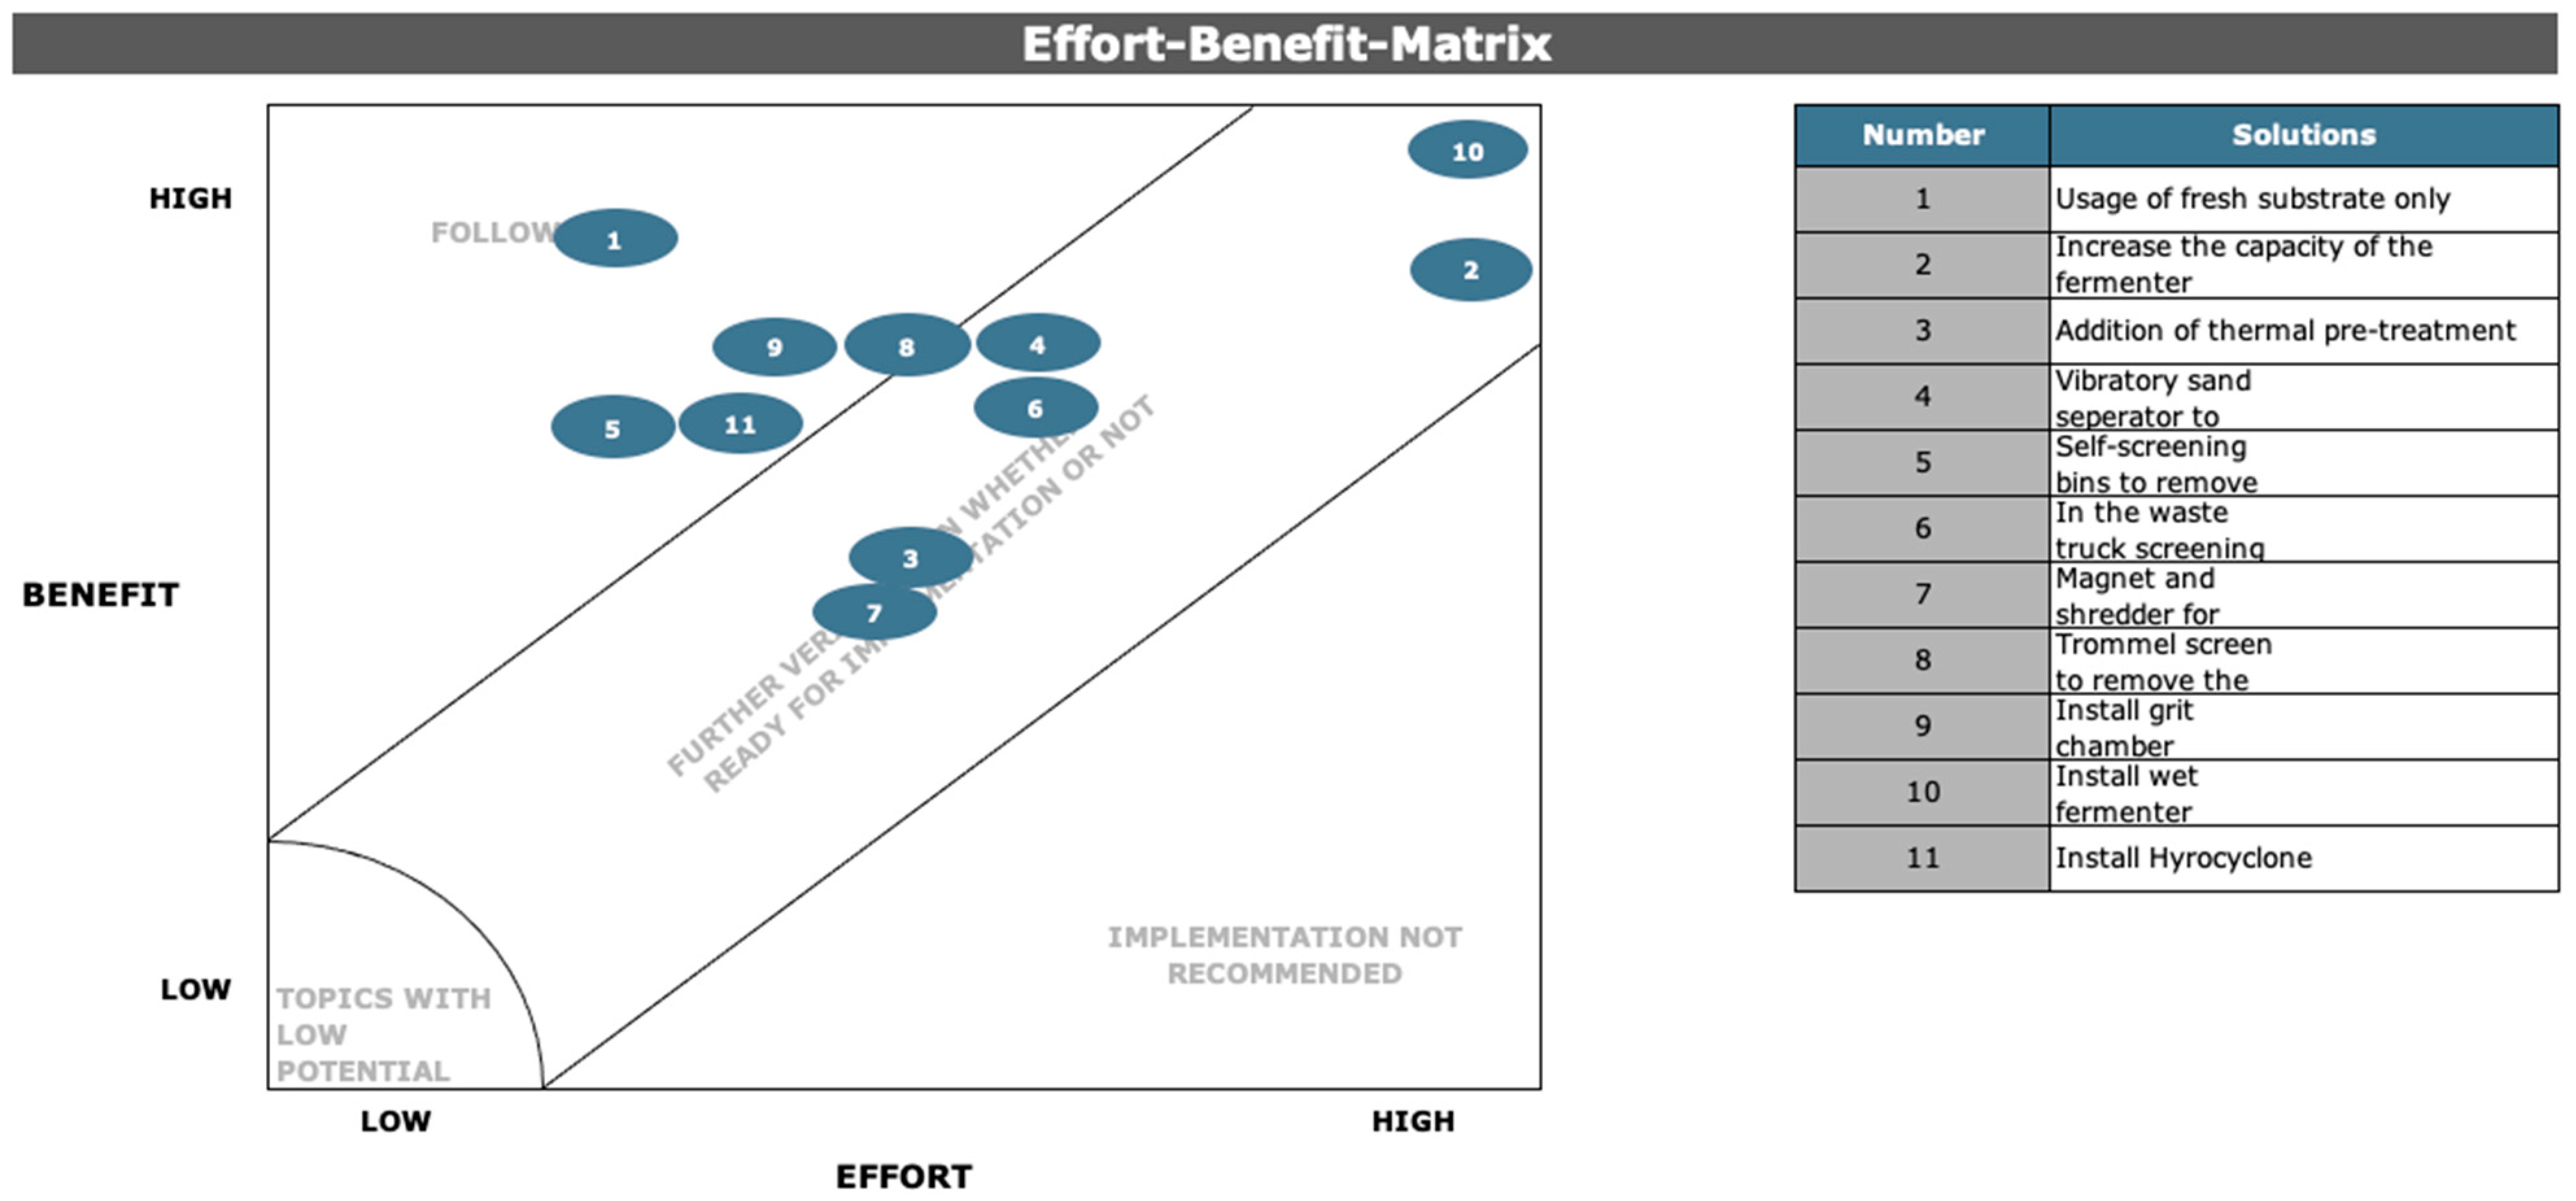
For the first filtering of the gathered solutions, the Effort–Benefit matrix has been used. With the Effort–Benefit matrix, it is possible to evaluate the possible solutions according to effort and benefit; it allows us to select the solutions with the most favorable cost–benefit ratio. The matrix shows that all solutions can be considered according to their benefits. Nevertheless, the high effort requirement of some of these solutions could negatively impact their implementation.
In order to ensure that each root is eliminated by one or more solutions and that the project goal is thereby achieved, Tool-IV (Solution-Cause Matrix) could be used. This tool checks and visualizes the direct impact of the selected solutions on the fulfillment of the CTCs. In the end, a correlation is made between solutions and causes with their mutual effects.
In this project’s scope, deployment has been done by creating a business plan with cost–benefit analysis, reaction plan, pilot-case plan, risk analysis, and Gantt chart as a deployment plan. A To-Be illustration can also be seen in Section 3.
2.2.5. Control
The Control phase first of all ensures the sustainability of the process and helps with tracking the progress. To this end, the knowledge gained about the process is implemented in the process control system that already exists or is to be implemented. In addition, the organization’s knowledge is increased by documenting the project for other teams in a transparent and comprehensible way [30].
To provide a vivid, transparent and comprehensible illustration of the process for all the stakeholders and simplify the induction of new stakeholders, the process should be documented. Documentation of the process also ensures clear tracking of the progress and definition of the responsibilities [30,32].
In order to monitor and control the performance in daily business and identify the deviations from standards and response immediately if CTQs/CTBs are not met, a monitoring and reaction plan must be created [30,32].
Control charts are helpful tools to create monitoring and reaction plans, since they enable the detecting and tracking of process variations, the determining of whether the process is under control, and the identifying of common and special causes. The procedure of control charts has been explained in the Measure phase. Another reason why we should use control charts in the Control phase is that it allows us to compare the before/after status of the process and update the expected upper control limit (UCL) and lower control limit (LCL) [30,32].
Conducting all of the above experiments gives us an insight into the possible outcomes and success of the project in terms of customer needs. In the following figure (Figure 6), the different scenarios are shown in relation to the freshness of the substrate and the sand content of the substrate to show the comparative process capabilities of the different scenarios.
Based on the results of the different scenarios obtained through the experiments carried out in the Analysis phase, it is possible to control the biogas production and compare it with the level desired by the customer. Possible outcomes are calculated in Section 3.
After performing all the phases from the DMAIC cycle for the project, the sustainability of the process must also be ensured. This can be achieved by launching some regular audits and having documentation such as a handover protocol, lessons learned, and a project closure document to officialize the completion of the project.
3. Results and Discussion
Since the Define phase naturally has scope management in its repertoire, all the out-of-scope topics—such as waste air treatment, compost post-treatment, incineration, composing, and electricity grid—have been identified in the beginning of the project. In order to create the process capability and first control charts, the original data have been used with Minitab. Due to the nature of the dataset, the data have been split into the months (1–12) to create the subgroups for Xbar-S control charts. Afterwards, the active dataset was generated with several laboratory experiments during the Analysis phase to define the root cause for defined CTCs.
In order to investigate the feasibility of DMAIC methodology in the biogas plants, several tools from the Lean Six Sigma repertoire have been used for each phase of the project. The Analysis phase, process, and data have been analyzed in a laboratory environment at Hamburg University of Technology (TUHH), as explained in the Section 2 and summarized in the following table (Table 7).
First, we investigated whether the quality of the input has an effect on biogas production. The following results show the factors and their effects on biogas production according to hypothesis tests and their p-values in the following table (Table 8):
As mentioned above, for all the causes that have the p–value of smaller than 0.05, a solution must be searched for during the Improve phase. In the following table (Table 9), the root causes are listed:
As mentioned in the Analyze phase, with the help of stakeholders including process experts, some possible solutions have been collected for defined root causes as shown in Table 10:
With all the possible solutions found, all the root causes must be covered in order to fulfill the CTQ, as mentioned in the Define phase of the project. Table 10 gives an overview of possible solutions and root causes covered by them.
For the first rough selection, the Effort–Benefit (Figure 7) matrix could be implemented to see if easy-to-implement solutions might cover all the root causes. As mentioned in the Section 2, Materials and Methods, the possible solutions are evaluated in terms of their effort and benefits in order to select the better solutions for the defined problem.
For prioritizing the possible and feasible solutions, the Solution–Cause matrix (Tool IV) has been performed during the Improvement phase in Table 11. With the help of this matrix, it can be checked to what extent the selected tools can fulfill the customer needs according to the defined problem.
Considering all decision tools for selecting the best solutions for CTQ, it is possible to categorize all solutions into two groups such as:
- Improvements at the quality of input material;
- Improvements at the implemented pre-treatment and digestion technologies.
The abovementioned categories and the possible solutions discussed provide us two concrete approaches for our study. First, we could focus on the freshness of the substrate by modifying the process with the decision criterion that only fresh substrate is used for biogas production through replanning the feeding system to prevent the waiting time of the substrate. Second, it is crucial to target some additional pretreatment methods against the impurities in the substrate. These pretreatment methods could be applied before the waste arrives in the storage area of the biogas plant. The aim of this study was to propose all the solution ideas as a possible business case, so the preferred solutions may vary depending on the nature of the biogas plant.
For each of the possible solution ideas, an investment of money and time is inevitable, which could be considered a risk at the beginning. However, our study shows the importance of identifying the root causes of the defined problem from the beginning, and underlines that the implementation of the proposed solutions and approaches is definitely worthwhile. More specifically, a higher and concretely demonstrable return of investment (ROI) could be the motivation for the proposed solution.
In several studies, the mentioned problems and their impact on the process have been examined. From the biowaste collection at households to the arrival in the plant, water starts to evaporate and the substrate starts the depredating, later influencing the AD performance. Another potential improvement strategy defined at the biogas plant was usage of other streams as well as the currently used biomass stream <60 mm. At the biogas plant, the impact has been observed on biomethane generation and moisture content efficiency. A study performed by Beniche et al. (2021) showed that large vegetables contain more water than smaller vegetables. In addition, high lignocellulosic content biomass contains a little amount of water. Impurities are another issue causing process destruction and decreasing efficiency at the biogas plants. Removal of these impurities is not sufficient at the waste treatment facilities and they lead to an increase in treatment cost. Another idea for efficiency improvement at the biogas plant was increasing the hydraulic retention time of biomass in the digester. The study performed by Gioelli et al. (2011) showed that 19.5 and 7.90 m3 biogas MWhel−1 get lost daily from digestate storages.
As shown in the Control phase of the project, different scenarios of the operation can produce different amounts of biogas. Assuming a substrate input of 40,000 tons per year, a potential benefit could be calculated for each factor, substrate freshness, and sand content. As shown in Figure 6, there is a difference between fresh and old substrate and different sand contents in the substrate in terms of biogas production. The use of fresh substrate yields 3.76 NmL/g vs. BMP in terms of volatile solids. The difference between fresh substrate and stored substrate means 32,847 m3 more production per year, while the use of old substrate reduces this production to 75,828 m3 per year. With a sand content of about 10%, production is reduced by 30,051 m3 per year.
Using Lean Six Sigma methodology, the above-mentioned problems were defined and handled in a structural approach which represents a guideline for similar implementations.
4. Conclusions
In the present article, we investigated whether Lean Six Sigma methodology could be used for process optimization in biogas plants. For this purpose, we conducted active data analysis from the Analyze phase of the Define-Measure-Analyze-Improve-Control (DMAIC) cycle in a laboratory environment with the substrate from the biogas plant. This study shows that the quality of the input substrate and the implementation of adequate pretreatment methods are sufficient for biogas production.
Taken together, this study offers a novel perspective on the usage of statistical process control and a systematic approach to process optimization such as Lean Six Sigma in biological science. As mentioned previously, the operational and environmental parameters have already been studied for different scenarios; however, the Lean Six Sigma methodology allows us to perform a data-driven and structural process optimization in biogas technology. With the possible measurements according to the root causes and the related solution ideas, it is possible to optimize the process in order to satisfy the customer needs, as was illustrated in the Section 3 regarding the possible biogas production. Future research may extend this work by ensuring robust measurement of the data and applying a process optimization approach continuously with all the stakeholders of the process.
Author Contributions
Conceptualization, S.C. and S.Ö.C.; methodology, S.C.; software, S.C.; validation, C.S., S.Ö.C. and K.K.; formal analysis, K.K.; investigation, C.S.; resources, S.C.; writing—original draft preparation, S.C. and S.Ö.C.; writing—review and editing, S.C., S.Ö.C., C.S. and K.K.; visualization, S.C.; supervision, C.S., S.Ö.C. and K.K.; project administration, K.K.; funding acquisition, K.K. All authors have read and agreed to the published version of the manuscript.
Funding
Publishing fees funded by the Deutsche Forschungsgemeinschaft (DFG, German Research Foundation)–Projektnumber 491268466 and the Hamburg University of Technology (TUHH) in the funding programme “Open Access Publishing”. We would like to thank the German Academic Exchange Service (DAAD) for their scholarship to Senem Önen Cinar.
Institutional Review Board Statement
Not applicable.
Informed Consent Statement
Not applicable.
Data Availability Statement
Not applicable.
Conflicts of Interest
The authors declare no conflict of interest.
References
- Vögeli, Y.; Lohri, C.R.; Gallardo, A.; Diener, S.; Zurbrügg, C. Anaerobic Digestion of Biowaste in Developing Countries: Practical Information and Case Studies; Eawag—Swiss Federal Institute of Aquatic Science and Technology: Dübendorf, Switzerland, 2014. [Google Scholar]
- Birol, F. Germany 2020, Energy Policy Review; International Energy Agency: Paris, France, 2020. [Google Scholar]
- Da Gomez, C.C. Biogas as an energy option: An overview. In The Biogas Handbook; Woodhead Publishing: Sawston, UK, 2013; pp. 1–16. [Google Scholar]
- Fachagentur Nachwachsende Rohstoffe e.V. Guide to Biogas; Agency for Renewable Resources: Gulzow, Germany, 2012. [Google Scholar]
- Tabatabaei, M.; Ghanavati, H. Biogas; Springer: Cham, Switzerland, 2018; ISBN 978-3-319-77334-6. [Google Scholar]
- Treichel, H.; Fongaro, G. Improving Biogas Production; Springer: Cham, Switzerland, 2019; ISBN 978-3-030-10515-0. [Google Scholar]
- Deng, L.; Liu, Y.; Wang, W. Biogas Technology; Springer: Singapore, 2020; ISBN 978-981-15-4939-7. [Google Scholar]
- Nsair, A.; Cinar, S.O.; Alassali, A.; Abu Qdais, H.; Kuchta, K. Operational Parameters of Biogas Plants: A Review and Evaluation Study. Energies 2020, 13, 3761. [Google Scholar] [CrossRef]
- Rocamora, I.; Wagland, S.T.; Villa, R.; Simpson, E.W.; Fernández, O.; Bajón-Fernández, Y. Dry anaerobic digestion of organic waste: A review of operational parameters and their impact on process performance. Bioresour. Technol. 2020, 299, 122681. [Google Scholar] [CrossRef] [PubMed]
- Nsair, A.; Cinar, S.Ö.; Qdais, H.A.; Kuchta, K. Optimizing the performance of a large scale biogas plant by controlling stirring process: A case study. Energy Convers. Manag. 2019, 198, 111931. [Google Scholar] [CrossRef]
- Cinar, S.; Cinar, S.O.; Wieczorek, N.; Sohoo, I.; Kuchta, K. Integration of artificial intelligence into biogas plant operation. Processes 2021, 9, 85. [Google Scholar] [CrossRef]
- Önen, S.; Nsair, A.; Kuchta, K. Innovative operational strategies for biogas plant including temperature and stirring management. Waste Manag. Res. 2019, 37, 237–246. [Google Scholar] [CrossRef] [PubMed]
- Önen, S.; Kuchta, K. Evaluation of temperature changes in anaerobic digestion process. Detritus 2020, 10, 11–18. [Google Scholar] [CrossRef]
- Cinar, S.O.; Nsair, A.; Wieczorek, N.; Kuchta, K. Long-Term Assessment of Temperature Management in an Industrial Scale Biogas Plant. Sustainability 2022, 14, 612. [Google Scholar] [CrossRef]
- Liu, G.; Zhang, R.; El-Mashad, H.M.; Dong, R. Effect of feed to inoculum ratios on biogas yields of food and green wastes. Bioresour. Technol. 2009, 100, 5103–5108. [Google Scholar] [CrossRef]
- Seno, J.; Nyoman, I. The effect of feed to inoculums ratio on biogas production rate from cattle manure using rumen fluid as inoculums. Int. J. Sci. Eng. 2010, 1, 41–45. [Google Scholar]
- Pham, C.H.; Saggar, S.; Vu, C.C.; Tate, K.R.; Tran, T.T.T.; Luu, T.T.; Ha, H.T.; Nguyen, H.L.T.; Sommer, S.G. Biogas production from steer manures in Vietnam: Effects of feed supplements and tannin contents. Waste Manag. 2017, 69, 492–497. [Google Scholar] [CrossRef]
- Deepanraj, B.; Sivasubramanian, V.; Jayaraj, S. Effect of substrate pretreatment on biogas production through anaerobic digestion of food waste. Int. J. Hydrog. Energy 2017, 42, 26522–26528. [Google Scholar] [CrossRef]
- Ma, X.; Jiang, T.; Chang, J.; Tang, Q.; Luo, T.; Cui, Z. Effect of substrate to inoculum ratio on biogas production and microbial community during hemi-solid-state batch anaerobic co-digestion of rape straw and dairy manure. Appl. Biochem. Biotechnol. 2019, 189, 884–902. [Google Scholar] [CrossRef] [PubMed]
- Begum, S.; Anupoju, G.R.; Sridhar, S.; Bhargava, S.K.; Jegatheesan, V.; Eshtiaghi, N. Evaluation of single and two stage anaerobic digestion of landfill leachate: Effect of pH and initial organic loading rate on volatile fatty acid (VFA) and biogas production. Bioresour. Technol. 2018, 251, 364–373. [Google Scholar] [CrossRef] [PubMed]
- Orhorhoro, E.K.; Ebunilo, P.O.; Sadjere, G.E. Effect of organic loading rate (OLR) on biogas yield using a single and three-stages continuous anaerobic digestion reactors. Int. J. Eng. Res. Afr. 2018, 39, 147–155. [Google Scholar] [CrossRef]
- Haryanto, A. Effect of hydraulic retention time on biogas production from cow dung in a semi continuous anaerobic digester. Int. J. Renew. Energy Dev. 2018, 7, 93–100. [Google Scholar] [CrossRef]
- Santos, F.S.; Ricci, B.C.; Neta, L.S.F.; Amaral, M.C.S. Sugarcane vinasse treatment by two-stage anaerobic membrane bioreactor: Effect of hydraulic retention time on changes in efficiency, biogas production and membrane fouling. Bioresour. Technol. 2017, 245, 342–350. [Google Scholar] [CrossRef]
- Musa, M.A.; Idrus, S. Effect of Hydraulic Retention Time on the Treatment of Real Cattle Slaughterhouse Wastewater and Biogas Production from HUASB Reactor. Water 2020, 12, 490. [Google Scholar] [CrossRef] [Green Version]
- Sukpancharoen, S.; Phetyim, N. Green hydrogen and electrical power production through the integration of CO2 capturing from biogas: Process optimization and dynamic control. Energy Rep. 2021, 7, 293–307. [Google Scholar] [CrossRef]
- Chen, L.; Cong, R.-G.; Shu, B.; Mi, Z.-F. A sustainable biogas model in China: The case study of Beijing Deqingyuan biogas project. Renew. Sustain. Energy Rev. 2017, 78, 773–779. [Google Scholar] [CrossRef] [Green Version]
- Mustafa, M.Y.; Calay, R.K.; Román, E. Biogas from organic waste-a case study. Procedia Eng. 2016, 146, 310–317. [Google Scholar] [CrossRef] [Green Version]
- Scarlat, N.; Dallemand, J.-F.; Fahl, F. Biogas: Developments and perspectives in Europe. Renew. Energy 2018, 129, 457–472. [Google Scholar] [CrossRef]
- Wahmkow, C.; Knape, M.; Konnerth, E. Biogas Intelligence-operate biogas plants using Neural Network and Fuzzy logic. In Proceedings of the 2013 Joint IFSA World Congress and NAFIPS Annual Meeting (IFSA/NAFIPS), Edmonton, AB, Canada, 24–28 June 2013; IEEE: Piscataway, NJ, USA, 2013. [Google Scholar]
- Meran, R.; John, A.; Roenpage, O.; Staudter, C.; Lunau, S. Six Sigma + Lean Toolset: Mindset for Successful Implementation of Improvement Projects; Springer: Berlin/Heidelberg, Germany, 2013; ISBN 3642358829. [Google Scholar]
- Singh, M.; Rathi, R. A structured review of Lean Six Sigma in various industrial sectors. Int. J. Lean Six Sigma 2019, 10, 622–664. [Google Scholar] [CrossRef]
- Töpfer, A. Lean Six Sigma: Erfolgreiche Kombination von Lean Management, Six Sigma und Design for Six Sigma; Springer: Berlin/Heidelberg, Germany, 2008; ISBN 3540850600. [Google Scholar]
- Kaswan, M.S.; Rathi, R. Analysis and modeling the enablers of green lean six sigma implementation using interpretive structural modeling. J. Clean. Prod. 2019, 231, 1182–1191. [Google Scholar] [CrossRef]
- Kaswan, M.S.; Rathi, R. Green Lean Six Sigma for sustainable development: Integration and framework. Environ. Impact Assess. Rev. 2020, 83, 106396. [Google Scholar] [CrossRef]
- Gupta, S.; Modgil, S.; Gunasekaran, A. Big data in lean six sigma: A review and further research directions. Int. J. Prod. Res. 2020, 58, 947–969. [Google Scholar] [CrossRef]
- De Clercq, D.; Jalota, D.; Shang, R.; Ni, K.; Zhang, Z.; Khan, A.; Wen, Z.; Caicedo, L.; Yuan, K. Machine learning powered software for accurate prediction of biogas production: A case study on industrial-scale Chinese production data. J. Clean. Prod. 2019, 218, 390–399. [Google Scholar] [CrossRef]
- Cinar, S.Ö.; Cinar, S.; Kuchta, K. Machine Learning Algorithms for Temperature Management in the Anaerobic Digestion Process. Fermentation 2022, 8, 65. [Google Scholar] [CrossRef]
- Taghizadegan, S. Essentials of Lean Six Sigma; Elsevier: Amsterdam, The Netherlands, 2010; ISBN 0080462324. [Google Scholar]
Figure 1.
Treatment process of biowaste at the site.
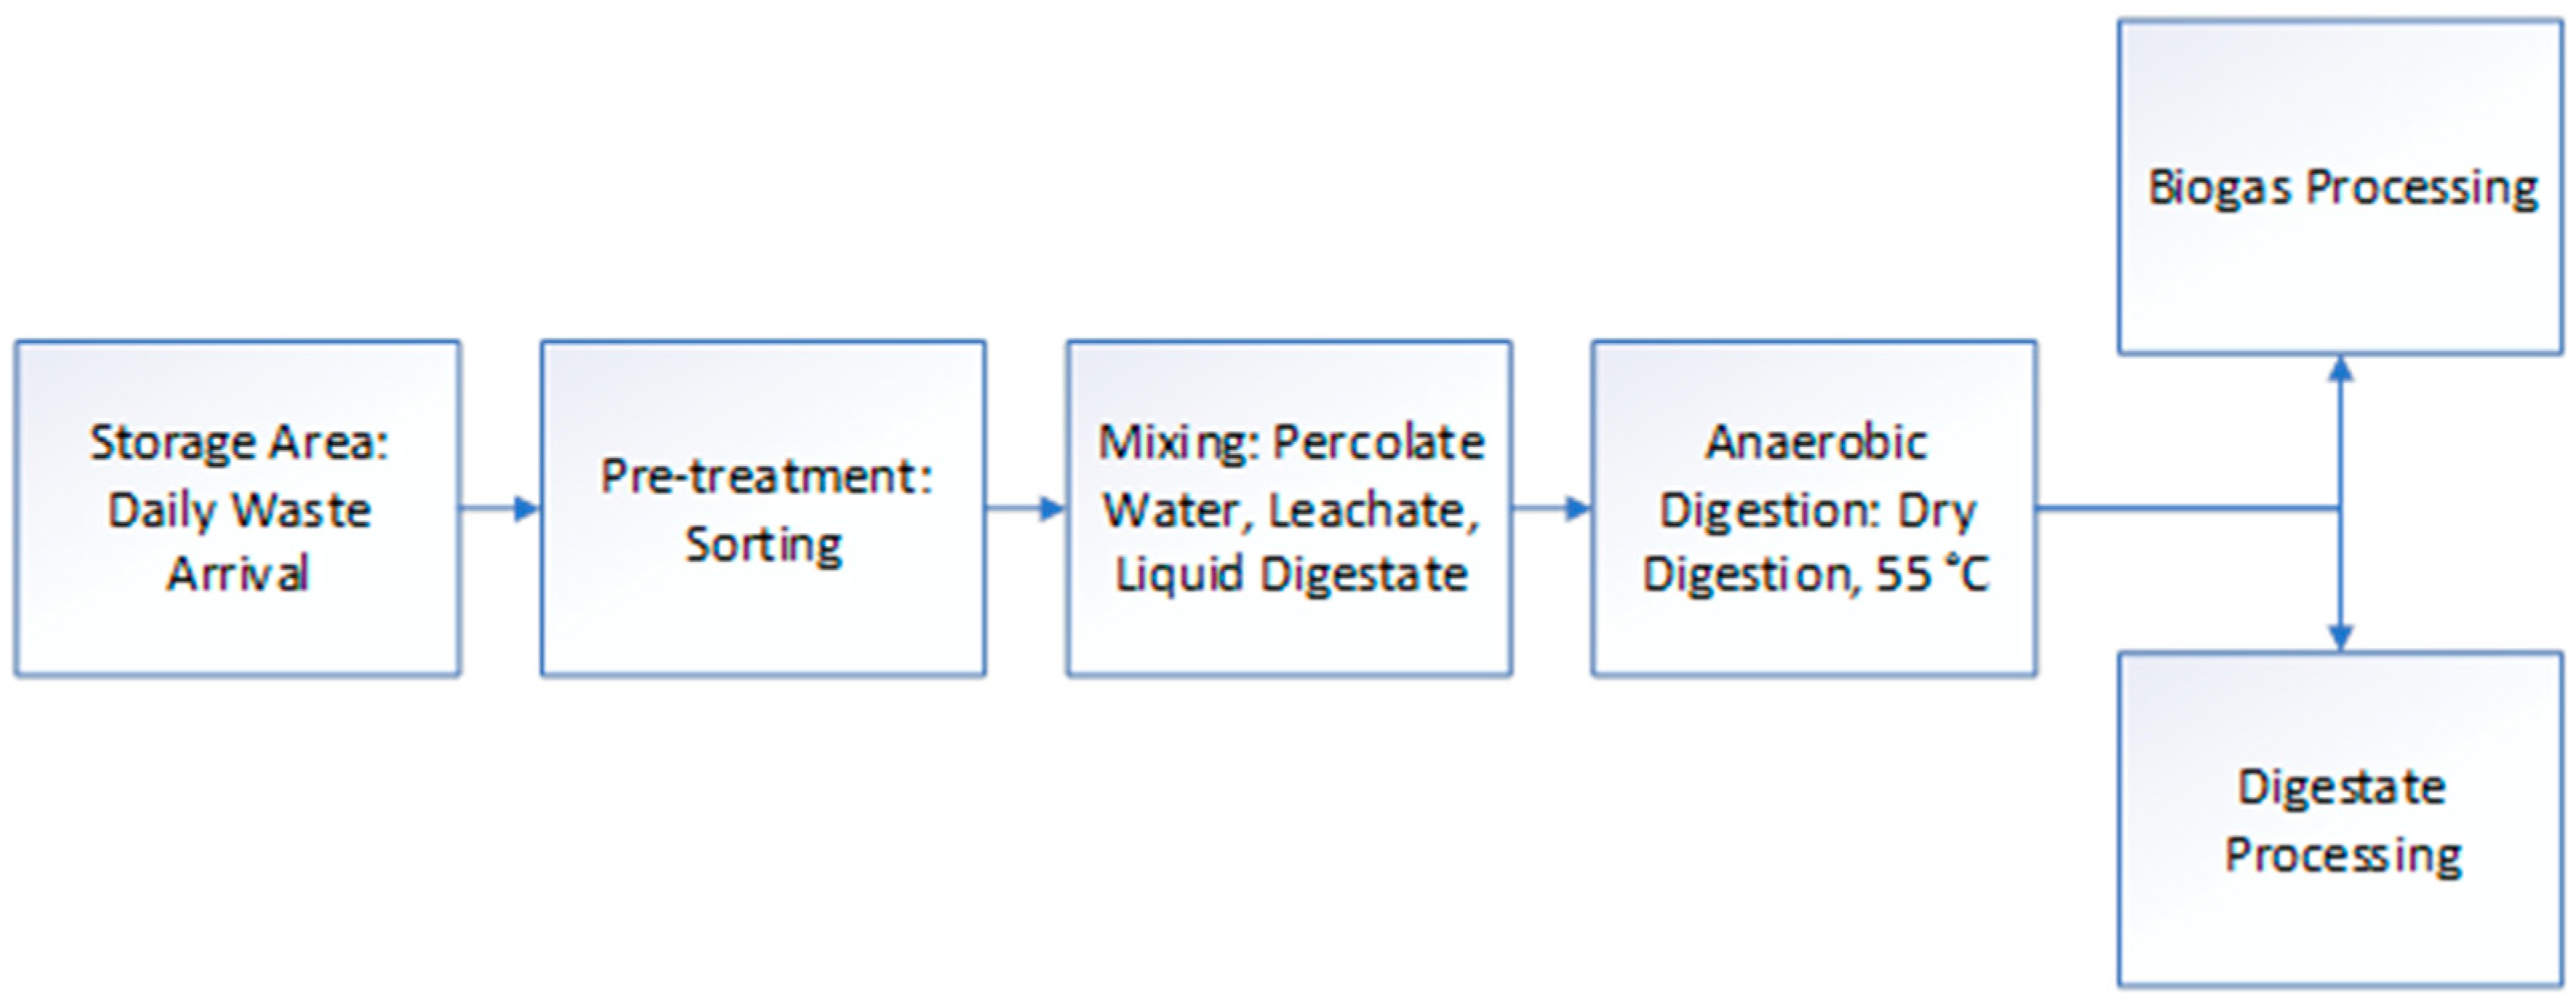
Figure 2.
SIPOC: Supplier, Input, Process, Output, Customer.

Figure 3.
Control chart of biogas plant operation within a year.

Figure 4.
Fishbone diagram for cause–effect analyses.
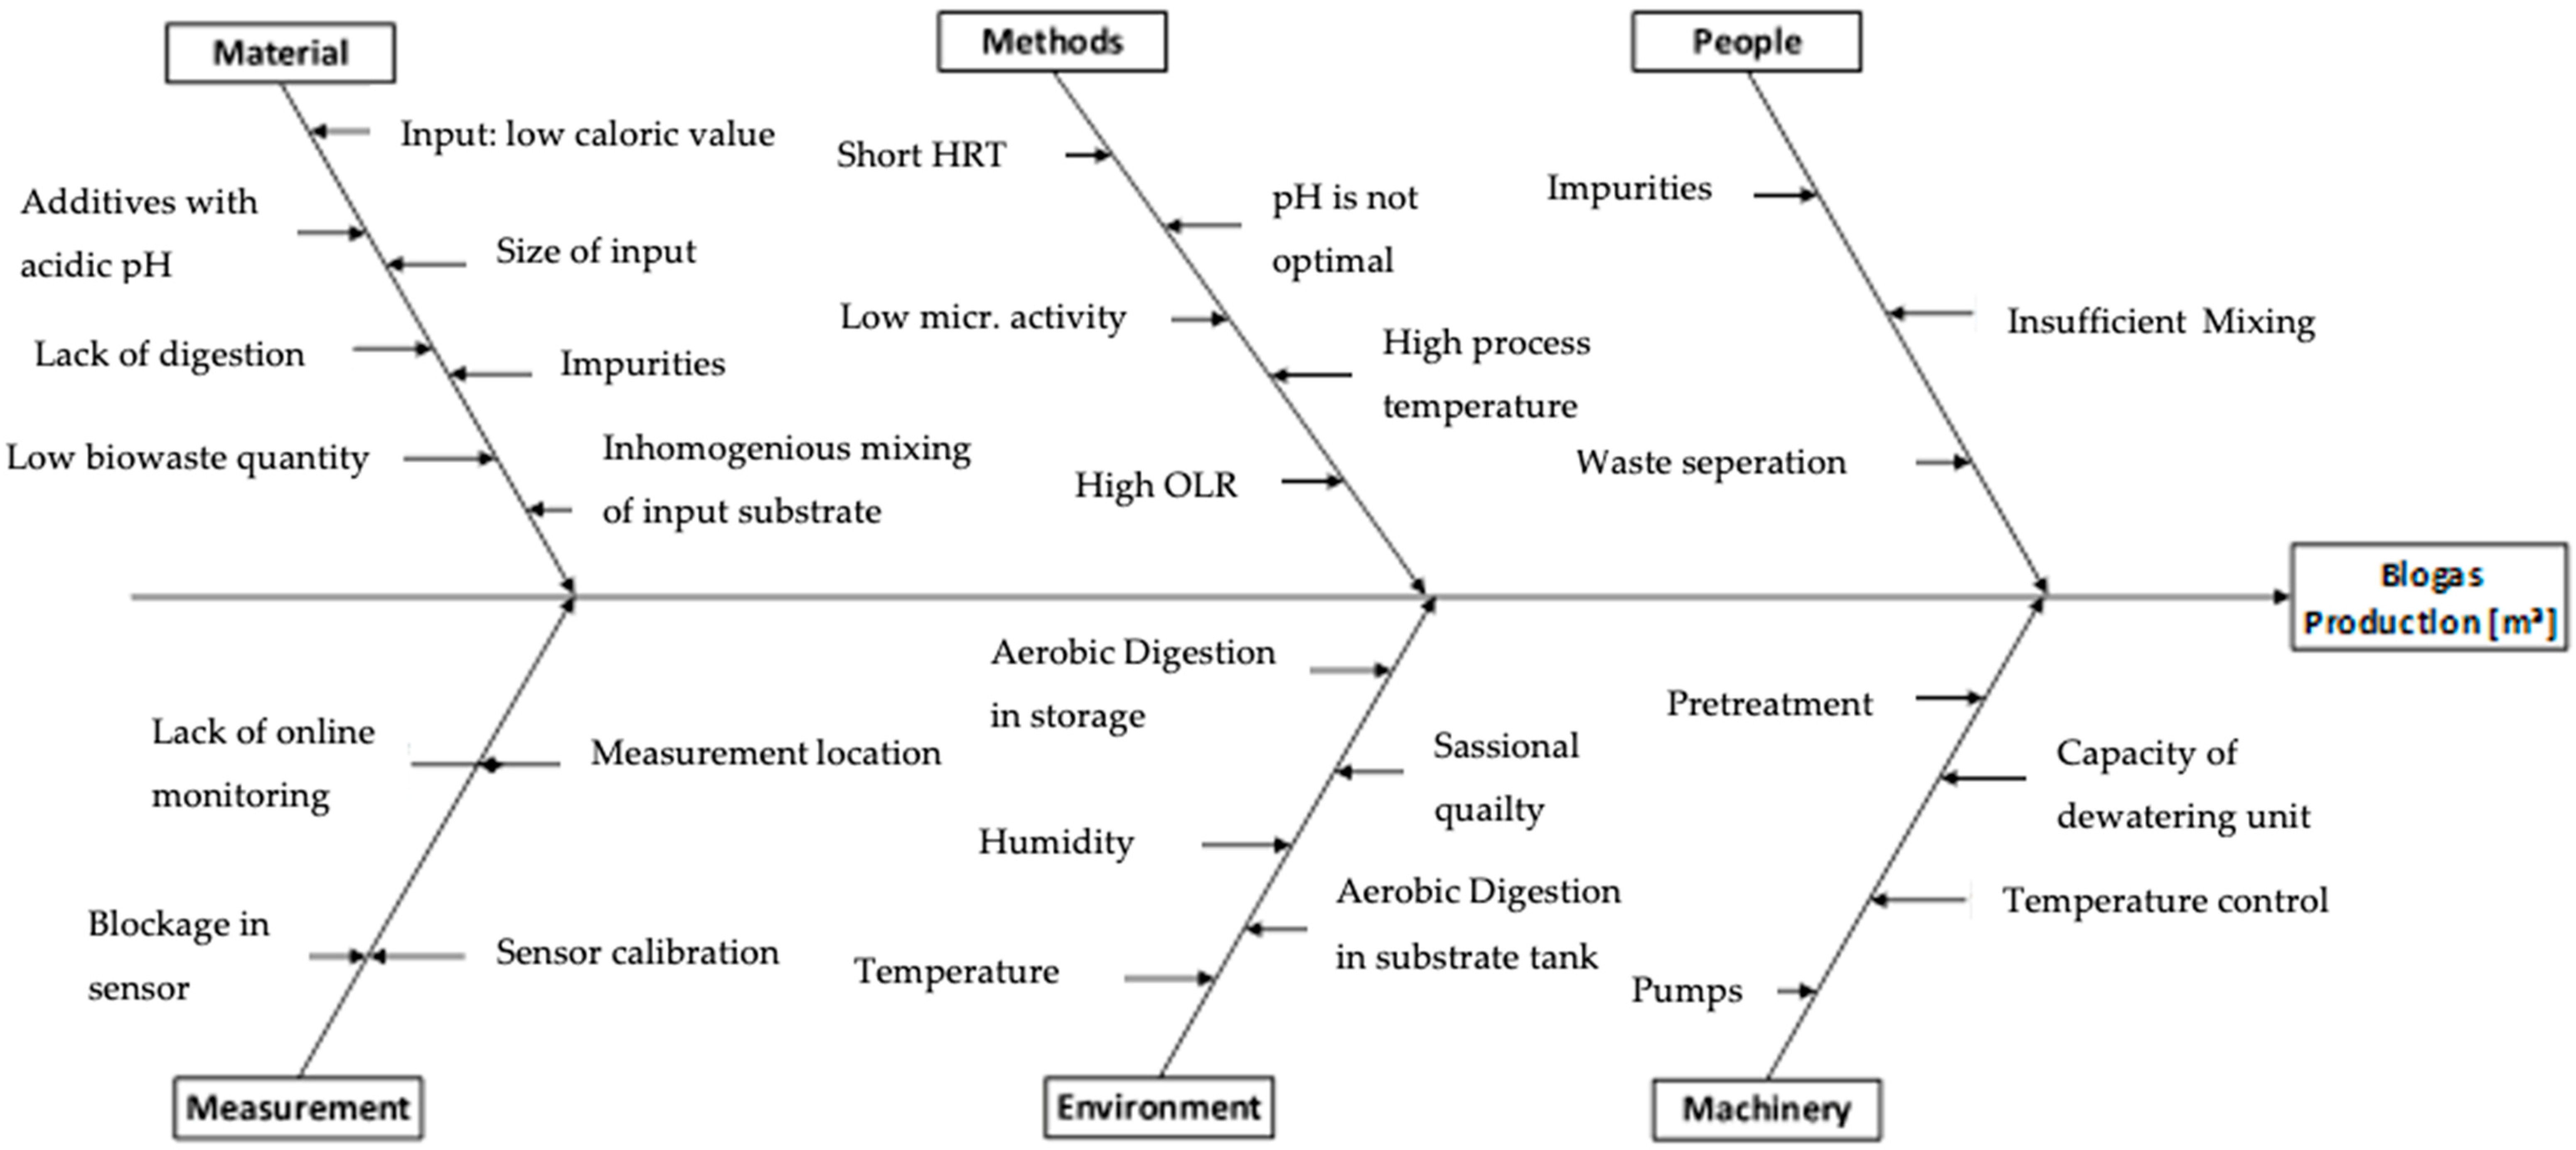
Figure 5.
Process flow diagram of the biogas plant.

Figure 6.
Specific biomethane production of samples (NmL/g VS): (a) Freshness of the substrate; (b) Sand content of the substrate.
Figure 6.
Specific biomethane production of samples (NmL/g VS): (a) Freshness of the substrate; (b) Sand content of the substrate.
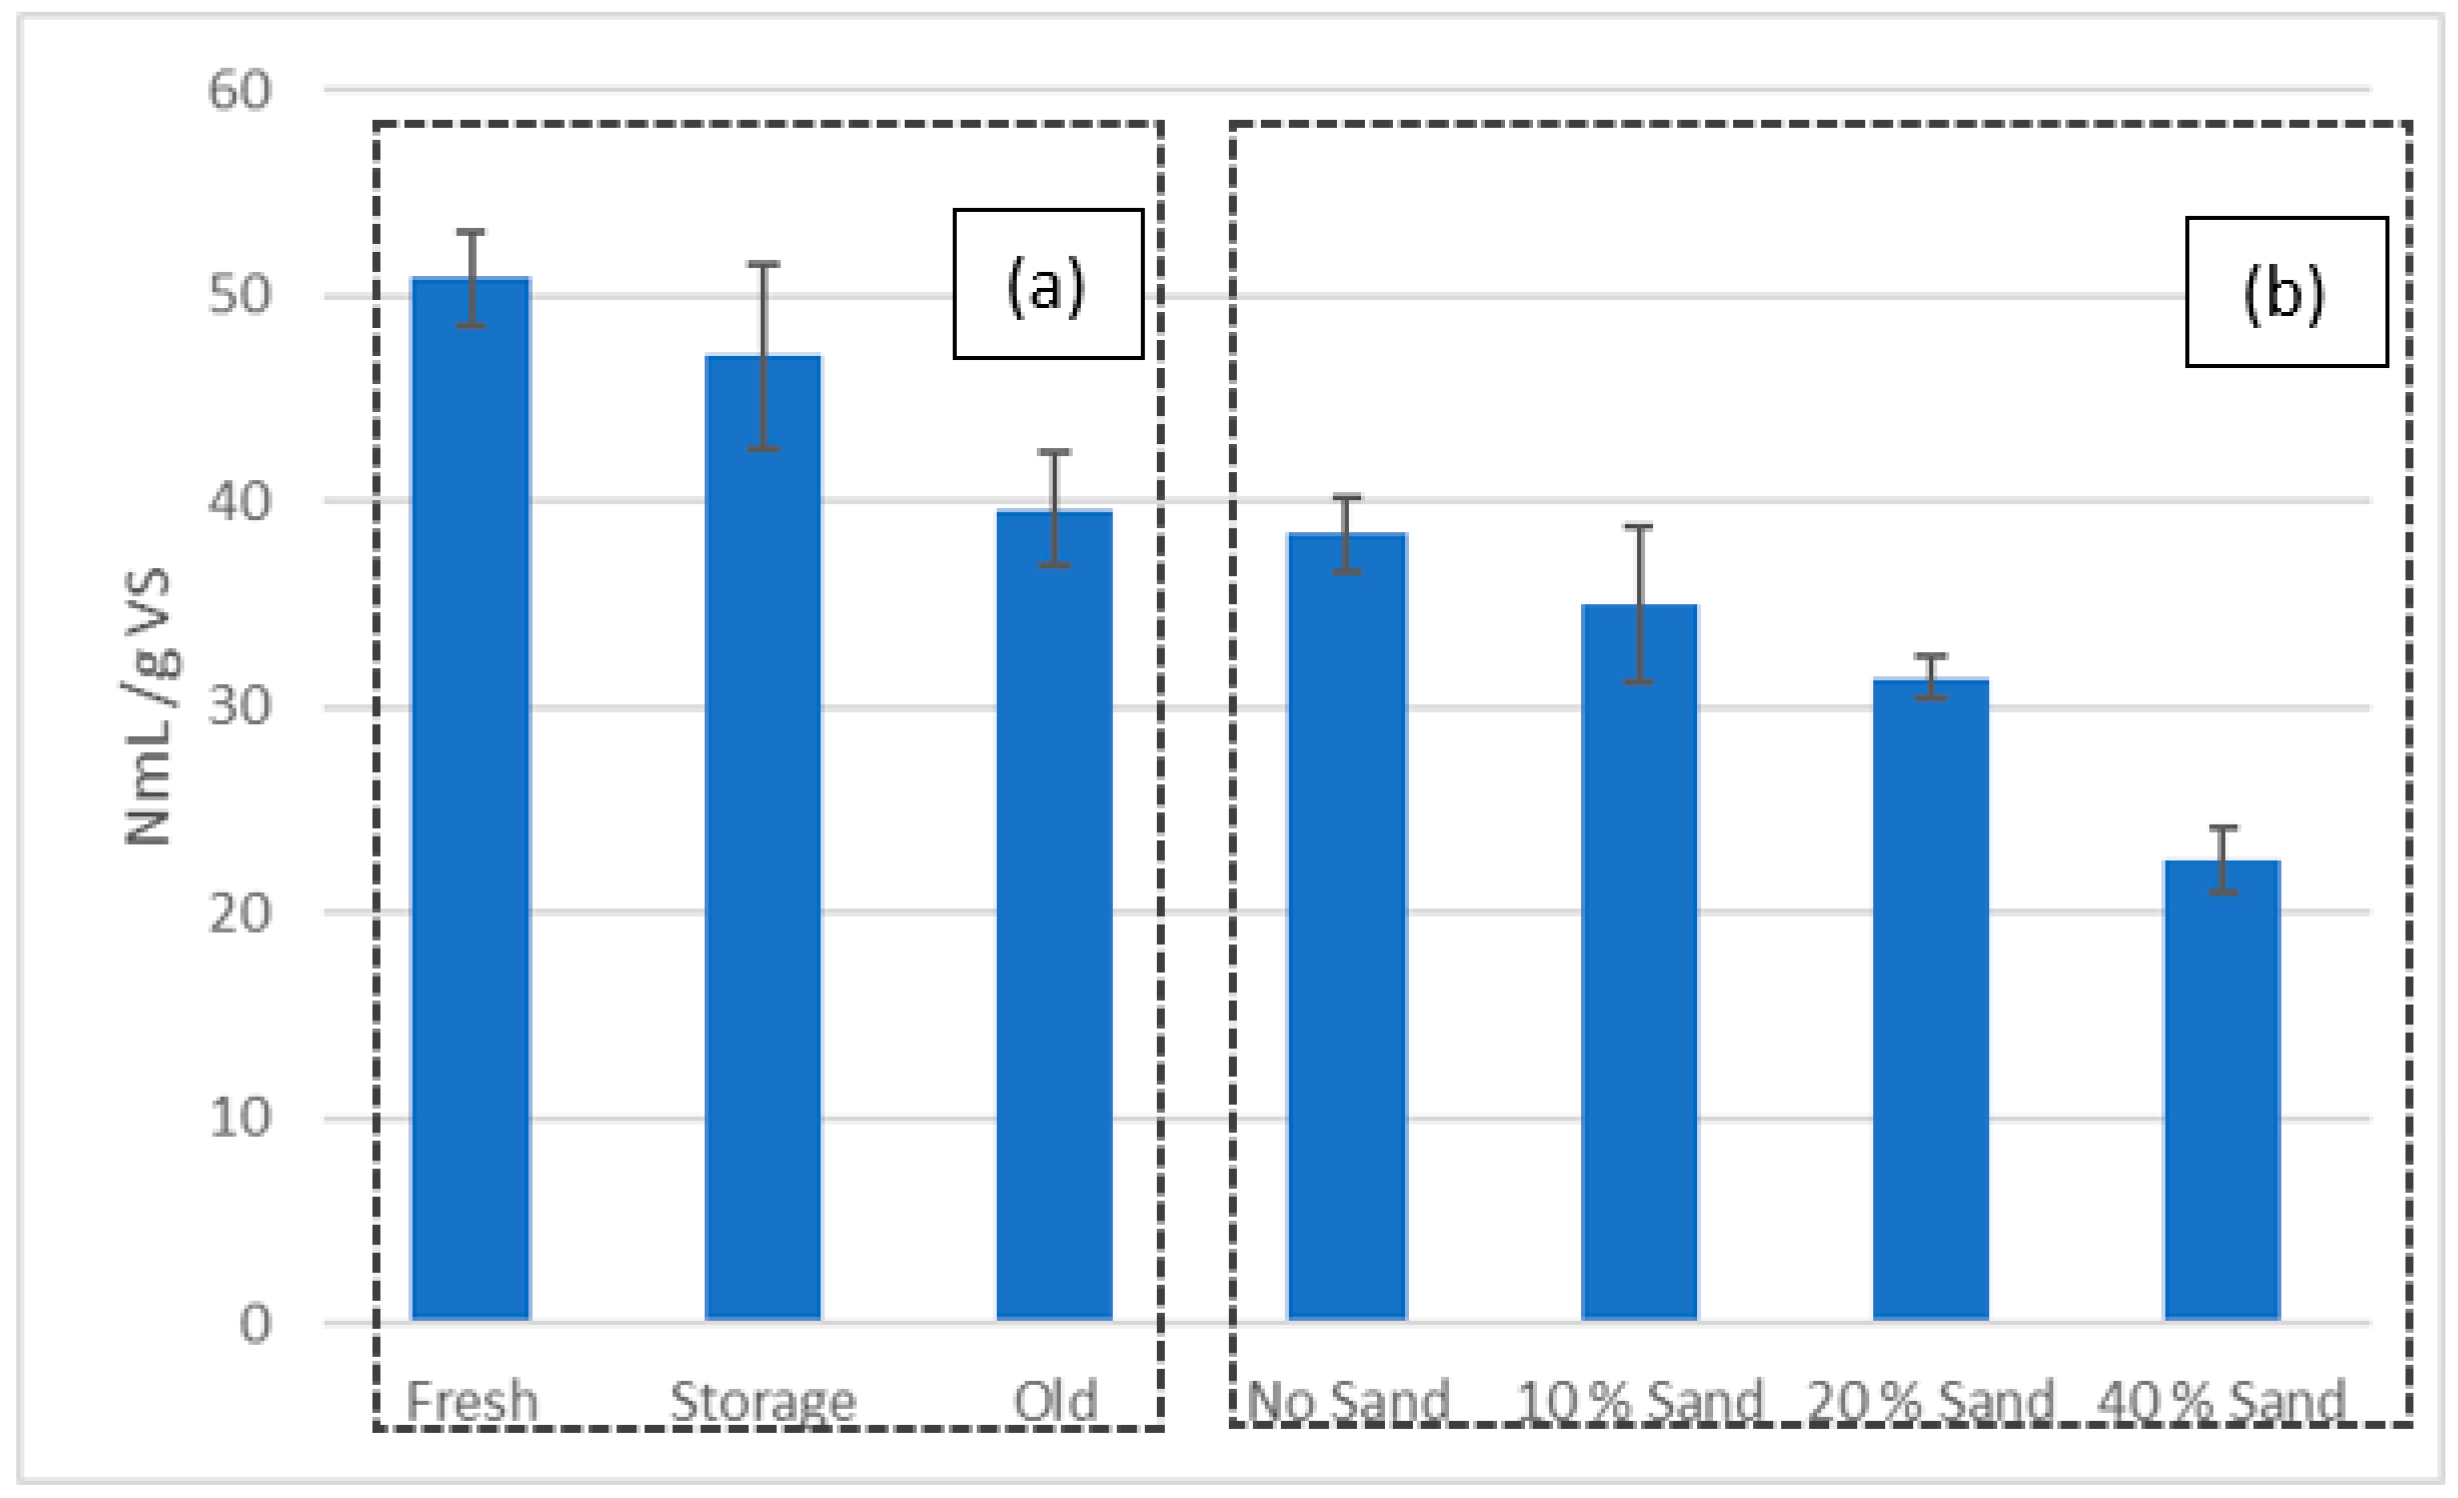
Figure 7.
Effort–Benefit Matrix of possible solutions.

Table 1.
Tool 2–Metrics Matrix.
| CTC | Quantity Gas Fermenter (m3 h−1) | Pressure of Biogas in Central Storage (mbar) | CHP 1 Gas Quantity (m3 h−1) | CHP 2 Gas Quantity (m3 h−1) | Total Digestate for Dewatering (L) |
|---|---|---|---|---|---|
| Average biogas generated should reach the target goal of 250 m3 h−1 | 9–Strong Correlation | 3–Medium Correlation | 3–Medium Correlation | 3–Medium Correlation | 1–Weak Correlation |
Table 2.
Operational Definition.
| Metric(s) | Measuring Device | Measurement Method(s) | Decision Criteria |
|---|---|---|---|
| Biogas in m3 | Sensor | The volume of biogas produced from anaerobic digestion in the fermenter every second is detected by sensor. However, the volume of biogas produced would be summed up by a computing system automatically at the end of the day. Therefore, volume flow of biogas produced per day is registered and recorded. | Volume of biogas produced per day by fermenter is given consideration. Volume of biogas produced per second by fermenter is considered. One day is from 00:00:00 to 23:59:59. |
Table 3.
Data gathering plan.
| Variable | Art der Variable | Type (C/D) | Responsible | Method | Date/Time/Frequency | Data Source | Target |
|---|---|---|---|---|---|---|---|
| Biogas produced by Fermenter | Output | C | Employee at the company | Volume of biogas produced per day would be recorded later in an excel file | Start: 1 January 2020 00:00:00 Stop: 31 December 2020 23:59:59Total samples: 366 measurements. | Directly after the Fermenter | 5500 m3 d−1 |
Table 4.
Tools for understanding the variation.
| At a Time | Over Time | |
|---|---|---|
| Discrete | Pareto–Diagram Bar Chart Pie Chart | Run Chart Control Charts (p–Chart, np–Chart, c–Chart, U–Chart) |
| Continuous | Histogram Boxplot Dot Plot Multi-Variation Chart | Run Chart Control Charts (I/MR Chart, X-bar R Chart, X-bar S Chart) |
Table 5.
Possible causes from fishbone diagram.
| Potential Cause | Definition |
|---|---|
| Hydraulic Retention Time | HRT is too short and is non-ideal for current process |
| Low Biogas Potential | Input waste substrate has low biogas potential |
| Size of substrate | The size of input substrate is big for the process |
| Leachate | Addition of leachate and percolate water with acidic pH |
| Pre-treatment | Inhomogeneous pre-mixing of input substrate at mixer |
| Lack of digestion | Waste substrate is not entirely anaerobically digested within fermenter |
| Impurities | High sand content (impurities) in input waste substrate |
| Quality of Input | Changing quality of the input waste material along the year |
| Quantity of Input | Low biowaste quantity delivered |
Table 6.
Experiments for potential root causes.
| Experiment | Covered Potential Cause |
|---|---|
| AMPTS II–BMP for different particle sizes | Quality of the input |
| AMPTS II–BMP for different freshness of the substrate | Quality and quantity of the input |
| AMPTS II–BMP through the output of fermentation residues | Hydraulic Retention time |
| AMPTS II–Importance of pre-treatment for sand content | Impurities, pre-treatment |
| BMP in climate room–BMP for different leachate contents | Leachate |
| Determination of sand content from different points | Impurities and quality of the input |
| TS & vs.–TS and vs. of the substrate and digestate samples | Quality of the input |
Table 7.
List of experiments conducted.
| Experiment |
|---|
| AMPTS II–BMP for different particle sizes |
| AMPTS II–BMP for different freshness of the substrate |
| AMPTS II–BMP through the output of fermentation residues |
| AMPTS II–Importance of pre-treatment for sand content |
| GB21–Leachate content |
| Determination of sand content from different points |
| TS & OTS–TS and vs. of the substrate |
Table 8.
p-values after hypothesis tests for each experiment.
| Possible Cause(s) | p-Value | Explanation |
|---|---|---|
| Particle size of the substrate | p < 0.001 | Null hypothesis rejected |
| Freshness of the substrate | p < 0.001 | Null hypothesis rejected |
| Hydraulic Retention Time | p > 0.05 | Null hypothesis is not rejected |
| Amount of Leachate | p > 0.05 | Null hypothesis is not rejected |
| Sand Content | p < 0.001 | Null hypothesis rejected |
Table 9.
Root Causes.
| No. | Root Cause(s) |
|---|---|
| 1 | Particle size of the substrate |
| 2 | Freshness of the substrate |
| 3 | Hydraulic Retention Time |
| 4 | Sand Content |
Table 10.
Possible solution ideas.
| No. | Idea | No. of Root Cause |
|---|---|---|
| 1 | Usage of fresh substrate only | 2, 3 |
| 2 | Increase the capacity of the fermenter | 2, 3 |
| 3 | Addition of thermal pre-treatment | 1, 2, 4 |
| 4 | Vibratory sand separator to remove the sand | 1 |
| 5 | Self-screening bins to remove the sand | 1 |
| 6 | In the waste truck screening to remove the sand | 4 |
| 7 | Magnet and shredder for particle reduction | 4 |
| 8 | Trommel screen to remove the sand | 4 |
| 9 | Install grit chamber | 4 |
| 10 | Install wet fermenter | 3 |
| 11 | Install Hyrocyclone | 4 |
Table 11.
Solution–Cause Matrix (S is Solution).
| S 1 | S 2 | S 3 | S 4 | S 5 | S 6 | S 7 | S 8 | S 9 | S 10 | |
|---|---|---|---|---|---|---|---|---|---|---|
| Particle size of the substrate | 0 | 0 | 2 | 0 | 1 | 1 | 1 | 0 | 0 | 2 |
| Freshness of the substrate | 2 | 1 | 2 | −1 | 1 | 1 | 0 | −1 | 0 | −1 |
| HRT | 2 | 2 | 0 | 0 | 1 | 2 | 0 | 0 | 0 | −1 |
| Sand Content | 0 | 0 | 2 | 2 | 2 | 1 | 2 | 2 | 1 | 2 |
| Total | 4 | 3 | 6 | 1 | 5 | 5 | 3 | 1 | 1 | 2 |
Publisher’s Note: MDPI stays neutral with regard to jurisdictional claims in published maps and institutional affiliations. |
© 2022 by the authors. Licensee MDPI, Basel, Switzerland. This article is an open access article distributed under the terms and conditions of the Creative Commons Attribution (CC BY) license (https://creativecommons.org/licenses/by/4.0/).
Share and Cite
MDPI and ACS Style
Cinar, S.; Önen Cinar, S.; Staudter, C.; Kuchta, K. Operational Excellence in a Biogas Plant through Integration of Lean Six Sigma Methodology. Designs 2022, 6, 61. https://doi.org/10.3390/designs6040061
AMA Style
Cinar S, Önen Cinar S, Staudter C, Kuchta K. Operational Excellence in a Biogas Plant through Integration of Lean Six Sigma Methodology. Designs. 2022; 6(4):61. https://doi.org/10.3390/designs6040061
Chicago/Turabian StyleCinar, Samet, Senem Önen Cinar, Christian Staudter, and Kerstin Kuchta. 2022. "Operational Excellence in a Biogas Plant through Integration of Lean Six Sigma Methodology" Designs 6, no. 4: 61. https://doi.org/10.3390/designs6040061