
The Design and Construction of a Grid Skyline for Custom-Built PC Recommendations Based on a Multi-Attribute Model

1
Division of Software Engineering, Pai Chai University, Daejeon 35345, Republic of Korea
2
Department of Computer Engineering, Pai Chai University, Daejeon 35345, Republic of Korea
*
Author to whom correspondence should be addressed.
Designs 2023, 7(5), 104; https://doi.org/10.3390/designs7050104
Submission received: 4 July 2023
/
Revised: 25 August 2023
/
Accepted: 30 August 2023
/
Published: 31 August 2023
(This article belongs to the Special Issue Advances in Communication Technology with Artificial Intelligence)
Abstract
:In recent years, people have been buying custom-built PCs based on the performance they want and what they will use them for. However, there are many challenges for non-technical users when purchasing a custom-built PC. Not only is the terminology of computer devices unfamiliar to non-experts, but there are many specifications for different computer devices that need to be considered. Therefore, this paper proposes a method for recommending appropriate device models when purchasing custom-built PCs using a skyline. Because different computer devices have different specifications, we need a method that takes into account multiple attributes. Skyline querying is a technique that considers multiple attributes of an object and indexes them in order of user satisfaction. A grid skyline is a technique that uses a grid-based partitioning technique to reduce the number of calculations of the dominance relationship between objects in the existing skyline technique, thus reducing the index construction time. We measured the similarity between the results of the grid skyline and the leaderboard for each model of computer device. As a result of this experiment, compared to the leaderboard categorized by model of computer device, the average score was 88 out of 100, which was similar to the actual leaderboard.
1. Introduction
In the ever-evolving landscape of technology, marked by the rise of smartphones and their impact on computer ownership, an intriguing shift has occurred wherein the trajectory of computer purchases, initially on a decline, took a notable turn in 2021. This shift can be attributed to the widespread adoption of telecommuting practices fueled by the unprecedented outbreak of the coronavirus, which propelled an increasing number of individuals to acquire computers for remote work purposes [1,2]. As telecommuting became more prevalent, the utilization of computers underwent significant diversification, with users seeking out devices tailored to their specific needs. Gone are the days when most people settled for pre-built PCs with standardized specifications; in recent years, users have sought to leverage computers for an array of tasks, ranging from basic document work to computationally intensive endeavors like video editing and software development. To align with these diverse requirements, users have increasingly embraced the practice of assembling custom-built systems or opting for laptops that align with their desired specifications. In today’s digital landscape, the advent of online shopping has made acquiring custom-built PCs a streamlined process. Users can conveniently navigate through a variety of devices, leveraging filtering options to select devices that meet their desired specifications, which are often sorted by price or sales volume to facilitate decision making. However, the challenge lies in the fact that different computer components possess varying specifications, making it arduous to find the perfect device that strikes the ideal balance between performance and cost solely through a simplistic filtering system. For instance, a graphics card may feature specifications such as core speed, boost or turbo clock, memory speed, memory bus, and process architecture, each of which may significantly impact the device’s capabilities. Attempting to accommodate these divergent specifications within a single filter becomes complex, particularly when combining multiple devices to form a cohesive computer system. Moreover, the intricate terminology associated with computer components poses an additional hurdle for users who are unfamiliar with these intricacies, further impeding their ability to effectively utilize filters to pinpoint devices that align with their desired specifications. Recognizing these challenges, the primary objective of this paper is to introduce a novel approach in the form of a skyline query that leverages the comprehensive range of device specifications to provide tailored recommendations for users based on their intended purposes. A skyline query is an indexing technique that enables the fast retrieval of desired data from multiple attributes or large volumes of data [3]. Soundararajan et al. proposed a method to optimize the skyline to recommend products that users prefer. They use a dynamic skyline, as users’ preferences are constantly changing [4]. Chowdhury et al. applied skyline queries to support location-based services. They proposed a framework for efficiently computing routes in a road network to find alternative routes from an origin to a destination [5]. A skyline considers all the attributes of the data or object to find the most satisfactory data for the user and uses an index to find results by looking at only a subset of the entire data, allowing for a fast search [6,7,8].
2. Related Work
In Section 2, we provide a description and describe the process of skyline queries, and we describe GridPPPS, a complementary approach to traditional skyline queries.
2.1. Skyline Query
Top-k query processing serves as a highly effective and efficient approach to extracting the crème de la crème of data, ensuring the retrieval of the most exceptional and top-scoring tuples by assigning scores to each tuple within the database. The resulting outcome is a display of the k highest scoring tuples, representing a concise and pertinent summary of the input data [9]. To further optimize the speed and efficiency of top-k query processing, the creation of an index emerges as a crucial step, facilitating the retrieval of specifically targeted data while minimizing unnecessary overheads. Among the multitude of indexing techniques available, hierarchical indexing emerges as a representative and notable option [10,11]. Hierarchical indexing is a method that creates a hierarchy by representing the values of the d attributes in the data as points in a d-dimensional space.
Within the realm of hierarchical indexing techniques, one approach that stands out is the skyline technique. The fundamental premise of this technique revolves around the meticulous identification of objects that proudly elude the domination of other attributes. To clarify, domination in this context signifies that a given object boasts superior values across all attributes compared to its counterparts. Hence, a skyline represents a distinguished and unparalleled set of tuples that reign supreme, remaining unconquerable by any other tuple within the vast expanse of the dataset [12]. Using skylines as an indexing mechanism, researchers can swiftly navigate through the data landscape, rapidly pinpointing the desired results by exclusively examining a well-defined subset of the comprehensive dataset.
The basic process of querying using a skyline is described below. Table 1 shows the specification data for graphics cards from different companies. Our goal is to find a model with good specs and a low price. We consider two attributes: the specs of the model and the price.
Comparing D and H in Table 1, assuming that both spec 1 and price are smaller, D has a smaller value than H in all attributes, which means that D dominates H. This comparison shows that D dominates H, I, J, and K, and B dominates G. From this comparison, we can see that D dominates H, I, J, and K, and B dominates G. The dominance relationships can be seen in Figure 1.
In another example, when comparing D and C, D is cheaper but has lower specifications than C. Therefore, their relationship is non-dominant, and D and C are included in the skyline. A, B, C, D, E, and F are included in the skyline and not dominated. The result of the skyline is represented by the black line shown in Figure 1.
Block-nested loops (BNL) stands as an early pioneering method proposed for skyline exploration [13]. In the realm of BNL, a pivotal concept that assumes significance is that of a window, i.e., a designated storage space specifically designed to house a collection of skyline candidates [14]. The fundamental principle underlying BNL involves the construction of a skyline by pitting the input data against the candidates residing within the window. As this comparison process unfolds, a crucial determination is made; if it is established that the skyline candidates ensconced within the window exhibit dominance over the current input data, the data are promptly removed from the ongoing comparison process. Conversely, if the input data are found to exert dominance over the skyline candidates, the latter are expeditiously eliminated from the confines of the window.
This intricate comparison operation is repeated until the input data have been exhaustively evaluated against each and every candidate residing within the skyline window. In the process of comparison, if they have not been removed until the end, the corresponding data are added as candidates for the window. Thus, BNL operates as an iterative process, i.e., a refined collection of skyline candidates, via a series of rigorous and dynamic comparisons, laying the foundation for subsequent explorations and analyses.
During the intricate process described earlier, wherein data are judiciously added to the window, the following important consideration arises: the inclusion of data that ultimately cannot qualify as part of the skyline. This seemingly innocuous action can inadvertently lead to a plethora of unnecessary comparison operations and the frequent replacement of skyline candidates. Furthermore, should the window reach its capacity during this process, the skyline candidates will be relocated to a separate temporary space, only to be compared with the window once again in subsequent iterations. Consequently, selecting data that lack the potential to become part of the skyline introduces a significant increase in the number of superfluous comparisons, inevitably resulting in a substantial spike in the time required to build the skyline.
To address these inherent challenges, a notable technique called soft-filter-skyline (SFS) emerges as a solution. It was proposed by Chomicki et al. and is the most representative skyline technique [15]. SFS stands as the epitome of skyline techniques, delivering an effective remedy for the shortcomings of BNL. This method tackles the problem at its core, leveraging the concept of entropy values to efficiently curtail the number of dominance comparisons between objects. By incorporating entropy-based filtering mechanisms, SFS strategically identifies and prioritizes the most relevant and promising candidates, significantly mitigating the need for excessive comparisons and streamlining the skyline detection process. SFS is designed to solve the problem of BNL and uses entropy values to reduce the number of dominance comparisons between objects.
The expression for finding the entropy value for a tuple T is given by Equation (1). In Equation (1), is the value of the -th attribute.
This computes the entropy value and sorts the objects by comparing their attribute values to form a skyline of non-dominant objects. By leveraging the concept of entropy, which measures the level of uncertainty or randomness within a given dataset, SFS intelligently distinguishes between significant skyline candidates and those less likely to contribute to the final skyline result. This process allows SFS to prioritize and focus on the most potentially dominant candidates, effectively reducing the overall number of dominance comparisons required during the skyline detection process. SFS effectively streamlines the computation-intensive task of dominance comparison, eliminating the need to exhaustively compare each object against every other object. Also, SFS leverages entropy-based filtering to expedite the identification of dominant skyline candidates, significantly reducing the computational overhead and expediting the skyline process.
Other spatial partitioning methods include two notable approaches: angle-based space partitioning (ABSP) and plane project parallel skyline (PPPS). These methods exhibit the capacity to significantly reduce computing time by dividing the data space into multiple regions, thereby enabling more efficient analysis and retrieval of skylines. ABSP employs a novel strategy of utilizing angles to partition the space into distinct regions. By leveraging this approach, each skyline within the partitioned space can be individually identified, and subsequently, these skylines are amalgamated to form a unified skyline representation [16]. However, it is worth noting that ABSP possesses a drawback in the form of prolonged angle computation, which can contribute to increased processing time and hinder the overall efficiency of the method. On the other hand, PPPS introduces a different partitioning technique by utilizing projection to divide the data space. This entails projecting the values of each tuple onto a hyperplane, facilitating the creation of distinct partitions within the dataset [17]. PPPS serves as a method that aims to address the limitations of ABSP, offering potential remedies to its drawbacks. Nonetheless, one drawback associated with PPPS lies in the time-consuming process of constructing an index, particularly in high-dimensional databases. To overcome these limitations and strike a balance between efficiency and effectiveness, this paper adopts a method known as GridPPPS. GridPPPS is a powerful solution that effectively compensates for the shortcomings of both ABSP and PPPS. By leveraging GridPPPS, this research endeavors to construct a skyline that showcases the best attributes of both methods while mitigating their respective drawbacks. Therefore, in this paper, we use GridPPPS, which compensates for these shortcomings, to build a skyline.
2.2. GridPPPS
GridPPPS is a method that improves the index creation time of PPPS [18]. While ABSP and PPPS have a high number of comparisons between objects, GridPPPS has the advantage of reducing the number of comparisons, which can reduce the time complexity of building a skyline.
GridPPPS builds the skyline in the following order: the approximate skylining step, grid-based partitioning step, hyperplane-based partitioning step, local skylining step, and merging step. The first step is to approximate the skyline. Comparing many objects is expensive, so the goal is to reduce the number of comparisons by reducing the number of candidate objects. For each tuple, the entropy value is found, and a set of candidates with tuples is created with lower values. The tuples dominated by the set tuples are eliminated, and the approximate skyline is obtained through this process. Second, the data space is partitioned using a grid. The approximate skyline is partitioned using a grid-based partitioning technique. The grid-based partitioning method has the advantage of requiring less computing time than other partitioning methods due to its simplicity and low computer costs [19,20].
Third, we partition the data space based on the hyperplane in the same way as the PPPS. Then, we find the local skyline for each of the partitioned spaces. We use the SFS algorithm to obtain skylines in the segmented space. Finally, we merge all the generated skylines from different spaces to obtain a single skyline. Using this method, we can see that the number of dominance comparisons is significantly reduced compared to the previous method, which reduces the index-building time.
3. Experiments
We implemented the proposed method using C++. We conducted all the experiments using an Intel i5-1135G7 core processor running on a PC with 8 GB of RAM.
The data we used for our experiments included graphics card, central processing unit (CPU), and storage model information. The experimental dataset was built by collecting information on each device model from multiple sites.
Table 2 shows the attributes we used for each device in the dataset. These attributes were used to build the skyline.
Table 3, Table 4 and Table 5 show the results of building the skyline for the following devices: the graphics cards, data storage, and CPU. In each result, the models in Skyline 1 are the sets of models that are not dominated by the specification. Upon examining the skyline results, it becomes evident that the models encompassed within Skyline 1 exhibit a diverse range of specifications, with each model possessing desirable attributes in its own right. When faced with the task of selecting a model from Skyline 1, one can thoroughly consider the specifications that hold significant importance while also taking into account the ones that may be less crucial or relevant. This flexible approach allows users to tailor their decision-making process and prioritize the attributes that align with their specific requirements.
For the experiments, how similar the actual ranking of each model is to the ranking obtained from the skyline should be measured to see how well it performs. However, the skyline does not show ordered results. Therefore, we compared the actual ranking of the model with the ranking of the skyline to which the model belongs. Table 3 shows the results of the skyline built using the graphics card model data. Table 3 shows the number of models in each of the skylines built, considering the same properties as in Table 2. The lower the skyline number, the better, and there are 10 graphics card models in Skyline 1. Among these 10 models, we cannot determine the dominance, but we assume that the models in Skyline 1 are ranked 1–10, and the models in Skyline 2 are ranked 11–15. We then scored the model by comparing its actual ranking with the ranking of the skyline to which it belongs. The scoring scale is shown in Equation (2).
In this study, we scored each device’s model using Equation (2). Models belonging to lower-numbered skylines are more suitable, so the further away it is from the actual ranking, the lower the score. The total number of skylines for that device is . The skyline number for the actual model’s ranking is . To assign a skyline number based on the ranking, the number obtained after dividing the total number of data by was assigned as the skyline number. The predicted skyline number is .
Figure 2 shows a plot of the average score obtained by substituting the obtained skyline for each device into Equation (1). Figure 2 shows the results up to Skyline 10, where 12 skylines were obtained for each device: 12 for graphics cards, 34 for CPUs, and 17 for storage. We can see in the figure that most of the scores are close to 90, with the highest scores approaching 100. In particular, the CPU scores almost 90 or higher, and it is confirmed that the models belonging to the top ranks appear to score similarly. These scores, while not precisely matching the actual performance leaderboards, are relatively close, indicating that the skyline-based approach provides a reasonable approximation of performance rankings. The average of all the skyline scores is 88.19 for graphics cards, 88.58 for CPUs, and 87.34 for storage. These results are not too far from the actual performance leaderboards. While there may be slight deviations, the average scores obtained from the skylines demonstrate a notable level of consistency and provide insights into the relative performance of different devices.
Figure 3 show the average scores of each skyline for each device. In Figure 3, the skyline for the CPU closely resembles the high-ranking models. The attributes used to build the CPU skyline are the base clock, booster clock, cores/threads, process (architecture), and price. Even though five attributes were considered, about 50 models within Skyline 5 are almost the same. However, it is worth mentioning that there are slight discrepancies between the lower-ranked models in the skyline and the actual rankings. From Skyline 30 onwards, the scores begin to dip below 80, indicating a deviation from the accurate ranking order. Despite this, the top-ranked models within the skylines demonstrate commendable performance in predicting the actual rankings, albeit not with precise alignment. Figure 4 shows the average skyline score for data storage. Skylines 1 and 3 are lower than the other skylines. All of the subsequent skylines score 85 or higher, indicating that the predictions of the lowest model are similar. Figure 5 shows the average skyline score for graphics cards. We can see that it does not approach 100 like the skyline for CPUs, but it is close to 90. We found that all skylines score above 80, with similar predictions for the bottom of the rankings. In Figure 4 and Figure 5, the skylines for storage and graphics cards do not score significantly higher, but they maintain a consistent score and closely predict the actual rankings.
4. Limitations and Future Work
The disparity between the skyline rankings and the real-world data can be attributed to the inclusion of an additional attribute: price. By factoring in price alongside performance, the methodology employed in this research aims to provide more comprehensive and user-centric recommendations. This consideration of price introduces an additional layer of complexity and decision-making criteria, potentially altering the ranking order of models within the skylines. By acknowledging and incorporating the price aspect, the proposed method strives to enhance the recommendations provided to users, enabling them to make more informed choices that align with their specific requirements and budget constraints. While this may introduce some variance in the skyline rankings compared to the pure performance-based rankings, it ultimately leads to more well-rounded and tailored recommendations that account for both performance and cost considerations.
In this paper, we show the results of a device-specific list considering specification and price through GridPPPS. Although these results help users to purchase a custom-built PC, users need to check the combination of device specifications and the price of the custom-built PC. Therefore, in the future, the goal is to recommend a custom-built PC by assembling multiple devices with the desired specifications. In our next research paper, we will study how to construct a dual skyline based on the skyline of each device.
5. Conclusions
In the context of this research paper, our team undertook the meticulous process of designing and constructing a sophisticated grid skyline framework, meticulously tailored to account for an extensive array of specifications and appropriately balanced prices, thus facilitating the intricate endeavor of purchasing a custom-built PC. To accomplish this, we leveraged the innovative approach of skyline query, a powerful technique renowned for its ability to navigate through a multitude of attributes and efficiently identify products that align with users’ unique preferences and requirements. We specifically used GridPPPS, a skyline methodology that expedites the construction of indexes and minimizes the number of dominance comparisons required, ensuring quick and accurate search results. In order to evaluate the performance and efficacy of our framework, we conducted a comprehensive analysis by comparing the rankings generated by GridPPPS with the actual rankings derived from a meticulously curated model. To this end, we utilized a meticulously curated experimental dataset, encompassing detailed information pertaining to the model and the intricate specifications of each graphics card, CPU, and storage device. The results of our rigorous experimentation unequivocally demonstrate a striking similarity between the rankings produced by applying GridPPPS and the actual performance-table rankings, thereby confirming the reliability and robustness of our framework.
In the future, we plan to conduct further research by constructing a double skyline with a skyline for each device to recommend a custom-built PC that combines multiple devices. This allows us to recommend custom PCs that harmoniously integrate multiple devices into a cohesive, optimized system, with each individual device equipped with its own unique skyline. This approach holds immense potential in revolutionizing the realm of computer customization, allowing users to effortlessly navigate through a vast array of options and select a configuration that perfectly aligns with their unique requirements and preferences. By meticulously considering the specifications, performance metrics, and price dynamics of each component, our goal is to deliver personalized recommendations that empower users to assemble custom-built PCs that surpass their expectations and elevate their computing experiences to new heights.
Author Contributions
Conceptualization, S.-Y.I.; methodology, S.-Y.I.; validation, J.K. and S.-Y.I.; formal analysis, S.-Y.J.; investigation, S.-Y.J. and S.-Y.I.; writing—original draft preparation, S.-Y.J. and S.-Y.I.; writing—review and editing, S.-Y.J. and S.-Y.I.; visualization, S.-Y.J.; supervision, S.-Y.I.; project administration, S.-Y.I.; funding acquisition, S.-Y.I. All authors have read and agreed to the published version of the manuscript.
Funding
This research was supported by the MSIT (Ministry of Science and ICT), Korea, under the Innovative Human Resource Development for Local Intellectualization support program (IITP-2023-RS-2022-00156334) supervised by the IITP (Institute for Information & Communications Technology Planning & Evaluation).
Data Availability Statement
No new data were created or analyzed in this study. Data sharing is not applicable to this article.
Conflicts of Interest
The authors declare no conflict of interest.
References
- Korean Statistical Information Service. Available online: https://kosis.kr (accessed on 25 August 2023).
- IDC (International Data Corporation). Available online: https://www.idc.com/ (accessed on 25 August 2023).
- Bao, W.W.; Jang, S.M.; Yoo, J.S. An Efficient Method for Processing Top-n Skyline Queries. J. KIISE 2011, 38, 126–131. [Google Scholar]
- Soundararajan, R.; Kumar, S.R.; Gayathri, N.; Al-Turjman, F. Skyline query optimization for preferable product selection and recommendation system. Wirel. Pers. Commun. 2021, 117, 3091–3108. [Google Scholar] [CrossRef]
- Chowdhury, N.; Arefin, M.S. Skyline Path Queries for Location-based Services. Int. J. Adv. Comput. Sci. Appl. 2019, 10, 436–444. [Google Scholar] [CrossRef]
- Kim, J.H.; Kim, J.W. An Improved Skyline Query Scheme for Recommending Real-Time User Preference Data Based on Big Data Preprocessing. J. Inf. Process. Syst. 2022, 11, 189–196. [Google Scholar]
- Cui, B.; Lu, H.; Xu, Q.; Chen, L.; Dai, Y.; Zhou, Y. Parallel distributed processing of constrained skyline queries by filtering. In Proceedings of the 2008 IEEE 24th International Conference on Data Engineering, Cancun, Mexico, 7–12 April 2008; pp. 546–555. [Google Scholar]
- Wu, P.; Zhang, C.; Feng, Y.; Zhao, B.Y.; Agrawal, D.; El Abbadi, A. Parallelizing skyline queries for scalable distribution. In Advances in Database Technology-EDBT 2006: 10th International Conference on Extending Database Technology, Munich, Germany, 26–31 March 2006; Springer: Berlin/Heidelberg, Germany, 2006; pp. 112–130. [Google Scholar]
- Ihm, S.Y.; Park, Y.H. A Study on Construction and Processing Techniques of a Grid Skyline for Processing Top-k Queries. Database Res. 2013, 29, 85–93. [Google Scholar]
- Choi, W.; Liu, L.; Yu, B. Multi-criteria decision making with skyline computation. In Proceedings of the 2012 IEEE 13th International Conference on Information Reuse & Integration (IRI), Las Vegas, NV, USA, 8–10 August 2012; pp. 316–323. [Google Scholar]
- Georgiadis, N.; Tiakas, E.; Manolopoulos, Y.; Papadopoulos, A.N. Skyline-based dissimilarity of images. J. Intell. Inf. Syst. 2019, 53, 509–545. [Google Scholar] [CrossRef]
- Li, Z.H.; Han, A.; Park, Y.B. Efficient Reverse Skyline Query Processing using Two-Level Skyline. J. KIISE Databases 2011, 38, 329–338. [Google Scholar]
- Borzsony, S.; Kossmann, D.; Stocker, K. The skyline operator. In Proceedings of the 17th International Conference on Data Engineering, Berlin/Heidelberg, Germany, 2–6 April 2001; IEEE: Piscataway, NJ, USA, 2001; pp. 421–430. [Google Scholar]
- Woods, L.; Alonso, G.; Teubner, J. Parallel computation of skyline queries. In Proceedings of the 2013 IEEE 21st Annual International Symposium on Field-Programmable Custom Computing Machines, Seattle, WA, USA, 28–30 April 2013; IEEE: Piscataway, NJ, USA, 2013; pp. 1–8. [Google Scholar]
- Chomicki, J.; Godfrey, P.; Gryz, J.; Liang, D. Skyline with presorting. ICDE 2003, 3, 717–719. [Google Scholar] [CrossRef]
- Vlachou, A.; Doulkeridis, C.; Kotidis, Y. Angle-based space partitioning for efficient parallel skyline computation. In Proceedings of the 2008 ACM SIGMOD International Conference on Management of Data, Vancouver, BC, Canada, 10–12 June 2008; pp. 227–238. [Google Scholar]
- Köhler, H.; Yang, J.; Zhou, X. Efficient parallel skyline processing using hyperplane projections. In Proceedings of the 2011 ACM SIGMOD International Conference on Management of Data, Athens, Greece, 12–16 June 2011; pp. 85–96. [Google Scholar]
- Ihm, S.Y.; Nasridinov, A.; Park, Y.H. Grid-PPPS: A Skyline Method for Efficiently Handling Top-Queries in Internet of Things. J. Appl. Math. 2014, 2014, 401618. [Google Scholar] [CrossRef]
- Chen, L.; Chen, F.; Liu, Z.; Lv, M.; He, T.; Zhang, S. Parallel gravitational clustering based on grid partitioning for large-scale data. Appl. Intell. 2023, 53, 2506–2526. [Google Scholar] [CrossRef]
- Zheng, B.; Xu, J.; Lee, W.C.; Lee, D.L. Grid-partition index: A hybrid method for nearest-neighbor queries in wireless location-based services. VLDB J. 2006, 15, 21–39. [Google Scholar] [CrossRef]
Figure 1.
Skyline data in Table 1.
Figure 1.
Skyline data in Table 1.

Figure 2.
Skyline average score by device.
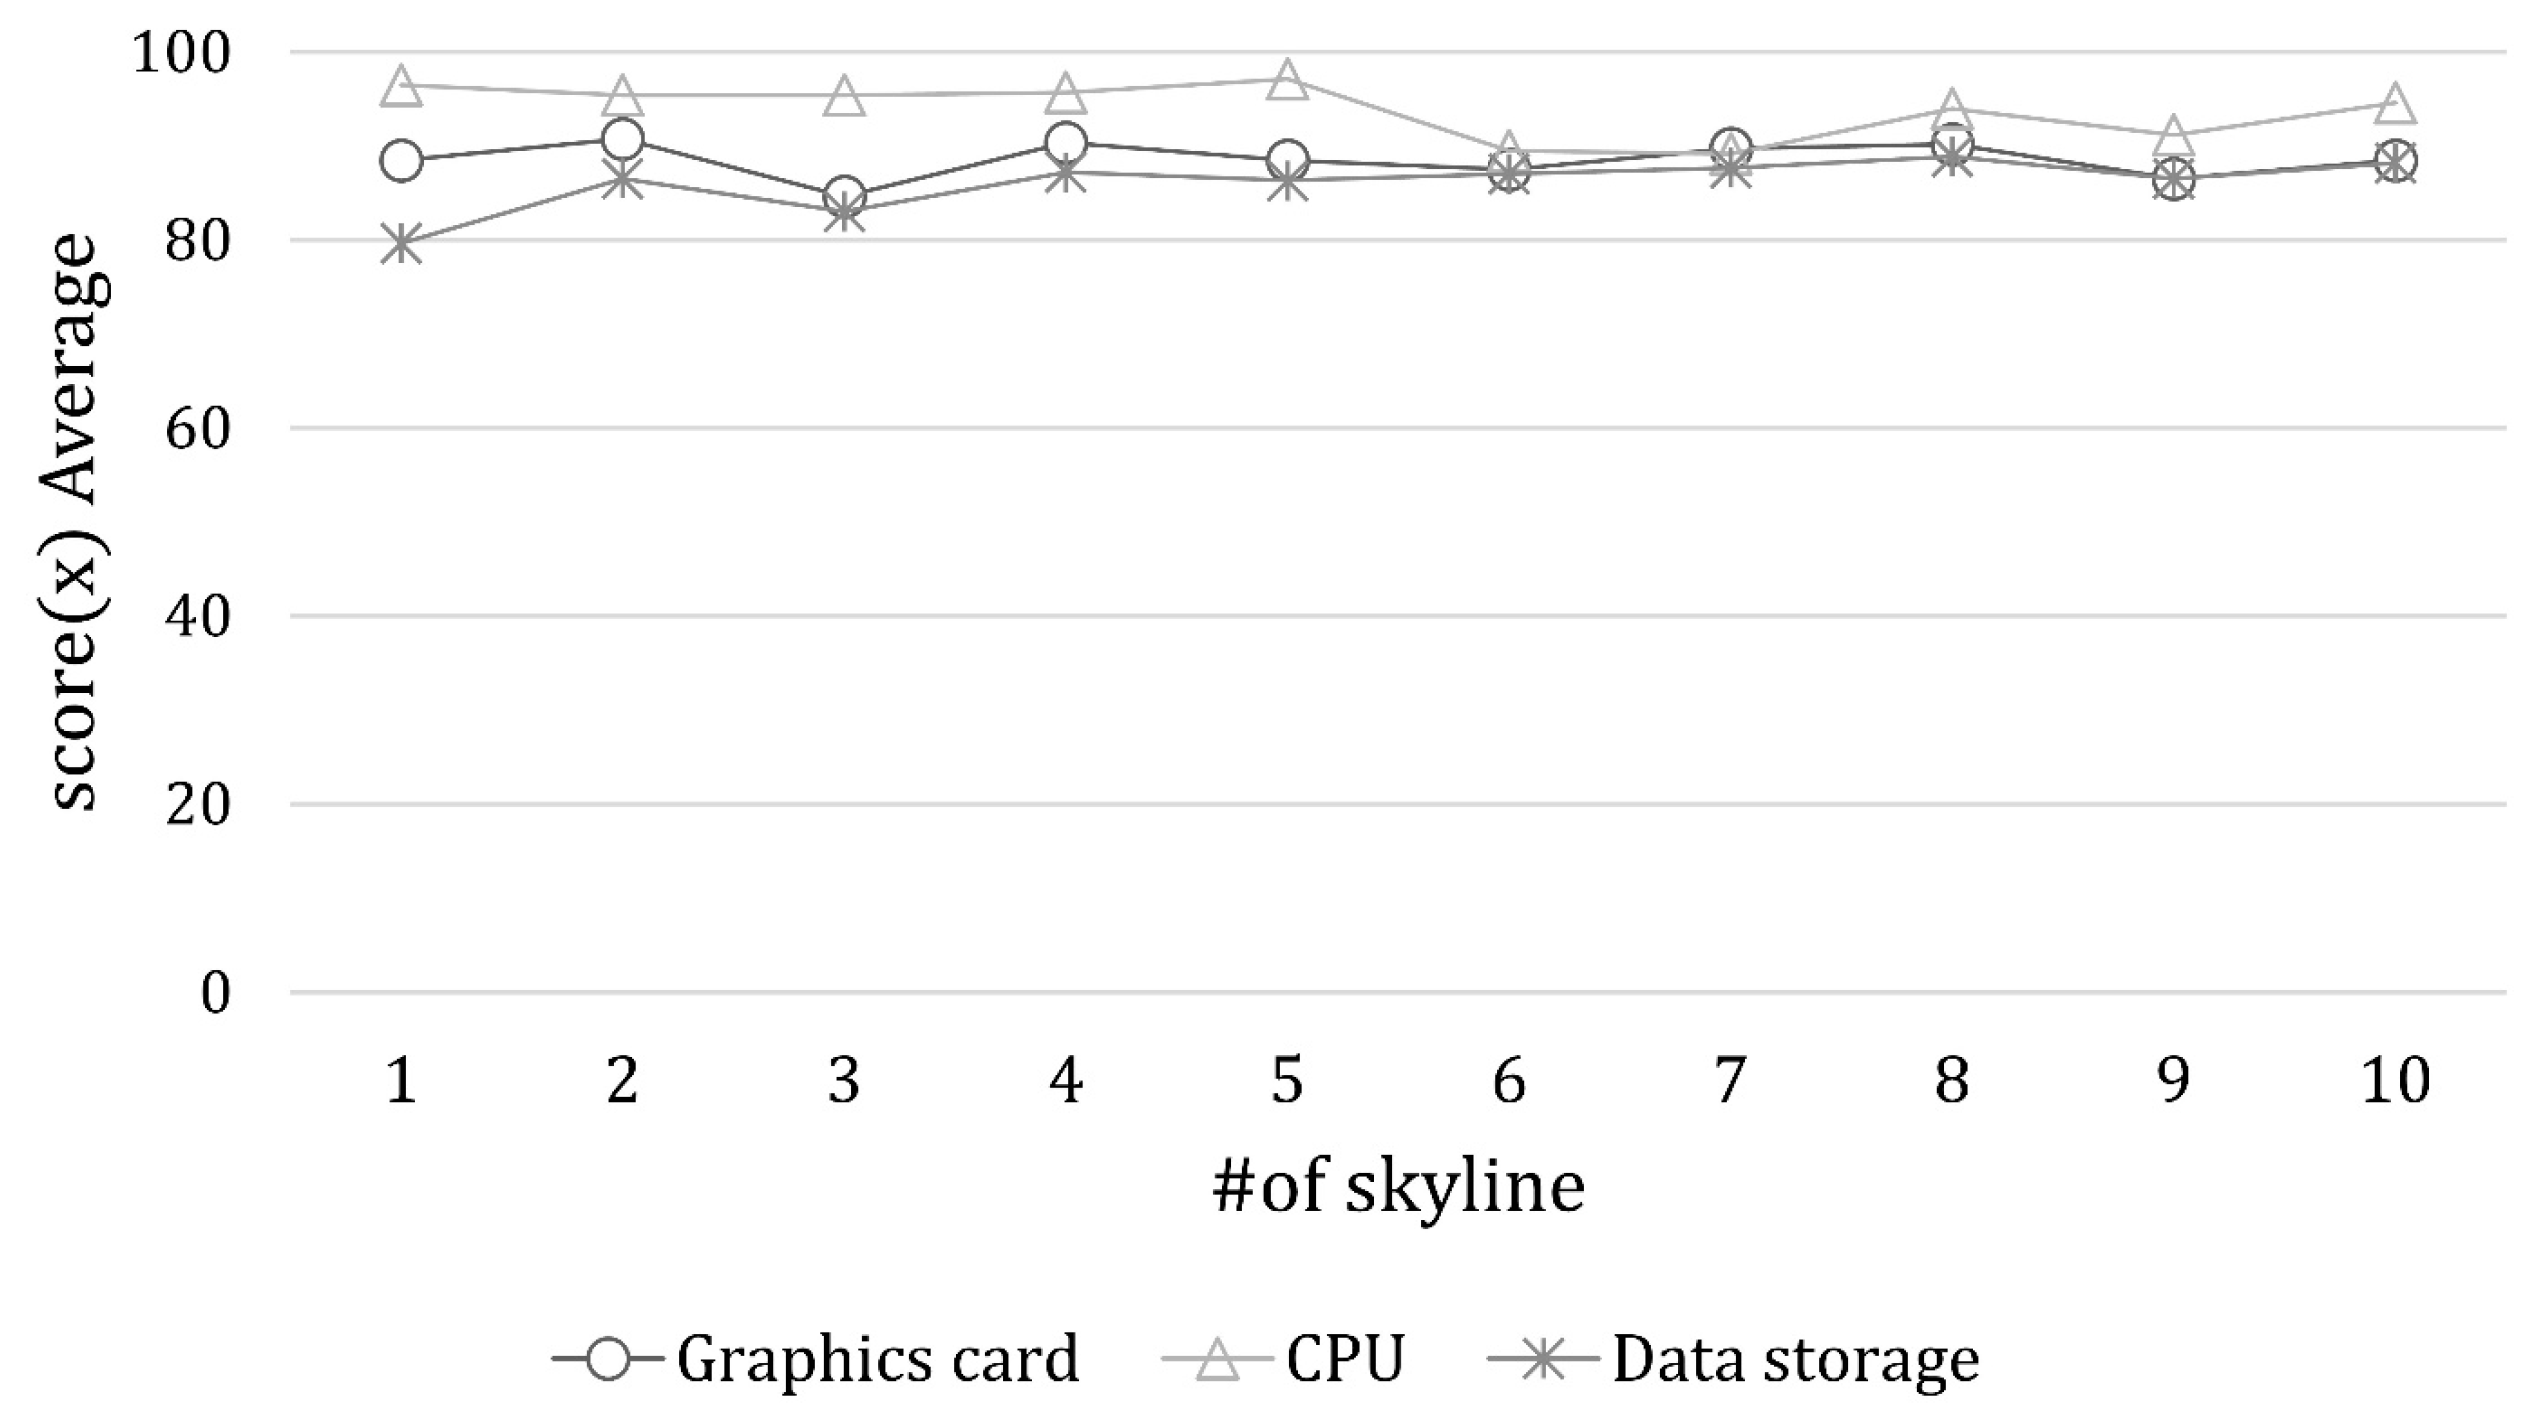
Figure 3.
Skyline average score by device.

Figure 4.
Skyline average score by device.

Figure 5.
Skyline average score by device.


Table 1.
Data of computer device models.
| Computer Device Model | Spec 1 | Price |
|---|---|---|
| A | 10 | 120 |
| B | 14 | 109 |
| C | 19 | 100 |
| D | 29 | 95 |
| E | 39 | 92 |
| F | 48 | 90 |
| G | 21 | 115 |
| H | 32 | 111 |
| I | 37 | 102 |
| J | 42 | 107 |
| K | 50 | 105 |
Table 2.
Attributes of a computer device.
| Computer Device | Attribute |
|---|---|
| Graphics card | Core speed, boost/turbo clock, memory speed, memory bus, process (architecture), price |
| CPU | Base clock, booster clock, cores/threads, process (architecture), price |
| Data storage | Capacity, reading speed, writing speed, price |
Table 3.
Skyline results for graphics cards.
| Skyline Number | Graphics Card Models | Number of Models |
|---|---|---|
| 1 | AMD Radeon RX Vega 56, AMD Radeon RX 6600, NVIDIA Titan X Pascal, NVIDIA GeForce GTX 1080 Ti, AMD Radeon RX 6600 XT, AMD Radeon RX 6700 XT, AMD Radeon Pro W6800, NVIDIA GeForce RTX 3080, NVIDIA RTX A6000, NVIDIA GeForce RTX 3090 | 10 |
| 2 | AMD Radeon RX 5700 XT, NVIDIA GeForce RTX 2080, AMD Radeon RX 6900 XT, NVIDIA RTX A6000, NVIDIA GeForce RTX 3080 Ti | 5 |
| 3 | NVIDIA GeForce MX350, NVIDIA GeForce GTX 1050, NVIDIA Quadro RTX 6000, NVIDIA GeForce RTX 2080 Super, NVIDIA Titan RTX, AMD Radeon RX 6800 XT | 6 |
| 4 | ··· | 8 |
Table 4.
Skyline results for data storage.
| Skyline Number | Data Storage Models | Number of Models |
|---|---|---|
| 1 | Intel SSD 320 Series SSDSA2CW300G310, SanDisk SD8SN8U1T001122, Samsung SSD 850 PRO 1TB, Samsung SSD SM951 512 GB MZHPV512HDGL, Acer Predator SSD GM7000 2TB, Samsung SSD SM961 1TB M.2 MZVKW1T0HMLH, ADATA XPG Gammix S70 1TB, Western Digital WD_BLACK SN850 WDS100T1X0E, Intel Optane 905P 480GB 2.5, Samsung SSD 980 Pro 1TB MZ-V8P1T0BW, Samsung PM9A1 MZVL22T0HBLB, Samsung SSD 980 Pro 2TB MZ-V8P2T0 | 12 |
| 2 | Plextor PX-256M5M, Toshiba XG6 KXG6AZNV1T02, Toshiba XG6 KXG60ZNV1T02, Samsung PM981a MZVLB2T0HALB, Samsung PM9A1 MZVL2512HCJQ, Corsair MP600, Samsung PM9A1 MZVL21T0HCLR | 7 |
| 3 | Toshiba THNSNC128GBSJ, Crucial MX300 CT525MX300SSD1, OCZ Agility 3 AGT3-25SAT3-120G, Crucial MX100 256 GB, Samsung SSD 850 EVO 1TB, Kingston SA1000M8240G, Intel SSD 660p 2TB SSDPEKNW020T8, Samsung SM961 MZVKW512HMJP m.2 PCI-e, SK Hynix Gold P31 2TB SHGP31-2000GM, Phison 1TB SM2801T24GKBB4S-E162, ADATA XPG Gammix S50 1TB, Phison 512GB SM280512GKBB4S-E162, Phison E12S-2TB-Phison-SSD-BICS4, Samsung SSD 970 Pro 1TB, Kioxia XG7 KXG7AZNV512G, Samsung SSD 970 EVO Plus 1TB, Samsung SSD 970 EVO Plus 2TB, SK Hynix BC711 1TB HFM001TD3JX016N, Samsung SSD 980 Pro 500GB MZ-V8P500BW, SK Hynix Gold P31 1TB SHGP31-1000GM-2 | 20 |
| 4 | ··· | 10 |
Table 5.
Skyline results for CPU.
| Skyline Number | CPU Models | Number of Models |
|---|---|---|
| 1 | Intel Core i7-7740X, Intel Core i5-10600K, Intel Core i9-9900KS, AMD Ryzen 3800XT, Intel Core i9-10910 (10900), AMD Ryzen 3900X, AMD Ryzen 5900X, AMD Ryzen Threadripper Pro 3975WX, AMD Ryzen Threadripper Pro 3995WX | 9 |
| 2 | AMD FX-8350, AMD Ryzen 3100, Intel Core i7-6700K, AMD Ryzen 2700X, Intel Core i7-8086K, Intel Core i5-11600K, Intel Core i9-9900K, Intel Core i7-10700K, AMD Ryzen 3700X, Intel Core i9-10850K, Intel Core i9-10900K, AMD Ryzen 5800X, Intel Core i9-9980XE, AMD Ryzen 3950X, AMD Ryzen Threadripper 2970WX | 15 |
| 3 | AMD Ryzen 3300X, Intel Core i7-4790K, AMD Ryzen 2600X, AMD Ryzen 1800X, Intel Core i7-8700K, AMD Ryzen 5600X, Intel Core i5-12600K, AMD Ryzen Threadripper 2950X, Intel Core i9-10980XE, AMD Ryzen 5950X | 10 |
| 4 | ··· | 10 |
Disclaimer/Publisher’s Note: The statements, opinions and data contained in all publications are solely those of the individual author(s) and contributor(s) and not of MDPI and/or the editor(s). MDPI and/or the editor(s) disclaim responsibility for any injury to people or property resulting from any ideas, methods, instructions or products referred to in the content. |
© 2023 by the authors. Licensee MDPI, Basel, Switzerland. This article is an open access article distributed under the terms and conditions of the Creative Commons Attribution (CC BY) license (https://creativecommons.org/licenses/by/4.0/).
Share and Cite
MDPI and ACS Style
Jeong, S.-Y.; Kim, J.; Ihm, S.-Y. The Design and Construction of a Grid Skyline for Custom-Built PC Recommendations Based on a Multi-Attribute Model. Designs 2023, 7, 104. https://doi.org/10.3390/designs7050104
AMA Style
Jeong S-Y, Kim J, Ihm S-Y. The Design and Construction of a Grid Skyline for Custom-Built PC Recommendations Based on a Multi-Attribute Model. Designs. 2023; 7(5):104. https://doi.org/10.3390/designs7050104
Chicago/Turabian StyleJeong, Soo-Yeon, Junseok Kim, and Sun-Young Ihm. 2023. "The Design and Construction of a Grid Skyline for Custom-Built PC Recommendations Based on a Multi-Attribute Model" Designs 7, no. 5: 104. https://doi.org/10.3390/designs7050104