1. Introduction
The residential building stock of Spain is old. The study conducted in 2013 by the National Statistics Institute of Spain, INE [
1], calculated that approximately 67% of dwellings were built before the enforcement of the first regulation that included energy saving requirements (NBE-CT-79) [
2]. This proves that even though many buildings were constructed in the late XX and early XXI century, the number of residential constructions without any thermal insulation is large. Furthermore, the ratio of non-insulated housing is even larger in certain regions, such as the autonomous region of Basque, where around 75% of the present residential buildings were built before 1980.
At present, many buildings are being renovated thanks to the economic grants for energy and accessibility retrofitting, like the PAREER-CRECE program [
3] organized by the Spanish Ministry of Development, or the RENOVE [
4] program organized by the Basque region government. However, the renovation measures are justified by the Building Evaluation Report (Informe de Evaluación del Edificio, IEE), which is merely a visual inspection. Unfortunately, an inaccurate diagnosis of real problems can lead to renovations that could end up being not only inefficient but also harmful, considering many of the most common moisture pathologies.
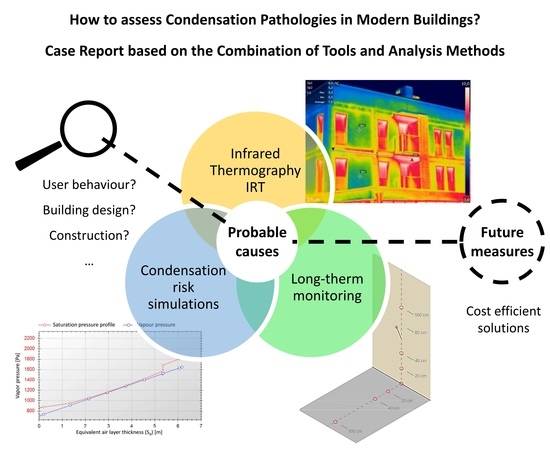
The present article presents a case study that shows the complexity of the diagnostic process to identify the possible causes and deficiencies that have led to some moisture-related pathologies in the walls of a residential building. The article describes several tools to measure, evaluate, calculate, and analyze the origin of the observed problems. A proper diagnosis is the best and cheapest way to plan a renovation strategy that can improve the energy performance and guarantee all other features needed for homes, such as security, health, accessibility, durability, etc.
2. Objective of the Study
The main objective was to identify the possible causes of the humidity and health problems detected in some apartments, in order to propose the best renovation strategy to fix or minimize the existing pathologies.
3. Case Study
3.1. Methodology of the Analysis
The visual inspection of the apartments’ pathologies was not conclusive. For that reason, three complementary studies were carried out to evaluate their probable causes. First, the indoor temperature and relative humidity (RH) were monitored in the apartments. This allowed us to get an overview of the occupancy hours, the heating operation, and the ventilation habits in the studied homes. Six apartments, identified as A, D, and E on the first and the second floors, were selected for this monitoring stage due to their moisture problems on the North façade. The indoor air temperature and RH were measured every 15 minutes for 40 days, from 23 January until 4 April, 2014. To evaluate the weather conditions, the outdoor air temperature and RH were measured as well. The obtained values were averaged per hour and the risk of condensations was calculated according to the standard UNE-EN ISO 13788:2016 in order to assess whether the real conditions of use could have caused the current condensation in the envelope.
Second, the dynamic thermal performance of the envelope was examined for 40 days. Surface temperatures of the two façade walls were monitored, and the gradient of surface temperatures in two thermal bridges (TB) was recorded. This detailed observation disclosed the temperature profiles of the thermal envelope in correspondence with the indoor conditions, and allowed a more detailed evaluation of the condensation risk under dynamic conditions.
Third, an infrared thermography (IRT) survey was conducted to detect any thermal irregularities in the building envelope and compare the surface temperatures of the façades in each orientation. The thermographic inspection was done according to the indications of UNE-EN 13187:1998 for existing buildings evaluation. The thermograms were corrected using some on-site measurements, which consisted of the emissivity of the wall and the reflected temperatures of each façade. The detailed IRT inspection is one of the best tools to obtain qualitative and quantitative measurements in order to evaluate building renovation measures, as proven in recent literature reviews [
5,
6] and guidebooks [
7]. The external IR images were taken from 7 to 8 a.m. on 17 February 2014, with more than 10 °C of indoor-outdoor temperature difference, to meet the requirements of the standard. The internal survey was carried out on 4 March 2014, from 4 to 7 p.m., to ensure a sufficient internal-external temperature difference as well.
Finally, the results of the three studies were analyzed together in order to discard any faulty interpretations, identifying the most probable origin of the problems, and proposing the most efficient renovation measures. The estimated costs of this study were calculated using some of the real budgets of similar works, taken from the building renovation budgets presented for the housing renovation grants [
4] of the Basque government, from the years 2014 to 2016.
3.2. Building Description and Current Pathologies
The studied building is located in a small town in the Alava region, in a deep valley at around 300 m above sea level. The local weather can be classified as D1 according to the Spanish Building Code (CTE) [
8]. Wind-driven rain is not a particular problem on the North façades, but outdoor air RH remains high during most of the year and the solar radiation is limited due to the surrounding mountains. The building contains 14 dwellings built in 2008 under the regulation NBE-CT-79. The ground floor is of commercial use, the first and the second floors include five dwellings each, and the top floor is an attic with four dwellings. The majority of the buildings have double orientation, but the E letter buildings are oriented only to the north.
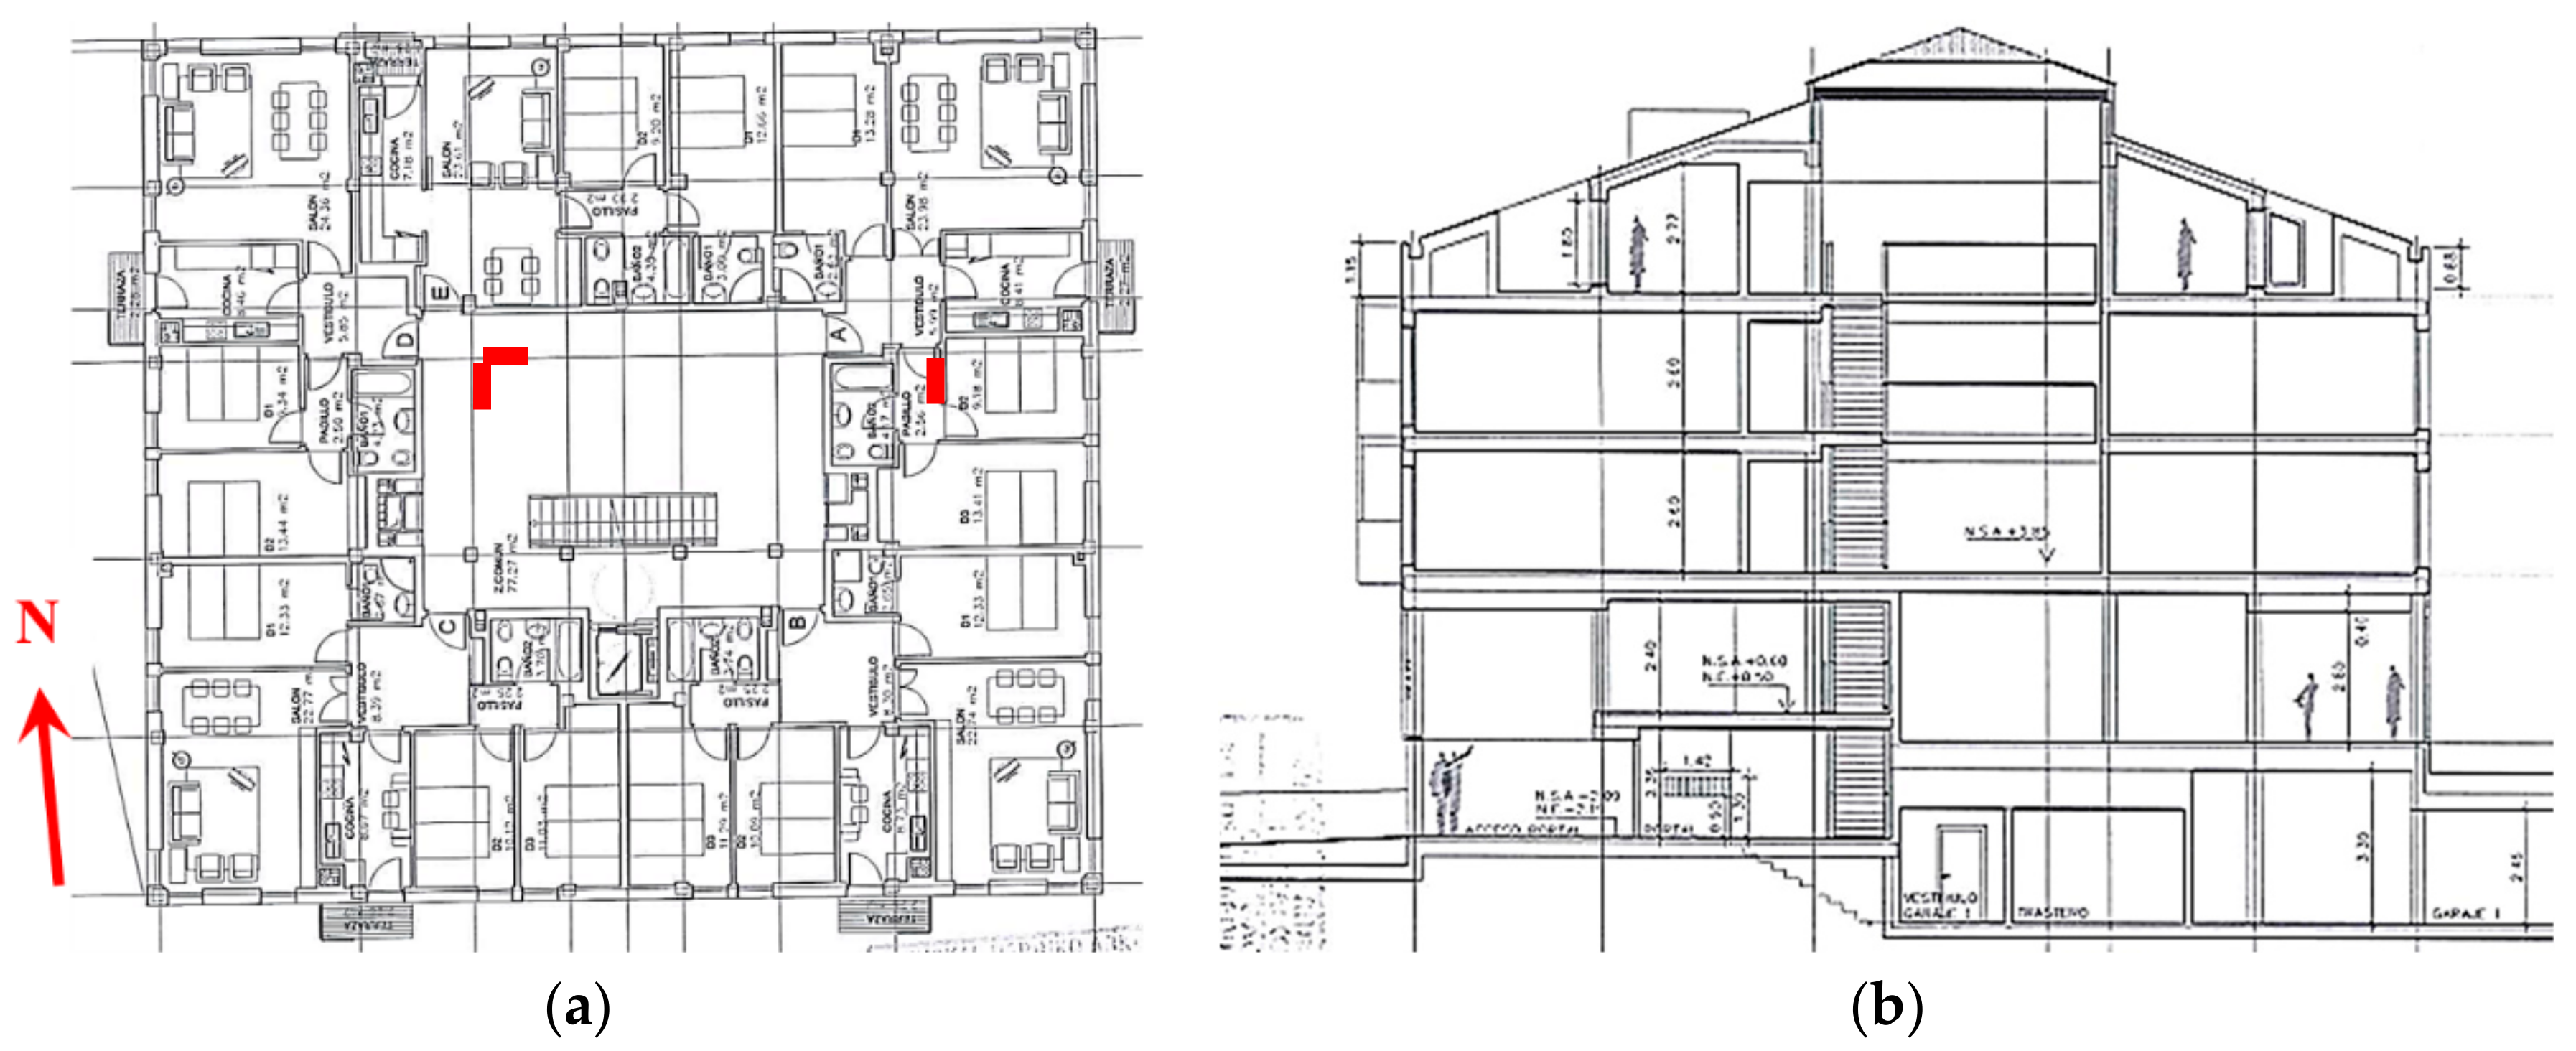
Figure 1 outlines the first and second floor distribution and a cross-section of the building. The façade is composed of mortar rendering (1.5 cm), outer perforated brick wall (11 cm), projected polyurethane (PUR) (4 cm), a non-ventilated air cavity (3 cm), inner hollow brick (7 cm), and a leveling gypsum layer (1.5 cm). The walls do not have any weep holes; therefore, the air cavities are not ventilated. Thermal bridges of pillars and slabs on the façade are minimized by cellular glass boards.
Figure 2 shows the façade composition in detail. There is no mechanical ventilation: dwellings have stack effect ventilation grids in the kitchen and bathrooms. Additionally, natural ventilation is applied when necessary.
Numerous areas with water condensation, mold, and deformed wooden elements, such as skirting boards or window frames, were detected in six out of the 14 investigated dwellings. All the problems were located in the North façades of the first and the second floors, in dwellings with letters A, D, and E, see
Figure 1a. The façades of other dwellings did not have visible pathologies or moisture-related problems. Large growths of mold and microorganisms were especially apparent in the corners of pillars, ceilings, and window perimeters. Dwellings located in the attic did not have any humidity problems and were thus excluded from the study.
3.3. Testing Equipment
The indoor air monitoring was conducted with six temperature and RH data loggers, installed in one room of each apartment where the largest pathologies were detected. Five data loggers were mounted in living rooms, and one in a bedroom. The equipment was placed at a 1.8-m height, inside the occupant comfort volume. One more data logger was placed outdoors in order to measure local weather conditions. The equipment details are given in
Table 1.
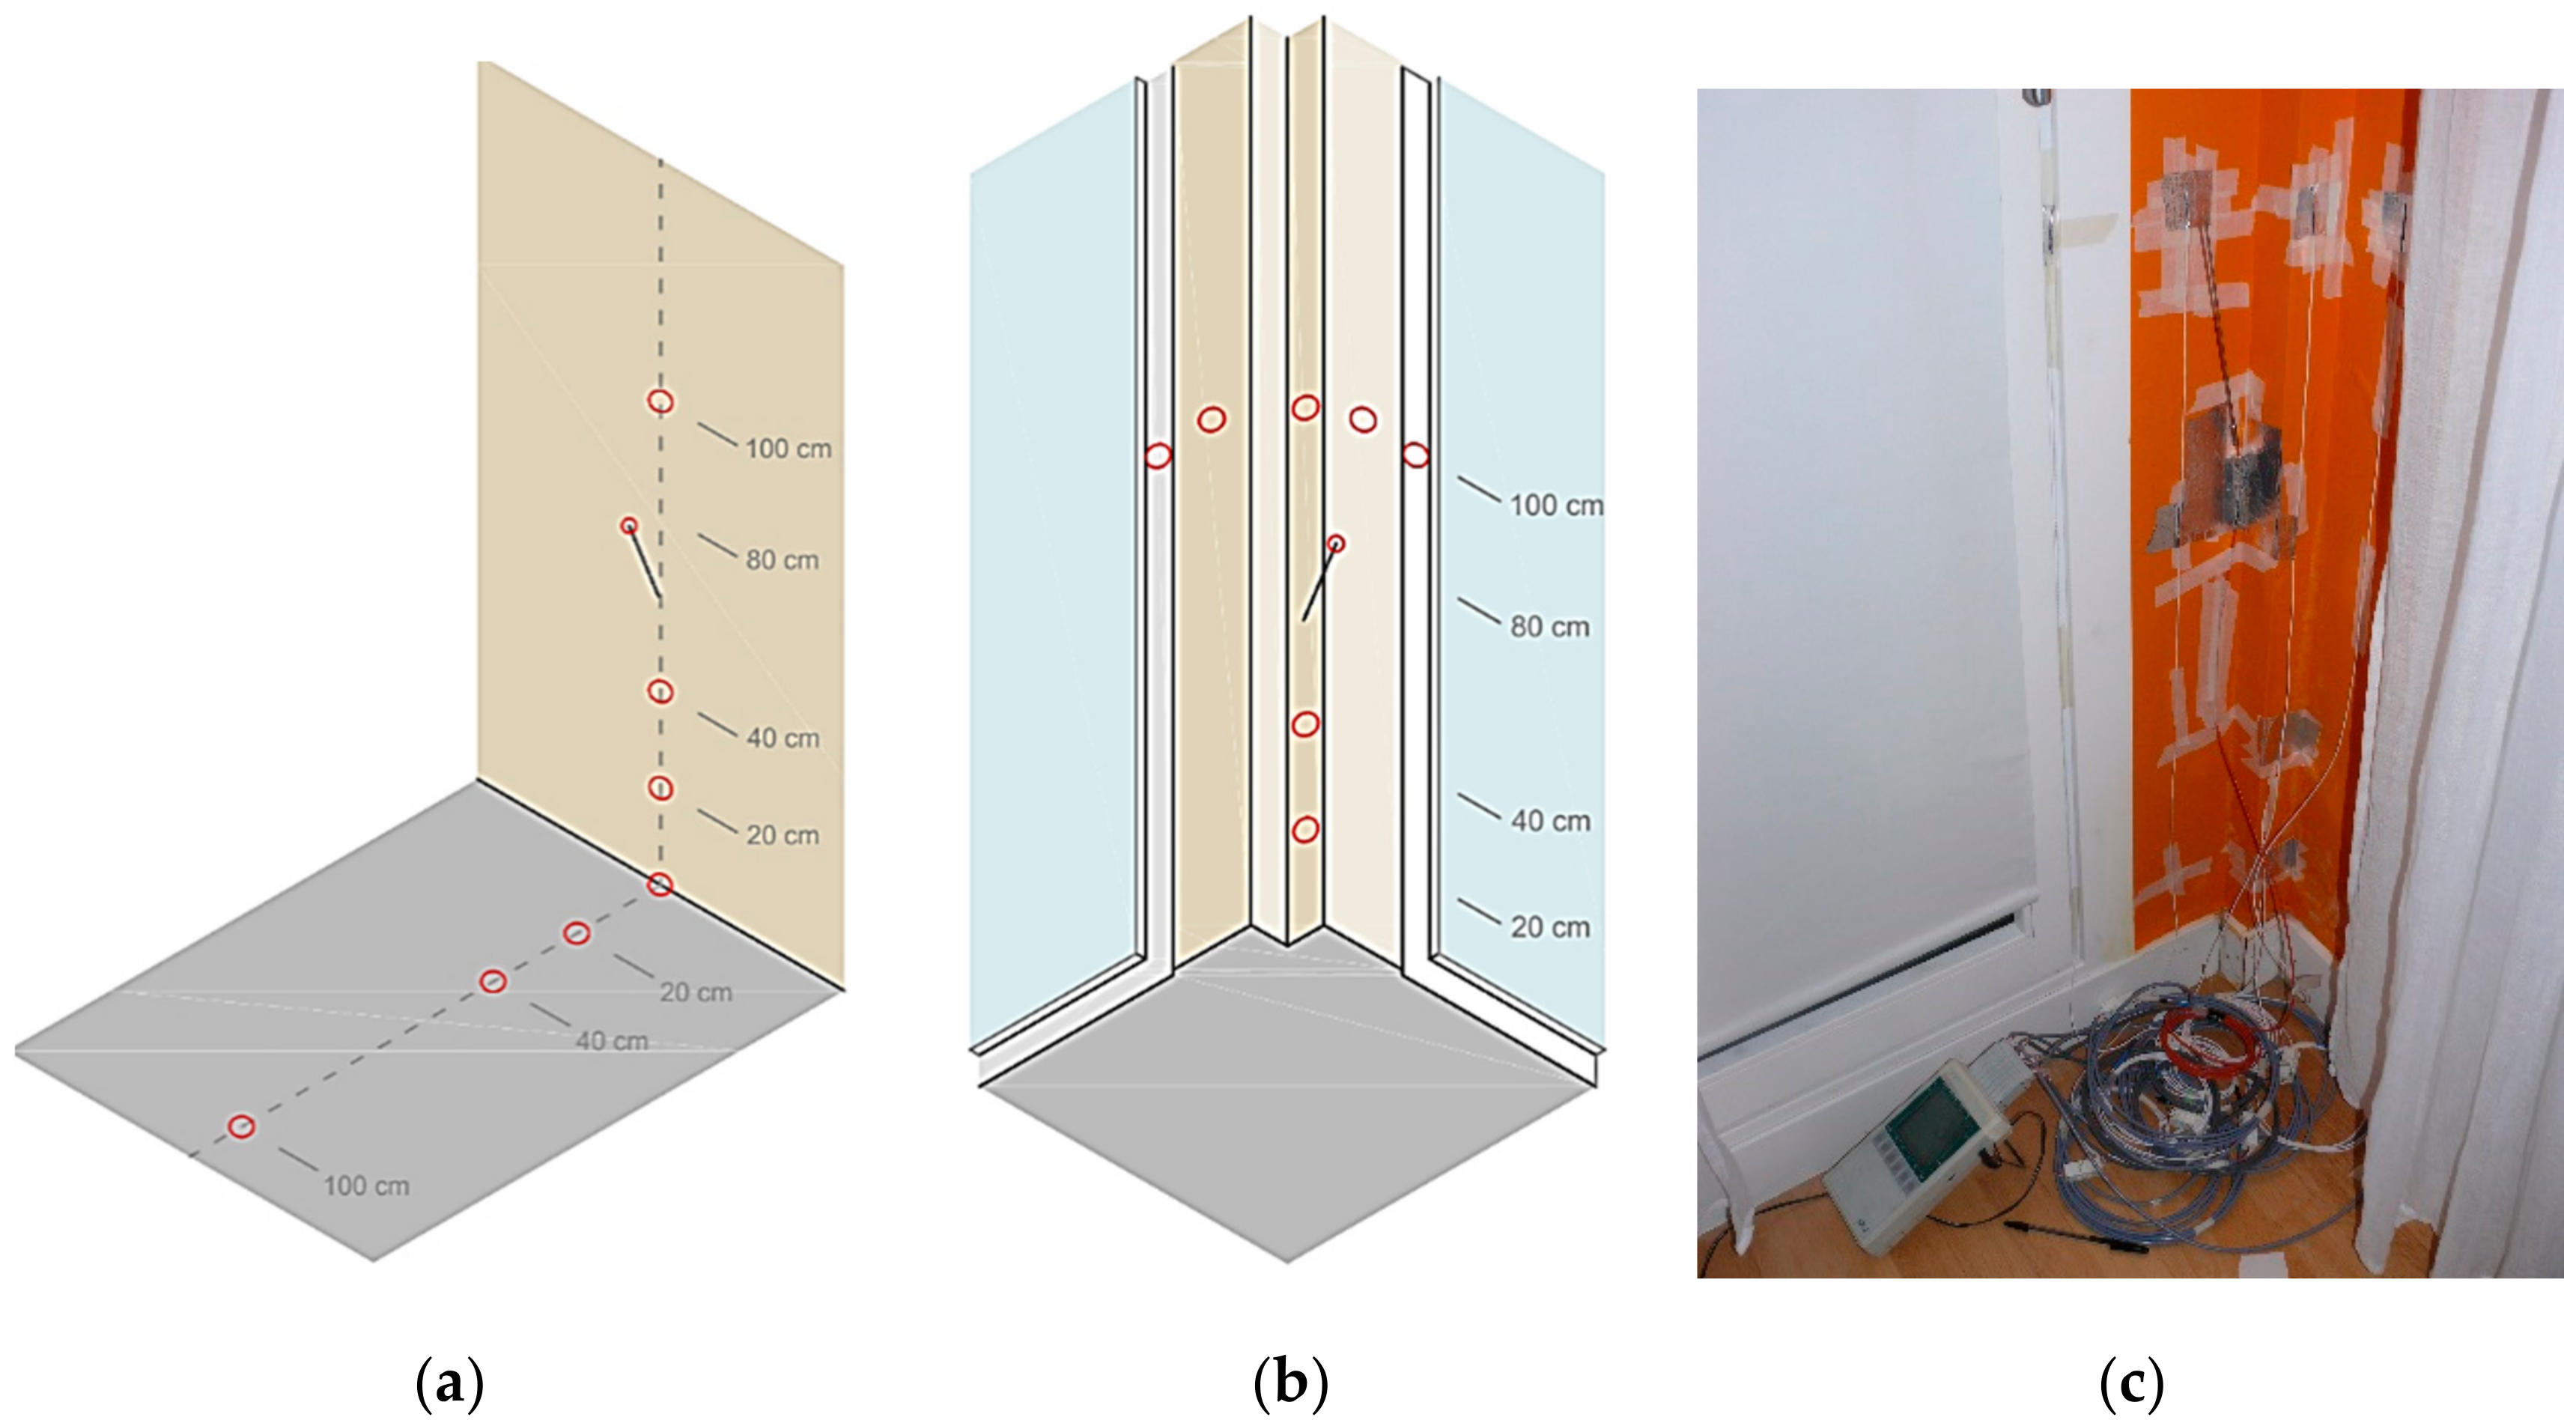
To measure the thermal performance of the opaque elements and the thermal bridging effect, a number of surface temperature meters were placed on the envelope, as shown in
Figure 3. By using those sensors, detailed temperature profiles were obtained, and temperatures in the coldest point in contrast to the adjacent elements were evaluated. Data acquisition was done using two small data loggers.
The infrared thermographic survey was conducted with an FLIR T640, taking IR images of 640 × 480 pixels. As auxiliary tools, a thermometer-hygrometer, a highly reflective plate, and a high emissivity contrast tape were used. For the final analysis, the thermal images were adjusted according to the buildings’ mortar emissivity and the local reflected temperature in each orientation.
4. Results
4.1. Indoor Conditions of Six Dwellings
The measurements lasted 40 days and registered a high variability of users with different habits, as shown in
Figure 4 and
Figure 5. Very little use of heating was observed in all the dwellings, especially in dwellings 1A and 2A. Additionally, the RH levels were high, especially in dwelling 1E, which lacked ventilation during the study period.
Apart from those few exceptions, the average indoor air temperatures of the dwellings were low, around 16–17 °C, and the peaks of warm temperatures were around 19–20 °C. The average indoor air RH was measured around 55%–65%. According to these results, the indoor air conditions are below the minimum limit of 21 °C set by the Spanish regulation of thermal comfort [
9] that is based on the well-known Fanger limits of indoor air temperatures for heating in residential spaces [
10].
4.2. Thermal Envelope Surface Temperatures and Thermal Bridging Measurements
Continuous monitoring of the surface temperatures in two thermal bridges and in the adjacent opaque elements allowed assessing the likelihood of surface condensation in 40 days.
Figure 6 shows a comparison between the dew point of one dwelling (calculated using the instant air temperature and RH) and the indoor surface temperatures of the sensors placed along the thermal bridge. It was observed that there is a margin of 3–4 °C between the measured air dew point and the envelope surface temperature. Therefore, according to these measurements, there was no risk of surface condensation during the 40 studied cold winter days.
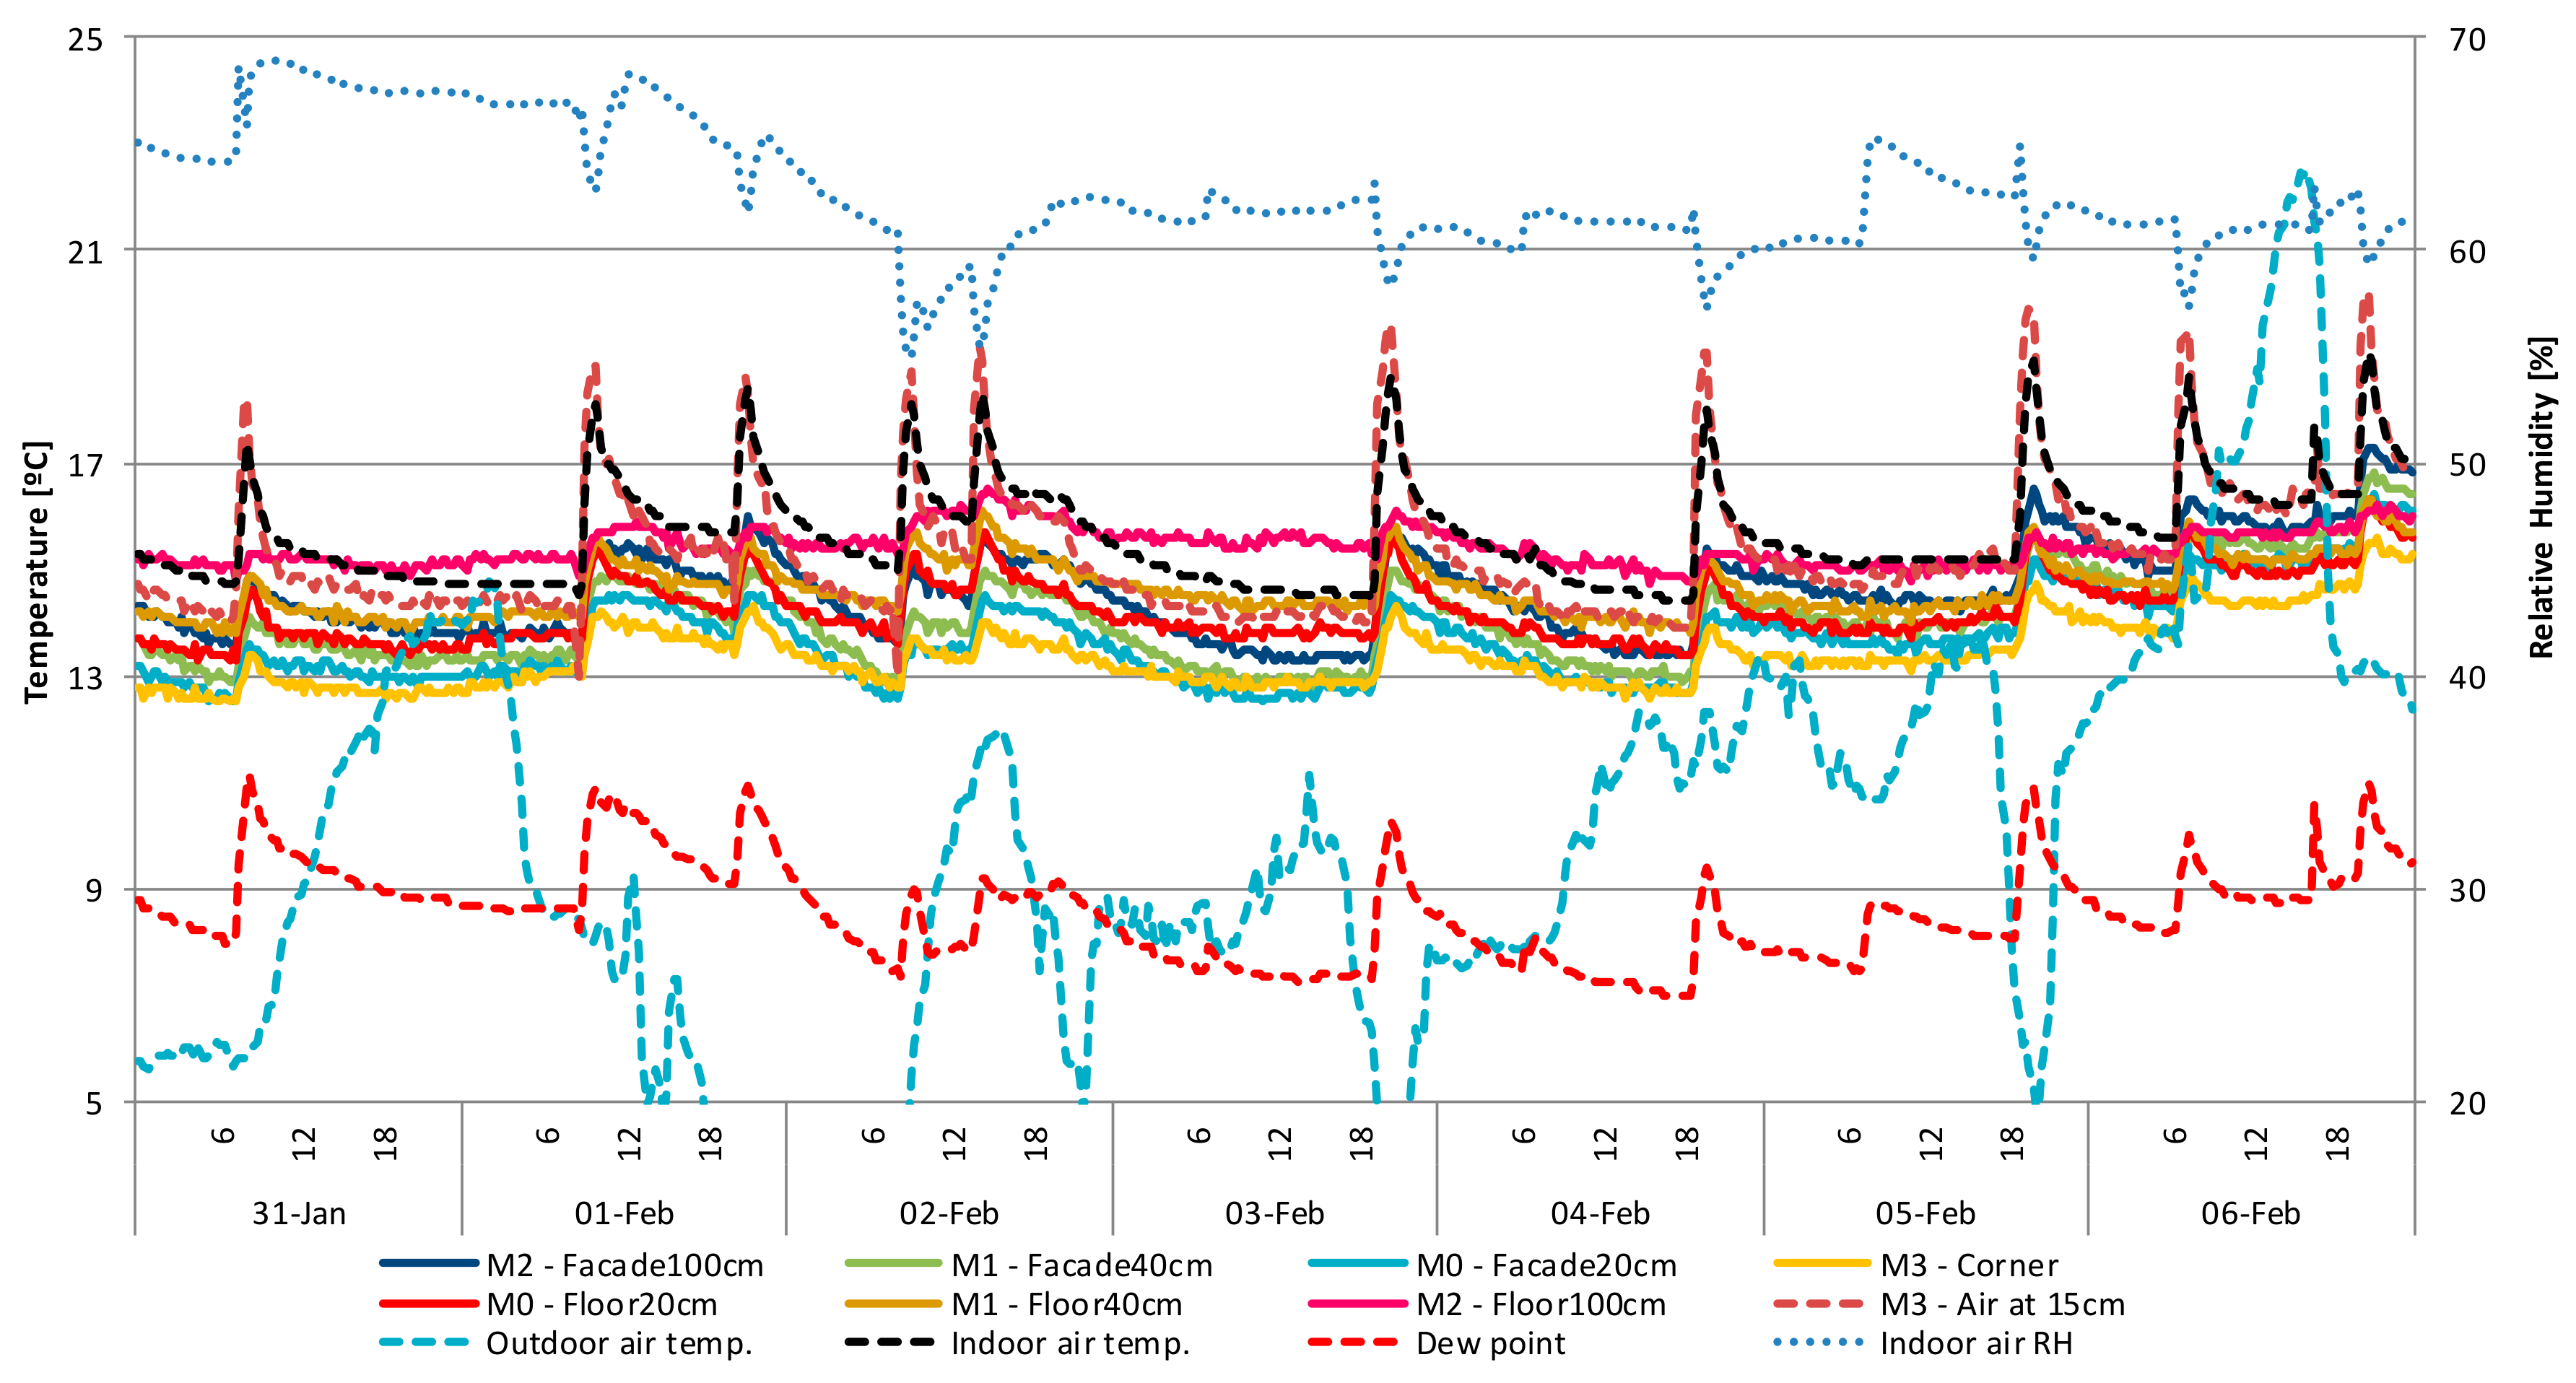
Figure 7 shows the analogous study conducted in the corner pillar thermal bridge. In this case, the margin between dew point and measured surface temperatures is smaller. The minimum gap between them was slightly below 1 °C, and during the three coldest days the difference remained small: between 1–2 °C. For this reason, there is a real condensation risk in this thermal bridge that may occur, especially when the indoor-outdoor conditions are adverse.
4.3. Infrared Thermography Survey (IRT)
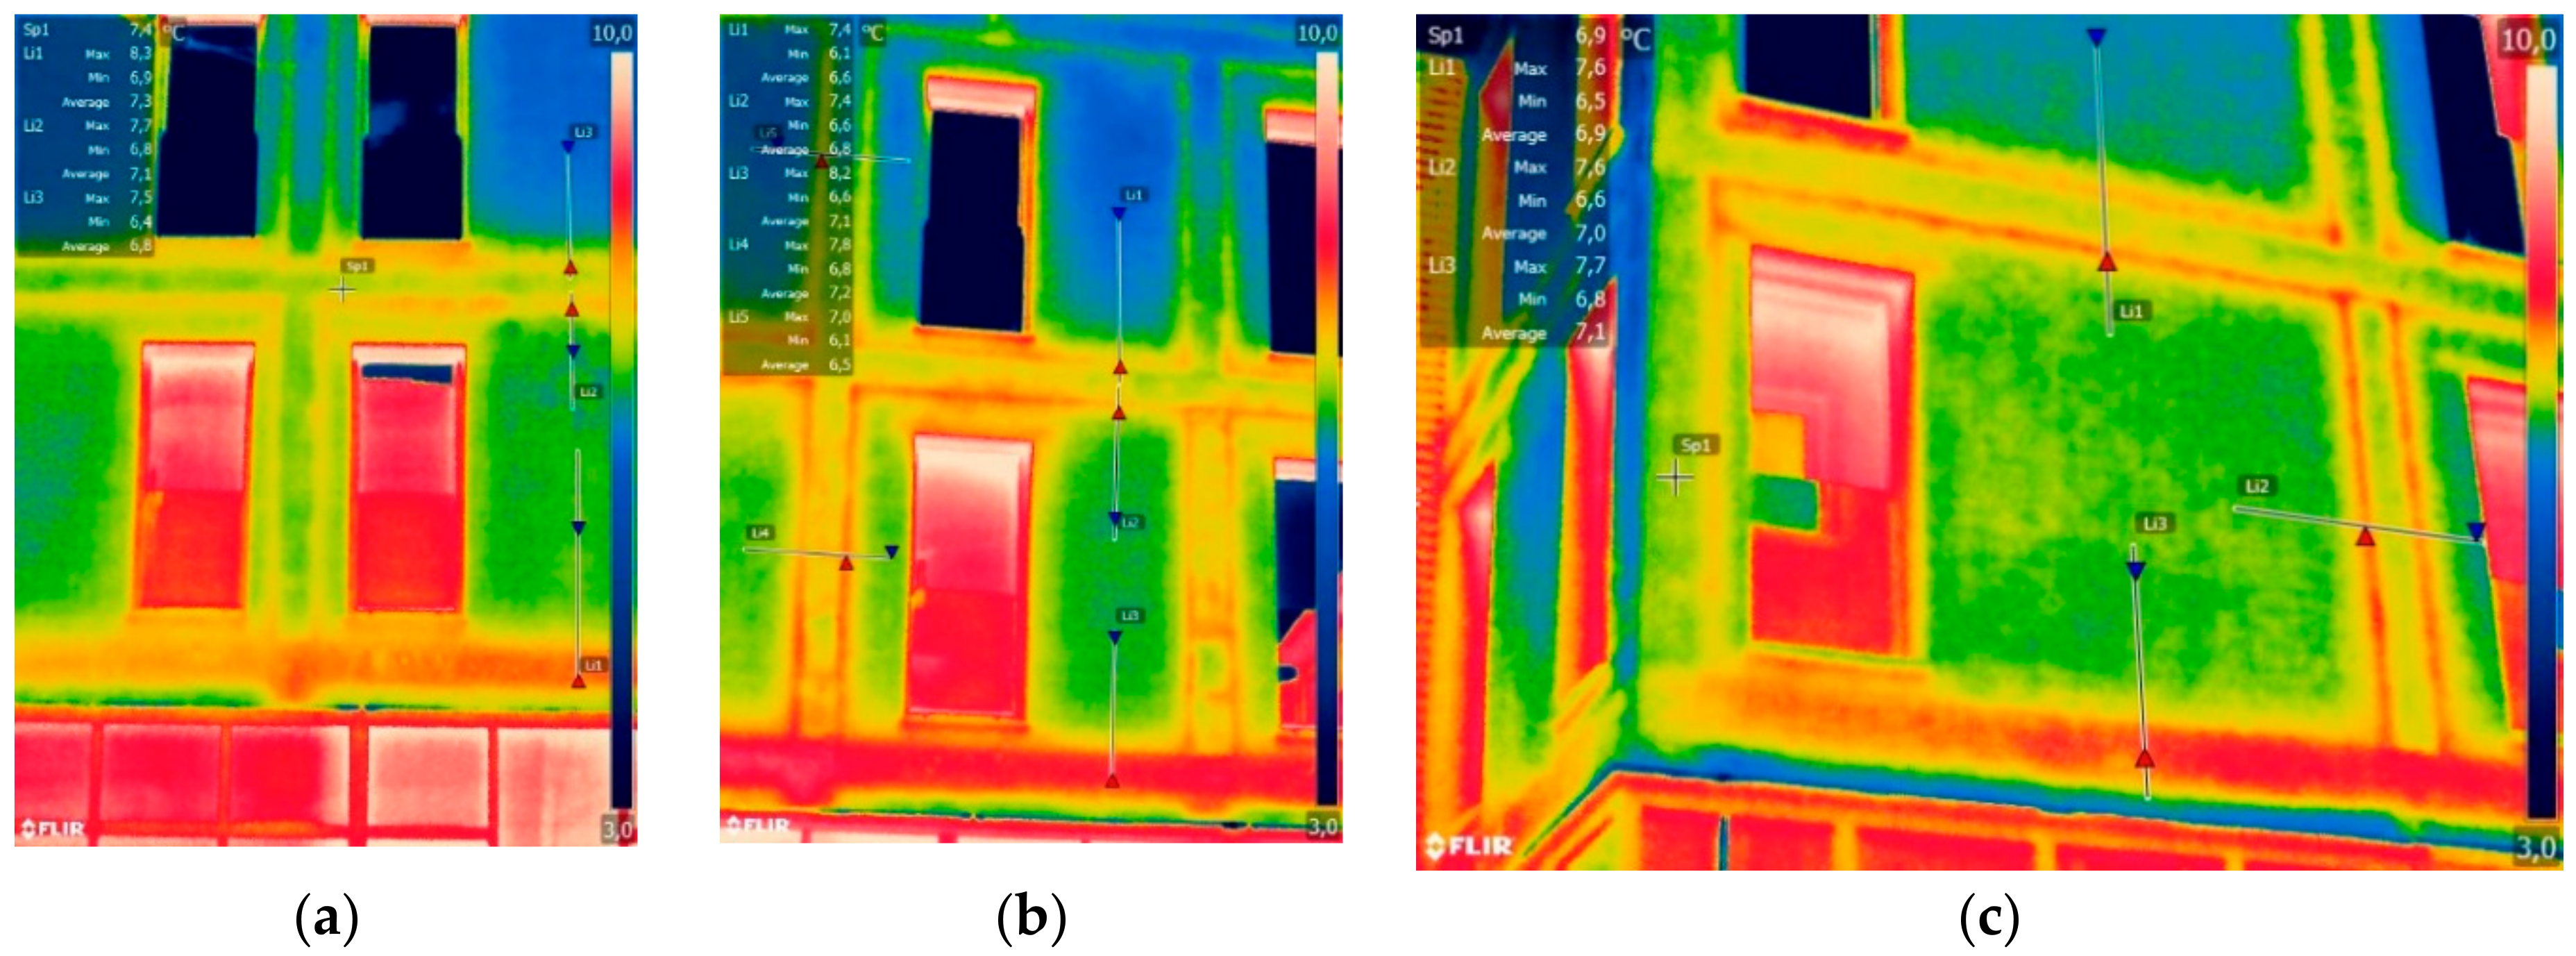
The exterior building inspection with thermal images proved that the outer surface temperatures were very similar in the four orientations of the building. Some slight differences were found between apartments, probably due to the varying indoor conditions from home to home. The outside surface temperatures indicated local increases of 1–2 °C in the front of the thermal bridges in contrast with the opaque adjacent walls. From the outside, some humid areas were found on the front of the first floor slab. On the contrary, no other evidence of humid areas was found from the outer side of the detected indoor pathologies. Examples of outdoor thermal images are given in
Figure 8 and
Figure 9.
Some noticeable irregularities were found in the distribution of the cellular glass boards on the potential thermal bridges.
Figure 10 shows how some boards are separated and even missing in the northeastern corner of dwelling 1C. This shows that the thermal bridging solution was not properly placed in some locations of the envelope and, consequently, that the effectiveness of minimizing the thermal bridge in these cases is seriously reduced.
From the inside, the effect of the structural thermal bridging was observed in two ways. Some elements like a pillar, shown in
Figure 11a, provoked very cold inner temperatures, but without any additional pathologies or problems. On the other hand, other areas occasioned large humid areas, such as those shown in
Figure 11b. The latter were also observed during the visual inspection because of the degradation of skirting boards and window frames, with obvious expansion of the wooden pieces and bubbles in the wall paint due to evaporation.
Additionally, some other minor condensation areas around the window frames were found during the inside thermographic survey.
Figure 12a shows a large cold area due to evaporation in the window-wall joint, and
Figure 12b shows an equivalent position, but in another apartment where there was almost no gradient of temperatures.
Figure 13a reveals another case of a clear cold area due to evaporation in the window-wall joint, and
Figure 13b shows a façade pillar which was fully wet at the bottom.
5. Analysis and Discussion
The combination of “a number of non-destructive techniques (NDT) is considered as one of the most suitable ways to improve the quality of the diagnosis of buildings” [
5]. This paper overcomes the limitations of on-site IRT thanks to the monitoring of surface temperatures and indoor air temperatures, as well as the calculation of the risk of condensation and thermal bridging.
First, the assessment of the condensation risk in the studied façade, based on the D1 climate zone typical winter conditions and the measured indoor air conditions, is summarized in the box-plots in
Figure 14, with the most frequent indoor air conditions of each dwelling. This assessment provides some evidence that there are three dwellings where the RH was over 70% for many hours. This high level of humidity is related to low heating use and insufficient ventilation. Additionally, it is worse in this case because of the small stack ventilation effect and inadequate window-opening habits for natural ventilation. The condensation risk for the building façade indicated that when the indoor air RH is over 70%, there is a clear interstitial condensation risk in all six dwellings, according to the annual method of the UNE-EN ISO 13788:2016.
Table 2 gathers the main results of this verification, and in
Figure 15 a comparison of condensing and non-condensing façade examples is presented. The situation in each dwelling is singular on a daily basis; on a monthly calculated basis, only one dwelling presented a measurable risk of interstitial condensation. The other dwellings presented only occasional surface condensation risks. For this reason, taking into account only this tool, it wasn’t possible to determine the origin of the humidity problems of the other five dwellings.
Second, the study of the surface temperature profiles in thermal bridges and the air dew point showed that the corner pillars have a measurable condensation risk. The joint of the façade-floor slab did not show any condensation risk under the monitored indoor air conditions. The pathologies around the corner pillars could be explained by this phenomenon, but other pathologies around ceilings, window frames, and walls could not, as can be seen in
Figure 16.
Third, the outer infrared thermographic survey confirmed that the building structure was insulated from the outside, but also revealed that this insulation was incorrectly installed in several places. From the outside there were no visible humid areas, apart from a couple of points in the bottom of the façade on the first floor. These small problems probably occurred due to the metal joint between the commercial ground façade and the first-floor residential brick wall. The inner survey showed some cold areas due to condensation evaporation which became crucial for the study. These thermal images proved that there was some kind of water accumulation in the bottom of the wall, particularly in areas close to windows, pillars, or other singular elements. This evidence meant that there was interstitial condensation inside the wall where the air cavity came in contact with colder elements such as the thermal bridge of floor slabs, pillars, window frames, and so on.
The combination of these three diagnostic tools leads to a conclusion that there are a number of factors which, likely not individually, but in combination, were probable to have provoked the pathologies present in the case study:
The first probable cause is the inadequate indoor use of heating and ventilation by the inhabitants. The recorded average indoor conditions of 17 °C and 65% RH were far from the expected design conditions of 21 °C and 50% RH.
The second probable cause is the building design. The thermal bridging of the structure was not well solved and the window position beside the corner pillar increased the risk greatly. Besides, the non-ventilated air cavity in combination with the low water vapor permeability of the PUR works as a vapor barrier that collects the internal vapor and condensates in the coldest points.
The third probable cause is the poor construction quality. This was evident in several particular problems located in the joint between the façade and the first-floor slab.
These causes explain the better façade conditions in the other building orientations, where the façades receive direct sun regularly and maintain warmer indoor conditions. The direct warming effect on the façades can also dry the cavities regularly.
In addition, this study could have been complemented with other techniques, such as a more detailed thermal comfort assessment, blower-door tests, direct wall layer moisture measurements, and three-dimensional (3D) simulations of the hygroscopic performance in the analyzed structural thermal bridges, windows, and so on. Newer techniques of IRT could also be helpful to detect the pathologies automatically after a walk-through inspection dwelling by dwelling [
11].
6. Proposal of Renovation Measures
Three main measures could solve or minimize the observed building pathologies at different costs:
Improve the indoor conditions of use. The regular use of heating and ventilation would surely warm up the envelope, control the indoor RH, and dry the air cavities. These cheap and non-invasive decisions would contribute significantly to solve the problem. This would mean an approximate increase of 400€ of individual heating use per home and year to maintain a minimum indoor air temperature of 19 °C.
Ventilate the air cavities in the North façade. Some perforation in the air cavity from the outside could work as weep holes and the generated convention could lower the vapor saturation inside the air cavities. This solution could significantly reduce the vapor pressure in the large wall areas. The cost of this would be around 2000€ per home. However, this solution alone might be insufficient to avoid the condensation around the coldest thermal bridges. To prevent this risk, it would be necessary to insulate some parts of the envelope in order to minimize the most relevant thermal bridges. However, the high cost of these additional fixes would make this enhanced solution too expensive.
External Thermal Insulation Composite System (ETICS) installation. A well-planned improvement of the thermal insulation would contribute to maintain better indoor conditions. However, this enhancement should be carefully projected to solve the thermal bridging. Otherwise, the corner pillars and all the other potential thermal bridges could create unwanted condensation problems in the future. The cost to conduct this renovation would be approximately 12,000€ per home.
7. Conclusions
The present case study demonstrates the importance of combining different diagnostic tools to properly identify the main causes of different building pathologies. The indoor air monitoring, the measurements of the thermal envelope and thermal bridging, as well as the thermal IR survey were essential to orient the analysis, define the boundaries of the risk calculations, and determine the average values for the final verifications of condensation under the real conditions of use.
The registered indoor conditions of the dwellings and the insufficient habits of ventilation of the inhabitants were the driving factors for condensation issues and water accumulation over time. The measurements over 40 days demonstrated that all of the studied buildings were outside the standard heating and ventilation operation ranges. The risk of surface condensation was present in all six buildings and the risk of interstitial condensation was present in one. However, the inadequate indoor conditions were not the only cause of the observed pathologies. Likely, these pathologies could have been avoided if the building design and construction had been properly done.
The thermal performance of the opaque walls was homogeneous and there were no relevant construction problems, as checked with the thermal IR survey. The structure was indeed insulated from the outside and the local variations of surface temperature were around 1–2 °C. Nevertheless, severe drops in the inner temperatures of the pillars were detected with the inner thermal images. Therefore, the solution of thermal bridging is not sufficient. Apart from non-reduced heat losses and the potential thermal comfort impact, it clearly contributes to local humidity, the deformation of wooden and other construction elements, and the growth of mold and other humidity-related microorganisms. The study confirmed that the construction composition of the wall and the non-ventilated air cavity aggravated the problem, due to its low vapor permeability.
Three improvement measures were proposed. Changing heating operation and improving healthy ventilation habits are the cheapest and less invasive measures. Opening weep holes in the air cavity of the North façade is a minimum intervention. The most complete solution would be increasing thermal insulation with an ETICS, but at a considerable cost.
Author Contributions
Conceptualization, J.M.H.-B. and C.E.-R.; Methodology, J.M.H.-B. and C.E.-R.; Software, J.M.H.-B. and E.I.-S.; Validation, J.M.H.-B., C.E.-R., I.F.-A. and J.M.P.S.-L.; Writing process, J.M.H.-B., Supervision, C.E.-R. and I.F.-A.; Project Administration, J.M.P.S.-L.
Funding
This research received no external funding.
Acknowledgments
To the Laboratory of Quality Control of Buildings of the Basque Government for the equipment and general support.
Conflicts of Interest
The authors declare no conflict of interest.
References
- Ministerio de Obras Públicas y Urbanismo, Gobierno de España. Norma Básica de la Edificación de Condiciones Térmicas en los Edificios; (NBE-CT 79), Real Decreto 2429/79, de 6 de julio; Ministerio de Obras Públicas y Urbanismo, Gobierno de España: Madrid, Spain, 1979.
- Instituto Nacional de Estadística INE. Available online: http://www.ine.es (accessed on 10 June 2017).
- Institudo para la Diversificación y Ahorro de Energía (IDAE). Programa de Ayudas Para la Rehabilitación Energética de Edificios Existentes del Sector Residencial (PAREER+CRECE); Resolución de 28 de abril, BOE n°107 de 05/05/2015; Institudo para la Diversificación y Ahorro de Energía (IDAE): Madrid, Spain, 2015.
- Departamento de Empleo y Políticas Sociales, Gobierno Vasco. Medidas Financieras Para Rehabilitación de Vivienda RENOVE; Orden de 26/11/2014, BOPV nº 2014229 de 1/12/ 2014; Vitoria-Gasteiz: Basque Country, Spain, 2014.
- Kylili, A.; Fokaides, P.A.; Christou, P.; Kalogirou, S.A. Infrared thermography (IRT) applications for building diagnostics: A review. Appl. Energy 2014, 134, 531–549. [Google Scholar] [CrossRef]
- Kirimtat, A.; Krejcar, O. A review of infrared thermography for the investigation of building envelopes: Advances and Prospects. Energy Build. 2018, 176, 390–406. [Google Scholar] [CrossRef]
- Barreira, E.; Almeida, R. Infrared Thermography for Building Moisture Inspection; Springer: Berlin, Germany, 2019. [Google Scholar]
- Ministerio de Fomento, Gobierno de España. Código Técnico de la Edificación (CTE); RD 314/2006, de 17 de marzo; Ministerio de Fomento, Gobierno de España: Madrid, Spain, 2006.
- Ministerio de Industria, Gobierno de España. Reglamento de Instalaciones Térmicas en los Edificios (RITE); Real Decreto 1027/2007, de 20 de julio; Ministerio de Industria, Gobierno de España: Madrid, Spain, 2007.
- Fanger, P.O. Thermal Comfort; McGraw-Hill Book Company: New York, NY, USA, 1973; p. 224. [Google Scholar]
- Garrido, I.; Lagüela, S.; Arias, P. Autonomous thermography: Towards the automatic detection and classification of building pathologies. In Proceedings of the 14th Quantitative InfraRed Thermography Conference, Berlin, Germany, 25–29 June 2018. [Google Scholar]
Figure 1.
(a) Dwelling distribution on the first and the second floors; (b) north-south cross-section of the building.
Figure 1.
(a) Dwelling distribution on the first and the second floors; (b) north-south cross-section of the building.
Figure 2.
(a) Constructive section in detail; (b) dwelling 1A pathologies; (c) dwelling 1E pathologies.
Figure 2.
(a) Constructive section in detail; (b) dwelling 1A pathologies; (c) dwelling 1E pathologies.
Figure 3.
(a) Schematic of sensor installation in a façade and slab thermal bridge; (b) schematic of sensor installation in a façade corner pillar; (c) sensors and data logger installed in a façade pillar.
Figure 3.
(a) Schematic of sensor installation in a façade and slab thermal bridge; (b) schematic of sensor installation in a façade corner pillar; (c) sensors and data logger installed in a façade pillar.
Figure 4.
Measured indoor air temperature of six dwellings.
Figure 4.
Measured indoor air temperature of six dwellings.
Figure 5.
Measured indoor air RH of six dwellings.
Figure 5.
Measured indoor air RH of six dwellings.
Figure 6.
Monitored values of the possible thermal bridge in the façade-slab connection. Dwelling 2D data from 31 January until 6 February.
Figure 6.
Monitored values of the possible thermal bridge in the façade-slab connection. Dwelling 2D data from 31 January until 6 February.
Figure 7.
Monitored values of the possible thermal bridge in the corner pillar. Dwelling 1D data from 31 January until 6 February.
Figure 7.
Monitored values of the possible thermal bridge in the corner pillar. Dwelling 1D data from 31 January until 6 February.
Figure 8.
(a) West façade of the case study; (b) outside thermal image of dwellings 1D and 2D.
Figure 8.
(a) West façade of the case study; (b) outside thermal image of dwellings 1D and 2D.
Figure 9.
(a) North façade of dwellings 1A and 2A; (b) North façade of 1E and 2E; (c) North façade of dwellings 1A and 2A.
Figure 9.
(a) North façade of dwellings 1A and 2A; (b) North façade of 1E and 2E; (c) North façade of dwellings 1A and 2A.
Figure 10.
(a) South façade area of the first floor slab of dwelling 1C; (b) South façade area of the first floor slab of dwelling 1D.
Figure 10.
(a) South façade area of the first floor slab of dwelling 1C; (b) South façade area of the first floor slab of dwelling 1D.
Figure 11.
(a) Dwelling 1A North façade pillar inside temperatures in detail; (b) dwelling 1A corner pillar inside temperatures in detail.
Figure 11.
(a) Dwelling 1A North façade pillar inside temperatures in detail; (b) dwelling 1A corner pillar inside temperatures in detail.
Figure 12.
(a) Comparison of the North façade window-wall connection in dwelling 1A and (b) the West façade window-wall connection in dwelling 1D.
Figure 12.
(a) Comparison of the North façade window-wall connection in dwelling 1A and (b) the West façade window-wall connection in dwelling 1D.
Figure 13.
(a) North façade window-wall connection in dwelling 1E; (b) the lower part of the North façade pillar in dwelling 1D.
Figure 13.
(a) North façade window-wall connection in dwelling 1E; (b) the lower part of the North façade pillar in dwelling 1D.
Figure 14.
(a) Box-plot of monitored indoor temperatures; (b) box-plot of monitored indoor RH.
Figure 14.
(a) Box-plot of monitored indoor temperatures; (b) box-plot of monitored indoor RH.
Figure 15.
(a) Vapor pressure resistance profile of a façade when the indoor temperature is 17 °C with 65% RH; (b) vapor pressure resistance profile of a façade when the indoor temperature is 17 °C with 80% RH.
Figure 15.
(a) Vapor pressure resistance profile of a façade when the indoor temperature is 17 °C with 65% RH; (b) vapor pressure resistance profile of a façade when the indoor temperature is 17 °C with 80% RH.
Figure 16.
(a) Dew point and thermal bridge coldest point for the corner pillar; (b) dew point and thermal bridge coldest point for the façade-floor slab joint.
Figure 16.
(a) Dew point and thermal bridge coldest point for the corner pillar; (b) dew point and thermal bridge coldest point for the façade-floor slab joint.
Table 1.
Sensors and equipment used in the case study.
Table 1.
Sensors and equipment used in the case study.
| Number | Variable | Equipment/Sensor, Manufacturer | Units | Uncertainty |
|---|
| 14 | Surface temperature | Pt100, 4 wires, class 1/3 DIN | °C | ±0.2 °C |
| 2 | Air temperature | Pt100, 4 wires, class 1/3 DIN | °C | ±0.2 °C |
| 7 | Air temperature, RH | Thermometer hygrometer 175-H2, TESTO | °C, % | ±0.5 °C, ±3.0% HR |
Table 2.
Summary of the dwellings’ status, including indoor conditions, observed pathologies, and calculated risk of condensation according to UNE-EN ISO 13788:2016.
Table 2.
Summary of the dwellings’ status, including indoor conditions, observed pathologies, and calculated risk of condensation according to UNE-EN ISO 13788:2016.
| Dwelling | 1° D | 1° E | 1° A | 2° D | 2° E | 2° A |
|---|
| Average air temperature (°C) | 17.2 | 17.5 | 13.8 | 16.2 | 17.0 | 13.2 |
| Average air RH (%) | 61.0 | 75.0 | 63.0 | 62.0 | 65.0 | 58.0 |
| Visible pathologies | Corner pillar, Façades N and W | Façade N, ceilings | Corner pillar, façade N | Corner pillar, façades N and W, pillar W | Skirting board N | Corner pillar, façade N, skirting board N |
| Heating (T > 17 °C) | Yes | Yes | No, very short | No | Yes | No, very short |
| Natural ventilation habits (HR < 60%) | No | No, very short | No | No | No | Yes |
| Surface condensation | No | Yes | Yes | Yes | No | Yes |
| Annual condensation | No | Yes | No | No | No | No |
© 2018 by the authors. Licensee MDPI, Basel, Switzerland. This article is an open access article distributed under the terms and conditions of the Creative Commons Attribution (CC BY) license (http://creativecommons.org/licenses/by/4.0/).

 ,
, 


