Risk and Resilience at the Oroville Dam


1
School of Sustainable Engineering and the Built Environment, Arizona State University, Tempe, AZ 85281, USA
2
Department of Operations Research, Naval Postgraduate School, Monterey, CA 93943, USA
*
Author to whom correspondence should be addressed.
Infrastructures 2018, 3(4), 49; https://doi.org/10.3390/infrastructures3040049
Submission received: 15 August 2018
/
Revised: 29 October 2018
/
Accepted: 31 October 2018
/
Published: 6 November 2018
(This article belongs to the Special Issue Resilient Infrastructure Systems)
Abstract
:Existing analyses of the February 2017 Oroville Dam Crisis identify maintenance failures and engineering shortcomings as the root cause of a nearly catastrophic failure of the tallest dam in the United States. However, the focus on technical shortcomings largely overlooks the role of adaptive decision-making that eventually averted the crisis. Understanding the decisions that both created the circumstances leading up to the crisis and saved the dam from collapse requires that risk analysis be complemented by a resilience perspective. This paper presents a case study on the Oroville Dam Crisis to develop a timeline of failures and successes in the resilience processes of sensing, anticipation, adapting, and learning throughout the history of the dam. Three factors that drove poor operational and engineering decisions include: (1) misalignment of technical nomenclature and design requirements for the ungated spillway, (2) overconfidence in original engineering designs, and (3) conflicting pressure from diverse stakeholders. These factors contributed to unrealistic perceptions of dam capabilities and promoted decisions to forgo maintenance and design efforts that may have mitigated the danger.

1. Introduction
In the spheres of risk management, crisis mitigation, and dam safety, the spillway collapse at the Oroville reservoir in 2017 is becoming a well-researched topic. In February 2017, spillway failure during routine water release at Oroville resulted in the largest evacuation in California history and nearly resulted in complete failure of the tallest dam in the United States. Hydrologists estimated that the uncontrolled release of the reservoir impounded by the Oroville dam would have inundated Sacramento, CA (the state capital) with 30 feet of water within 30 h. Fortunately, last minute adaptations kept the reservoir intact even while dam components failed. Still, the significance and public availability of information about this incident spurred several critical assessments of the events that occurred and the context surrounding them. Public investigations catalog important events that happened just before and just after the spillway failure and identify numerous short-comings in maintenance and safety review procedures that contributed [1]. In such cases, experts typically conduct post-event analyses to guide future decisions during infrastructure crises, which contribute to the essential task of learning. Yet, the correction of technical shortcomings will not inoculate Oroville or other dams from future surprises.
One particularly important oversight limiting the scope of existing investigative efforts is a reliance on traditional risk analysis [2] for examining past events. This risk perspective emphasizes those components of the system that were more likely to fail than expected, the consequences of their failure, and the reasons why they failed. While the limitations of traditional risk analysis (including risk management) have been documented both for Oroville [3] and in general [4], optimism about using risk remains persistent among the dam analyst community [1]. This is due to successful risk analyses revealing shortcomings that contributed to events at Oroville including: a lack of experience among some contractors and designers, difficulties with inspection of the main spillway, and safety investigations that failed to reflect the results of previous recommendations [1]. Still, resilience theory suggests that there is no level of information, analysis, protection, or precaution that will forestall failure in complex systems. All complex systems are subject to surprise such that traditional risk analyses revealing past shortcomings are insufficient to manage unforeseen future crises [5]. Consequently, resilience differs from risk in several important ways. It seeks a broad perspective on surprise rather than a narrow focus on identified hazards. It emphasizes possibilities rather than probabilities. In addition, it emphasizes adaptation rather than planning [6]. As a complement to traditional risk analysis, resilience may be a powerful practice for averting not just recovering from catastrophe.
The essential processes to consider in resilience analysis are sensing, anticipating, adapting, and learning [7]. Assessing the events at Oroville with resilience processes in mind does not depend on pre-conceiving possible failures in the way that a fault-tree or other risk-related approaches might. Instead, a resilience approach focuses attention on the motivation and pressures guiding the adaptive capacity available to officials making decisions at Oroville. In this way, a resilience investigation views an event as a series of decisions that either enhanced or compromised adaptive (or maladaptive) actions. This series of decisions more closely resembles an evolutionary history of the system rather than the list of procedural or technical failures often generated by risk-management analyses.
Studies of decision-making practices during other large-scale disasters suggest that analyzing the contextual factors available to decision makers at Oroville will reveal barriers and enablers of resilience. For example, decision pressures in the design and operation of the Fukushima Daiichi nuclear power plant limited tsunami anticipation practices and adapted the process during the Tohoku earthquake and nuclear meltdown [8]. And, inadequate sensing about deep-water drilling and a lack of learning to develop response strategies for deep-water well blowouts exacerbated the impacts of the Deepwater Horizon oil spill [6]. In contrast, the capability of the US Army Corps of Engineers to overcome decision-making pressures and activate near century-old floodway infrastructure for the first time in 2011 saved much of the Mississippi river valley from catastrophic flooding [7]. In all cases, resilience analysis considers operator decisions and context to reveal decision-making pressures that are common across critical infrastructure systems. The intent of resilience analysis for Oroville, then, is to incorporate risk findings into the broader behavioral/decision context of the reservoir operators to identify similar themes and pressures that accumulated over roughly two decades (1997–2017).
In this work, we develop a novel timeline for the Oroville dam and reservoir system favorable to resilience analysis and present preliminary assessment of pressures that influence crisis decision-making. Our investigation relies entirely on publicly available information, uses results from risk-based studies as a starting point, and refocuses the understanding of these events by using resilience engineering as a lens. We find that the Oroville incident that occurred in 2017 requires an understanding of decisions made from the inception of the dam and reservoir system until a short time after the February failure (1800s–2018). We construct a timeline that connects events that are already well documented but until now have not been viewed in a context that successfully related them to the failure.
2. Materials and Methods
Primary evidence used to construct the timeline of events was collected from multiple sources. The first was the historical timeline provided by the Department of Water Resources (DWR) for the Oroville Dam and surrounding reservoirs. This record starts with the earliest concept of a state-wide aqueduct system in the late 1800s and continues up until the construction of the dam [9]. The second source was a news article written by KQED that catalogues events before, during, and after the spillway failure in February 2017 [10]. Events from these two sources were combined into a single timeline that provided a framework for further research. Details for individual events along the timeline were verified by using cited references provided by these two sources and using the California State historical archives. Additional primary documents for each event was found in the scholarly literature, news media, and social media websites to corroborate primary evidence [11]. Three themes emerged during a critical review of the literature: (1) confusion over the designation of the ungated spillway, (2) overconfidence in the dam’s water management capacity, and (3) conflicting interests in water management.
3. Results
3.1. Background
Lake Oroville served as the keystone of the California aqueduct system since commissioning of the Oroville Dam in 1968. Built as the tallest dam in the United States, Oroville serves two competing purposes: (1) provide flood control to communities on the Feather River and (2) collect water from the Sierra Nevada watershed in northern California to distribute it throughout the state as far south as Los Angeles. Additionally, the Dam provides auxiliary functions that include hydropower generation and recreation.
The system consists of four water removal mechanisms. The main (or service) spillway is a concrete chute down which water can flow after exiting the reservoir through a set of gates at the top. The main spillway is used when its high release capacity is desired typically to release additional water and reduce high reservoir levels. When the water’s surface elevation is high enough, the main spillway gate allows operators to control the outgoing flow rate or stop the flow entirely. The water travelling down the main spillway enters a channel called the Thermalito Diversion Pool, which collects outflows from all four water removal mechanisms. It was a structural failure in the main spillway that precipitated the 2017 crisis. The other three outflow mechanisms are the Hyatt Powerhouse, a River Valve Outlet System (RVOS), and an ungated (e.g., emergency) spillway. The physical arrangement of the outlets to the diversion pool is shown in Figure 1.
The hydroelectric power plant is directly connected to the Oroville Dam and the inlet is near the gate for the main spillway. Power plant outflows enter the diversion pool at the base of the dam, which is upstream of main spillway outflows. The RVOS was used to carry river flow during dam construction in the 1960s. It was damaged in 2009 during a failed operations test and was repaired five years later to carry only about 2400 cfs—less than half its original capacity. It was not used in 2017 and never would have been able to carry enough flow to lower reservoir levels during the crisis partly because it shares discharge piping with the Hyatt Powerhouse. The principal purpose of the RVOS is to manage very low reservoir levels such as construction or repair drawdowns. The ungated spillway is activated whenever water levels in the reservoir rise to an elevation that will overtop an area adjacent to the dam itself. This spillway’s name was the subject of some confusion during the incident, but the least ambiguous name is the “ungated spillway” because it does not have a gate to stop the flow of water once it starts. Although this ungated spillway had never been employed prior to 2017, the dam design called for water to flow over a concrete weir and travel over an unprotected hillside into the diversion pool, downstream of the main spillway. A brief description of each water removal mechanism is given in Table 1.
The dam serves three principal purposes: flood control, water provision to southern California, and hydroelectric power generation. The first two are expected to reduce the risk of flood and drought while the last may reduce electric power costs. Nonetheless, the dam structure also introduces new risks that never existed including the technical risk of catastrophic collapse of the massive reservoir, the financial risks of investment loss, and the political risks associated with perceptions of dam management. Mitigation of these risks requires careful maintenance and operation of the dam structure including balancing the two competing priorities of flood control and water provision. For example, the flood control requires maintaining low enough reservoir volumes to provide ample room to store excess stream runoff from heavy precipitation. Water provision requires maintaining high reservoir volumes to provide ample reserves in the case of drought.
Leading up to February 2017, the State of California was emerging from one of the worst and longest droughts in the modern history of the state. Changing weather patterns pummeled northern California with rain, which refilled the Lake Oroville reservoir by January 2017 and prompted releases from the Lake Oroville reservoir to keep the level within a safe operating range. On 7 February, 2017, workers reported that chunks of concrete had broken loose from the spillway structure. To avoid further erosion of the spillway structure, managers closed the main spillway gates and inspected the damage. Because debris from the main spillway choked off the diversion pool downstream of the power plant outlet, the main spillway failure also resulted in closure of the power plant and RVOS. Consequently, water levels in the reservoir kept rising while rain continued unabated.
Without outflow options, reservoir elevations must rise. An ad hoc arrangement for operating the main spillway at 40,000 cfs slowed the increase. At that flow, managers reasoned, water would jump over the growing hole in the main spillway. While erosion would continue, it would largely be directed downhill and would avoid undercutting the spillway in a way that threatened the main dam structure. The erosion damage was extensive and decision-makers were cautioned that debris and backflows in the diversion pool threatened the expensive equipment within the power plant.
Eventually, heavy rains resulted in the unprecedented activation of the ungated spillway when reservoir levels overtopped the concrete weir. As water left the concrete section of the weir and flowed down the unarmored hillside, it removed the soil on rock below the weir structure and eroded weak seams within the rock itself. As the erosion increased, it threatened to undercut the weir. The resulting failure of the weir structure would have increased uncontrolled flows, accelerated erosion, and eventually caused complete collapse of reservoir containment. The water would have cut a new channel around the embankment structure of the dam in an uncontrollable release, necessitating the emergency evacuation. Catastrophe was averted only after a rapid re-opening of the main spillway to flow rates estimated to exceed 100,000 cfs and lowering water levels to the point where flow over the ungated spillway weir subsided.
Since then, investigation brought to light various inconsistencies and points of conflict surrounding the way in which California managed and maintained one of its most crucial infrastructures. Studies revealed a lack of maintenance activities [3] and flawed designs that did not meet minimum standards [1]. The implication is that correction of maintenance and design flaws would have avoided the near-catastrophe, which may be true. However, these studies fail to prepare infrastructure managers for the inevitable surprises they must confront over the decadal operating lifetimes of major infrastructure projects. The risk analytic perspective suggests that, if only maintenance and design adjustments had been perfected, then no crisis would emerge. Resilience recognizes that components and practices at major, complex installations will never be perfect nor could we likely afford to perfect them. Thus, resilience challenges engineers and managers to cope with the surprise of imperfection by building adaptive capacity. In short, risk analytic approaches (such as fault trees) are good for discovering those things that went wrong, but they lack an examination of the adaptive capacities available in response to management of surprise.
Three primary sources published investigative reports regarding Oroville after the failure. The news media collectively distributed the most information by sending reporters to the scene to interview involved personnel and locals, but large portions of the information overlapped or were conflicting. Private interested parties including those wishing to clarify the news published crowd-sourced information or analyses of information that were publicly available. Finally, an independent investigation commissioned by the California Department of Water Resources (DWR) published a report in January 2018 summarizing their findings, which were generated with much greater access to information. Each of these sources sheds light on crucial flaws in the reservoir system.
Much of the reporting during the crisis focused on the evolving situation and the potential impact of a worst-case scenario. The amount of reporting available that allowed for the corroboration of timeline events was beneficial even though reporters harbored a multitude of misconceptions about basic dam operations. The news media was also probably the greatest source of public commentary.
In some cases, information from public sources may have reflected a better understanding of the system than information from official sources. For example, the spalling of concrete from the surface of the main spillway may have been reported through social media prior to official detection of the structural failure. Additionally, public comments during hearings conducted in 2005 correctly identified and warned against the mechanisms by which the eventual crisis unfolded [12]. During scheduled relicensing hearings, several interested parties banded together to critique dam management plans and advocate upgrading the ungated spillway. Journalists found that this report was basically ignored at the time, but lines of inquiry as to why faded quickly as the crisis came back under control. Most of what was originally reported by journalists was clarified or explained in further detail in later investigations conducted by other parties.
One of the first detailed investigations to be published regarding the failure at Oroville was produced by Robert Bea at the Center for Catastrophic Risk Management at UC Berkeley [3]. Bea relies almost entirely on photographs, schematics, and data published by the California Department of Water Resources (DWR). The report conjoins extensive expertise and impressive attention to detail to outline the root causes of the failure. The root causes are specific design flaws, construction flaws, and maintenance flaws. Even though these details are somewhat important in the context of dam operation, the findings only focus on the main spillway. However, the main spillway is not the system. It is a component of a much more complex system and resilience demands that complex systems must be able to adapt to compensate for component failures. The exact reason why the spillway collapsed is no more important than how the rest of the system responded.
The most comprehensive review of the crisis comes from the independent forensic investigators hired in response to the crisis [1]. The investigators published their report after the data collection phase of this research was otherwise complete, which caused a review of previously stated information. They were granted access to all catalogued information about the dam’s operation as well as the direct cooperation of DWR personnel. While the forensic investigation does restate quite a bit of Bea’s report, one distinction is that, instead of defining the failure as the collapse of the main spillway, the failure is defined as the point when the ungated spillway was activated, triggering the evacuation. The forensic report follows the decisions of the operators that led up to this failure. The conclusion is that better decision-making could have prevented the activation of the ungated spillway after the collapse of the main spillway. The forensic investigation also yields a provocative look into the effect of workplace culture on confidence and the method of operation.
3.2. Timeline of Decisions
The idea of long-distance transport of water from Northern to Southern California dates back at least to the 1800s. By the early 1900s, the state worked to develop the State Water Plan (SWP), which would have funded the Oroville Dam as a means of water retention and distribution if not for the Great Depression. This coincided with completion of the plan. Allocation of funding remained on hold until the Flood Control Act of 1958, which authorized federal funding to prevent repetition of flooding. It took place during the winter of 1955 to 1956 [13]. By 1960, narrow passage of the Burns-Porter Act [9] allowed funding to connect Oroville to the larger state aqueduct network. Lastly, the dam was officially dedicated to the State of California by Governor Ronald Reagan in 1968 [14].
3.2.1. 1997—Levee failure, Evacuation
The dam operated relatively incident free until 1997 when a shift in the weather at the turn of the year brought an influx of warmer, tropical storm weather that melted a thick snowpack in the Oroville watershed [15]. To manage reservoir levels, managers allowed prolonged periods of high-flow discharge and saturated downstream levees along the Feather River, which failed when they became too waterlogged. The resultant flooding necessitated one of the largest evacuations in California at the time [16].
The 1997 evacuation was without warning and attempts to disseminate information were frenzied. Public officials drove through the streets using loud-speakers to announce an immediate evacuation. Over 120,000 residents were evacuated and 32,000 homes were destroyed or damaged. Following the incident, the governor ordered a report to detail the circumstances of the flooding and evacuation. This nearly 300-page report was prepared by the Governor’s Flood Emergency Action Team (FEAT) and is a comprehensive study of multiple aspects of the flooding including damage estimates, the role of the Army Corps of Engineers, other federal organizations, the emergency response, and other components [17]. These assessments were compiled to create an extensive recommendation to the governor about how to best prepare California for the next inclement weather event. Understandably, the FEAT foreword states, “this event left many of the State’s citizens apprehensive about how much protection they can expect from the current leveed flood control system.” People were losing faith in the system that had worked well to protect them in the past.
FEAT estimated 2 billion dollars in damage overall with half of that being at taxpayer expense. According to the report, “levees sustained various types of damage such as erosion on the landside due to overtopping and wave wash, which threatened levee stability, slope failures, sloughing, settlement, and sinkholes and seepage damage from boils and seeps carrying levee and foundation soils.” In addition to the intentional relief cuts, the levees failed in 18 separate places during the flooding and continued to fail even after the stormy weather had cleared [18].
FEAT recommendations primarily focused on improving strategies for emergency response including delineating the delegation of authority, streamlining the movement of funds, and developing a system for describing hydrologic conditions of California’s central valley by installing telemetry devices and updating Federal Emergency Management Association (FEMA) floodplain maps. For example, FEAT pointed out that, during flooding, organizational authority was often unclear including who had the authority to order evacuation and who had the authority to temporarily halt the boating along the rivers that was exacerbating the stress on the levees. Moreover, means for evacuation and shelter did not provide for disabled persons or pets. Additionally, FEAT recommended making numerous appeals for funding from federal agencies.
3.2.2. 2003—Relicensing
On 19 February 2003, several participants concerned with the safety of Oroville Dam including CALFED agencies, local municipalities, and The Sierra Club sent a letter to the manager of the Oroville Facilities Relicensing Program with a copy to the DWR Director, which attempted to preempt the finalization of the relicensing package submission due in January 2005 [19]. The relicensing process occurred through the Federal Energy Regulatory Commission (FERC). The February letter outlined five points that the participants believed to be pertinent to the relicensing process and should be addressed with FERC.
The first point states that the relicensing process is the appropriate place to discuss flood control because future flood control operations will require FERC approval. However, discussions with DWR staff during public meetings caused the participants to believe that DWR intended to consider flood control improvements outside of the relicensing process.
The second point discusses potential inadequacy in the zone of impacts that have been considered in the case of a flooding event downstream from the dam, which echoed the 1997 FEAT recommendation for updated flood zone maps.
The third point brings up what is known as the “ungated spillway” (also controversially referred to as the “auxiliary spillway” or the “emergency spillway”). The ungated spillway would allow water to spill over a weir once it has reached 901 feet above sea level [20]. However, the forested hillside downstream of the ungated spillway was unprepared for carriage of large quantities of water and never carried water in the past. The only way to prevent flow over the ungated spillway weir was to prevent reservoir levels from exceeding 901 feet by using a different water removal method. According to the letter, “Utilizing such a spillway has the potential to cause severe damage to the downstream hillside, project facilities, and downstream environments located in the path of the flood release.” The participants also observed that DWR operators might be “reluctant to fully implement Oroville’s existing reservoir regulation manual out of reluctance to incur such damages from operational releases.” The participants claim that the ungated spillway is most accurately classified under FERC guidelines and current ACE operating procedures as an auxiliary spillway [21]. Based on FERC guidelines, auxiliary spillways are designed for infrequent use and can sustain limited damages during design flooding conditions. The guidelines also specify that an auxiliary spillway should be present in rock or protective surfacing. Emergency spillways, however, can sustain significant damage and may be designed with lower standards because their use should only occur when accommodating flows that are the result of incorrect operation or malfunction. The goal of an emergency spillway is to promote additional hydrologic safety at low cost. Thus, the classification of the spillway as main (service), auxilliary, or emergency makes clear the standard to which it should be designed, constructed, and operated. In the case of the ungated spillway at Oroville, a misunderstanding during the crisis suggested imprudent operating procedures.
The final two points deal with engaging the Army Corps of Engineers about updating outdated operating procedures to reflect more accurate conditions. The ACE guidelines were several decades old, based on temporary conditions, and were not updated to include information gathered from significant flooding events including a flooding event in 1997 [22]. A key point is that the original design and operating procedures for the Oroville Dam depended upon construction of the Marysville Dam, which was halted in the late 1970s. Without the upstream dam, operating flexibility in the river system would be less than assumed by the Oroville plan and this information reinforced the argument that the ungated spillway be classified as “auxiliary.”
Nonetheless, these arguments were ignored and the relicensing application was submitted without including provisions for any of these points.
3.2.3. 2005—Motion to Intervene
Once DWR announced that the application to relicense the Oroville dam had been submitted in time for the deadline, the FERC was allowed two years to complete the review process [23]. According to DWR, “Approximately 1200 stakeholders helped shape the application package that was put together after more than five years of collaborative effort involving hundreds of meetings and some 165 technical reports.” Following this announcement, several environmental groups filed a Motion to Intervene as a follow up taken to the actions taken in 2003 regarding the potentially catastrophic consequences of the reservoir’s configuration [24]. The motion included a compilation of information that was gathered by the groups about how the dam had been operated and specifically focused on the lack of a developed backup spillway in the case that necessary outflow from the reservoir exceeded the main spillway’s capacity. Federal regulations require that a reservoir have a path for water to be removed in the case that the required outflow to maintain a safe level would exceed the capacity of the main spillway.
The Motion to Intervene also contains research that gives insight into the historical incongruences in Oroville Dam’s operation. According to the motion, the US Army Corps of Engineers (ACE) licenses the dam to DWR known as the licensee. The ACE sets guidelines for how the reservoir and dam should be operated in conjunction with the rest of the local aqueduct system including a specific reservoir level at which ACE flood control guidelines prevail over normal operating guidelines. The guidelines in place are also subject to circumstances including future developments such as the construction of Marysville Dam, which is considered unlikely to ever occur because of its potential impact on endangered fish species. Nevertheless, this contingency remained in the operator’s guidelines for decades and these guidelines state that the ungated spillway can only be relegated to strictly emergency purposes once the Marysville Dam is built. In other words, the ungated spillway should have been considered a component necessary for normal operation, according to the motion. The engineers at the time may have hoped that use of the ungated spillway would not be necessary during what they expected to be a short time before the Marysville Dam was built.
The motion calls into question DWR’s ability to carry out the prescribed guidelines, citing the 1997 levee failure as an example, claiming that “Oroville Dam operators increased releases to 160,000 cfs from the 150,000 cfs objective release and notified the City of Oroville to be prepared to make evacuations.” According to the motion, operators had strayed outside of the guidelines to maintain the reservoir level, which resulted in the levee failures that may have been preventable. “In 1990, the ACE made a determination that levee foundation problems meant that this portion of the Feather River floodway could only reliably accommodate 268,000 cfs rather than the 300,000 cfs design flow.”
The following year, FERC sent out a memo clarifying its position on the issues raised [22]. The memo refuted the idea that the ungated spillway was incorrectly classified as an emergency spillway by saying it followed FERC standards. It also noted that their guidelines state that it is acceptable for an emergency spillway to sustain significant damage during a rare flood event.
3.2.4. 2011—A Near Miss
In 2011, the reservoir surface elevation rose to within several feet of the ungated weir level for over a month [25]. The peak level recorded was 900.11 feet, which is less than 11 inches from spilling over. Very little information is available about this occurrence. A local news outlet reported that three of the six turbine generators in the Hyatt power plant were down and that the River Valve Outlet System (RVOS) was blocked at the time, which prevented water from being removed and transported to buyers in the south [26]. Nevertheless, this near miss failed to result in additional protective measures.
3.2.5. 2017—Oroville Spillway Incident
February 7—Day of the Failure
Record rainfall inundated the Sierra Nevada in the beginning of 2017. Conditions that lead to flooding were like those of early 1997: snowpack followed by atmospheric rivers of tropical weather. However, this time California had been in an extraordinary state of emergency due to drought conditions that had persisted since the beginning of 2014, which may have affected flooding readiness [27]. In the days preceding the crisis, reservoir elevations were maintained just below the 850 feet flood control level, which is the level regime at which ACE guidelines take effect to dictate flood control procedures [28]. The heavy rains necessitated an increase of outflows from the reservoir to compensate for the rapidly rising surface elevation. It was during these outflows that damage to the dam’s main spillway was first noticed by workers near the spillway. Onlookers posted YouTube footage of portions of the spillway being chucked into the air by cascading water [29]. DWR halted the flow through the main spillway gates to assess the damage. At the time, the Hyatt Power Plant, which is Oroville Dam’s hydroelectric generating plant, was online to provide partial outflow during inspection of the damage.
As inflows from rainfall increased, the reservoir surface elevation entered the flood control regime. Operators were now expected to control the dam in accordance with flood control procedures, but the only available control mechanism was at a significantly reduced capacity and was suffering extraordinary damage. It is not apparent that there were any procedures available for an incident of this nature and the rapidly rising surface elevation granted little time for planning.
February 8—The Experiment
The following evening, the DWR experimentally released water down the main spillway to perform a stress test on the existing failure [30]. The next morning, a major increase in the size of the failure was visible. Later that morning, DWR again reopened the gates attempting to release the water at a fast-enough flowrate to prevent head-cutting or upwards erosion that could undermine the dam structure. A higher flowrate allowed the water to glide from the upper portion of the spillway and, instead, crash into a pool below, which caused a prolonged assault on the lower portion of the spillway. Residents were advised to prepare in the event of an Evacuation Warning [31].
February 9—Last Ditch
Speculation about using the ungated spillway started after the initial failure of the main spillway. Acting DWR Chief Bill Croyle initially referred to the ungated spillway as a “very last-ditch measure.” Nonetheless, preparations were made by removing the trees and electrical towers that might be swept away by uncontrolled flows over the hillside below the ungated spillway [10]. To stem the possibility of a domino-fall of power towers, Pacific Gas & Electric (PG&E) employees dangled from helicopters to remove the existing electrical lines and cut the normal supply of electricity to the main spillway gates and Hyatt Powerhouse.
February 10—Hyatt Shut Down
Three days after the initial failure, the Hyatt Powerhouse had to be shut down. Debris kicked up from the failure of the main spillway caused the channel to back up and its level rose above the exhaust of the power plant. The power plant is only capable of a meager discharge, only five of the six total turbines were available for discharge, and the power plant can only discharge while connected to the grid.
February 11—“Emergency Spillway”
During discussion about potential expected use of the ungated spillway, Acting Chief Bill Croyle pointed out that the area at the base of the spillway weir would be strong enough to withstand flows because it was made up of “solid rock” [32]. Four days after the initial failure, the ungated spillway began carrying water [33]. According to the State Water Plan, the area directly below the ungated weir was not cleared of trees and other natural growth prior to this time because use of the spillway was considered “infrequent” [20]. Nonetheless, with water now pouring down the hillside, the DWR pronounced that this was not a threat to the dam or residents [34].
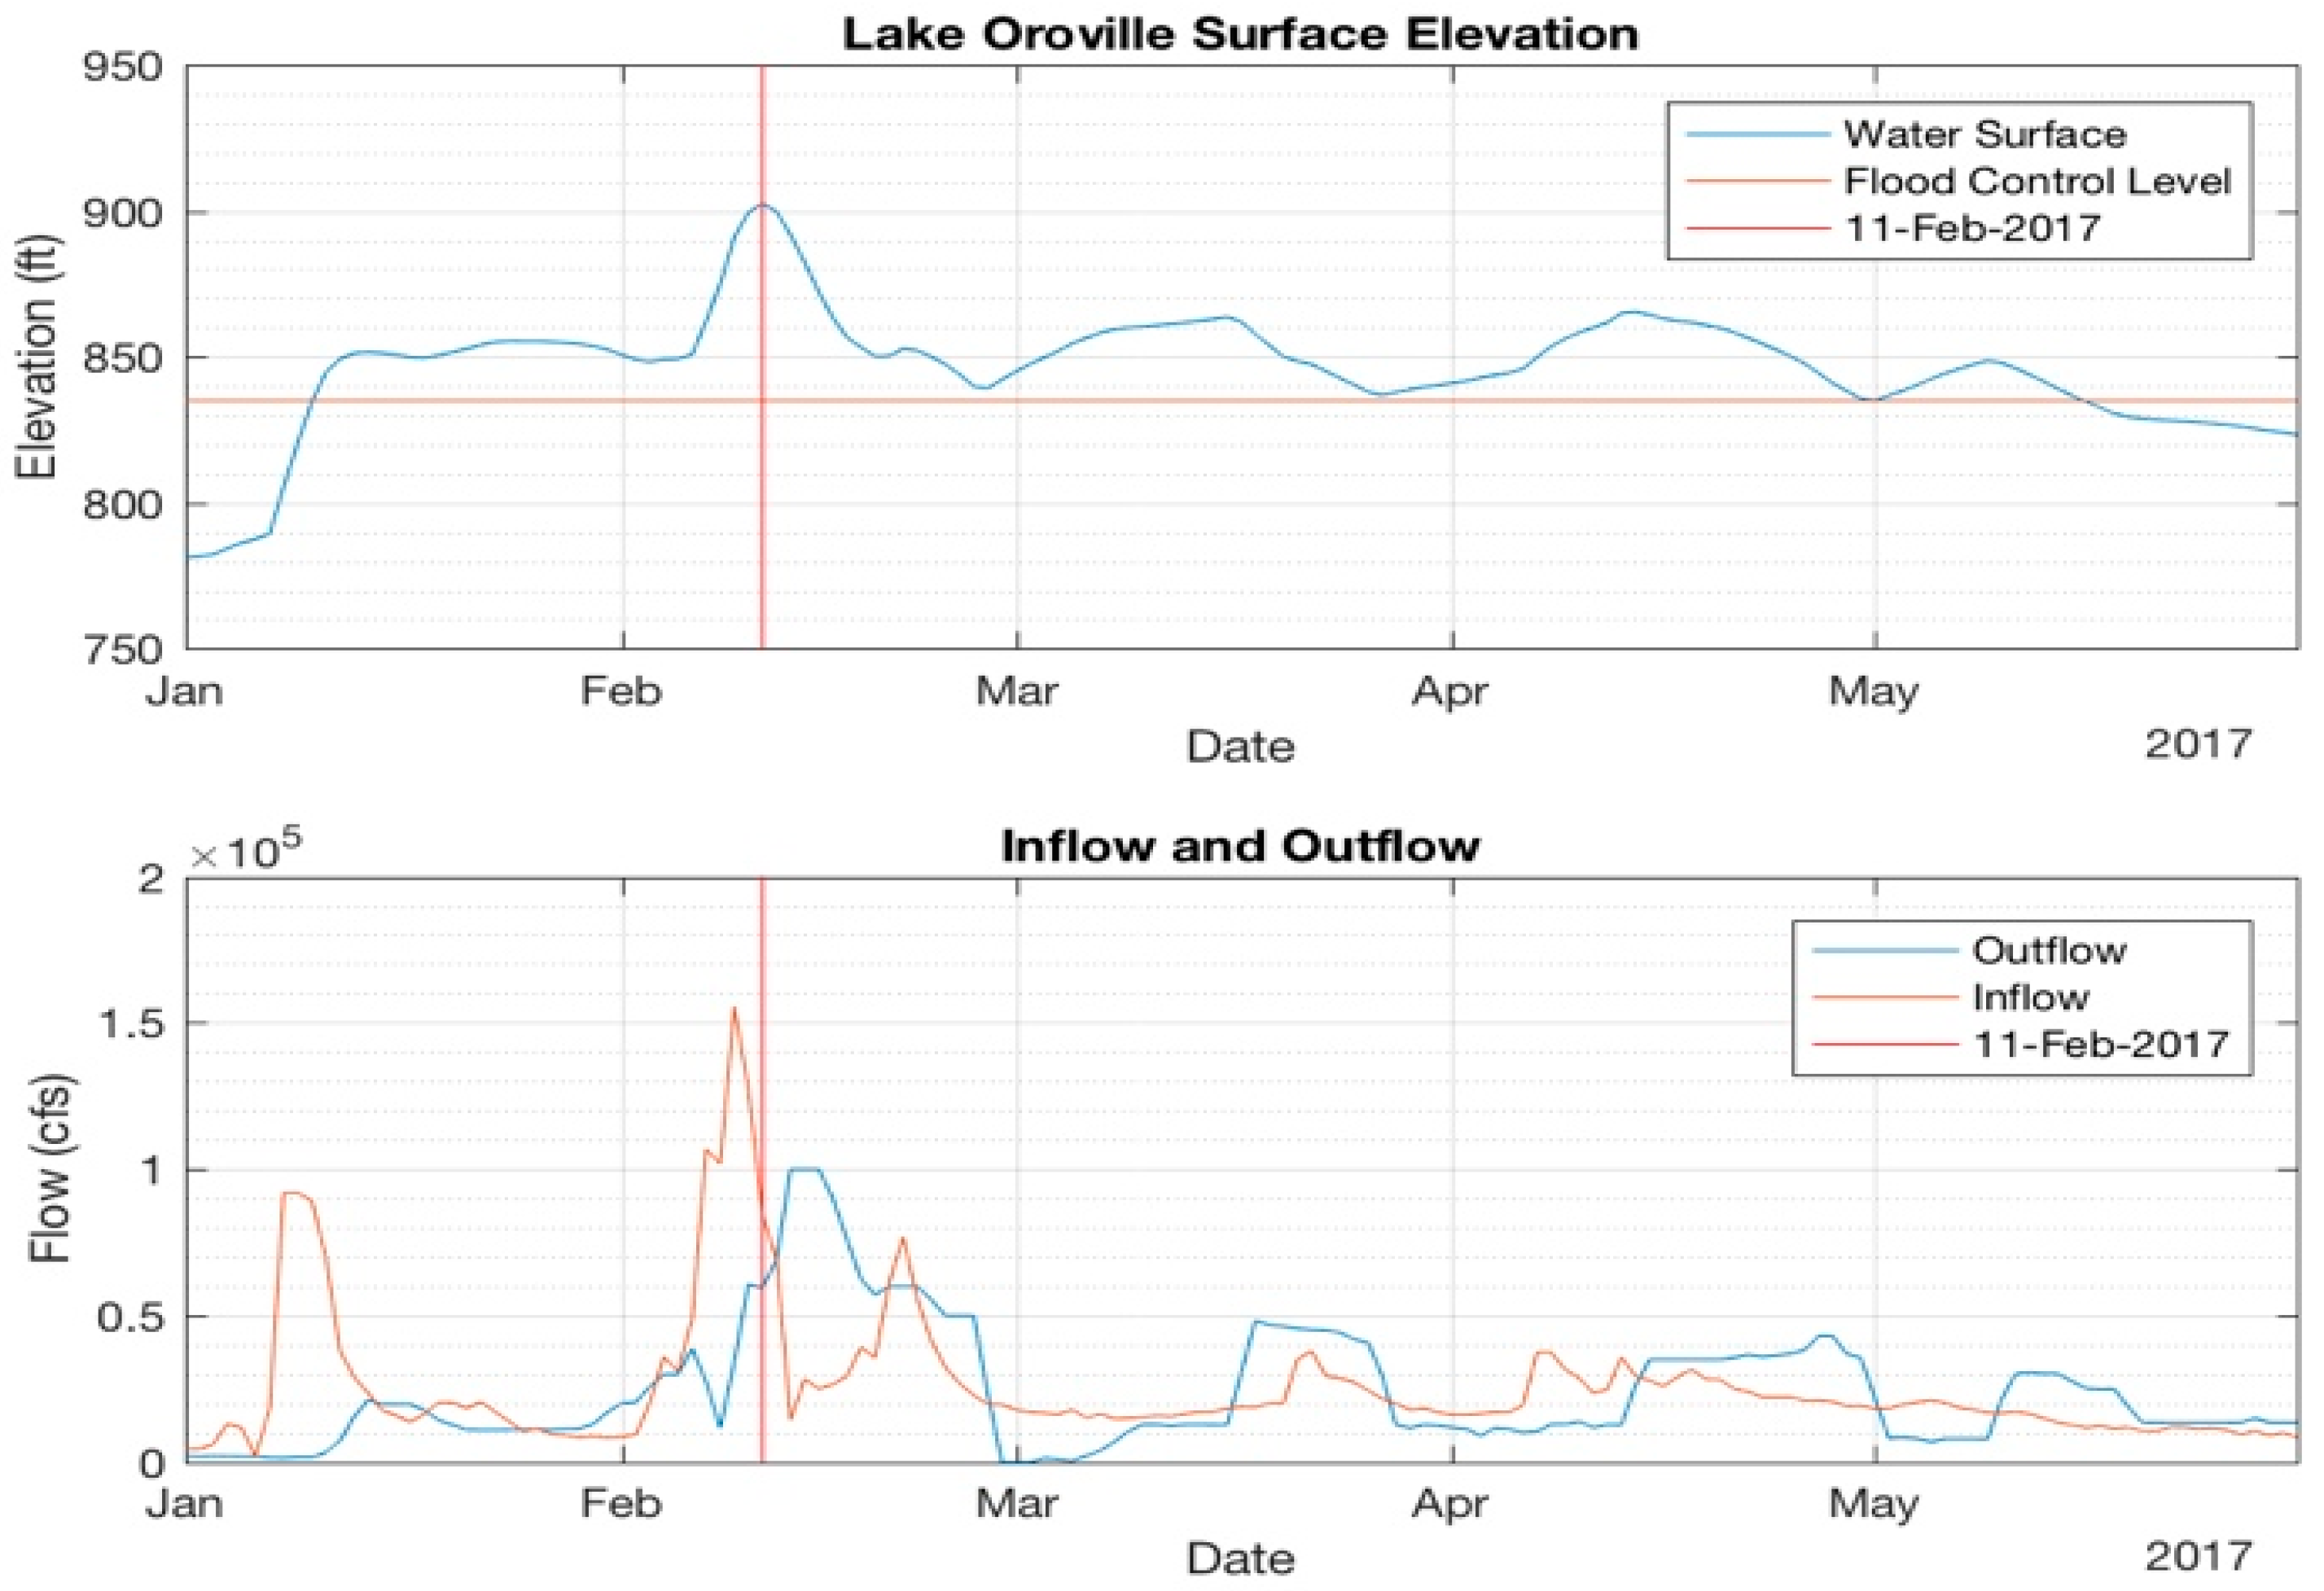
The main spillway is designed to pass 150,000 cfs based on the capacity of the Feather River levee system. According to the SWP, the main spillway and “emergency spillway” are capable of collectively passing the “maximum probable flood release of 624,000 cfs” of which about 470,000 cfs would flow over the ungated spillway during flood conditions expected to occur only once every ten thousand years [35]. During tha 2017 crisis, peak inflow to the reservoir only briefly reached 190,435 cfs [28]. Therefore, the flow down the ungated never approached its design capacity. Additionally, the flow lasted for only a brief period as operators diverted more flow down the damaged main spillway. Nevertheless, the flow quickly chewed away at what was originally thought to be bedrock, and the ungated spillway weir became the focal point of experts hoping to avoid catastrophe [32]. Thus, the spillway underperformed the emergency spillway requirement, which is less than that of an auxiliary spillway. Since the spillway was only ever used in the case of a malfunction, it did technically fall under the expected use of an emergency spillway, which is likely a consequence of operators’ reluctance to allow its activation in the past. The Lake Oroville elevation is shown in Figure 2.
February 12—Mandatory Evacuation
Five days after the initial failure, 188,000 people were ordered to evacuate following evidence that the ungated spillway had been greatly eroded by flows that it had started to crater, which could compromise the integrity of the dam and send a wall of water rushing miles down the Feather River [36]. The peak reservoir level had reached 902.59 feet above sea level and 1.59 feet above the surface of the ungated weir at 3:00 AM that morning [28]. To make matters worse, more storms were on the way. It was at this point that a state of emergency was declared [37].
Just before 2:00 PM in the afternoon, DWR tweeted that the situation had stabilized [38]. At 4:45 PM, DWR tweeted that the dam could fail within an hour [39]. Helicopters and heavy machinery were brought in to the dam area to bag up boulders and plant them in eroded areas [40]. Head-cutting erosion made its way within feet of the emergency spillway weir, according to the DWR. Oroville residents were the first affected under the evacuation order, but later it was expanded to all communities along the Feather River down to Yuba City, which is about 30 miles. Social media and automated phones calls were also used to spread the word. California National Guard deployed 23,000 soldiers to assist with the evacuation and potential water rescue, marking the largest deployment since the Rodney King riots fifteen years earlier [41].
Facing what seemed to be the inevitable collapse of the ungated spillway, operators reopened the main spillway gate. The resulting flows down the damaged main spillway were estimated to exceed 100,000 cfs, but it is likely they were never measured. Officials had been reluctant to release water at such a high flowrate because of the potential for erosion-induced failure, but the remaining spillway essentially withstood the high flows without the type of head cutting that would cause catastrophic breaching of the dam. In any case, lake levels dropped.
Following the immediate crisis, water managers planned to reduce the reservoir level down to the ACE flood control level to temporarily halt flows down the main spillway and allow workers to begin excavating debris from the open channel and the Thermalito Diversion Pool. Officials hoped to get the entirety of debris out in one attempt, which did not end up being the case.
As interest grew around the poor suitability of the ungated spillway, a report surfaced about the 2005 Motion to Intervene [12]. Appropriations for water resource-related spending were approved in 2006 and 2014. However, nothing was done to improve the spillway that was so important and proved its catastrophic potential two decades ago in 1997. The Motion correctly predicted the majority of the consequences encountered during the crisis.
February 14—Downgrade
Butte County Sheriff Kory Honea announced that the mandatory evacuation was downgraded to an advisory due to the extended stable condition of the main and emergency spillways [42]. In addition, Gov. Jerry Brown announced that President Donald Trump signed off on federal aid for the State of California [43].
February 27—Levees
To begin clearing the debris from the Thermalito Diversion Pool, flow down the main spillway was suspended, concurrent with a forecast of reduced rainfall [44]. This was the first time since before the evacuation that officials had a clear view of the damaged spillway. The plan was to have flow shut off for five to seven days to excavate the area. This also allowed time for geologists and inspectors to investigate the conditions of the dam. In preparation for this day, DWR reduced the reservoir level to just below the bottom of the ACE flood control regime. Officials again confronted the possibility for head-cutting. Although they wanted to reduce the level further, they needed to adhere to a requirement to release water over the spillway at high flow only in order to avoid head-cutting. The minimum level was determined based on the lowest level. The main spillway could release water at high flowrates while avoiding scouring near the weir, which was about 835 feet.
Reducing the flow from a high rate to a full stop so quickly placed heightened load on the downstream system, but this was necessary to increase the amount of work time and to mitigate the effects of erosion on the damaged spillway. This preceded the collapse of Feather River levees downstream and caused portions of farm lands to be lost to the river. This is an event known as “sloughing” [45]. The saturated levees collapsed under their own weight since there was not enough time for proper drying, which is a process that can take a week before flow can be fully shut-off.
The collapse was not an unpredictable consequence. Residents and local officials kept an eye on levees for some time once they reached a super-saturated condition [46]. The DWR had even been participating in efforts to shore up some of the levees along the Feather River. A levee near the Sacramento-San Joaquin Delta was intentionally breached earlier in February to allow water to flow into farm lands and mitigate the possibility of an unintentional breach at such a dangerous location [22]. Technically, the levees never exceeded their design flow parameters and engineers initially had confidence in the levee system along the Feather River because of previous improvements [47].
March 3—Hyatt Recovered
The goal of excavation in the Thermalito Diversion Pool was to drain the water backing into the Hyatt Power Plant. That water was isolated from flowing beyond the diversion pool by a fortress of debris that accumulated at the base of the main spillway, which is about midway along the channel. Freeing this water would allow officials to use Hyatt to draw down the reservoir level below the 835-foot limit imposed by the damaged main spillway, albeit at a much slower rate than a spillway. Since it was difficult to predict how long it would take to fully complete the excavation, machinery crews began by cutting a narrow path on the side of the channel farthest from the spillway to allow for water to flow from the Hyatt side to the Feather River side. There was some fear that, when the spillway was reopened, a new procession of debris would be ushered in.
On March 3, in what was considered a turning point in the Oroville situation, two turbine generators were brought online at Hyatt [48]. The effect of this is just barely visible in Figure 2. Less than a tenth of the debris had been cleared out by then. Several days later, a third generator was brought online once about 600,000 cubic yards of debris were removed [49]. With one turbine that was not operational due to scheduled repairs, the best outflow that could be achieved was about 14,000 cfs. Sheriff Honea said he would wait until Hyatt was at full capacity before he decided clearing the evacuation warning.
March 22—All Warnings Lifted
In a press release, Sheriff Honea announced, “I feel satisfied with the progress made in reinforcing the primary spillway, emergency spillway and returning the Hyatt Powerhouse to an operational state as well as the successful efforts by the California Department of Water Resources to lower the lake level enough to buffer for future storms” [50].
4. Discussion
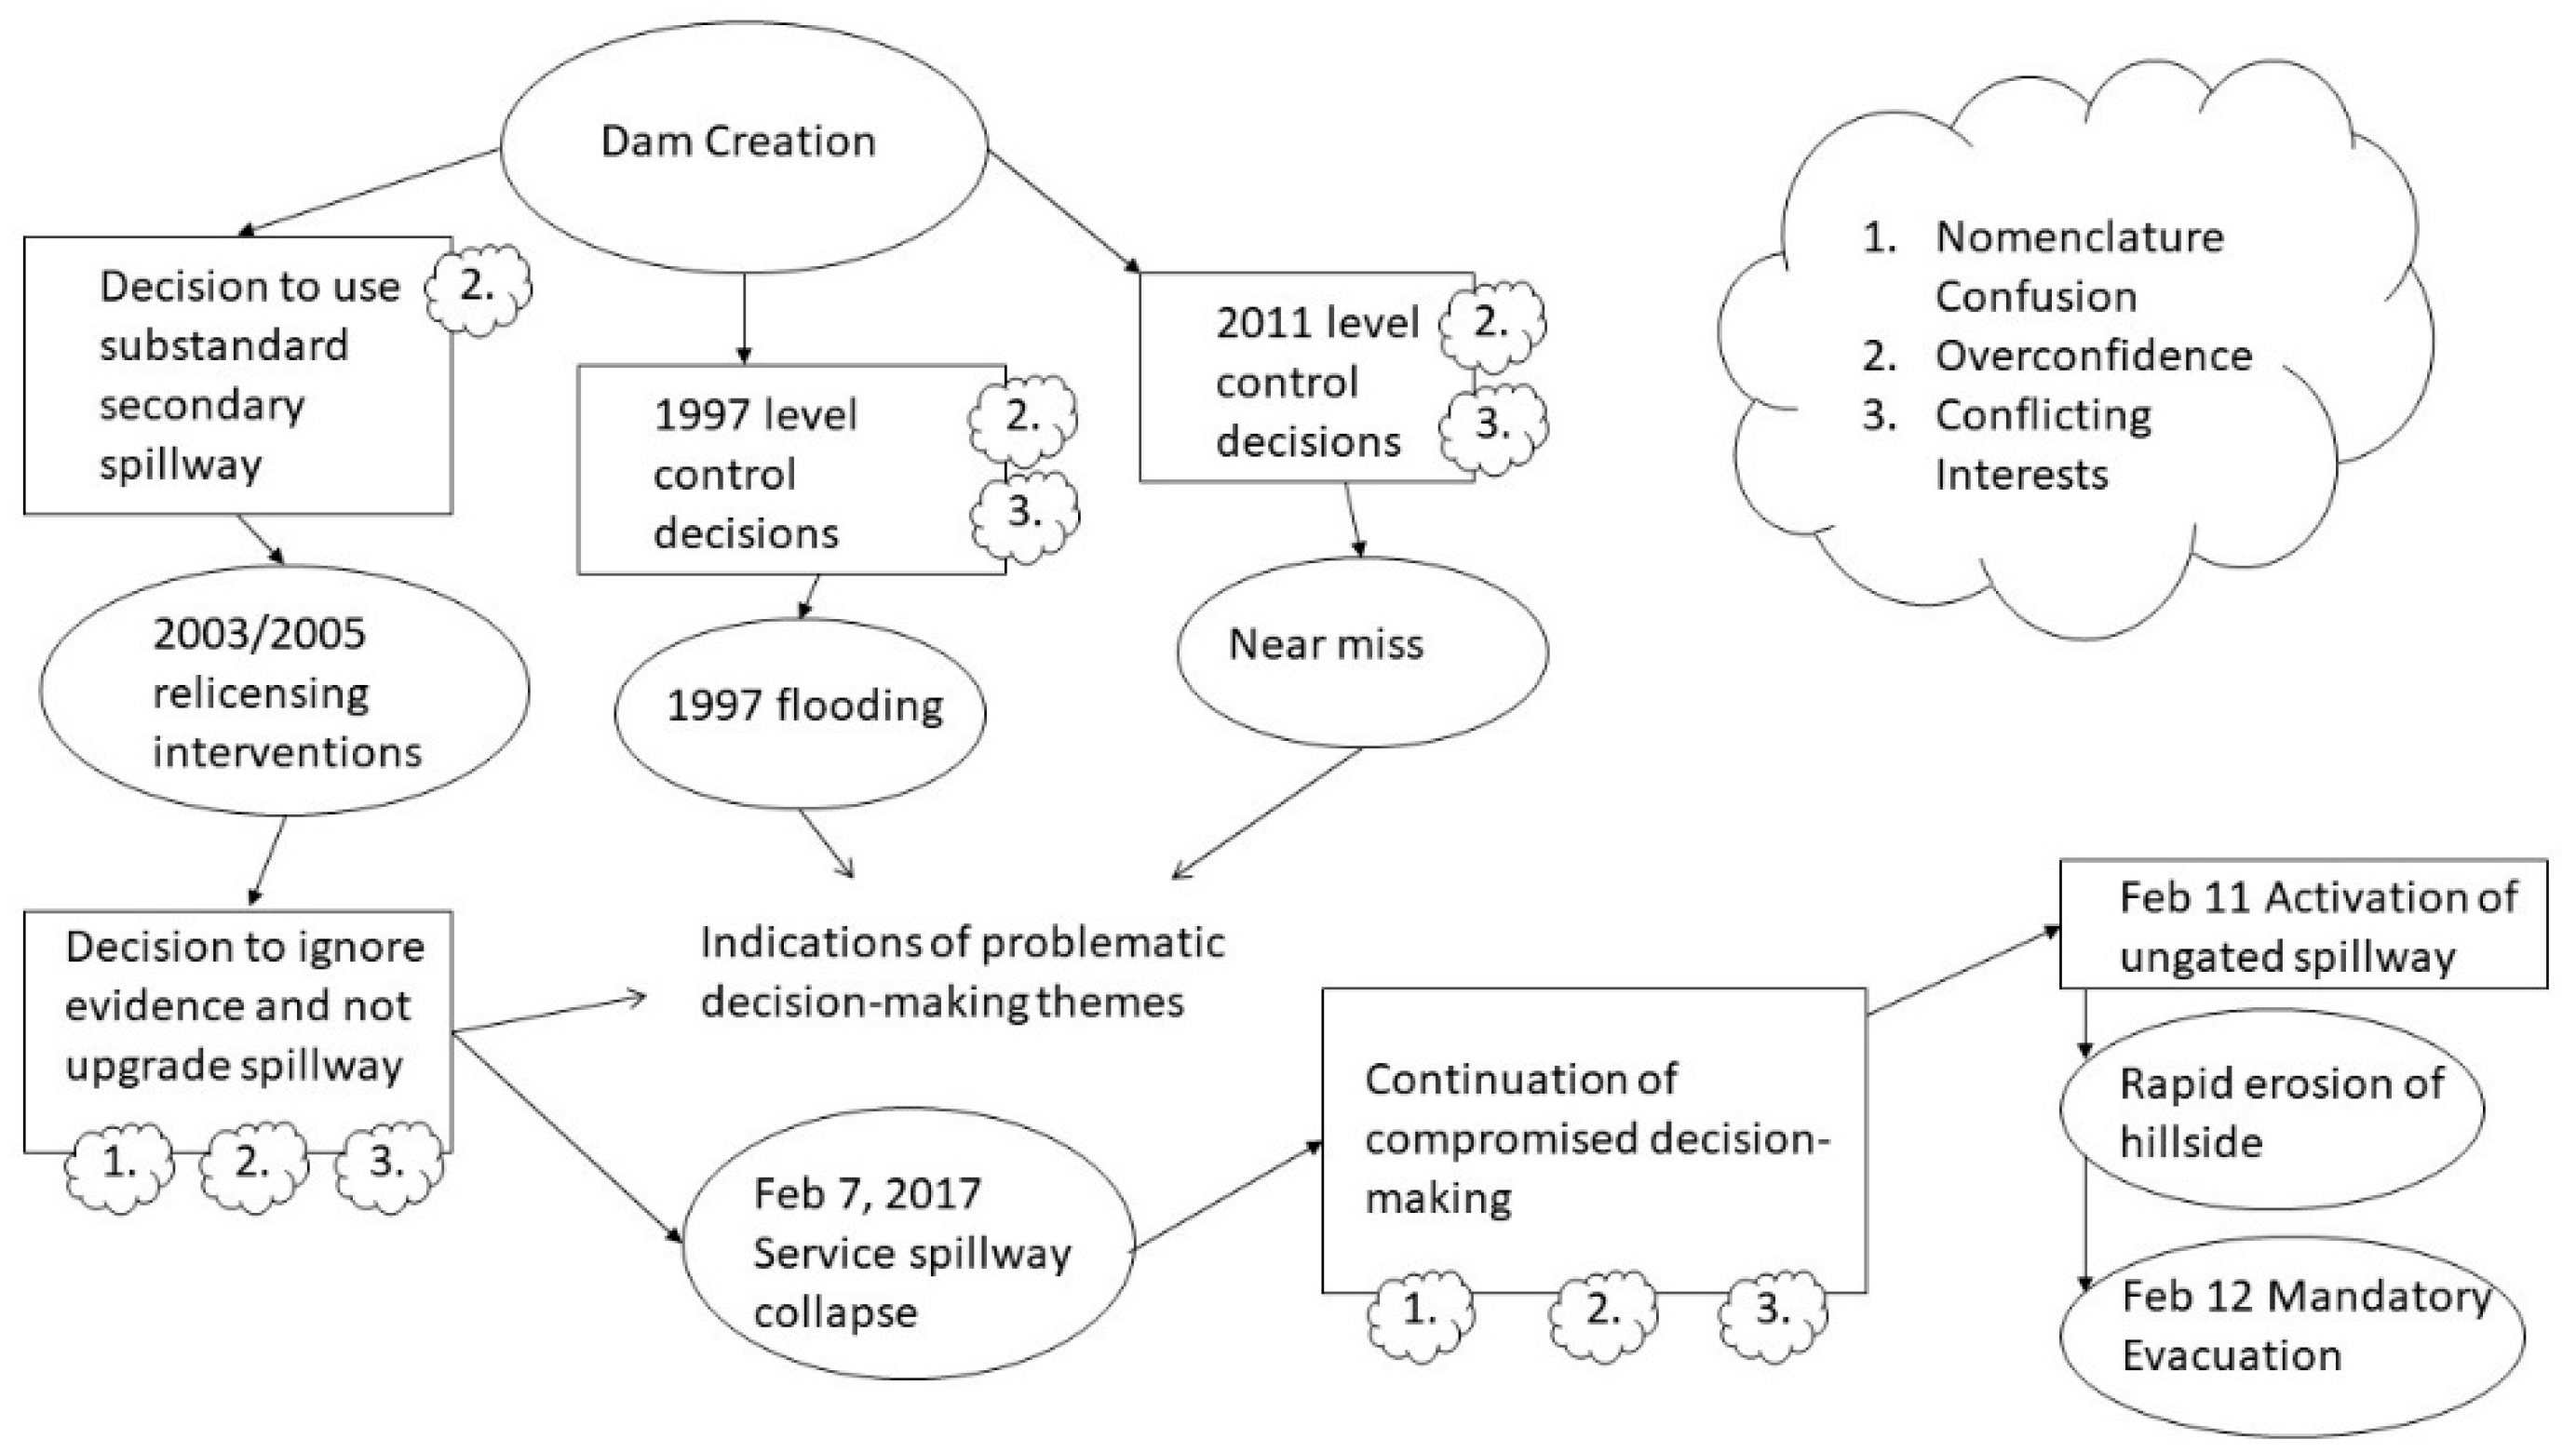
The evidence points to three decision-making themes that existed through the timeline of the dam that impacted its resilience. A partial influence diagram is included in Figure 3 with a greater explanation below.
4.1. Misalignment of Technical Nomenclature and Engineering Requirements
Based on this investigation, the actions by civic and environmental groups in 2003 and 2005 were the first instances in which the Department of Water Resources was confronted with evidence that the classification and operation of the ungated spillway as auxiliary or emergency spillway was ambiguous and consequently confusing. In this case, the distinction between “emergency” and “auxiliary” is significant because FERC specifies that an auxiliary spillway must meet a standard that is more fortified than an emergency spillway. The 2005 Motion to Intervene had evidence proving that the classification of the ungated spillway as “emergency” was contingent on an abandoned dam proposal and, as a consequence, it should have been reclassified as “auxiliary” and brought up to higher standards. Rather than building the spillway to more stringent criteria upon opening the dam and later downgrading it after the planned Marysville Dam came online, the original designers chose to take the risk of having an insufficient spillway until the Marysville Dam was complete. However, after the Marysville Dam plan was abandoned, no action was taken to correct the spillway’s shortcomings. Geological samples were taken to confirm that the earthen layer of the ungated spillway was very shallow above the bedrock, but the forensic investigation found that the samples were not appropriately distributed around the spillway [1]. By the DWR’s logic, the presence of bedrock would have made upgrades to the spillway unnecessarily except that the soil conditions downstream of the ungated spillway were never tested. The forensic investigation did not acknowledge the inconsistency about the nomenclature.
4.2. Overconfidence in Engineering Design
Overconfidence by personnel in system capacity is not as explicit as the misalignment of nomenclature, but examples are still evident and the forensic report found further evidence that this case was widespread [1]. Resisting the advice from the civic and environmental groups about the ungated spillway appears to be a blatant act of overconfidence in the system. Other possible examples are the flooding in 1997 and the near-activation of the ungated spillway in 2011. The forensic investigation found extensive evidence to corroborate this theme. Interviews with current workers suggested that there was a preeminent culture of overconfidence in decision-making based upon faulty perceptions of the past. The operators assumed that the system was crafted by the “best of the best,” but the designers and construction agencies were sometimes only minimally qualified [1].
4.3. Conflicting Stakeholder Pressures
Conflicting stakeholder pressures are inherent in the dam and reservoir system. The system was designed to be operated with shifting priorities. A specific flood control level must be reached before flood control becomes a consideration and because water is also a critical necessity to the California aqueduct system. As such, operators have granted disproportionate priority to its retention. The priority is disproportionate because the placement of the reservoir in this location creates new risks. Because of the relatively incident-free history of the dam and reservoir system, the operators had insufficient appreciation for the importance of safety in all operations. Possible examples of this include the same claims from 1997 and 2011. The most compelling evidence of this is presented by the forensic investigation. The final decisions resulting in the activation of the ungated spillway and the subsequent evacuation were due to these exact conflicting pressures. The decision sided with the dam officials rather than the engineers, geologists, and civic groups. It was made in favor of maintaining the full operability of the Hyatt Powerhouse [1].
5. Conclusions
Traditional risk analyses emphasize that the most important failure during Oroville was the collapse of the main spillway. While this event was the critical point preceding a chain of consequential decisions, it provides little insight about why the loss of the spillway occurred in the first place. The more important “failures” were decisions that led to activation of an inadequate ungated spillway and evacuation of 188,000 people. Using a combination of historical records, social media posts, news articles, and scholarly literature, we create the timeline of decisions that reveal these failures. The combination of data sources and timeline revealed factors that affected the eventual use of the ungated spillway were inextricably tied to three decision-making themes.
The first theme was the long-term confusion or intentional ignorance of the proper technical nomenclature for the ungated spillway. This started at the original design and construction of the Oroville Dam, which could only use an emergency spillway with a never-to-be-built reservoir added to the system. Nevertheless, the dam was built with a backup spillway that only met the lowest possible criteria. This discrepancy was never addressed even when evidence was produced in 2003 and 2005 even though both the Federal Energy Regulatory Commission guidelines and the California State Water Plan guidelines implied that a spillway meeting stricter requirements was necessary.
Next was the overconfidence. The long-present overconfidence of the operators could have contributed to the negligence regarding the spillway nomenclature. The first genuine case of overconfidence in decision-making that was discovered was the DWR officials’ refusal to properly address the evidence provided by environmental groups disputing the readiness of the ungated spillway. This happened in both 2003 and 2005 since the same evidence was resubmitted with more extensive research the second time around. Despite the operators’ refusal to upgrade the spillway, in the moment of consequence, the ungated spillway did not even meet the low standards for which it was built. Instead, it quickly eroded and jeopardized the entire dam’s integrity.
Lastly, the conflicting interests of water managers appear to have caused the operators to misunderstand the overarching importance of safety in the decision-making process. The 1996 levee failure, the 2011 extremely high-water level, and the indecision that culminated in the use of the ungated spillway all show signs that operators may not have been appropriately qualified to make critical decisions regarding when to stop storing water. These decisions may have been further complicated by the likely case that the operators did know that the ungated spillway was not suitable for carrying any amount of water.
The resilience of the system eroded long before the ungated spillway failed and finding ways to inform decision-makers prior to the crisis is needed for more resilient infrastructure. Regarding sensing, decision-makers during relicensing failed to recognize the significance of both the previous levee failures, the information coming from public groups, and the near-miss that brought reservoir elevations to within 11 inches of overtopping the ungated spillway. Had decision-makers learned from these experiences, they might have anticipated scenarios in which extraordinary precipitation in combination with component failures (e.g., the main spillway, the diversion pool, and the levees) would overwhelm existing outflow structures. Nevertheless, it was the last minute adapting of operating procedures to the dynamic conditions that avoided the dam collapse (by reopening the damaged main spillway).
Author Contributions
L.X.H. conducted the review of existing literature documents, including the cross-checking of multiple sources and draft of the manuscript. D.A.E. conducted the analysis resulting in the principle conclusions. T.P.S. finalized the manuscript and responded to reviewer comments.
Funding
This research was funded by the Office of Naval Research NEPTUNE grant number GR28813, Neptune: Resilience Processes.
Acknowledgments
The authors extend gratitude for the involvement and input of Dr. Margaret Hinrichs.
Conflicts of Interest
The authors declare no conflict of interest. The funders had no role in the design of the study, in the collection, analyses, or interpretation of data, in the writing of the manuscript, or in the decision to publish the results.
References
- France, J.; Alvi, I.; Dickinson, P.; Falvey, H.; Rigbey, S.; Trojanowski, J. Independent Forensic Team Report Oroville Dam Spillway Incident. 2018. Available online: https://damsafety.org/sites/default/files/files/Independent%20Forensic%20Team%20Report%20Final%2001-05-18.pdf (accessed on 5 November 2018).
- Kaplan, S.; Garrick, B.J. On the quantitative definition of risk. Risk Anal. 1981, 1, 11–27. [Google Scholar] [CrossRef]
- Bea, R.G. Root Causes Analyses of the Oroville Dam Gated Spillway Failures and Other Developments; Cal Alumni Association: Berkeley, CA, USA, 2017. [Google Scholar]
- Hubbard, D. The Failure of Risk Management: Why It’s Broken and How to Fix It; John Wiley & Sons: Hoboken, NJ, USA, 2009. [Google Scholar]
- Wears, R.L.; Kendall, W. Fundamental on situational surprise: A case studey with implications for resilience. In Resilience Engineering in Practice; Ashgate Publishing, Ltd.: Farnham, UK, 2016; Volume 2. [Google Scholar]
- Park, J.; Seager, T.P.; Rao, P.S.C. Lessons in risk- versus resilience-based design and management. Integr. Environ. Assess. Manag. 2011, 7, 396–399. [Google Scholar] [CrossRef] [PubMed]
- Park, J.; Seager, T.P.; Rao, P.S.C.; Convertino, M.; Linkov, I. Integrating risk and resilience approaches to catastrophe management in engineering systems. Risk Anal. 2013, 33, 356–367. [Google Scholar] [CrossRef] [PubMed]
- Hollnagel, E.; Yushi, F. The Fukushima disaster-systemic failures as the lack of resilice. Nucl. Eng. Technol. 2013, 45, 13–20. [Google Scholar] [CrossRef]
- History of Water Development and the State Water Project. Available online: https://www.wplives.org/news_items/2017_Western_Pacific_Historical_Convention/2017_convention_materials/HISTORY_OF_WATER_DEVELOPMENT_AND_THE_STATE_WATER_PROJECT.pdf (accessed on 5 November 2018).
- Update, 7:15 p.m. Thursday, Feb. 9. KQED News. Available online: https://ww2.kqed.org/news/2017/03/23/engineers-assess-spillway-problem-at-oroville-dam/ (accessed on 1 January 2017).
- Serafinelli, E.; Reilly, P.; Stevenson, R.; Petersen, L.; Fallou, L. A Communication Strategy to Build Critical Infrastructure Resilience; Deliverable Number: 653390. 2017. Available online: http://media.improverproject.eu/2017/06/IMPROVER_D4.2_report.pdf (accessed on 5 November 2018).
- Rogers, P. Oroville Dam: Feds and state officials ignored warnings 12 years ago. The Mercury News, 12 February 2017. [Google Scholar]
- Public Law 85-500; Government Publishing Office: Washington, DC, USA, 1958; p. 297. Available online: https://www.gpo.gov/fdsys/pkg/STATUTE-72/pdf/STATUTE-72-Pg297.pdf (accessed on 5 November 2018).
- Bay Area Television Archive. The Oroville Dam Opens (1968). Available online: https://diva.sfsu.edu/collections/sfbatv/bundles/231000 (accessed on 5 November 2018).
- NOAA. California Nevada River Forecast Center. Heavy Precipitation Event. 1997. Available online: http://www.cnrfc.noaa.gov/storm_summaries/jan1997storms.php (accessed on 5 November 2018).
- Warren, J.; Curtius, M.; Simon, S. Thousands Flee as Feather River Breaches Levees. Los Angeles Times, 3 January 1997. [Google Scholar]
- Final Report of the Flood Emergency Action Team. 1997. Available online: http://www.water.ca.gov/floodsafe/docs/Governor%27s-Flood-Emergency-Action-Team-FEAT-May10-1997-OCR.pdf (accessed on 5 November 2018).
- New Year’s flood devastated Northern California. 1997. Available online: http://www.kcra.com/article/1997-new-years-flood-devastated-northern-california/8556065 (accessed on 5 November 2018).
- Oroville Relicensing Documents. Available online: http://www.water.ca.gov/orovillerelicensing/docs/FEIR_080722/AppendixA/Extracted_Comments/N0007_SierraClub_FriendsRiver_SYRCL_Pages_3-53.pdf (accessed on 5 November 2018).
- Storage Facilities. California State Water Project, Nov-1974. Available online: https://archive.org/stream/zh9californiastatew2003calirich#page/92/mode/2up/search/emergency+spillway (accessed on 5 November 2018).
- Selecting and Accomodating Inflow Design Floods for Dams; FEMA: Washington, DC, USA, 2004. Available online: https://www.ferc.gov/industries/hydropower/safety/guidelines/eng-guide/chap2.pdf (accessed on 5 November 2018).
- Sabalow, R.; Garrison, E.; Branan, B. Oroville Dam isn’t the only piece of California flood infrastructure under strain. The Sacramento Bee, 14 February 2017. [Google Scholar]
- Milestone Reached in Relicensing DWR’s Oroville Facilities. 2005. Available online: http://www.water.ca.gov/news/newsreleases/2005/012605relicense.pdf (accessed on 5 November 2018).
- Motion to Intervene. Friends of the River, Sierra Club, South Yuba Citizens League. 2005. Available online: http://www.friendsoftheriver.org/wp-content/uploads/2016/01/Oroville-Dam-joint-intervention.pdf (accessed on 5 November 2018).
- California Data Exchange Center. Oroville Dam (ORO). Available online: http://cdec.water.ca.gov/jspplot/jspPlotServlet.jsp?sensor_no=1148&end=12%2F31%2F2011+10%3A29&geom=huge&interval=365&cookies=cdec01 (accessed on 1 January 2017).
- Hacking, H. Water sold last year is sitting in Lake Oroville. Chico Enterprise-Record, 9 April 2013. [Google Scholar]
- Is the drought over? United States Geological Survey. 2017. Available online: https://ca.water.usgs.gov/data/drought/ (accessed on 5 November 2018).
- Lake Oroville Spillway Incident: Timeline of Major Events February 4–25. 2017. Available online: http://www.water.ca.gov/oroville-spillway/pdf/2017/Lake Oroville events timeline.pdf (accessed on 5 November 2018).
- Leese, G. Oroville Dam Spillway Damaged. 2017. Available online: https://youtu.be/YW_iWBjgC-U (accessed on 5 November 2018).
- D.W.R. Resumes Water Release over Damaged Spillway. 8 February 2017. Available online: http://www.actionnewsnow.com/story/34462650/dwr-resumes-water-release-over-damaged-spillway (accessed on 5 November 2018).
- Butte Sheriff. Press Release Regarding Oroville Spillway. Twitter. 2017. Available online: https://twitter.com/ButteSheriff/status/829929348761153542 (accessed on 5 November 2018).
- Boxall, B. Government severely misjudged strength of Oroville emergency spillway, sparking a crisis. Los Angeles Times, 9 February 2017. [Google Scholar]
- Updated DWR Press Release. Twitter. 2017. Available online: https://twitter.com/ButteSheriff/status/830472894442409984 (accessed on 5 November 2018).
- Flow over Auxiliary Spillway between 6,000 and 12,000 cfs. No danger to dam or people. Twitter. 2017. Available online: https://twitter.com/CA_DWR/status/830480160595992577 (accessed on 5 November 2018).
- California State Water Plan. 1957. Available online: https://water.ca.gov/LegacyFiles/waterplan/docs/previous/californiawaterp03cali.pdf (accessed on 5 November 2018).
- Kurhi, E. Oroville Dam: Crisis eases but more than 180,000 evacuated. The Mercury News, 12 February 2017. [Google Scholar]
- CA.gov. Governor Brown Issues Emergency Order To Help Response To Situation At Oroville Dam. Available online: https://www.gov.ca.gov/news.php?id=19683 (accessed on 1 January 2017).
- At 11 a.m., auxiliary flow was down to 8,000 cfs from peak of 12,600 cfs at 1 a.m. Situation has stabilized. Twitter. Available online: https://twitter.com/CA_DWR/status/830898986403762176 (accessed on 5 November 2018).
- CA—DWR, EMERGENCY EVACUATION. Twitter. 2017. Available online: https://twitter.com/ca_dwr/status/830940227908677633?lang=en (accessed on 5 November 2018).
- Kasler, D.; Furillo, A.; Stanton, S. Threat of Spillway Failure at Oroville Dam Prompts Evacuation of 188,000 Across Northern California. Perparedness & Recovery, 13 February 2017. [Google Scholar]
- Stanton, S.; Bizjak, T.; Kasler, D. Breaking: No end in sight for evacuations, situation remains ‘dynamic’. The Sacramento Bee, 13 February 2017. [Google Scholar]
- Hayden, M.E.; Jacobo, J. Evacuation orders lifted in Oroville Dam area. ABC7News, 14 February 2017. [Google Scholar]
- Caen, M. Trump Approves Emergency Aid Request for Oroville Dam. CBS SFBayArea. 2017. Available online: https://sanfrancisco.cbslocal.com/2017/02/14/president-trump-monitoring-oroville-dam-evacuations/ (accessed on 5 November 2018).
- Serna, J. Water shut from Oroville Dam’s damaged spillway in race against Mother Nature. Los Angeles Times, 27 February 2017. [Google Scholar]
- Alexander, K.; Duggan, T. Riverbanks collapse after Oroville Dam spillway shut off. San Francisco Chronicle, 4 March 2017. [Google Scholar]
- Luery, M. Super-saturated levees under stress due to increased river flows. KCRA, 22 February 2017. [Google Scholar]
- Hacking, H. Rebuilt Feather River levee can handle far more water. Chico Enterprise-Record, 9 February 2017. Available online: http://www.chicoer.com/article/NA/20170209/NEWS/170209677(accessed on 5 November 2018).
- Oroville Dam power plant back online. The Mercury News, 4 March 2017.
- Torregano, T. DWR works toward full reboot of Hyatt Power Plant. KRCR, 8 March 2017. [Google Scholar]
- Department of Water Resources. Butte County Sheriff Lifts All Evacuation Advisories & Warnings Previously Issued for the Oroville Dam Spillway Incident. 2017. Available online: https://water.ca.gov/-/media/DWR-Website/Web-Pages/News-Releases/Files/2017-News-Releases/032217-News-Release_newsrelease_unifiedcommand_evacwarninglifted.pdf (accessed on 5 November 2018).
Figure 1.
Lake Oroville Reservoir is enclosed to the south east by a 770-foot-tall earth-fill embankment dam, which is the tallest dam in the United States. All mechanisms for water removal drain to a diversion pool that has a lower elevation. The Hyatt Powerhouse and RVOS discharge into the upstream end of the common diversion pool, followed by the main spillway, and the approximate path of the ungated spillway, which drains furthest downstream. Water flows from the diversion pool through other structures regulating the flow of the Feather River.

Figure 2.
Oroville sensor data for surface elevation, inflow, and outflow. The flood control level is the level above which USACE flood control guidelines take over. The ungated spillway weir is at approximately 901 feet above sea level. Heavy inflow and a failure to maintain outflow caused the level to briefly rise beyond this height on 11 February.

Figure 3.
A partial pathway of decisions from dam creation to evacuation. Events (circles), decisions (rectangles), and decision-influencing themes (clouds). The influencing themes affected decisions throughout the entire history of the dam and established a culture of compromised choices. Multiple indications of faulty decision-making existed before the spillway collapse.


Table 1.
Description of each of the Oroville Reservoir’s four water removal mechanisms.
| Mechanism | Operation | Status | Max Flowrate |
|---|---|---|---|
| Main (Service) Spillway | Primary water removal method at high reservoir levels when high flowrate is required | Critically damaged but operational | 150,000 cfs (under a normal condition) |
| Ungated Spillway | Earthen spillway, which is “activated” when the reservoir level exceeds weir height | Never tested; unknown | 400,000 to 600,000 cfs (technical estimates) |
| Hyatt Powerhouse | Hydroelectric power plant. Primary water removal method for controlled flow | 5 of 6 turbines operational | 14,000 cfs (considering the non-operating turbine) |
| River Valve Outlet System (RVOS) | Mechanism only available for removing water at low water levels | Out of Operation | 2400 cfs |
© 2018 by the authors. Licensee MDPI, Basel, Switzerland. This article is an open access article distributed under the terms and conditions of the Creative Commons Attribution (CC BY) license (http://creativecommons.org/licenses/by/4.0/).
Share and Cite
MDPI and ACS Style
Hollins, L.X.; Eisenberg, D.A.; Seager, T.P. Risk and Resilience at the Oroville Dam. Infrastructures 2018, 3, 49. https://doi.org/10.3390/infrastructures3040049
AMA Style
Hollins LX, Eisenberg DA, Seager TP. Risk and Resilience at the Oroville Dam. Infrastructures. 2018; 3(4):49. https://doi.org/10.3390/infrastructures3040049
Chicago/Turabian StyleHollins, Lucien X., Daniel A. Eisenberg, and Thomas P. Seager. 2018. "Risk and Resilience at the Oroville Dam" Infrastructures 3, no. 4: 49. https://doi.org/10.3390/infrastructures3040049