
User Perception on Key Performance Indicators in an In-Service Office Building
by
 , and
, and
Teresa Pestana
1, 
Inês Flores-Colen
1,2,* ,
,
Manuel Duarte Pinheiro
1,2 and
and
Seyed Masoud Sajjadian
3 1
Department of Civil Engineering, Architecture and Georesources, Instituto Superior Técnico, Universidade de Lisboa, Av. Rovisco Pais, 1049-001 Lisbon, Portugal
2
CERIS, Instituto Superior Técnico, Universidade de Lisboa, Av. Rovisco Pais, 1049-001 Lisbon, Portugal
3
School of Engineering and the Built Environment, Edinburgh Napier University, Edinburgh EH10 5DT, UK
*
Author to whom correspondence should be addressed.
Infrastructures 2021, 6(3), 45; https://doi.org/10.3390/infrastructures6030045
Submission received: 24 January 2021
/
Revised: 22 February 2021
/
Accepted: 24 February 2021
/
Published: 15 March 2021
Abstract
:A holistic understanding of the correlations between supply and demand in buildings forms the basis for their performance assessment. This paper aims to reinterpret a set of Key Performance Indicators (KPIs) that influence users’ satisfaction from different perspectives. Fieldwork was carried out in an office building following a detailed review on KPIs by conducting user surveys. This study highlights the need to organize specific indicators to focus on the usability of workplaces and, where and when required, through an iterative process, understand the user perception of performance indicators in usage conditions. This methodology is applicable for organizations to understand the main existing in-service problems, and could improve the building’s performance over time. Survey results showed that hygiene was the most recognizable influence on users’ satisfaction and indoor air quality was the less well-known in the assessment results. User perception results can be compared to other office buildings results to benchmark good practices and should also be investigated for the post-COVID-19 period.
1. Introduction
Because there is no universally agreed definition, building performance has different meanings in different disciplines [1]. In 1760, the first document linked to the performance of a building was compiled to ensure structural safety [2], and the first instance of this methodology was developed in the twentieth century [3]. Thorough understanding of building performance is key to providing user comfort and delivering satisfaction. Thus, several organizations investigated the issue and developed fundamental platforms. Among these are the International Council for Research and Innovation in Building and Construction (founded in 1970), the American Society of Testing Material (ASTM) [4], and the VTT Technical Research of Finland (VTT) [5].
In 1984, the standard ISO 6241 [6] set out requirements for buildings that were directly related to its use. This standard gradually became a support tool for the operational efficiency of buildings, particularly in countries where performance is considered a fundamental aspect. The concern for a better sustainability standard led the International Council for Innovation in Building and Construction (CIB), in 1995, to develop a project on this topic, discussing the concept of sustainable development in the construction industry, and exposing future benefits involved through a set of strategies and recommendations for good practice in the sector [7].
The concept of performance can be defined in various ways, depending on the approach of different views, underlying the intended purposes. Neely [8] defined the concept as a measurement of a quantitative value or an expression; the result (output) of an action (created quantifiable content); the ability to achieve or promote the creation of a new result (output), with the aim to satisfy customers/users; a comparison between results obtained with a reference standard; a result that surpasses expectations; and a process that involves an action associated with the same results. According to PeBBu (Performance Based Building Thematic Network) [9], the concept of performance is basically composed of two questions:
- The use of demand and supply languages: (i) the necessary requirements for good performance (demand) and (ii) the ability to satisfy these requirements (supply);
- The need to verify and validate results, taking into account the desired performance.
Professionals have adopted terms of demand and supply from markets that refer to the requirements requested by customers and the responsiveness to their requirements [10,11,12,13].
Several other organizations conducted studies related to the performance and sustainability of buildings, including the Green Building Challenge, International (GBC); the International Initiative for Sustainably Built Environment (iiSBE); the Sustainable Building Alliance (SB Alliance); the World Green Building Council (WGBC); and the LiderA Portugal [14,15,16,17,18]. The scope of their activities added more dimensions and context to the topic and included different building typologies in their assessment.
The initial step to match supply and demand is performance evaluation. This evaluation process is essentially a systematic research process, not only for human demands and supplies but also for contents, referring to the performance and management of buildings [19]. The results obtained regarding performance can explain the responsiveness of buildings to demands and requirements imposed. In the definition of a requirement and its criteria, it is necessary to establish not only what is acceptable, but also what it is essential to understand the desired level of performance, and the elements that support data. Performance evaluation can contribute in a highly effective and relevant manner to the different phases of a building [20].
The standard EN 15,341 [21] defines an indicator as a measured characteristic (or a set of characteristics) and sets out Maintenance Key Performance Indicators (KPIs), providing guidelines to assess and monitor the building performance targets [22,23]. They also provide an insight into the existing demands and supplies. However, the functionality and usability of workplaces are also required to be included in the assessment of post-occupancy scenarios [24,25], to improve building design, organization efficiency and business productivity, and to benchmark the built environment in in-service buildings conditions [20,26]. Understanding the needs of users can help facility managers to optimize in-running costs, address in-service complaints, and rethink new ways of focusing on user satisfaction [27]. Moreover, user perception can help facility managers in decision-making for interventions in buildings, and in the application of performance indicators established from standards and studied by other authors [22,24,25,26,27]. This combination is helpful for benchmarking performance indicators [28], taking into account good practices and new trends in in-service buildings (digital transformation, advanced technology for monitoring, zero carbon emissions, and circular economy).
The aim of this paper is to discuss the potential for a set of indicators to measure the performance of buildings in use, associated with technical, environmental, and economic aspects. The application of those indicators allows the current status of a building to be checked, including aspects in need of further adjustments. In this study, the indicators applied in the fieldwork are only those that focus on the users’ satisfaction assessment.
2. Methodology
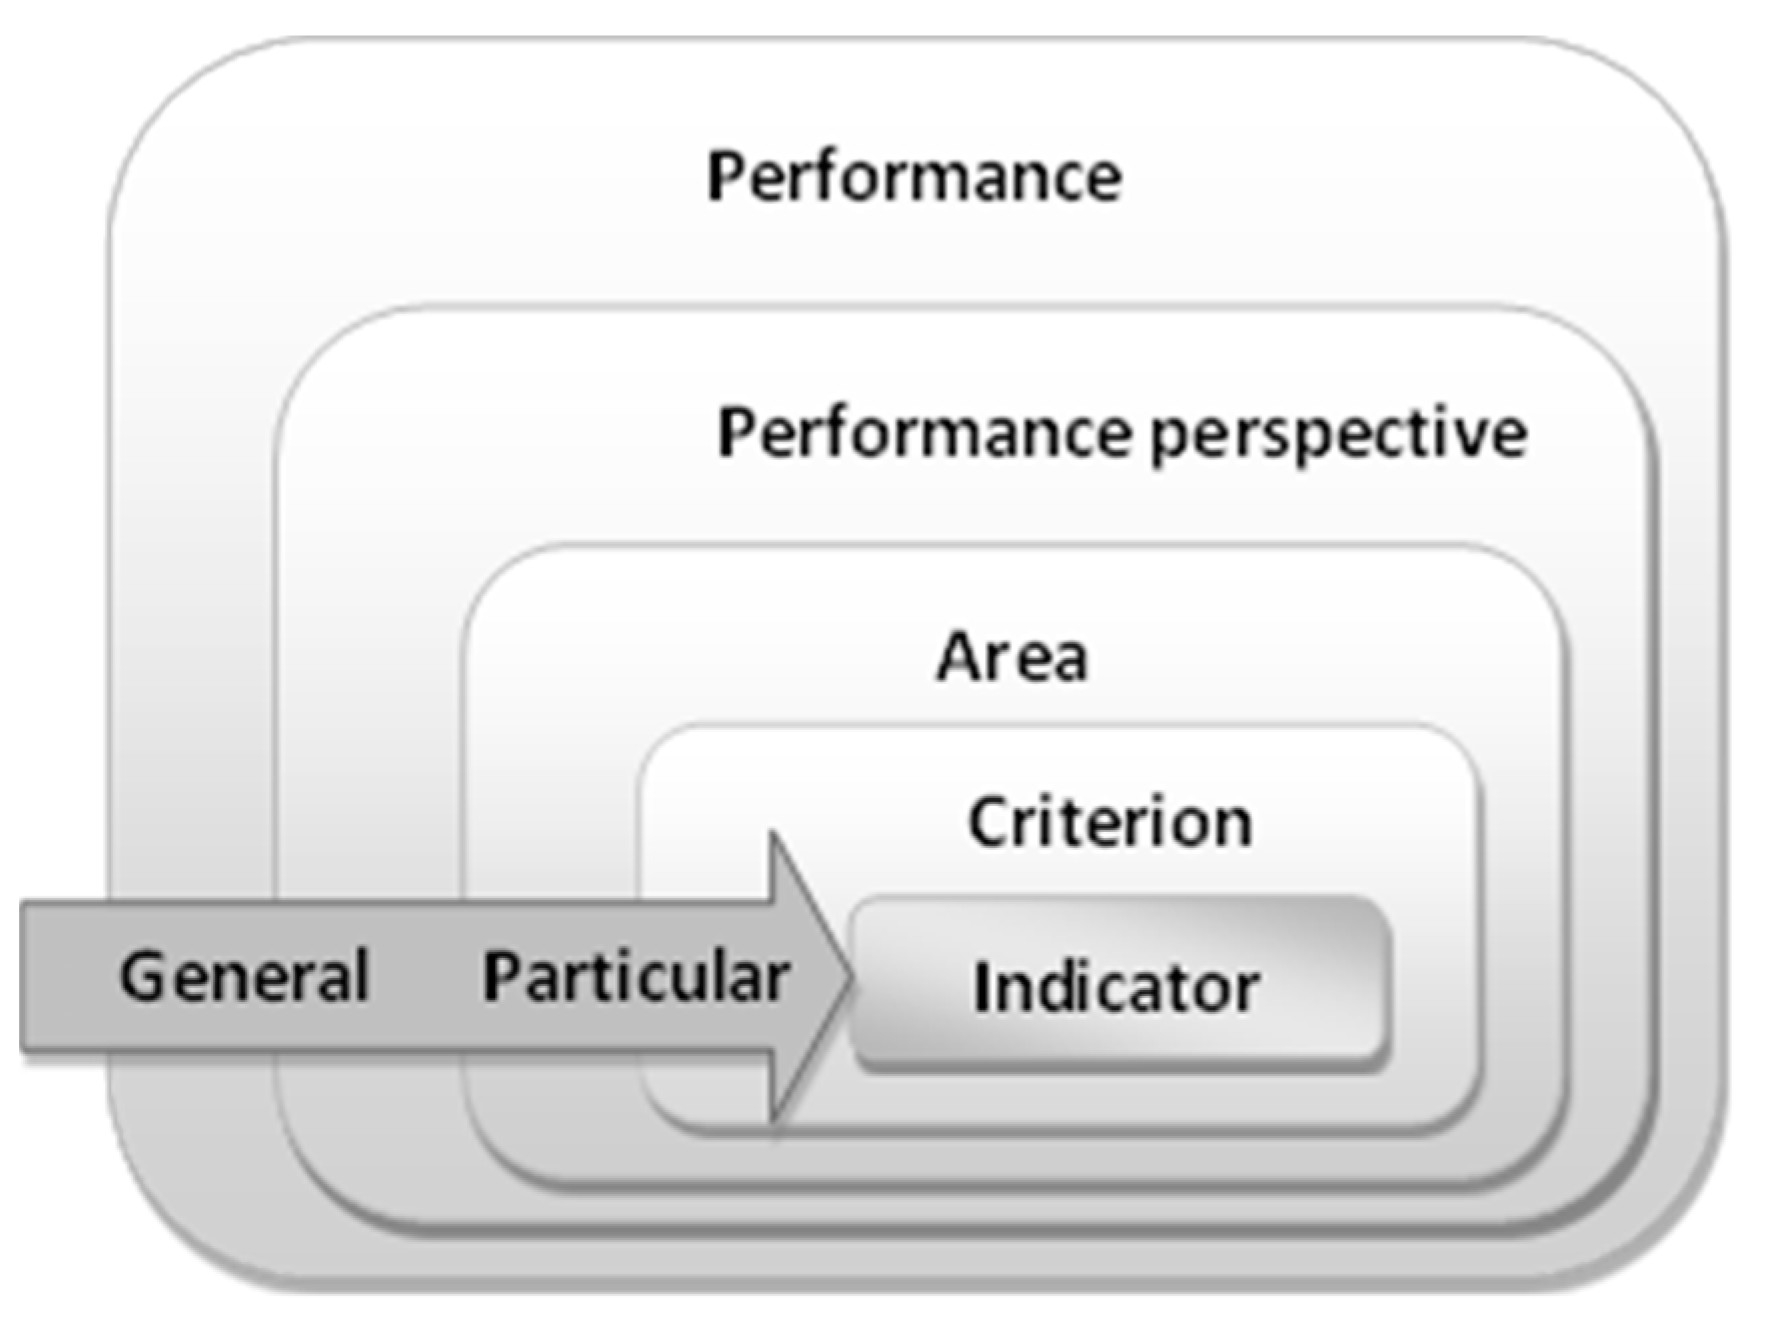
This study explores a reorganization of criteria and indicators, linking them to a particular type of component performance, and considers the life cycle of buildings, including the use phase. Figure 1 presents a schematic diagram of the hierarchy.
After an initial analysis of the gathered information, three perspectives of performance were selected for this approach: technical, environmental, and economic. This study is intended to obtain information to understand the current state of a building in real condition of use. The technical performance area defines the technical characteristics and specifications of materials (technical properties), the practice of maintenance actions (maintenance), and issues related to the users of a building (usage properties), considering the aspects that directly interfere with them.
The environmental component is taken into account because it is an issue that is relevant to society. The economic area is also considered to be a relevant issue because it is present in every stage of the life cycle of the building, depending on all of the other factors involved [29].
Each area consists of a set of criteria that defines it. The selected criteria are carried out by analyzing the tables developed by different organizations, for overall performance and sustainability, as others have also mentioned. Thereafter, definitions of the various criteria that make up each area were developed. The grouping of these criteria is structured in Table 1 (technical, environmental, and economic performance) based on several references [4,5,14,15,16,17,18,30,31,32,33,34,35].
In each area, a set of criteria was explored, and for each criterion a set of indicators was developed based on data from different organizations. Thus, each of the criterion defined above, corresponding to each area, was evaluated using a set of indicators from which they were constructed. The indicators that make up each criterion should be the most representative possible and applied to the corresponding use of each building phase, even when it is not necessary to use the building for its implementation.
Indicators are used as tools for measuring the elements that are assessed. Using the results obtained from these indicators, we can establish a relationship between these results and the objectives pursued. Thus, it is possible to increase the performance of the elements that are in greatest deficit and further improve the performance of the building. The indicators used in each criterion are subject to one or more ratings. A method to evaluate the indicators was developed through a set of evaluation techniques and a classification system, which was then adopted. The assessment techniques to be used for the indicators are explained.
2.1. Evaluation Techniques and Classification
For each indicator there is a specific evaluation technique(s). Indicators were selected taking into account the various approaches for evaluating the performance of buildings, according to the previous literature review:
- Analysis and consultation documentation;
- Visual inspection;
- User surveys;
- Surveys for building management entities;
- Tests (laboratory or in situ).
This study aimed to obtain the performance value of a building using the measurement techniques mentioned. To achieve this, it was necessary to convert all the qualitative information into quantitative information. The means of converting information existing in different forms will vary, depending on the measurement technique concerned. However, it is important to create a uniform and homogeneous method to ensure that a different technical evaluation can be reconciled with the results.
In this study, we focused only on the measurement technique by conducting user surveys. The scale set for the development of these surveys ranged from one to five, one being the worst and five the best rating. Because it contains few numbers, the scale of one to five makes the majority of responses more intuitive and simpler to understand, allowing for greater ease in storing the correspondence of each of the classifications. We consider, despite being a small scale, it is enough for the type of evaluation that was carried out, where detail is not highly relevant. However, user satisfaction remains the core of the survey. In addition, the representation of intermediate values by an odd number (i.e., three) in the survey is necessary to allow users to assign a rating of reasonable/acceptable, which is not possible if the scale is an even number. However, it is known that the consideration of such a scale can represent a trend in allocating a classification in the intermediate value, especially when surveys are too long.
2.2. User Survey
Only indicators that measure user satisfaction were selected for review and application. The application of all indicators defined in the literature review requires more complex analyses with multidisciplinary knowledge, in addition to involving several specialists. Furthermore, due to the large number of indicators, data mining statistical treatment tools are required. However, usually this data is scarce for each building. In this context, the study of real cases is the desired approach because they can provide relevant real data for more complex models of decision process, building performance monitoring, and cost in use optimization.
Users are the key element in evaluating the performance of a building, despite the inherent subjectivity. They are the main stakeholders in which an operation meets their needs. The criteria and the key indicators that make up the survey are:
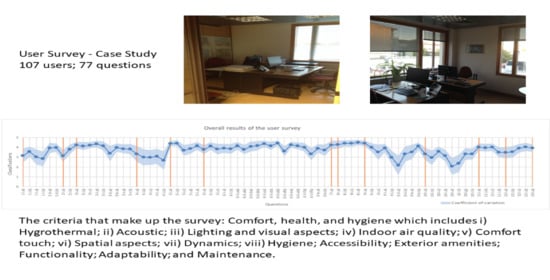
- Comfort, health, and hygiene which includes (i) Hygrothermal; (ii) Acoustic; (iii) Lighting and visual aspects; (iv) Indoor air quality; (v) Comfort touch; vi) Spatial aspects; (vii) Dynamics; (viii) Hygiene;
- Accessibility;
- Exterior amenities;
- Functionality;
- Adaptability;
- Maintenance.
The surveys were adapted for office buildings and intended to obtain a performance rating assigned by their users. The main objective of this study was to understand how much the building satisfies its users and which aspects present the best and worst outcomes. It also aimed to identify aspects that need improvement by detecting situations with the worst ratings. Users are assigned questions a rating from 1 (very bad) to 5 (very good), or don’t know/does not apply; the attribution of don’t know or not applicable is normally associated with non-use.
The survey included an initial header, which presented the duration of the research and some information for the user to fill in, such as the company name and its address, date of the survey, and characteristics that define the user (gender, age, job title, how long the person has been working in the building).
2.3. Case Study
The validation of user satisfaction assessment surveys took place in a service building with 107 employees, located in Campo Grande, in the center of Lisbon city (Portugal). The study area occupies an entire floor and a half of a four-story building, which has been the head office since the end of 2000.
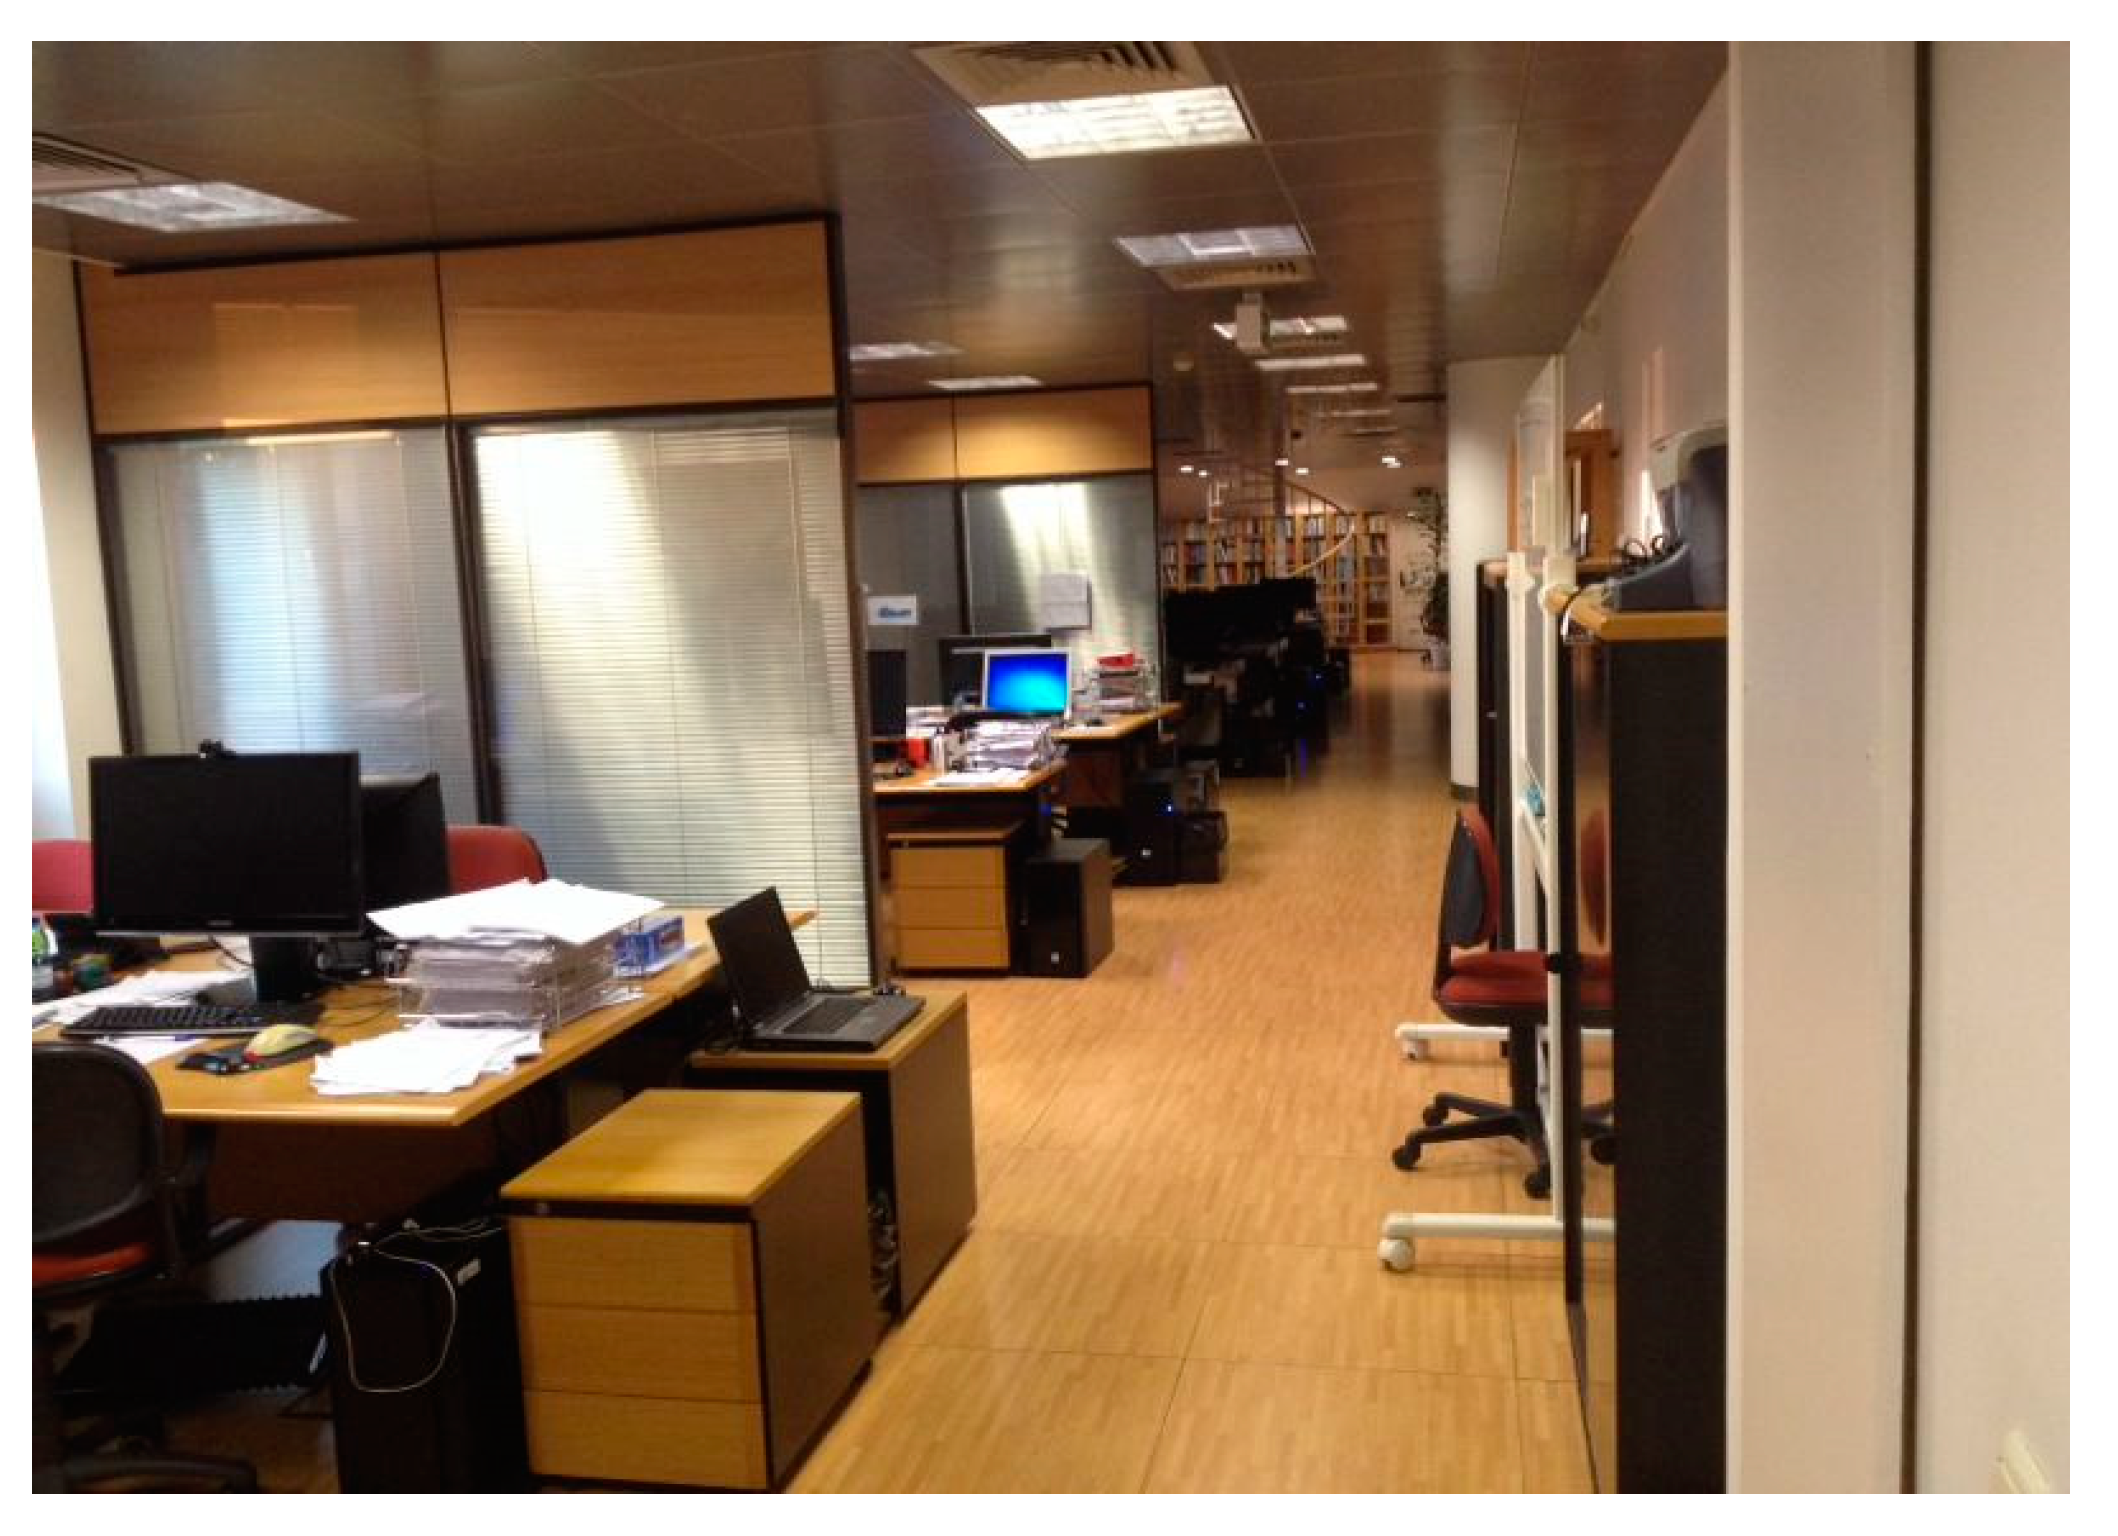
After completing the surveys with the users of the building, study of the specific aspects of the surveys was needed to understand certain physical characteristics of the building and the routines of the building users. With this purpose, photographs of the office were taken, a general layout of the space was designed, and a set of questions was prepared to be answered by one of the building users (space organization—open space, floor material, ventilation system, among others), to improve the understanding of some survey results.
The surveys were conducted by email and sent by the management department to the employees of the building. Seventy-seven responses from users were obtained. The ages of participants ranged between 24 and 56 years old, and 37% were female and 63% were male.
Some of the job positions presented in the survey responses—position held—were as follows (associated to the respective percentage obtained in individual results) (in alphabetical order): administrator (1%); business developer (1%); director (includes quality manager and human resources) (7%); management (1%); marketing assistant (1%); portfolio management (3%); programmer analyst (34%); software maintenance management (4%); senior secretary (1%); software engineer (16%); and software tester (14%); team leader (8%); technical writer (1%); furthermore, 8% did not answer this question.
In the question “how long have you been working in the building”, the answers ranged from 3 days to 13 years. The second value corresponds to the time at which the company settled in the current location. It is important to note that the answers of these users who had been working in the building for less than 1 year conditioned some of the responses, such as the evaluation of the temperature inside the building in different seasons, e.g., summer and winter—respondents were unable to answer both because they had not worked in the building long enough.
In the results obtained in the question “how long have you been working in the building”, more than half of the users (65% of the respondents) replied that they had been working for over a year in the building; 21% responded that they had worked there for a year or less; the remainder of the results (14%) corresponded to users who did not answer this question or responded inadequately.
3. Results and Discussion
In this study, a sample of 77 responses was analyzed and a simple statistical analysis was conducted to evaluate the results.
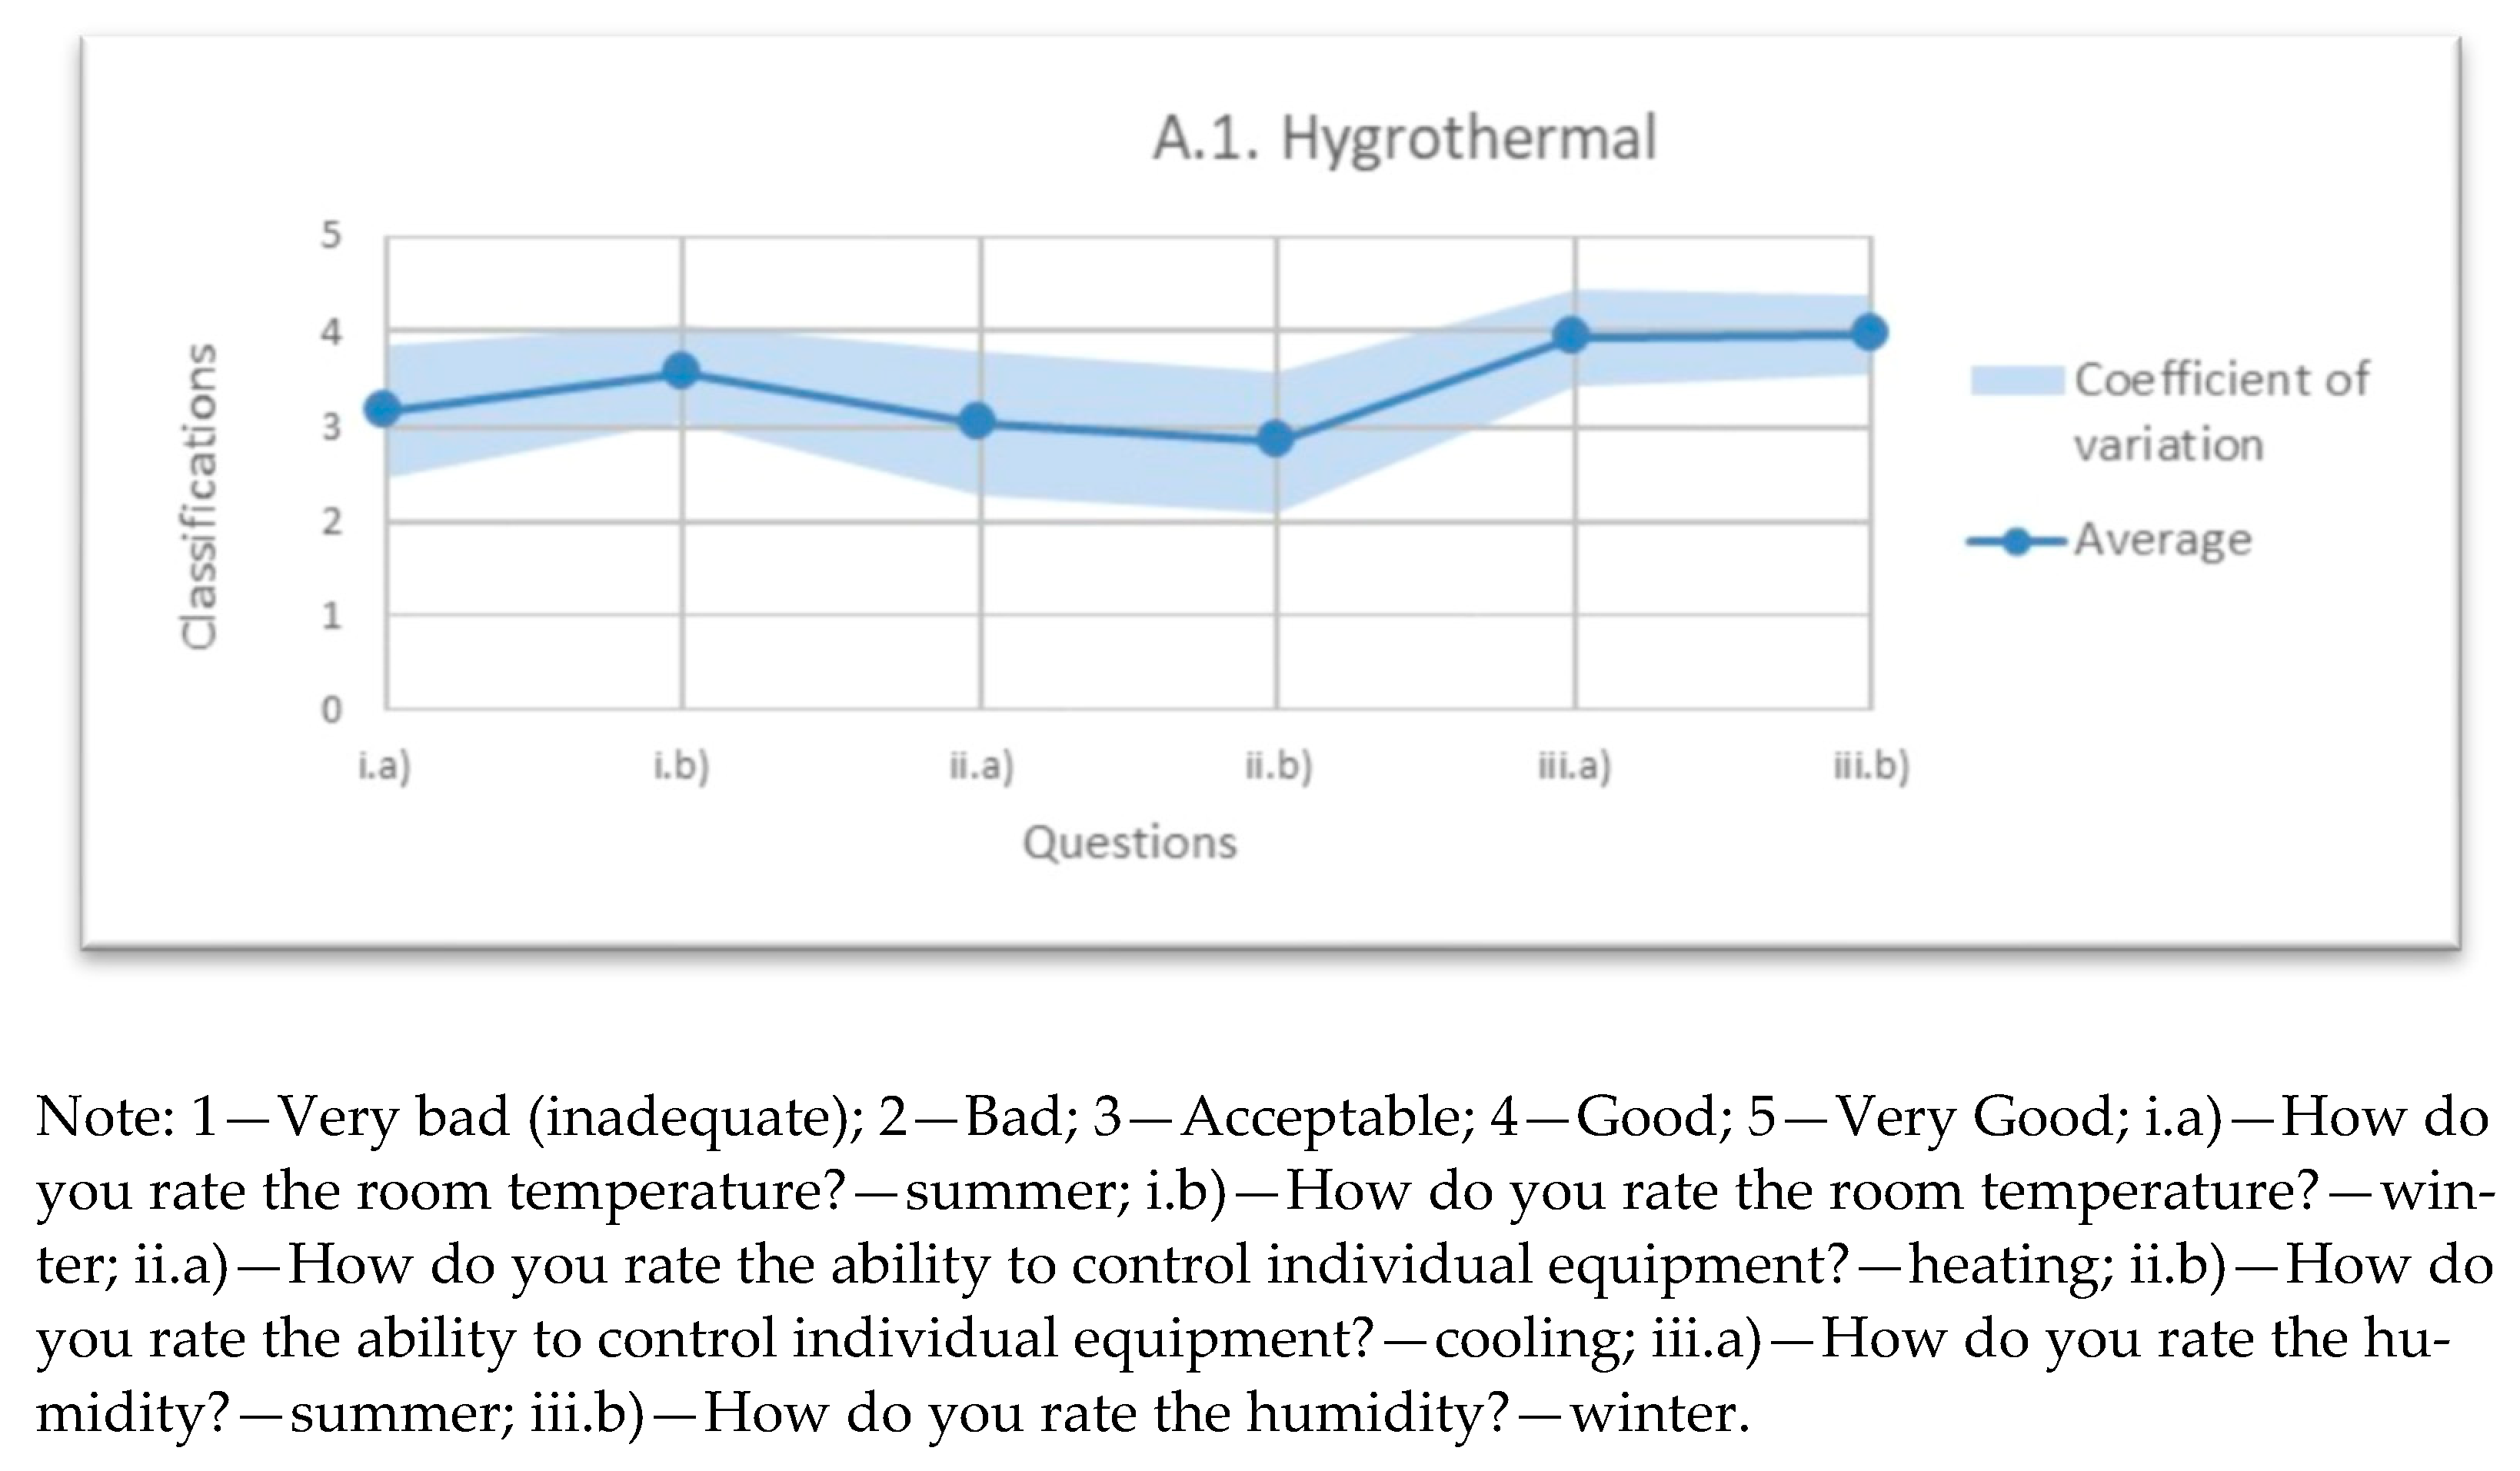
3.1. Hygrothermal Comfort
Analyzing the results presented in Figure 2, it is clear that the user’s perception that refers to the ability to control individual devices, heating and cooling, has the worst rating average (ii.a) = 3.0; ii.b) = 2.8), and a higher coefficient of variation (ii.a) CV = 38%; ii.b) CV = 38%), that reflects poor unanimity of the answers given by the users. The answers that obtained higher average results refer to humidity (iii.a) = 3.9; iii.b) = 4.0), especially in winter, for when there was a low coefficient of variation (iii.a) CV = 26%; iii.b) CV = 21%). The issue of humidity also obtained several answers stating doesn’t know/doesn’t apply. The fact that users answered this way is positive, because if there were humidity issues they would have assigned a rating. The question concerning comfort temperature—summer and winter—had satisfactory ratings (i.a) = 3.2 and i.b) = 3.6), although this factor may be non-representative because it is known that the building is composed of different rooms, exposed to different temperatures, which may reflect a combination of hot rooms and cold rooms. This should be noted in the item above (i.a) summer) that presented a coefficient of variation of 35%.
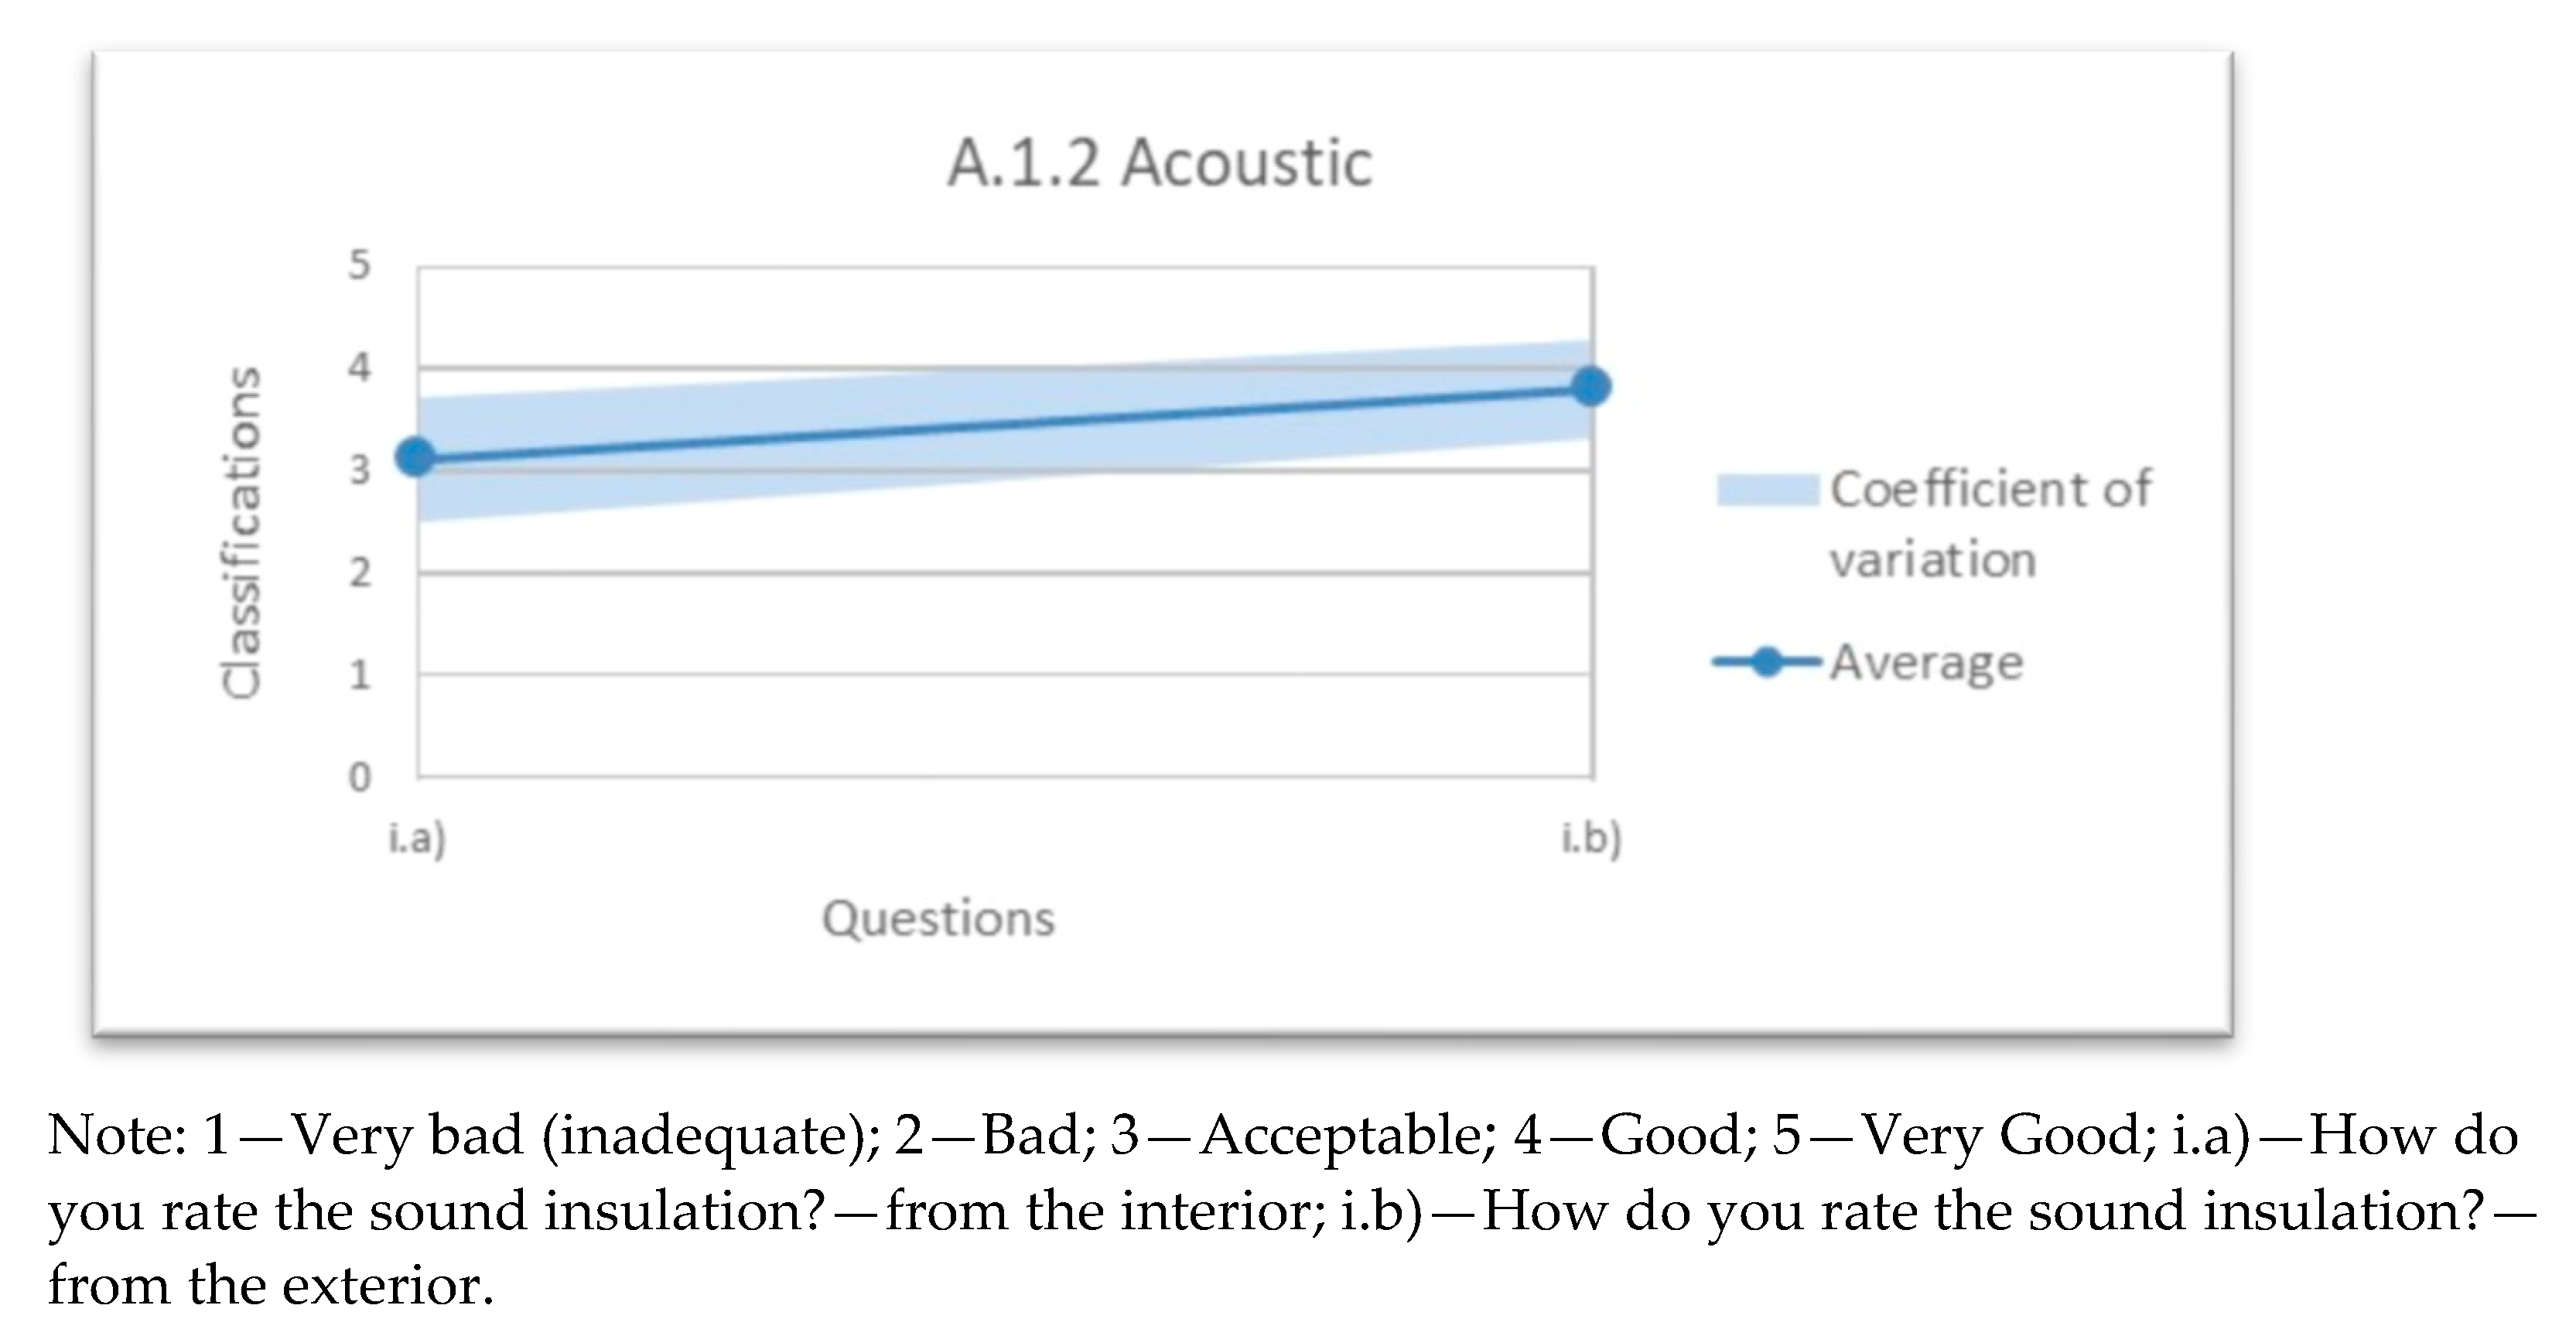
3.2. Acoustic Comfort
The results of acoustics (sound insulation rate from interior and exterior, respectively) on the i.a) inside and i.b) outside, can be observed in Figure 3. The average responses in i.a) received an acceptable classification of 3.1 (acceptable). However, there was some dispersion in the results (high coefficient of variation, i.a) CV = 1%), obtained from different classifications, which may correspond to a deficiency in sound insulation in some rooms, a fact explained by the type of spatial organization that the layout offers. The i.b) outside acoustics show an approximate average result of 4 (good). These results showed that in user perception the building has better acoustics from outside than inside.
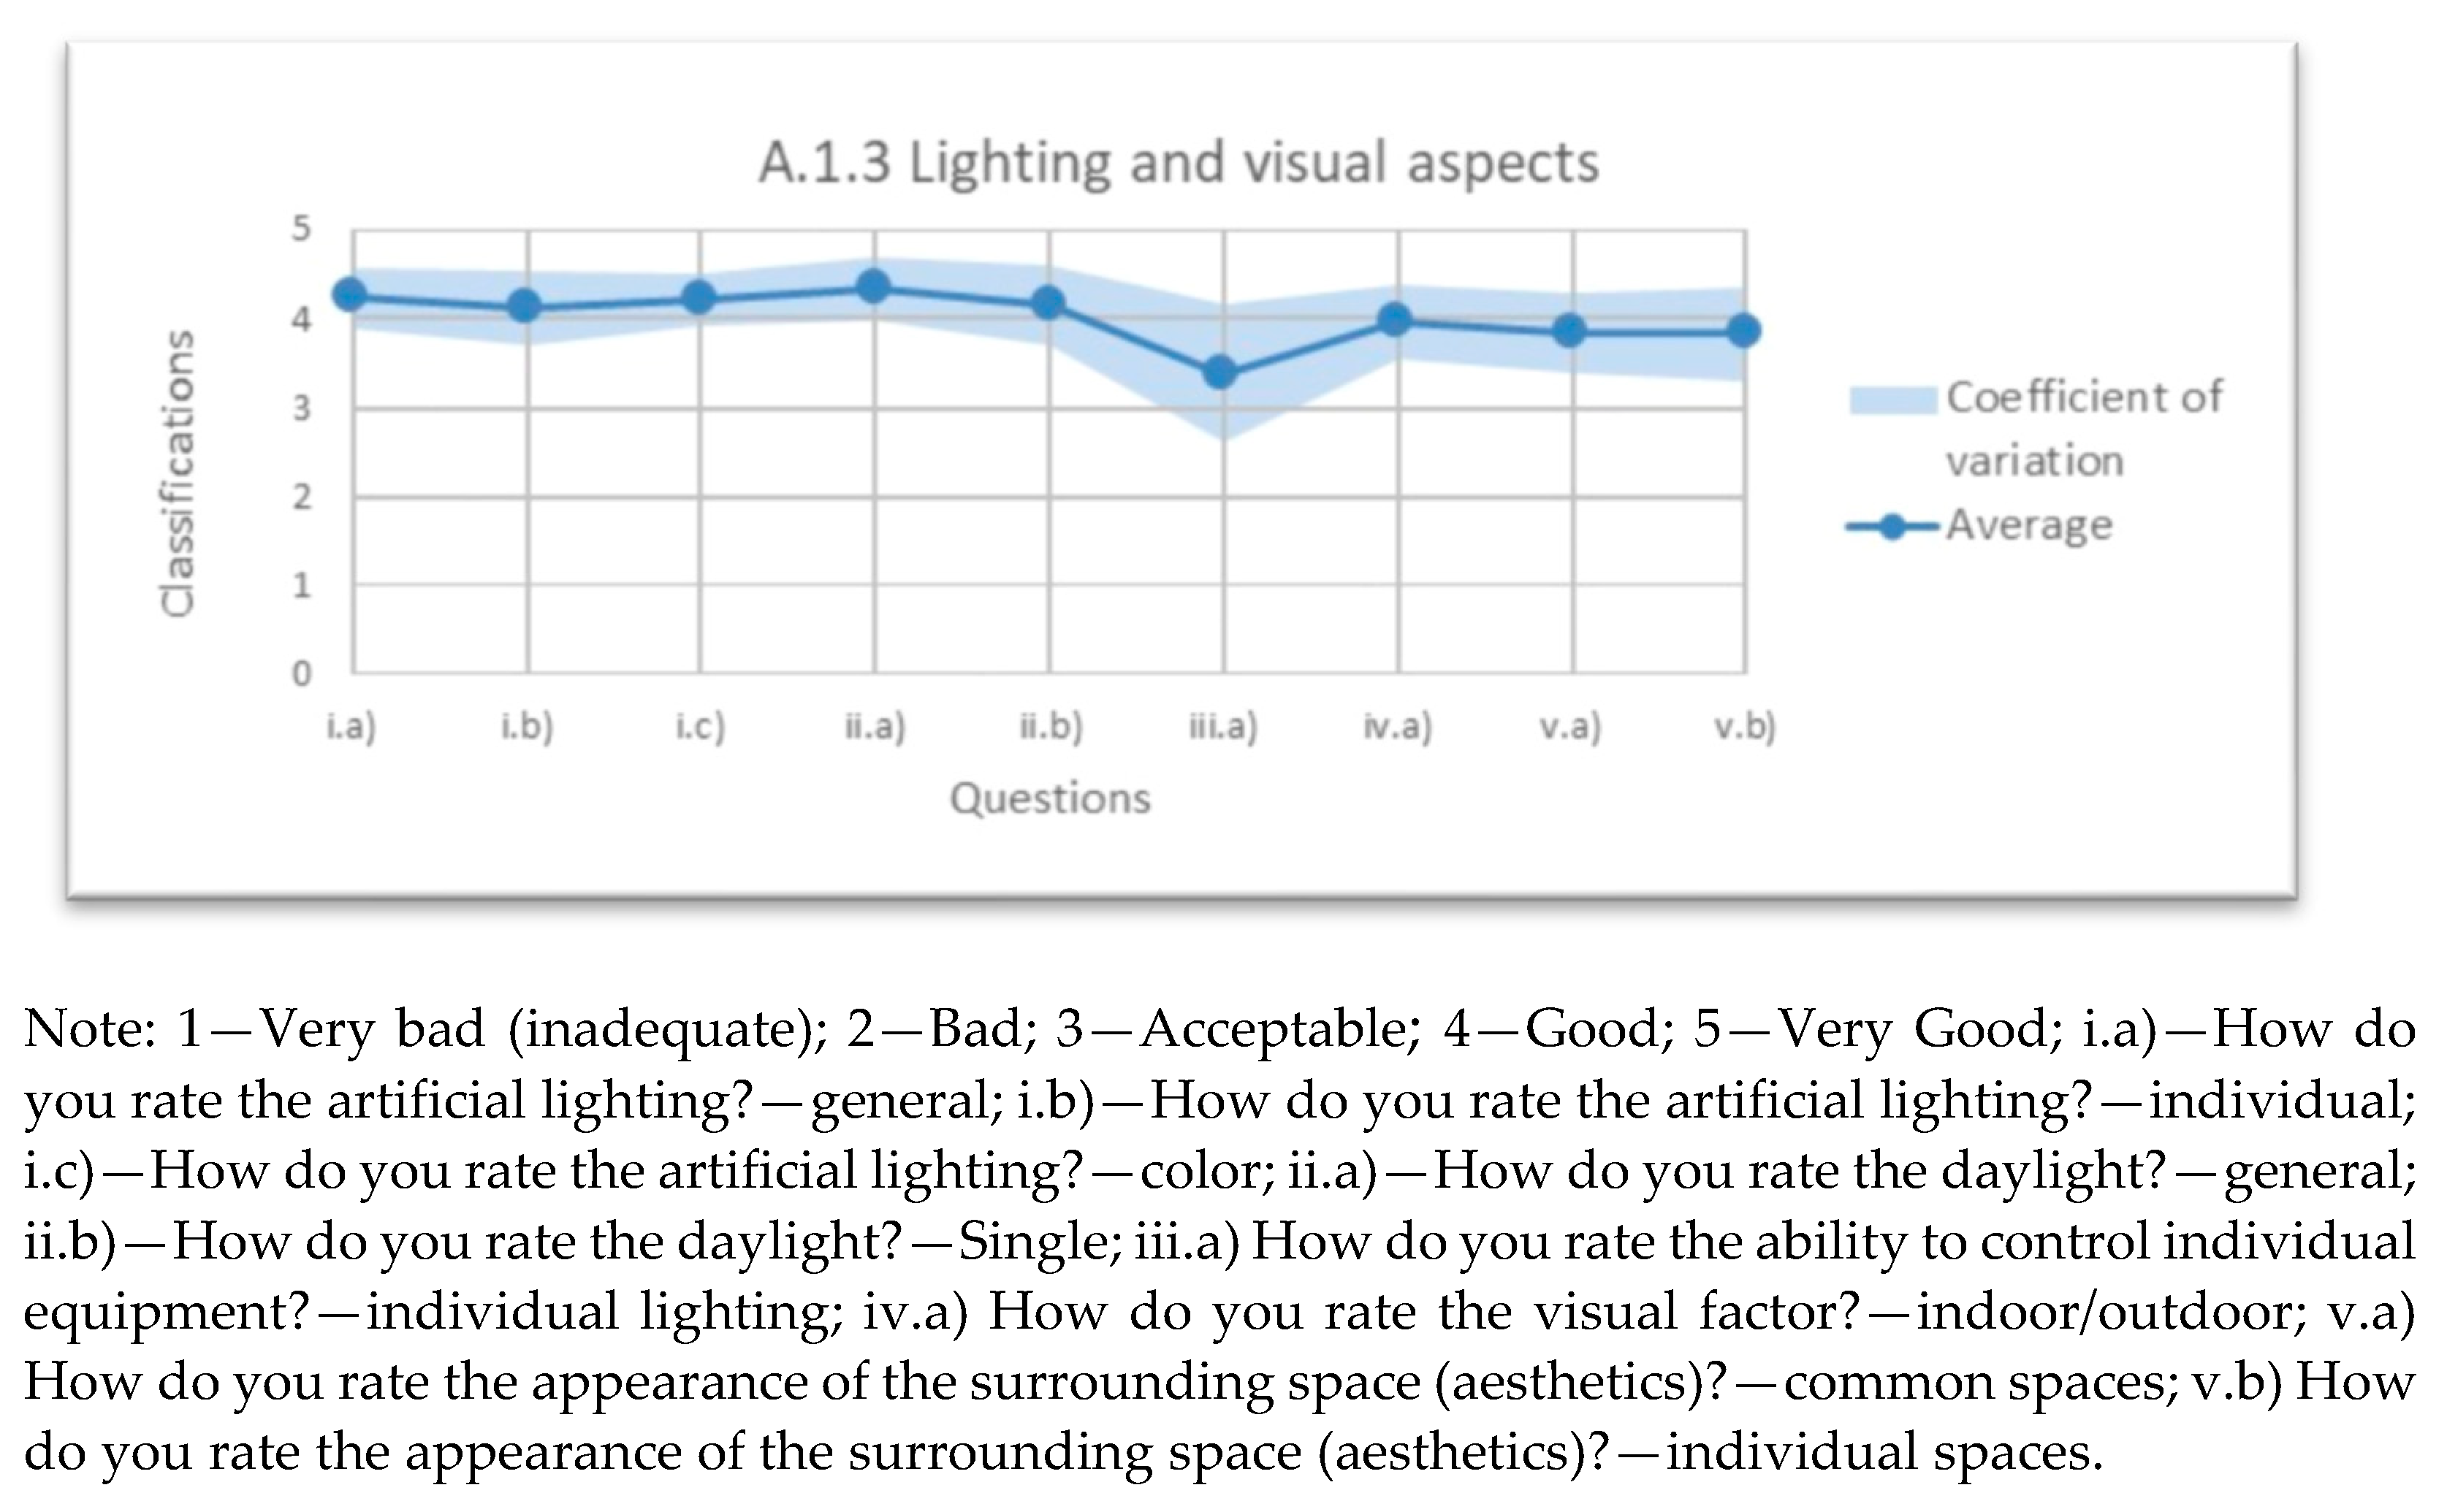
3.3. Lighting and Visual Aspects
The general results displayed in Figure 4 reveal an average rating of approximately 4 (good) responses except in question iii.a), which refers to the ability to control individual devices (iii.a) = 3.4). This question received a lower rating than the others, and shows a visible dispersion of results (iii.a) CV = 39%). In fact, there is no individual lighting in the offices (visible in Figure 5), only general, and this fact can justify this dispersion. It is also worth mentioning point iv.a), which obtained an average rating of 4.0 (good); two of the windows (natural lighting) in the office face the Garden of Campo Grande and the others face the surrounding buildings (including the City of Lisbon Foundation, which is a remarkable aesthetic and architectural landmark); thus, these may be the main factors responsible for this rating. Observing a low coefficient of variation (iv.a) CV = 21%) indicates that there is a consensus in the responses obtained.
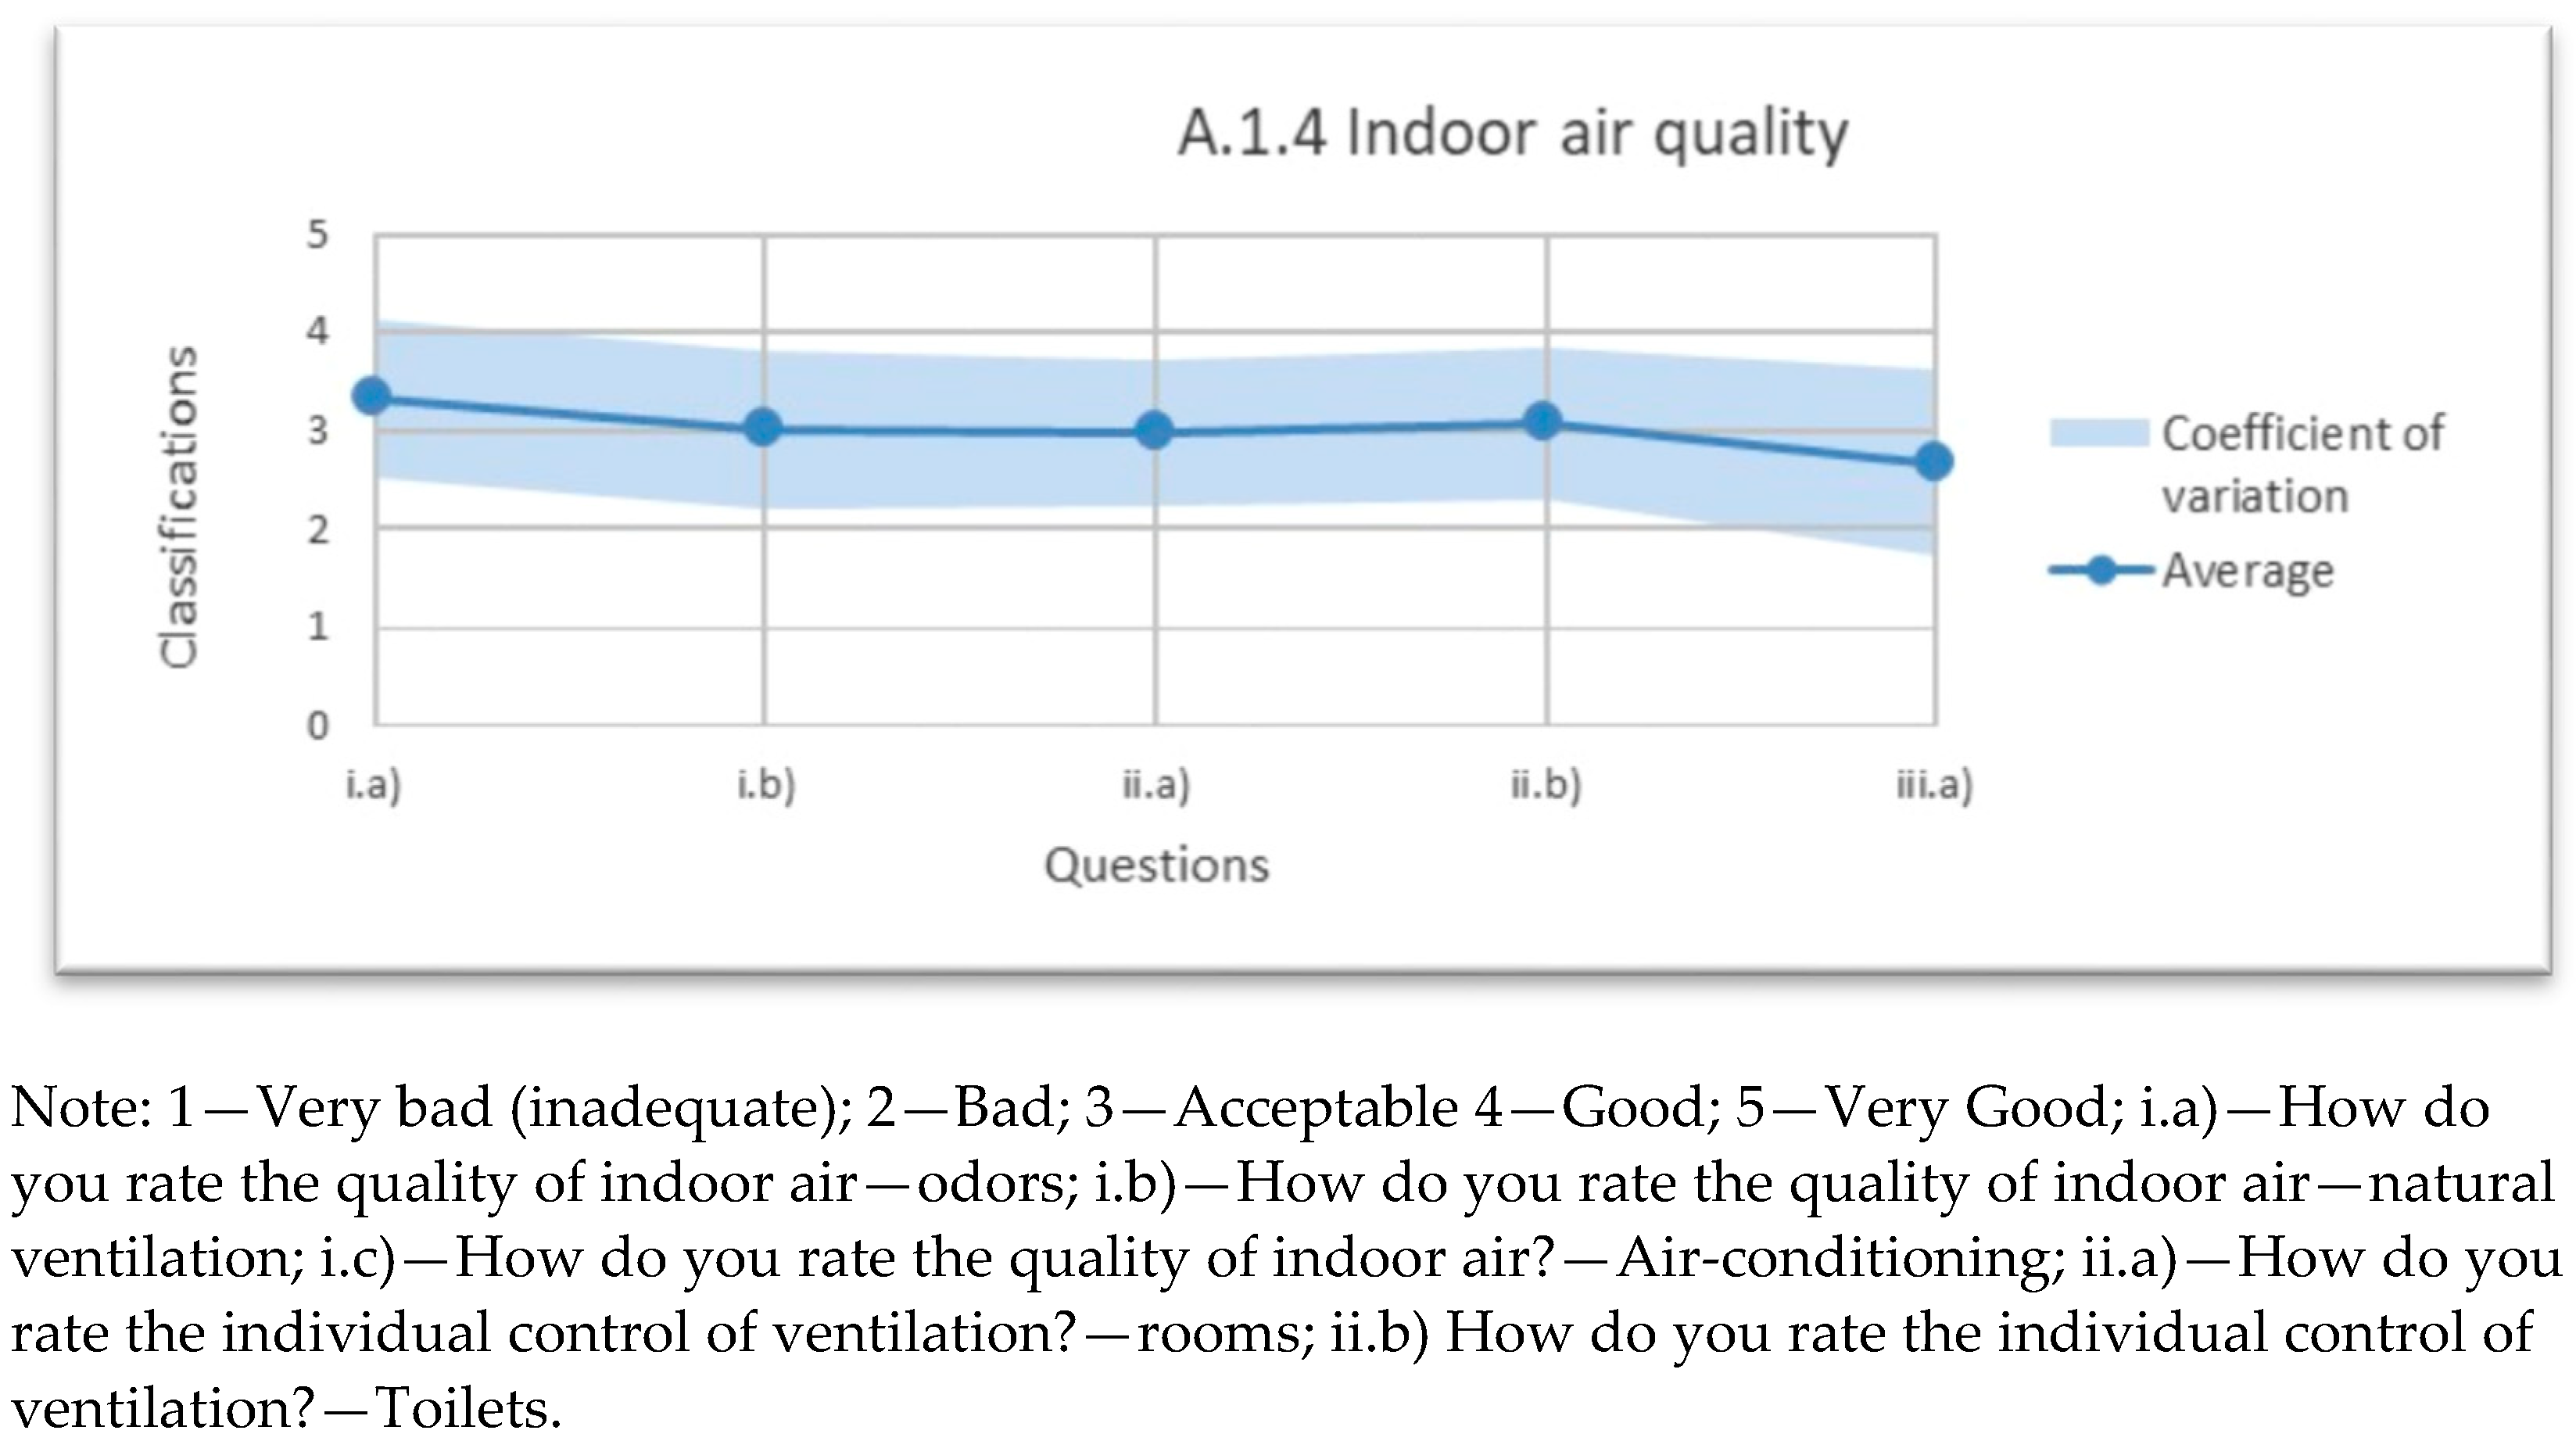
3.4. Indoor Air Quality
In evaluation of indoor air quality associated with natural ventilation and air-conditioning, Figure 6 shows that the results are acceptable. However, there is not a lot of consensus in the responses in both issues, which reflects high coefficients of variation. This can be justified by the existence of different rooms in the office, where each user may be exposed to different conditions and some rooms did not have natural ventilation.
In the analysis of the question, concerning the control of ventilation in rooms and service areas, there was no individual control of mechanical ventilation for all rooms and service areas. In the case of the rooms, some had windows, which therefore had natural ventilation. Unlike the other rooms, the service areas only had mechanical automatic ventilation. Considering the control of ventilation in the rooms, users answered this question when applicable, obtaining an average rating of 3.1 (acceptable). Regarding the lack of ventilation in the service areas, some of the answers focused on do not know/does not apply, achieving an average rating of 2.7 (bad).
3.5. Comfort Touch
By observing the results in Figure 7 regarding material properties, temperature, harshness/roughness, flexibility/mobility equipment, and furniture size, the responses given reveal good ratings. The lowest ratings presented in this set of questions correspond to i.c) flexibility/mobility, with an average rating of 3.7 and the maximum ratings correspond to i.a) temperature and i.b) harshness/roughness, with an average rating of 4.4. It can be assumed that users are satisfied with the existing working equipment. ii.a) static electricity is not always noticeable, which explains the large number of do not know/does not apply responses. It is assumed in this case that when this type of response is given it should be evaluated as a good result, because if it were noticeable to users, they would tend to ascribe a negative rating because it is an undesirable aspect related to discomfort. However, the average rating obtained was 4.1.
3.6. Spatial Features
Spatial features included the user’s perception about: office/rooms partitioning; circulation; signaling; size of spaces; location of toilets, reception, meeting room; location and usage of elevators, of stairs, and of canteen/dining area, and the physical layout of the workspaces. The responses obtained show similar average ratings, except regarding the satisfaction of using lifts and the dining area/canteen, which present an average somewhat lower when compared to the others (i.db) = 3.6 and i.fb) = 3.3). It should be noted that the aspect which provides the best results, is the location of elevators, with an average rating of 4 (good) and a low coefficient of variation (i.da) CV = 13%). The results show that in general, users are satisfied with this aspect. The iv) physical arrangement of the elements also received acceptable ratings, both with an average of 3.4.
3.7. Dynamics
Just like the classification of static electricity, the vibration factor may also be an aspect that has a tendency to receive the response do not know/does not apply when it is not detected, because when it is felt it is considered negative. Nevertheless, and contrary to what was found in the matter related to static electricity, there were few do not know/does not apply responses. Thus, it can be assumed that the question is well understood by the users. The average rating obtained was 4.2, so there were no significant vibrations in the building. No chart was prepared for this group, as only one question was raised. Thus, the individual results regarding this question are shown in Table 2.
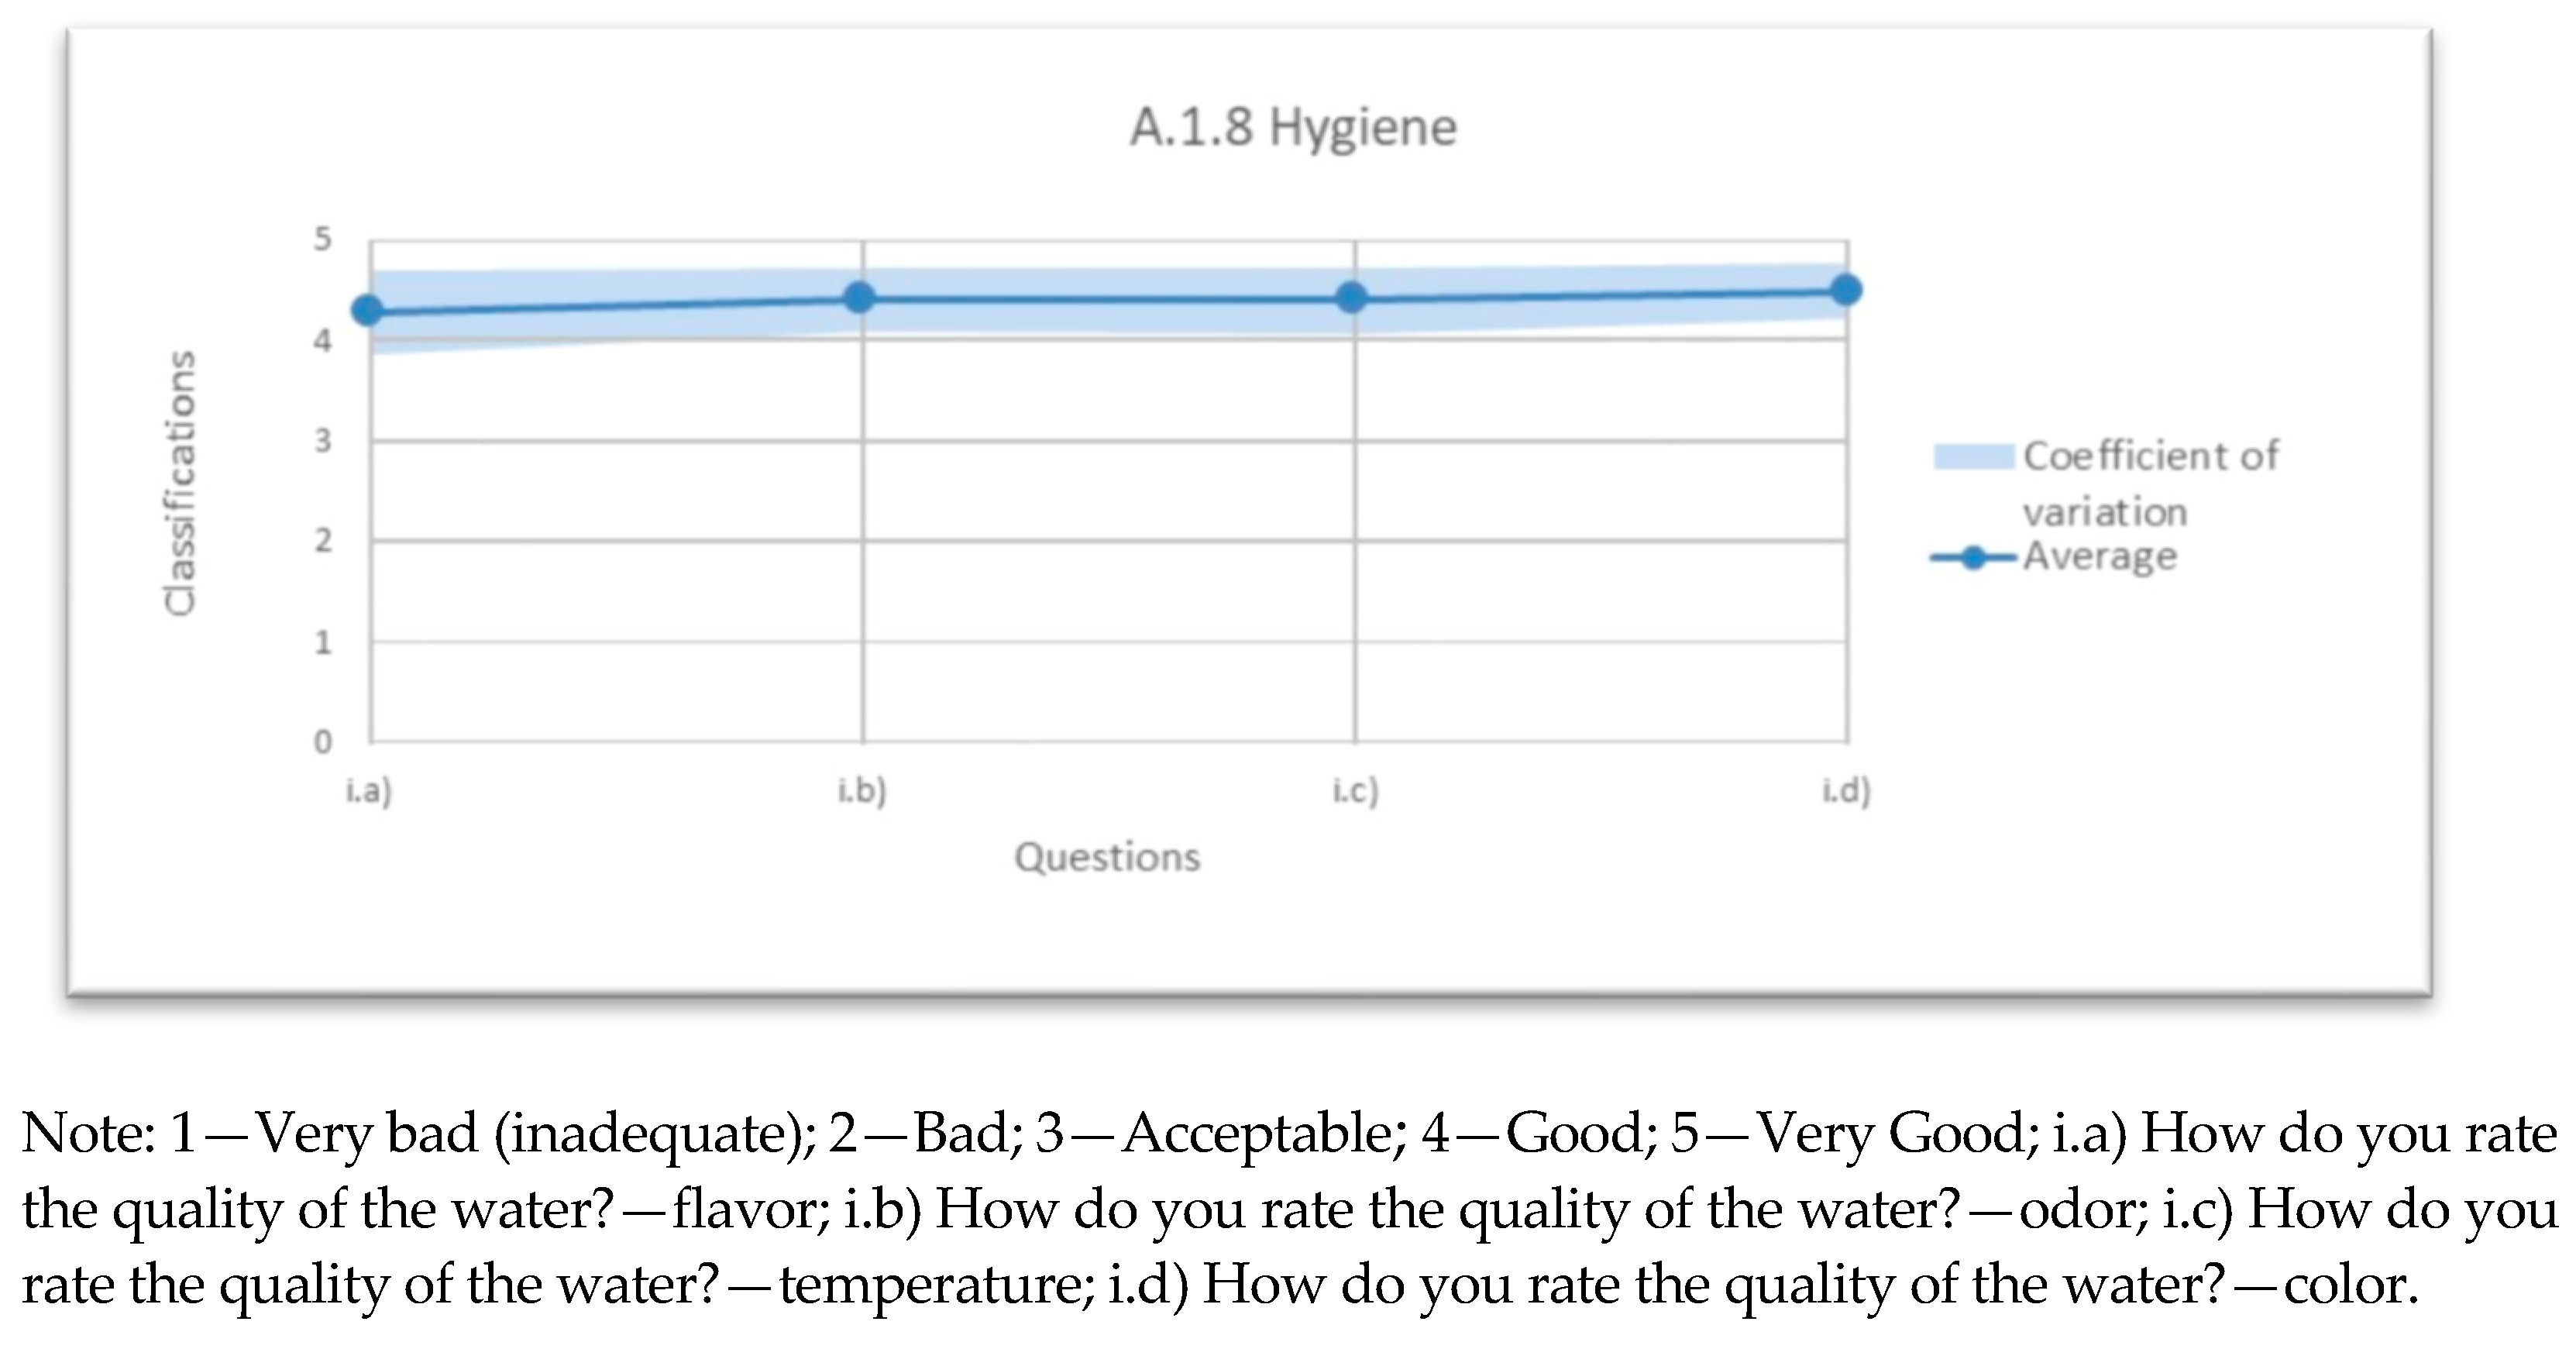
3.8. Hygiene
Looking at Figure 8, the average obtained in the different questions, and their coefficient of variation, the obtained results are very similar. This is the group that achieved the best ratings in the study, reaching an average rating between 4.3 and 4.5.
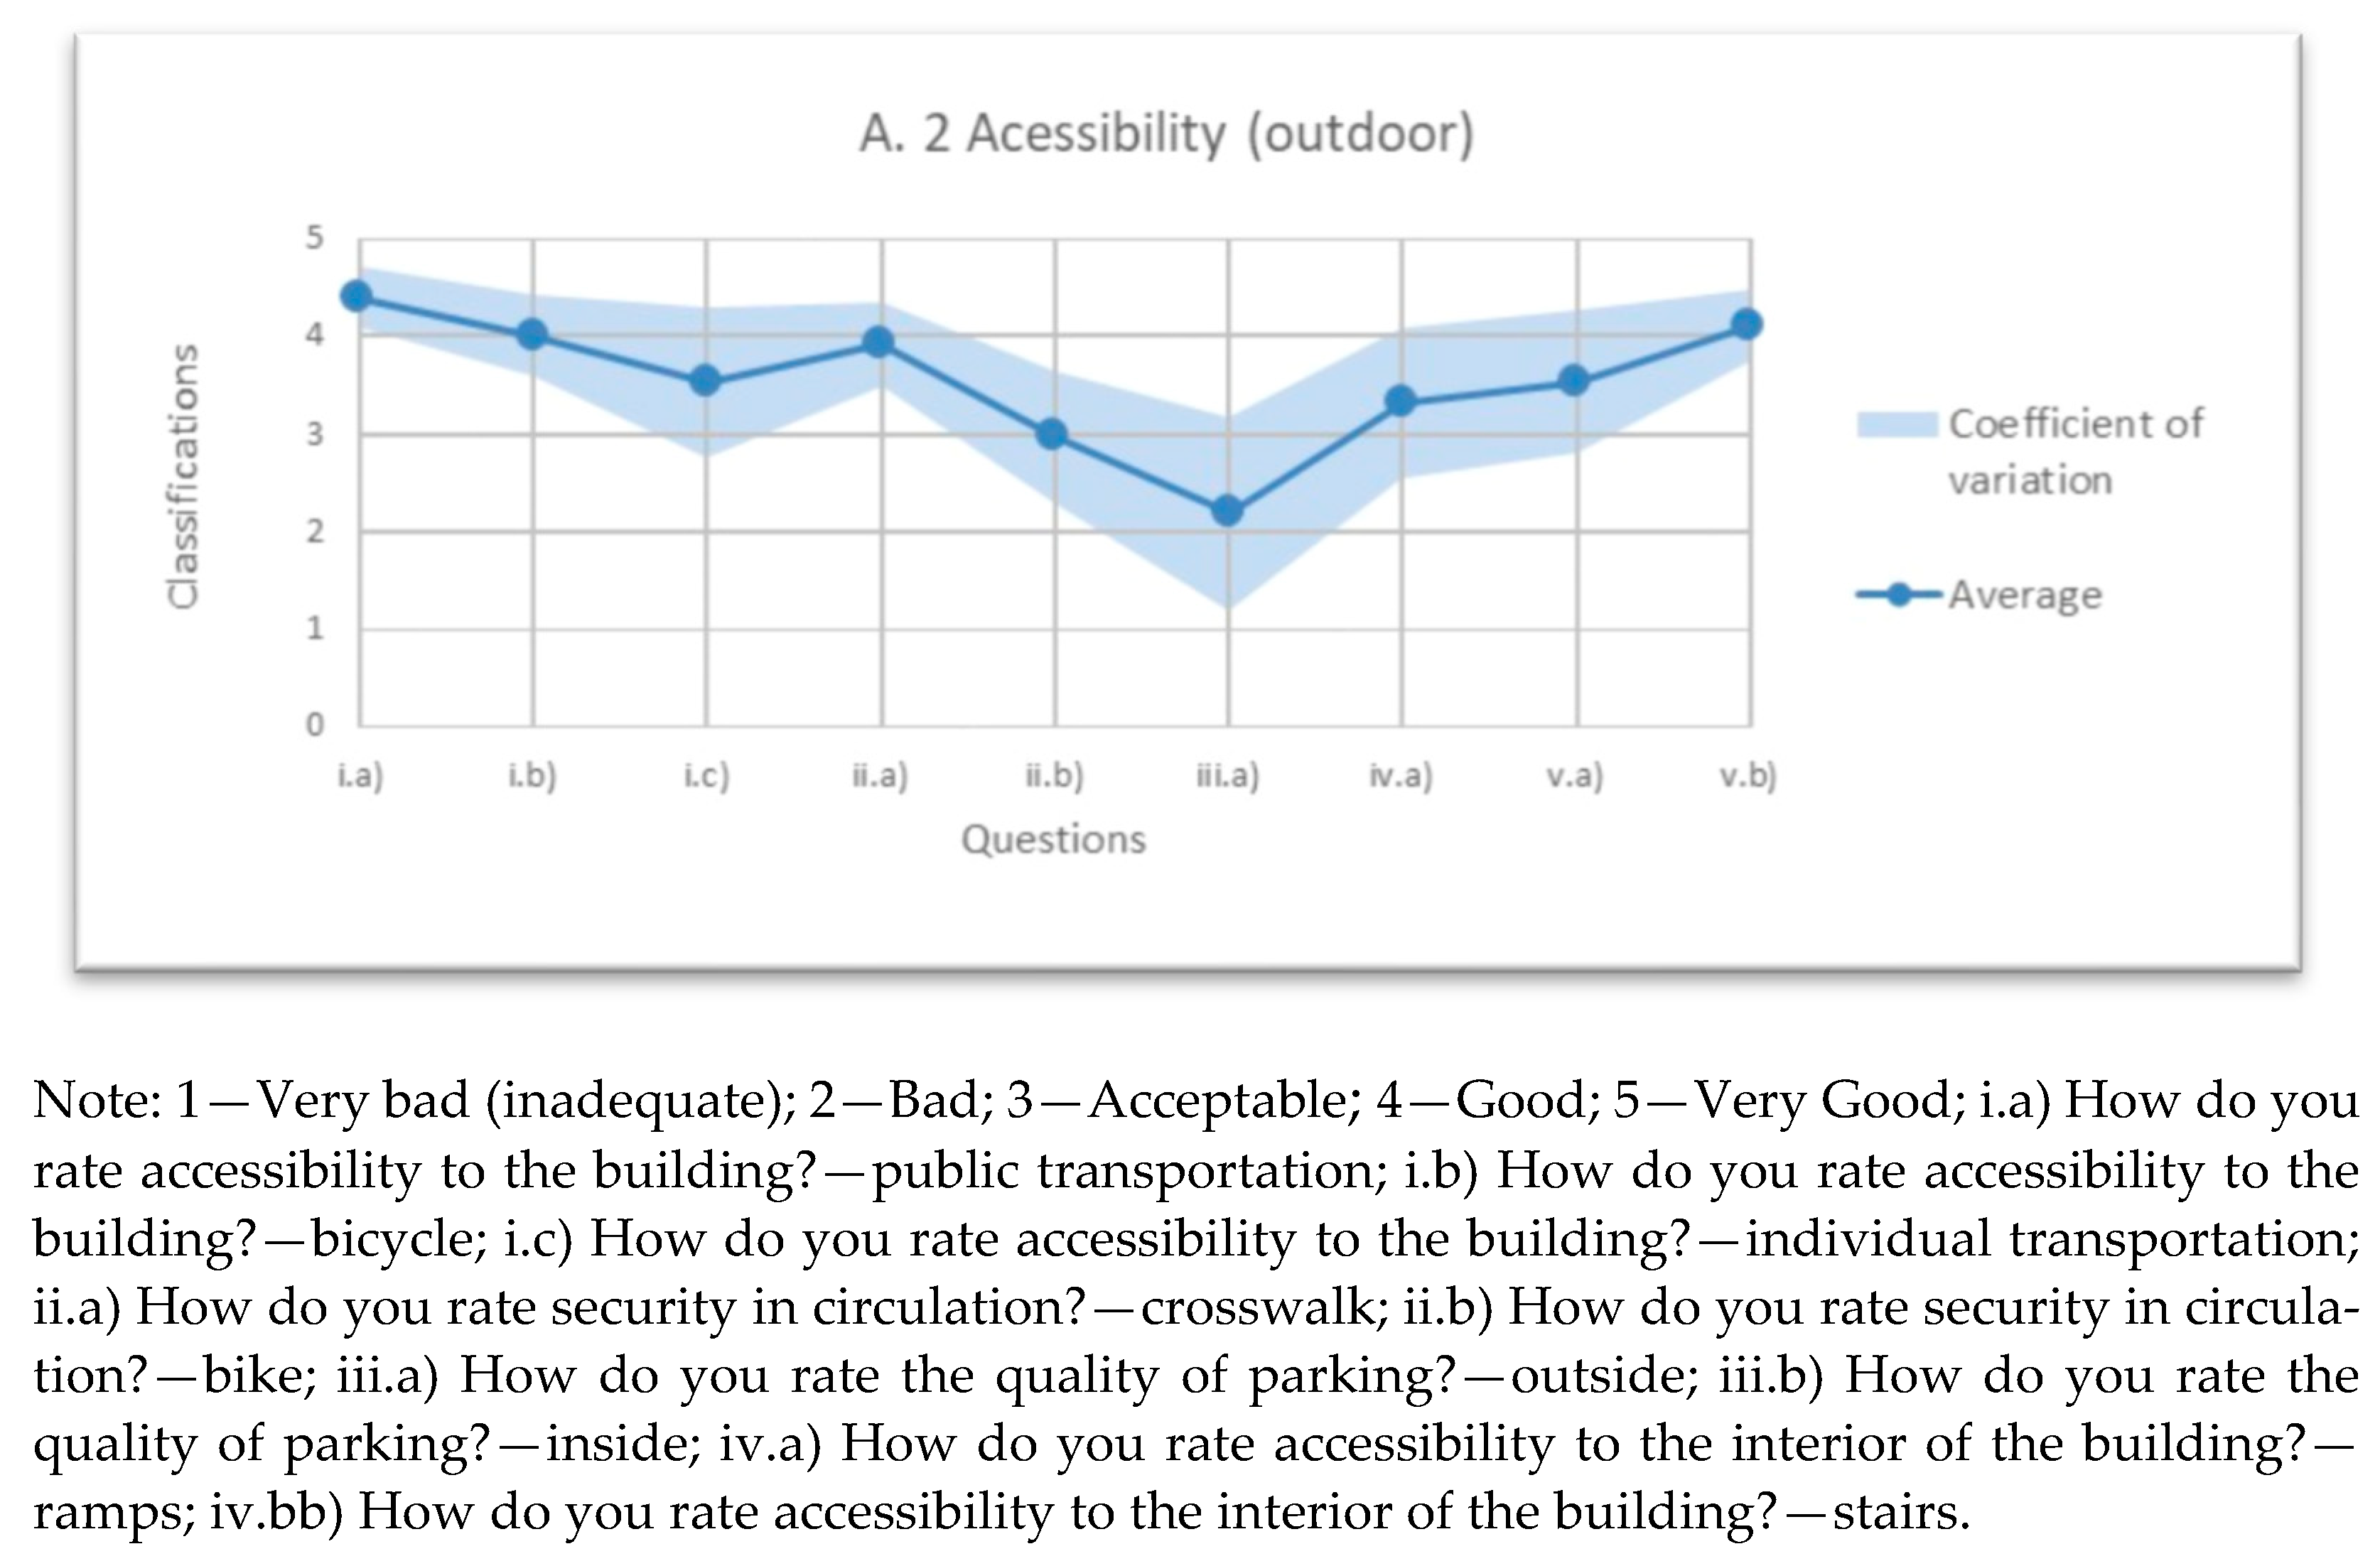
3.9. Acessibility
In Figure 9, some variation in the ratings was obtained. The answer that received the worst classification was iii.a) quality of outdoor parking ( = 2.2, bad), where user dissatisfaction was evident. It should be noted that the questions that refer to access by i.c) individual transport (CV = 39%), the quality of iii.a) outdoor parking (CV = 50%) and iii.b) indoor parking (CV = 38%), and the accessibility to the interior of the building via iv.a) ramps (CV = 37%), were associated with a considerable coefficient of variation, and the parking outside obtained the highest response to any question asked.
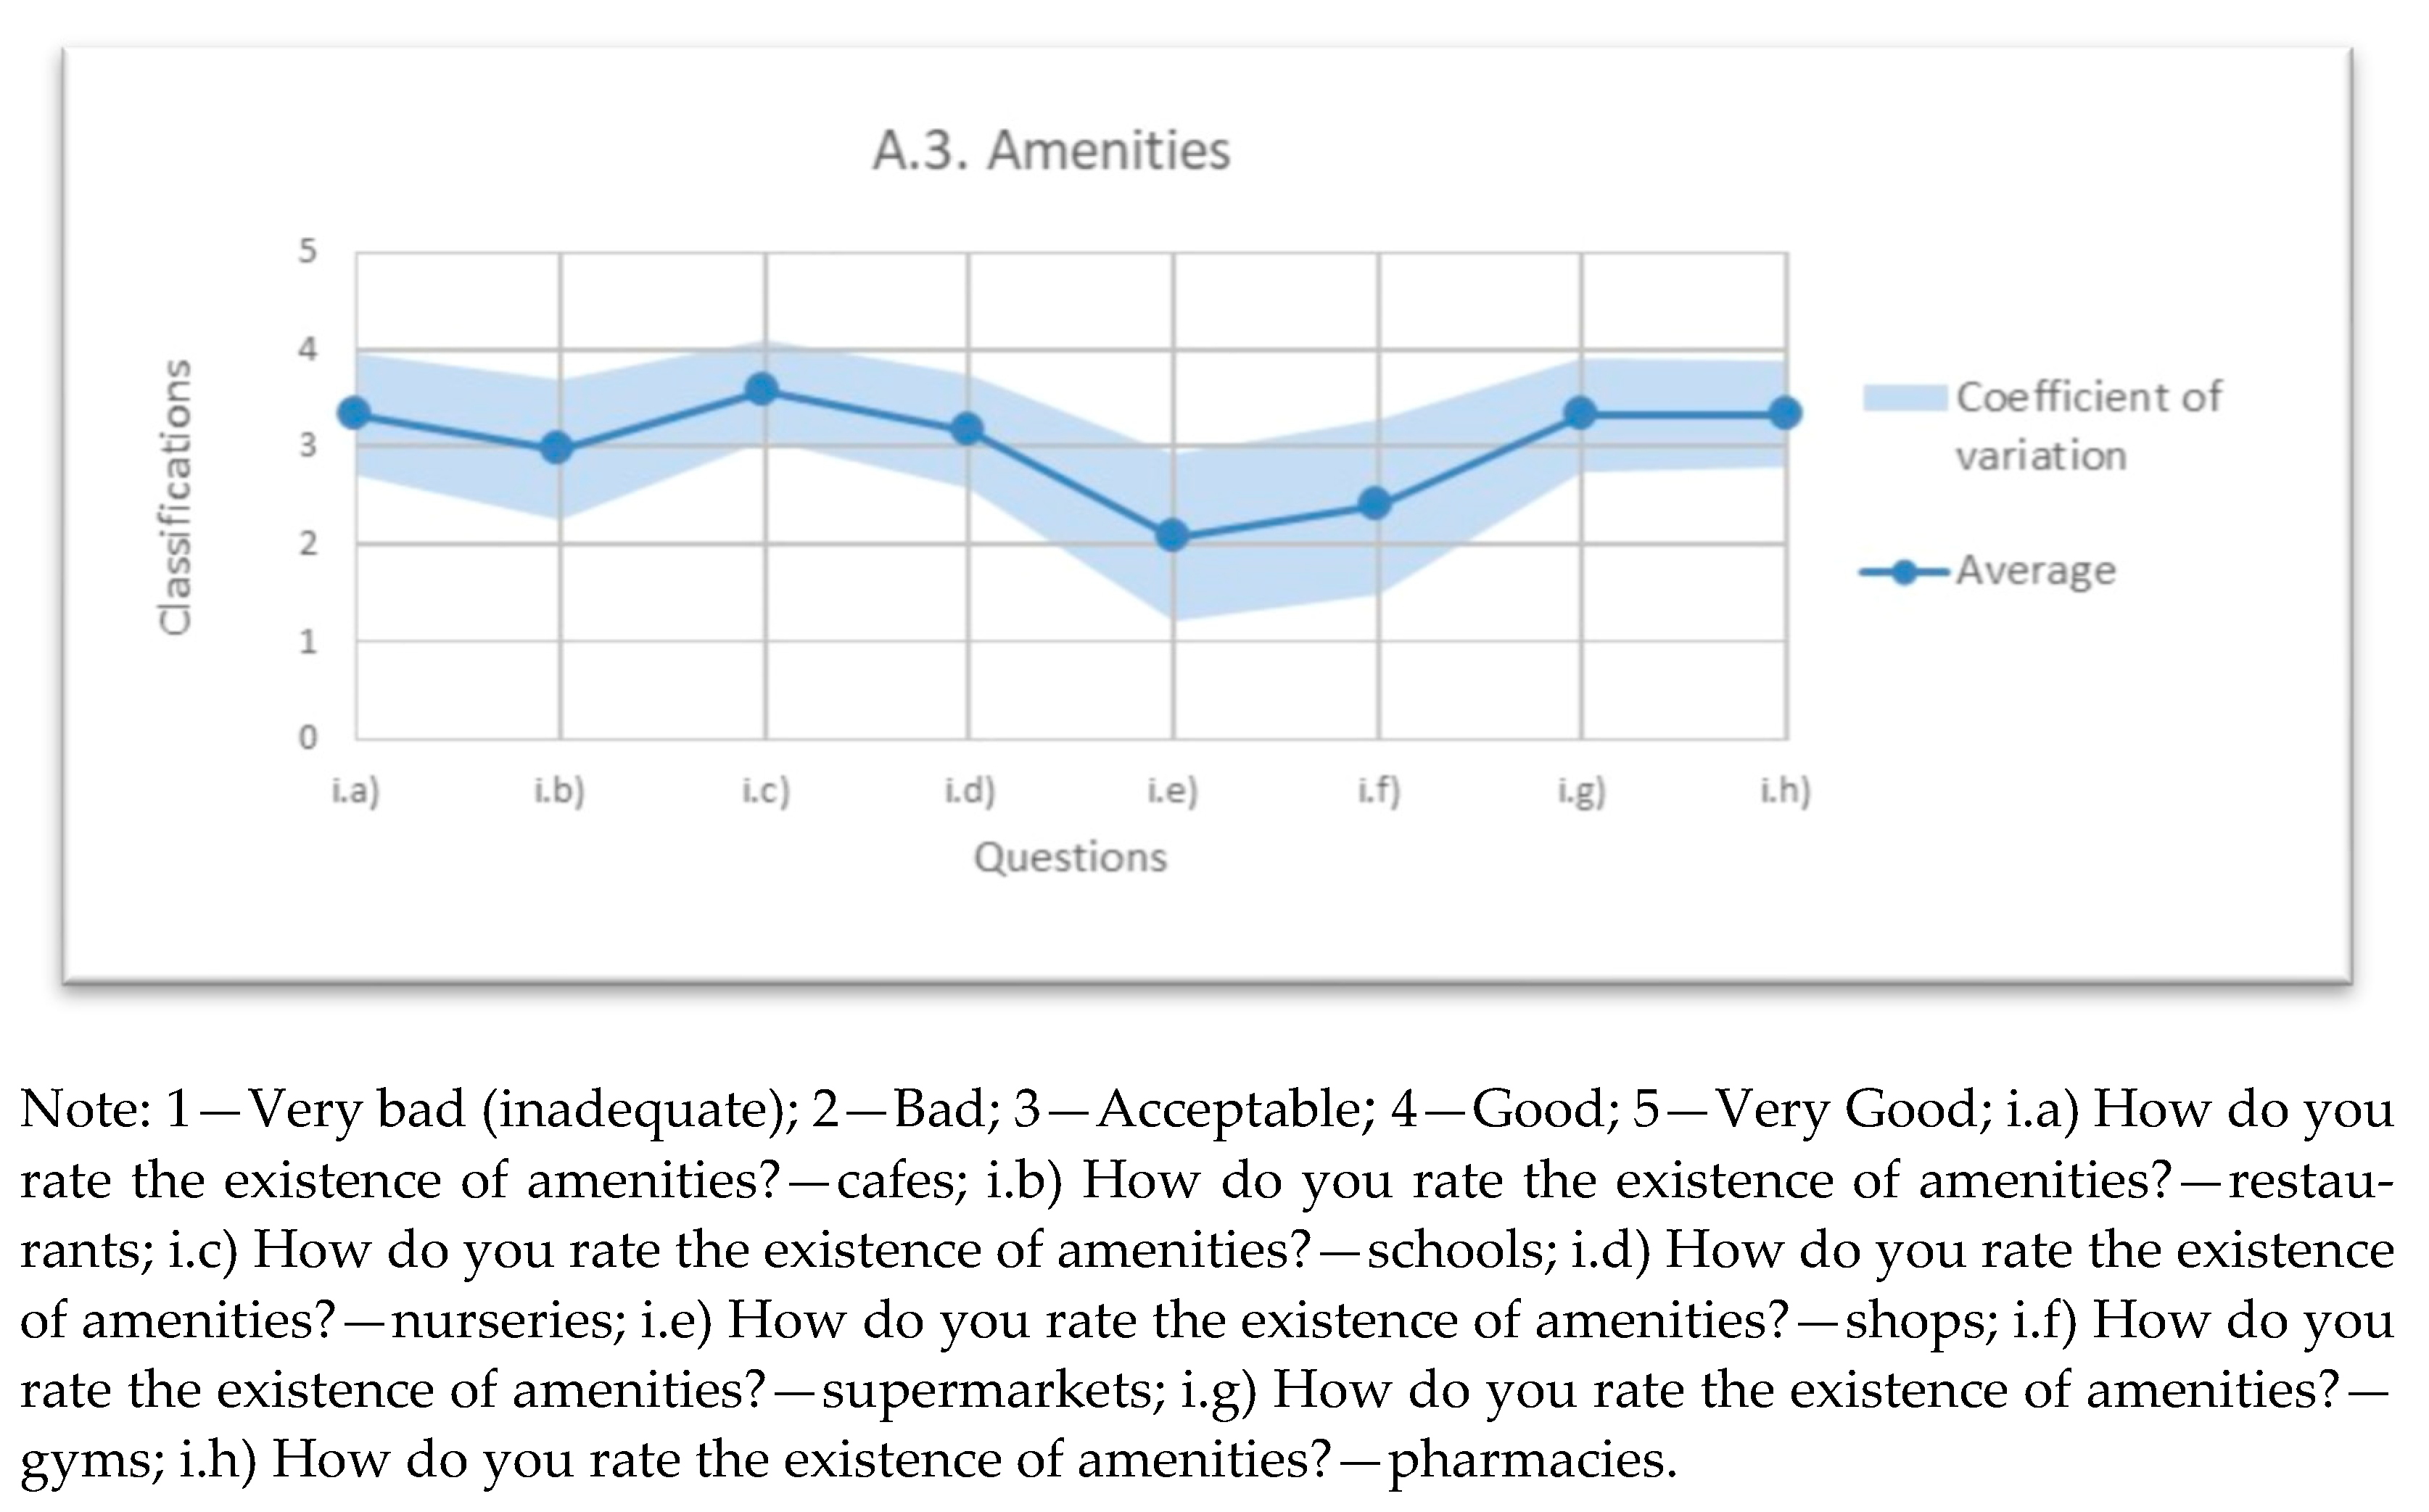
3.10. Exterior Amenities
Figure 10 reveals user dissatisfaction regarding some specific amenities. It is assumed that some of the aspects obtained lower ratings, not because they were lacking but due to unawareness of their existence. The amenities with the worst outcomes, in average ratings and in higher coefficient of variation, are those concerning points: existence of i.e) stores ( = 2.1) and i.f) supermarkets ( = 2.4), with a coefficient of variation of (i.e) stores, CV = 43% and i.f) supermarkets, CV = 45%). This was the group, within the entire study, that received the lowest average ratings. These results highlight the importance of user perception.
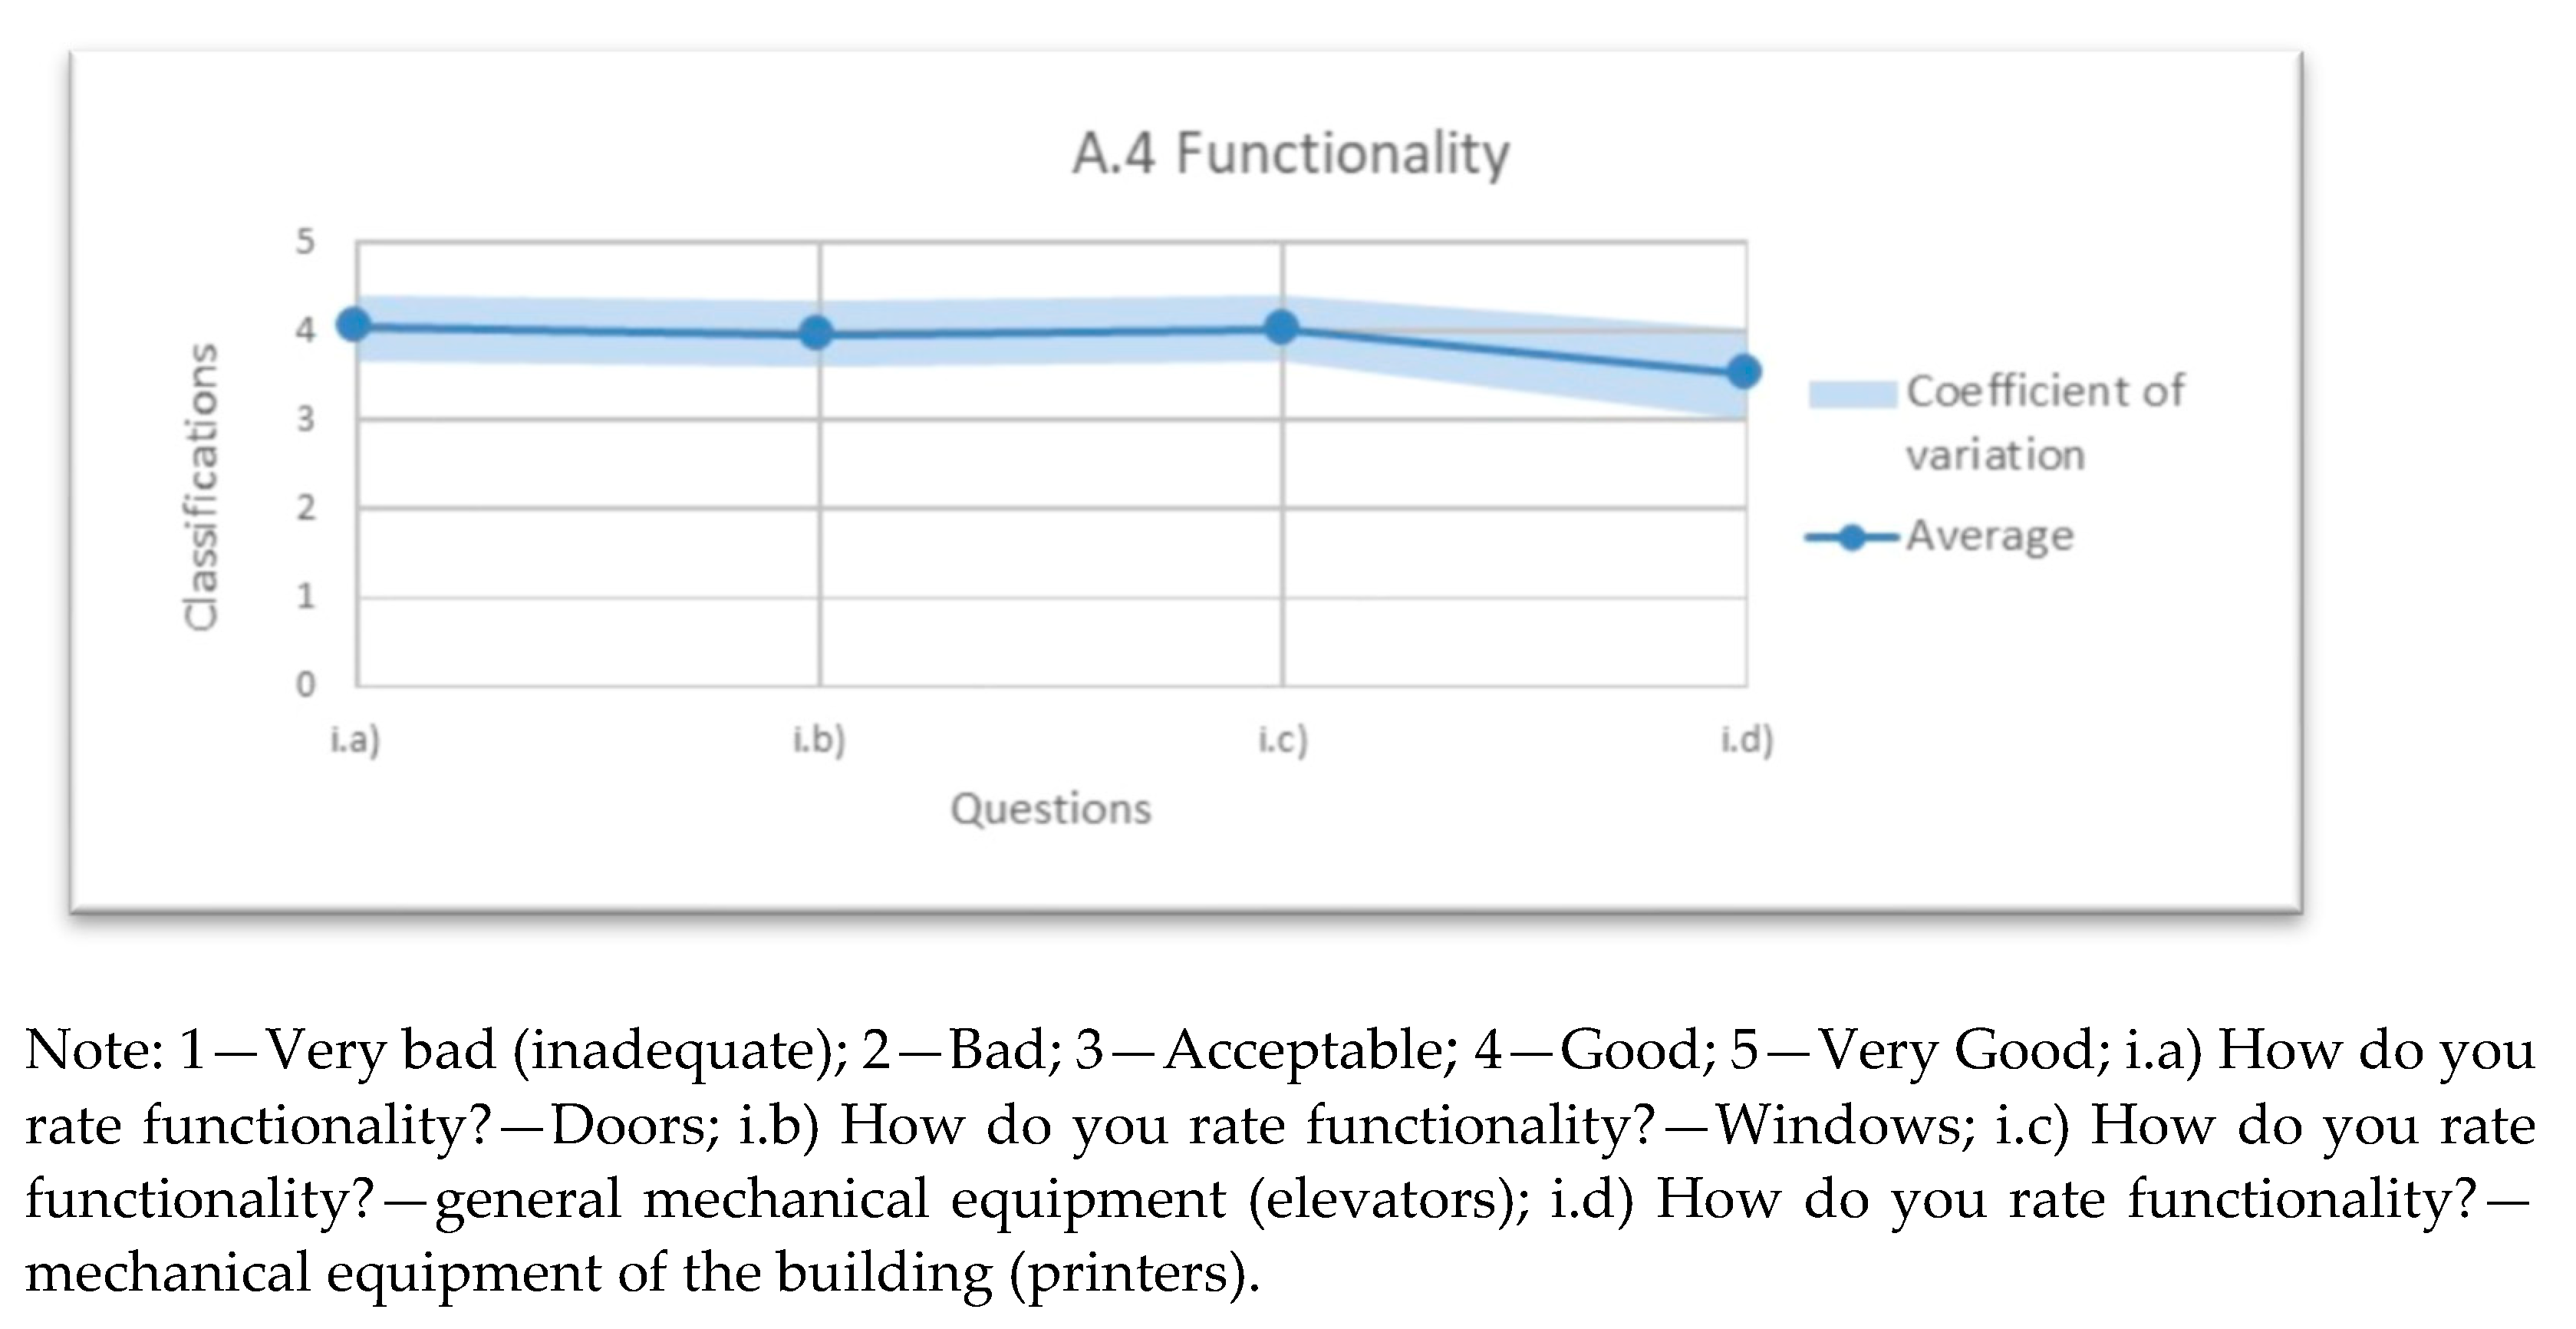
3.11. Functionality
The functionality of the building elements obtained satisfactory responses; the ratings were very close, as can be seen in Figure 11. Only the last question, which refers to the i.d) mechanical equipment of the building (printers) ( = 3.5), obtained a lower average rating, but this is nonetheless acceptable.
3.12. Adaptability
Globally, this question can be considered an aspect that summarizes the general characteristics of the entire building. An average rating of 3.9 is obtained, which is considered to be a good evaluation. Thus, it can be assumed that the overall result is satisfactory. A chart in this group is not available because only one question was raised. Therefore, Table 3 reveals the individual results regarding this question.
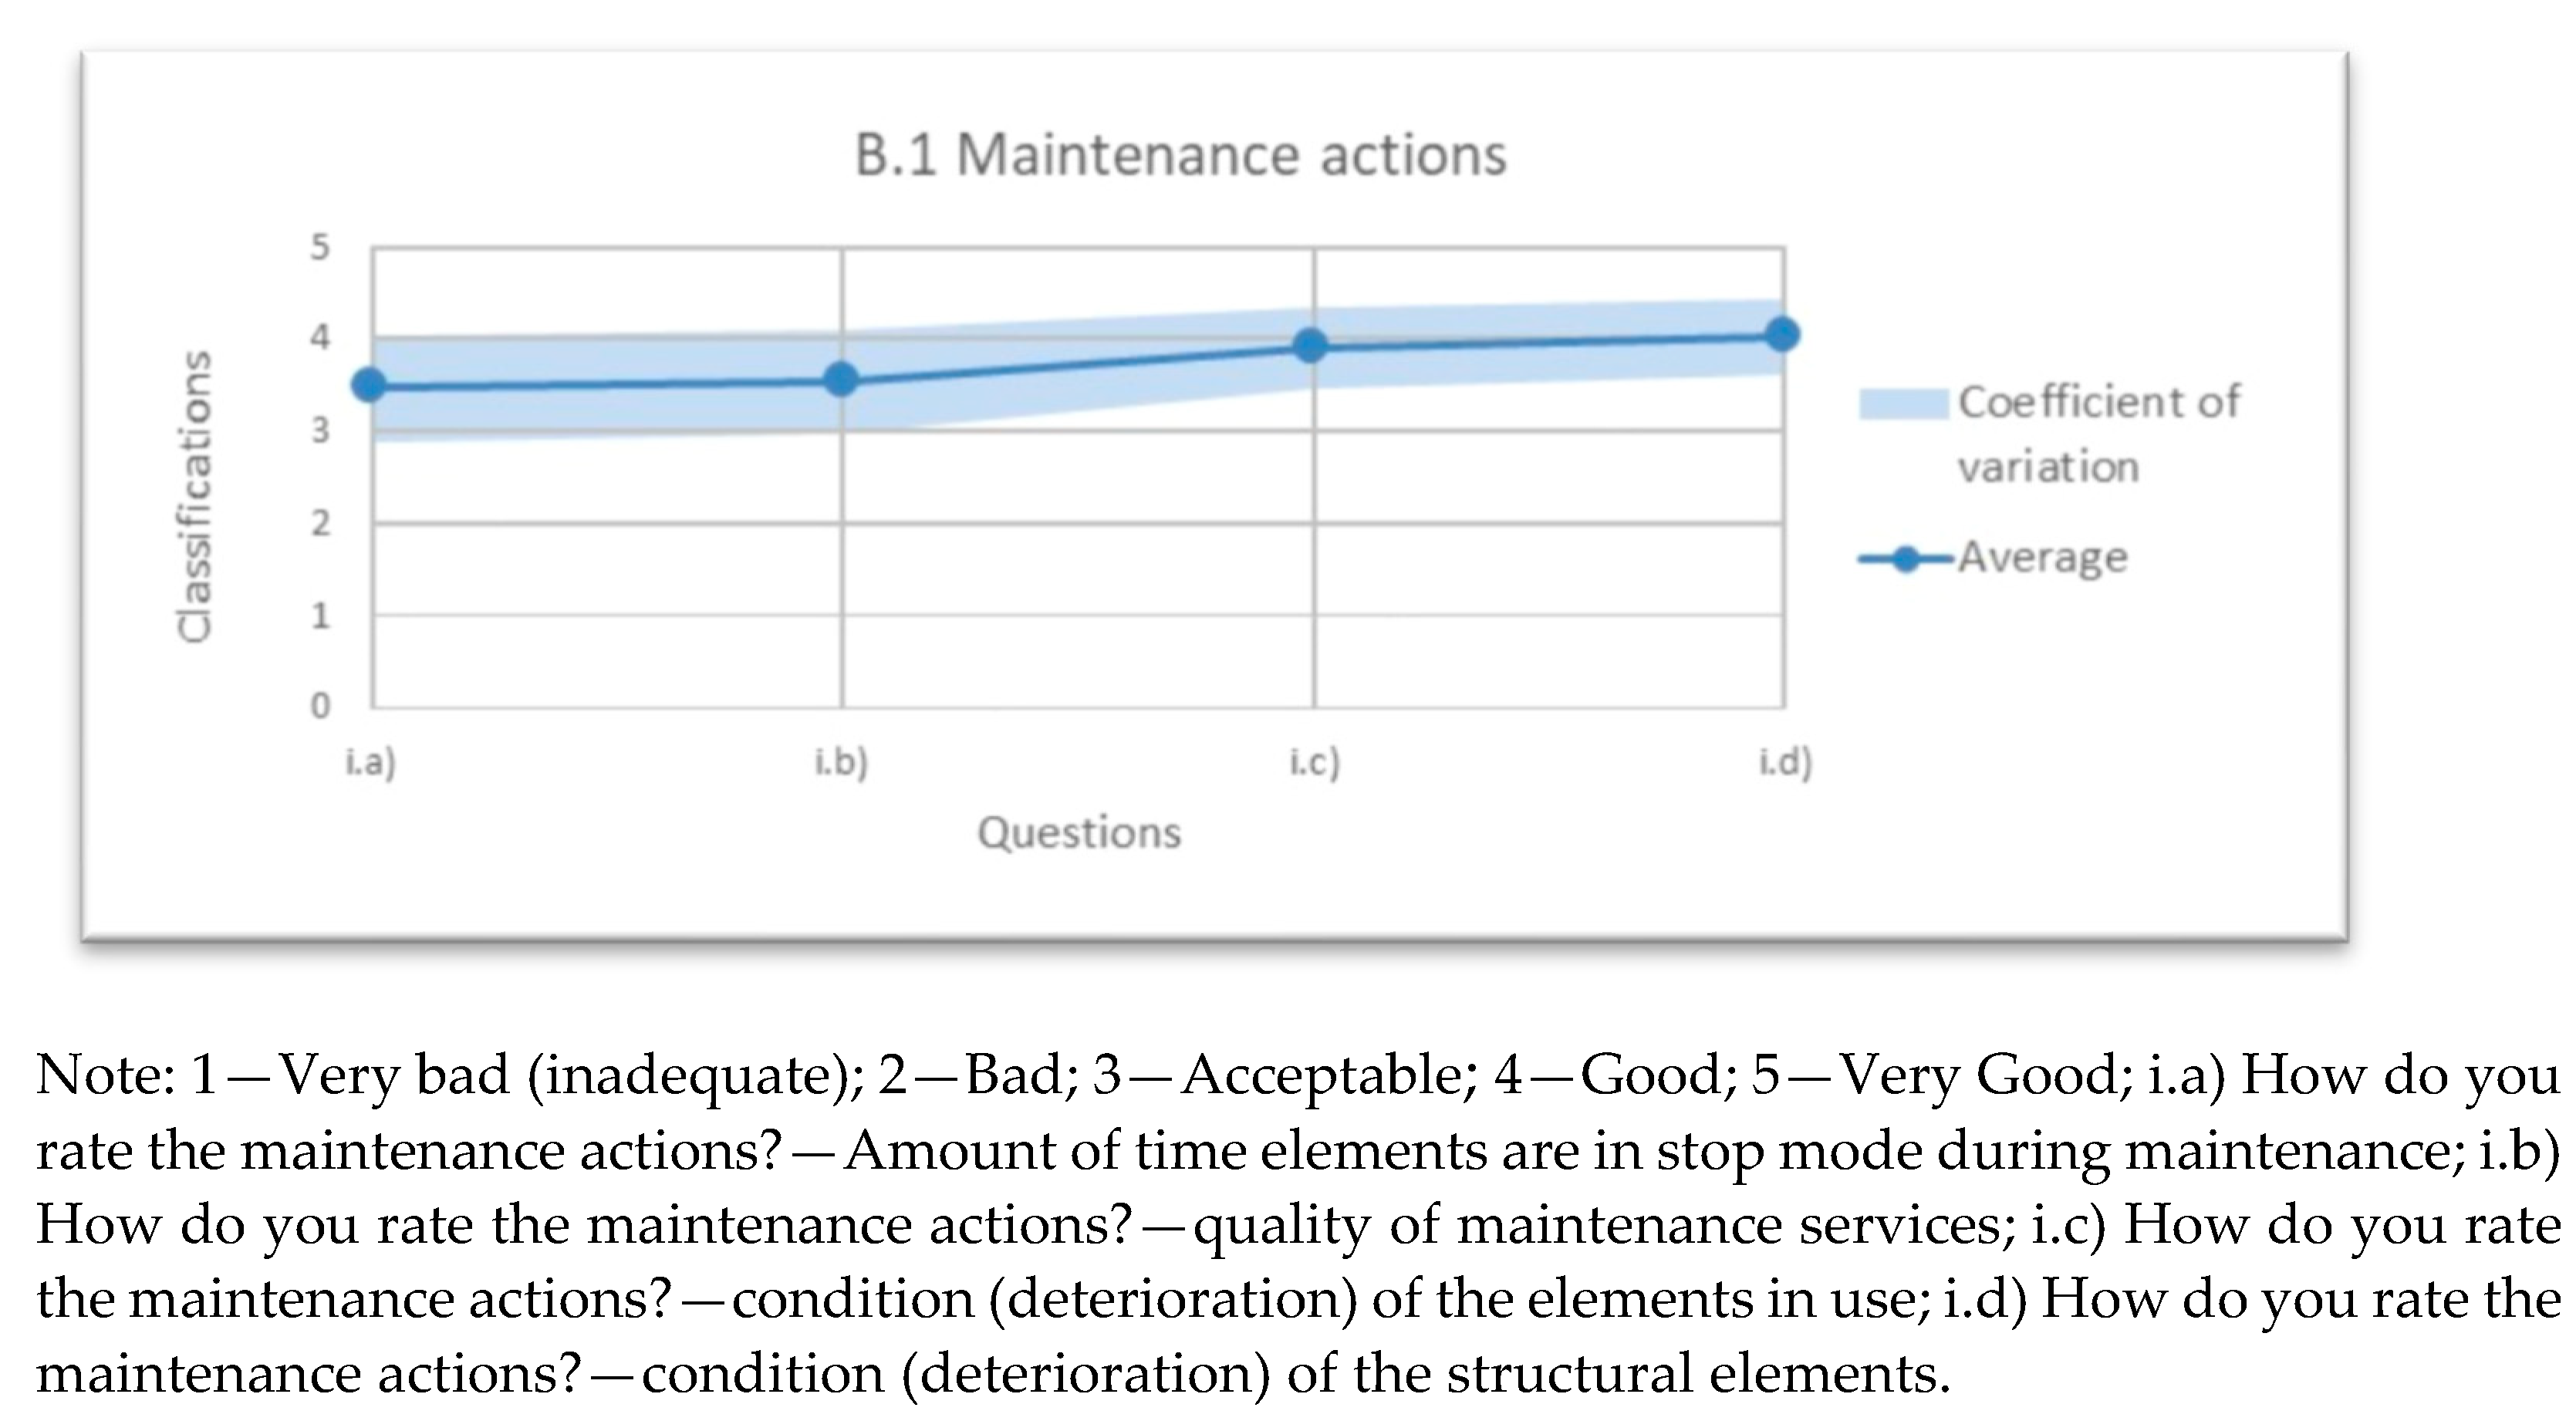
3.13. Maintenance Actions
According to Figure 12, the rating for the first question is lower when compared to the other results. The number of time elements in stop mode during maintenance, ( = 3.5) can be characterized by a higher coefficient of variation and lower average ratings. However, these results seem to be acceptable. The last two paragraphs have more satisfactory ratings (i.c) condition (degradation) of the elements in use = 3.9, i.d), condition (degradation) of the structural elements = 4.0), are considered to be good results.
3.14. Synthesis
Table 4 summarizes the results presented by criterion (totaling 13), which correspond to the average obtained from the ratings of all indicators that comprise each selected criterion. The surveys cannot explicitly determine the value of each performance criterion because other measurement techniques in certain indicators are needed. However, it is possible to draw certain conclusions from the results obtained. This study shows the group with the most favorable average ratings is hygiene ( = 4.39 good–very good). This criterion reveals higher user perception. Therefore, if it is neglected by the facility manager during building usage, it will lead to complaints and discomfort. For that reason, cleaning operations should be included in planned operational and maintenance activities, using skilled personnel and taking into account the different occupancy rates of the building along the day/month/year.
Furthermore, the COVID-19 pandemic redefined the concept of using buildings, making the inclusion of human health crucial [36] and changing user perceptions of workplace hygiene. Thus, this criterion should be developed in future research. Table 1 also shows that the criterion with the least favorable results is the indoor air quality ( = 2.99 bad–acceptable). This is also an important criterion for users, and should be taken into account as a factor in indoor environmental quality (IEQ) evaluation [25,37] and in the decision-making process for interventions during the service life of the building.
4. Conclusions
This study reviewed, analyzed, and synthetized a list of existing buildings KPIs and divided them into three categories of technical, environmental, and economic approaches. Performance indicators revealed that they must to be subject to different assessment techniques: (i) analysis of documentation, (ii) visual inspection, (iii) surveys on user satisfaction, (iv) maintenance team surveys, (v) and testing (laboratory or in situ). The performance evaluation was intended to be limited and focused on obtaining a clear result of what was assessed, and to obtain the most realistic response possible. The study emphasized that it is important to understand which measurement technique is better adapted for indicator assessment, including existing limitations and taking the necessary measures to apply it. The selected measurement techniques from a literature review are not always easy to apply in real life operation conditions, because evaluation indicators need further study and suitable technology for measurements, and more comprehensive knowledge, particularly regarding laboratory work and applying formulas. In addition, more complex and reliable statistical tools need more data, which is difficult to collect due to the lack of records and implemented methodologies with this purpose.
Users are the key in evaluating the performance of a building, despite the inherent subjectivity, because they help to choose suitable KPIs for specific real use conditions of buildings. Therefore, users’ surveys can contribute to the interactive process of in-service performance assessment, adding value to design and management of building issues.
In this study, 13 performance indicators were selected to assess the user perception during the usage of an office building. Through the fieldwork, 77 responses were obtained and user satisfaction was discussed based on simple statistical tools (average, variation, and Student’s t-tests). Survey results showed that hygiene was the most recognizable influence on users’ satisfaction indicators and indoor air quality was less well-known according to the assessment results.
This assessment was based on the users’ survey. Although sectorial, such a survey can be useful for organizations to understand the main existing problems, when a lower rating appears to most often lead to complaints and discomfort. It also permits organizations to achieve a building performance rating based on the perspectives presented, which may be reflected in increased user satisfaction, more targeted and efficient maintenance, and a reduction in the use of resources. By monitoring performance ratings, it is also possible to understand the current state of an office building in usage conditions, aiding professionals and rethinking new ways of working in benchmarking processes.
Moreover, further research should be carried out for post-COVID-19 conditions, because user perception and workplace usage are changing and will require new approaches to hygiene and indoor air quality of in-service buildings.
Author Contributions
Conceptualization, T.P. and I.F.-C.; methodology, T.P.; investigation, T.P. and I.F.-C.; validation: I.F.-C.; M.D.P. writing-review and editing, I.F.-C. and S.M.S. All authors have read and agreed to the published version of the manuscript.
Funding
This research received no external funding.
Data Availability Statement
Data from the master thesis of the first author, available if requested.
Acknowledgments
The authors gratefully acknowledge the support of CERIS Research Institute, Instituto Superior Técnico, Universidade de Lisboa.
Conflicts of Interest
The authors declare no conflict of interest.
References
- De Wilde, P. Ten questions concerning building performance analysis. Build. Environ. 2019, 110–117. [Google Scholar] [CrossRef]
- Foliente, G. Developments in performance-based building codes and standards. Forest Prod. J. 2000, 50, 12–21. [Google Scholar]
- Gross, J. Developments in the application of the performance concept in building. In Proceedings of the CIB-ASTM-RILEM 3rd International Symposium-Applications of the Performance Concept in Building, Tel-Avive, Israel, 9–12 December 1996; pp. 1–11. [Google Scholar]
- ASTM. Building Performance: Functional Preservation and Rehabilitation; ASTM Special Publication 901; American Society for Testing Materials: Philadelphia, PA, USA, 1986. [Google Scholar]
- VTTProP. Eco Prop Software and VTT ProP Classification. 2004. Available online: http://cic.vtt.fi/eco/e_index.htm (accessed on 11 March 2021).
- ISO. Performance Standards in Buildin-Principles for Their Preparation and Factors to be Considered; ISO 6241; International Organization for Standardization: Geneva, Switzerland, 1984. [Google Scholar]
- Silva, V. Sustainability indicators for buildings: State of the art and challenges for development in Brazil. Ambiente Construído (Built Environ. J.) 2008, 7, 1. (In Portuguese) [Google Scholar]
- Neely, A. Business Performance Measurement: Theory and Practice; Cambridge University Press: Cambridge, UK, 2002. [Google Scholar]
- Szigeti, F.; Davis, G. Performance Based Building: Conceptual Framework—Final Report; Performance Based Building Thematic Network: Rotterdam, The Netherlands, 2005. [Google Scholar]
- Ang, G.; Wyatt, D.; Hermans, M. A systematic approach to define client expectation to total building performance during the pre-design stage. In Proceedings of the CIB 2001 Triennal World Congress-Performance-Based (PeBBu) Network, Toronto, ON, Canada, Ocotber 2001. [Google Scholar]
- Blyth, A.; Worthing, J. Managing the Brief for Better Design; Span Press: London, UK, 2001. [Google Scholar]
- Gibson, E. Coordinator, CIB Working Commission W060. Working with the Performance Approach in Building; CIB W060. CIB State of Art Report No.64; CIB: Rotterdam, The Netherlands, 1982. [Google Scholar]
- Gregor, W.; Then, D. Facilities Management and Business of Space; Arlond: London, UK, 1999; A member of the holder headline group. [Google Scholar]
- Nilsson, N.; Cole, R.J. Context, History and Structure. In Proceedings of the GBC ‘9: Green Building Challenge ’98, Vancouver, BC, Canada, 26–28 October 1998; pp. 15–25. [Google Scholar]
- LEED. LEED Commercial Interiors. 2009. Available online: http://www.leeduser.com/ (accessed on 11 March 2021).
- Pinheiro, M. LiderA—Leading the environment in the search of sustainability-Presentation Summary of Voluntary Sustainability Assessment System in Constructio-Version Built Environments (V2.00b). Available online: http://www.lidera.info (accessed on 11 March 2021).
- Larsson, N. User Guide to the SBTool Assessment Framework; iiSBE; 2015; Available online: http://www.iisbe.org/system/files/SBTool%20Overview%2004May15.pdf (accessed on 11 March 2021).
- Mateus, R.; Bragança, L. Sustainability assessment of an affordable residential building. In Proceedings of the Portugal SB10: Sustainable Building, Coimbra, Portugal, 17–19 March 2010; pp. 581–589. [Google Scholar]
- Lay, M.C.; Reis, A.T. The Role of communal open spaces in the performance evaluation of housing. Built Environ. 2002, 2, 25–39. [Google Scholar]
- Cooper, I. Post-occupancy evaluation—Where are you? Building Research and Information. Spec. Issue Post-Occup. Eval. 2001, 29, 158–163. [Google Scholar] [CrossRef]
- EN 15341. Maintenance Key Performance; European Committee for Standardization: Brussels, Belgium, 2019. [Google Scholar]
- Maslesa, E.; Jensen, P.; Birkved, M. Indicators for quantifying environmental building performance: A systematic literature review. J. Building Eng. 2018, 552–560. [Google Scholar] [CrossRef]
- Marmo, R.; Nicotella, M.; Polverino, F.; Tibaut, A. A methodology for a performance information model to support facility management. Sustainability 2019, 11, 7007. [Google Scholar] [CrossRef] [Green Version]
- Bortolini, R.; Forcada, N. Operational performance indicators and causality analysis for non-residential buildings. Informes Constr. 2020, 72. [Google Scholar] [CrossRef]
- Antoniadou, P.; Kyriaki, E.; Manoloudis, A.; Papadopoulos, A. Evaluation of thermal sensation in office buildings: A case study in the Mediterranean. Procedia Environ. Sci. 2017, 38, 28–35. [Google Scholar] [CrossRef]
- Naspi, F.; Asano, M.; Zampetti, L.; Stazi, F.; Rever, G.M.; DÓrazio, M. Experimental study on occupants’ interaction with windows and lights in Mediterranean offices during the non-heating season. Build. Environ. 2018, 127, 221–238. [Google Scholar] [CrossRef]
- Wang, W.; Arya, C. Effect of high-performance facades on heating/cooling loads in London, UK office buildings. Proceedings of the Institution of Civil Engineers. Eng. Sustain. 2020, 173, 135–150. [Google Scholar] [CrossRef]
- EN 15221-7. Facility Management Part 7: Guidelines for Performance Benchmarking; European Committee for Standardization: Brussels, Belgium, 2012. [Google Scholar]
- ISO 15686-5. Building and Constructed Assets. In Service Life Plannin-Part 5: Life-Cycle Costing; International Organization for Standardization: Geneva, Switzerland, 2017. [Google Scholar]
- CIB. Usability of Workplaces Report on Case Studies; CIB Report, publication 306; CIB: Rotterdam, The Netherlands, 2005. [Google Scholar]
- Hartkopf, V.; Loftness, V.; Drake, P.; Dubin, F.; Mill, P.; Ziga, G. Designing the Office of the Future: The Japanese Approach to Tomorrow’s Workplace; Jonh Wiley & Sons, Inc.: New York, NY, USA, 1993. [Google Scholar]
- Flores-Colen, I. Methodology for Assessing the Performance of Walls Plastered Service from the Perspective of Predictive Maintenance. Ph.D. Thesis, University of Lisbon—IST, Lisbon, Portugal, 2009. Volume 1, 487p. (In Portuguese). [Google Scholar]
- BREEAM. BRE Environmental & Sustainability—BREEAM Offices 2008 Assessor Manual. BRE Global Ltd. Available online: http://www.breeam.org/ (accessed on 20 April 2008).
- Maurício, F. The Application of Facility Management Tools to Office Building’s Technical Maintenance. Master’s Thesis, University of Lisbon—IST, Lisbon, Portugal, 2011; 105p. (In Portuguese). [Google Scholar]
- France, J.R. Final Report of the Task Group 4: Life Cycle Costs in Construction; BATIMAT European Expert Workshop; ACE (Architect Council of Europe): Paris, France, 2005; pp. 4–6. [Google Scholar]
- Hakovirta, M.; Denuwara, N. How COVID-19 Redefines the Concept of Sustainability. Sustainability 2020, 12, 3727. [Google Scholar] [CrossRef]
- Ribeiro, C.; Ramos, N.; Flores-Colen, I. A review of balcony impacts on the indoor environmental quality of dwellings. Sustainability 2020, 12, 6453. [Google Scholar] [CrossRef]
Figure 1.
Hierarchy of concepts that are considered in the performance of a building.

Figure 2.
Average ratings of hygrothermal conditions.

Figure 3.
Average ratings of acoustic comfort.

Figure 4.
Average ratings of lighting and visual aspects.

Figure 5.
Workspace.

Figure 6.
Average ratings of indoor air quality.

Figure 7.
Average ratings of comfort touch.

Figure 8.
Average ratings of hygiene.

Figure 9.
Average ratings of accessibility.

Figure 10.
Average ratings of exterior amenities.

Figure 11.
Average ratings of functionality.

Figure 12.
Average ratings of maintenance actions.


| Criterion | [4] | [5] | [6] | [14] | [15] | [16] | [17] | [18] | [30] | [31] | [33] |
|---|---|---|---|---|---|---|---|---|---|---|---|
| Technical properties | |||||||||||
| Mechanical and structural | x | x | x | x | |||||||
| Physical and chemical | x | x | x | x | x | ||||||
| Ventilation | x | x | x | x | x | X | x | x | x | x | |
| Durability | x | x | x | x | x | x | |||||
| Fire safety | x | x | x | x | x | x | |||||
| Structural safety | x | x | x | x | |||||||
| Maintenance | |||||||||||
| Operation and services | x | x | x | x | x | ||||||
| Usage properties | |||||||||||
| Hygrothermal | x | x | x | x | x | x | X | x | X | x | x |
| Acoustic | x | x | x | x | x | x | x | x | x | x | |
| Lighting | x | x | x | x | x | x | x | x | x | x | x |
| Indoor air quality | x | x | x | x | x | x | x | x | x | x | |
| Comfort touch and visual | x | x | x | x | x | ||||||
| Spatial aspects | x | x | x | ||||||||
| Dynamic | x | x | x | x | |||||||
| Hygiene | x | x | x | x | x | x | x | ||||
| Accessibility | x | x | x | x | |||||||
| Outdoor amenities | x | x | x | x | x | x | |||||
| Functionality | x | x | |||||||||
| Adaptability | x | x | x | x | x | x | x | x | x | ||
| Usage security | x | x | x | x | x | x | |||||
| Environment | |||||||||||
| Biodiversity | x | x | x | x | x | ||||||
| Resources | x | x | x | x | x | x | x | ||||
| Pollution | x | x | x | x | x | x | x | x | |||
| Economic | |||||||||||
| Costs/LCC | x | x | x | x | x | ||||||
Table 2.
Average ratings of dynamics—vibration.
| A.1.7. | DYNAMICS | |||||||||||||||||
|---|---|---|---|---|---|---|---|---|---|---|---|---|---|---|---|---|---|---|
| Question | i. “How Do You Rate the Intensity of Factors of Existing Vibration?” | |||||||||||||||||
| br | i | na/dk | 1 | 2 | 3 | 4 | 5 | ni | nic | m | cv | tstd | Significance p (tstd < tcrit) | |||||
| a) | 1 | - | 4 | 0 | 4 | 10 | 23 | 35 | 77 | 72 | 4.2 | 4.0 | 5 | 0.9 | 21% | 0.21 | 0.0 | [4.0; 4.4] |
Note: a) building inside; br—number of blank answers; i—number of invalid responses; na/dk—not applicable/do not know; 1—Very poor (inadequate); 2—Bad; 3—Acceptable; 4—Good; 5—Very Good; ni—number of inquiries answered; nic—number of surveys obtained with rating (1–5); —average; —median; m—mode; σ—standard deviation measuring the dispersion of the values obtained from the average; CV—Coefficient of variation; tstd—value obtained when tested with Student’s t distribution; tcrit − tcrit = 1.99 for 80 degrees of freedom and a significance level of 0.05, for 95% confidence level; [ − tstd; + tstd]—expected range of results.
Table 3.
Average ratings of adaptability.
| A.5. | ADAPTABILITY | |||||||||||||||||
|---|---|---|---|---|---|---|---|---|---|---|---|---|---|---|---|---|---|---|
| Question | i. “How Do You Rate the Building in Terms of Usage Satisfaction?” | |||||||||||||||||
| br | i | na/ns | 1 | 2 | 3 | 4 | 5 | ni | nic | m | cv | tstd | Significance p (tstd < tcrit) | |||||
| a) | - | - | - | 0 | 1 | 20 | 40 | 16 | 77 | 77 | 3.9 | 3.4 | 4 | 0.72 | 18% | 0.16 | 0.0 | [3.8; 4.1] |
Note: a) General; br—Number of blank answers; i—Number of invalid responses; na/dk—Not applicable/do not know; 1—Very poor (inadequate); 2—Bad; 3—Acceptable; 4—Good; 5—Very Good; ni—number of inquiries answered; nic—number of surveys obtained with rating (1–5); —average; —median; m—mode; σ—standard deviation measuring the dispersion of the values obtained from the average; CV—coefficient of variation; tstd—value obtained when tested with Student’s t distribution; tcrit − tcrit = 1.99 for 80 degrees of freedom and a significance level of 0.05, for 95% confidence level; [ − tstd; + tstd]—expected range of results.
Table 4.
General average results from the survey.
| Criterion | Average of Results | |
|---|---|---|
| 1 | Hygrothermal | 3.93 |
| 2 | Acoustic | 4.19 |
| 3 | Lighting and visual aspects | 3.93 |
| 4 | Indoor air quality | 2.99 |
| 5 | Touch | 4.12 |
| 6 | Space | 3.91 |
| 7 | Dynamics | 4.24 |
| 8 | Hygiene | 4.39 |
| 9 | Accessibility | 3.50 |
| 10 | Exterior amenities | 3.01 |
| 11 | Functionality | 3.88 |
| 12 | Adaptability | 3.92 |
| 13 | Maintenance operations | 3.73 |
Publisher’s Note: MDPI stays neutral with regard to jurisdictional claims in published maps and institutional affiliations. |
© 2021 by the authors. Licensee MDPI, Basel, Switzerland. This article is an open access article distributed under the terms and conditions of the Creative Commons Attribution (CC BY) license (http://creativecommons.org/licenses/by/4.0/).
Share and Cite
MDPI and ACS Style
Pestana, T.; Flores-Colen, I.; Pinheiro, M.D.; Sajjadian, S.M. User Perception on Key Performance Indicators in an In-Service Office Building. Infrastructures 2021, 6, 45. https://doi.org/10.3390/infrastructures6030045
AMA Style
Pestana T, Flores-Colen I, Pinheiro MD, Sajjadian SM. User Perception on Key Performance Indicators in an In-Service Office Building. Infrastructures. 2021; 6(3):45. https://doi.org/10.3390/infrastructures6030045
Chicago/Turabian StylePestana, Teresa, Inês Flores-Colen, Manuel Duarte Pinheiro, and Seyed Masoud Sajjadian. 2021. "User Perception on Key Performance Indicators in an In-Service Office Building" Infrastructures 6, no. 3: 45. https://doi.org/10.3390/infrastructures6030045