
Bi-Linear Bond-Slip Modelling for 1-D Tension Stiffening Behavior of a RC Element

1
National Building Research Institute, Technion-Israel Institute of Technology, Haifa 32000, Israel
2
Faculty of Civil & Environmental Engineering, Technion-Israel Institute of Technology, Haifa 32000, Israel
*
Author to whom correspondence should be addressed.
Infrastructures 2022, 7(10), 125; https://doi.org/10.3390/infrastructures7100125
Submission received: 14 August 2022
/
Revised: 11 September 2022
/
Accepted: 12 September 2022
/
Published: 21 September 2022
(This article belongs to the Special Issue Structural Performances of Bridges)
Abstract
:Cracking is an inherent characteristic of a reinforced-concrete (RC) element subjected to tension or bending. The crack width growth with loading depends on the rebar-concrete bond behavior. RC bridges are designed under strict requirements to ensure their proper long lifetime performance. Limiting the crack widths improves the performance and safety of bridges that are exposed to harsh climatic and environmental effects and enhances bridge service life-cycle expectancy. This paper presents an extended one-dimensional formulation for analyzing RC elements subjected to tensile loads and solves the one-dimensional tension stiffening problem. The extended bond-slip model analyses the entire range of loading, following cracks growth up to their maximum allowed width, employing a bi-linear bond-slip relationship. The analytical solution refers to the early loading stage where the first bond-slip segment governs the entire element and a closed form solution is obtained, followed by the higher loading stage where two different bond-slip relationships govern two complementary segments of the element. Analytical expressions for the stresses, strains, and displacements in concrete, steel, and interface are developed. Cracking is followed until rebar yielding. Validation of the model with available test results shows good agreement that is superior to the commonly used linear bond-slip model.
1. Introduction
Numerous structures are made of reinforced concrete (RC) where reinforcing steel provides tensile strength and ductility. When a RC element is subjected to flexural or to tensile loading, cracks are formed along the element, depending on the concrete tensile properties and the reinforcement properties, amount, and position. Cracking is an important characteristic that affects the stress and strain distribution along a RC element, and it is strongly dependent on the rebar-concrete bond behavior. Performance limit state requirements of different standards require to limit the cracks’ widths. The crack width limit is smaller in cases of severe climatic and environmental conditions and is more critical for important and monumental structures. Hence, bridge design should carefully ensure that the cracks’ widths should not exceed these values to guarantee the required life cycle of a bridge and its performance and avoid damages due to harsh climatic and environmental effects.
This paper deals with an analytical model aiming at calculating the crack width and allowing examination of its growth with loading, depending on different material and geometrical parameters. For that purpose, an extended analytical model is proposed for a one-dimensional (1-D) slender element that is considerably longer than its diameter and is subjected to a constant tensile load. The tensile load is carried by both the concrete and the rebar depending on the rebar-concrete interfacial bond stresses and slips. Thus, at each cross section the concrete and the rebar carry the total load at different portions. The present model considers a slender RC element that is composed of a concrete cylinder or prism of constant cross section area, confining a central reinforcing bar along its axis. Equal tensile forces are applied at the rebar’s ends and affect the RC element elongation. Upon increasing the load’s magnitude, a gradual process of transverse cracking occurs at different locations along the RC element. The interfacial bond between the reinforcing bar and the interior surface of the concrete element governs the tensile stress transmission from the rebar to the concrete and yields variable stresses along the concrete element and the rebar. This participation of the concrete in carrying the overall tension continues throughout the entire loading and affects the element stiffness, and thus is known as tension stiffening. Tension stiffening is therefore a fundamental behavior of reinforced concrete that results from the element geometry and the mechanical properties of the rebar, the concrete, and the interfacial bond-slip relationship. The entire load is applied to the rebar at the element end faces, where the concrete is unstressed, and due to the bond stress along the common interface, the stress in the rebar is decreasing towards the element center, while the stress in the concrete increases accordingly. Assuming homogeneous conditions and considering symmetry, at a certain load level the tensile stress at the central cross section of the concrete element reaches the cracking stress level and a transversal crack occurs at that cross section. Until that stage, there is no slip at the central cross section due to symmetry, and upon cracking two new stress-free concrete surfaces are formed at that cross section. Two identical sub-elements are formed, that are like the original element, but of half-length each; the sub-elements are interconnected by the continuous rebar. A concrete-rebar slip is developed at both sides of the central cross section, which determines the width of the formed crack.
In general, a complete solution of the above-described tension stiffening problem of a cylindrical RC element requires a two-dimensional analysis due to the axial symmetry, and it accounts for the radial stress variation in the concrete element [1,2,3,4]. However, most of the models refer to slender elements with a limited concrete cover, such that the stress variation in the radial direction is minor. Thus, a 1-D model of the problem may reasonably simulate the problem. The analytical formulation of the 1-D problem may be solved easily and yield a closed form solution. Typical experimental studies of uniaxial tension of RC elements mostly monitor the applied load, the total bar elongation [5,6,7,8,9,10,11] and follow the cracking development [12,13,14]. Only a few recent experimental studies on rebar pullout, have introduced extended monitoring systems to provide more insight on the internal characteristics of the bond behavior [15,16]. Therefore, the common major comparison of different models with experimental results focuses on the overall measured force-elongation relationship.
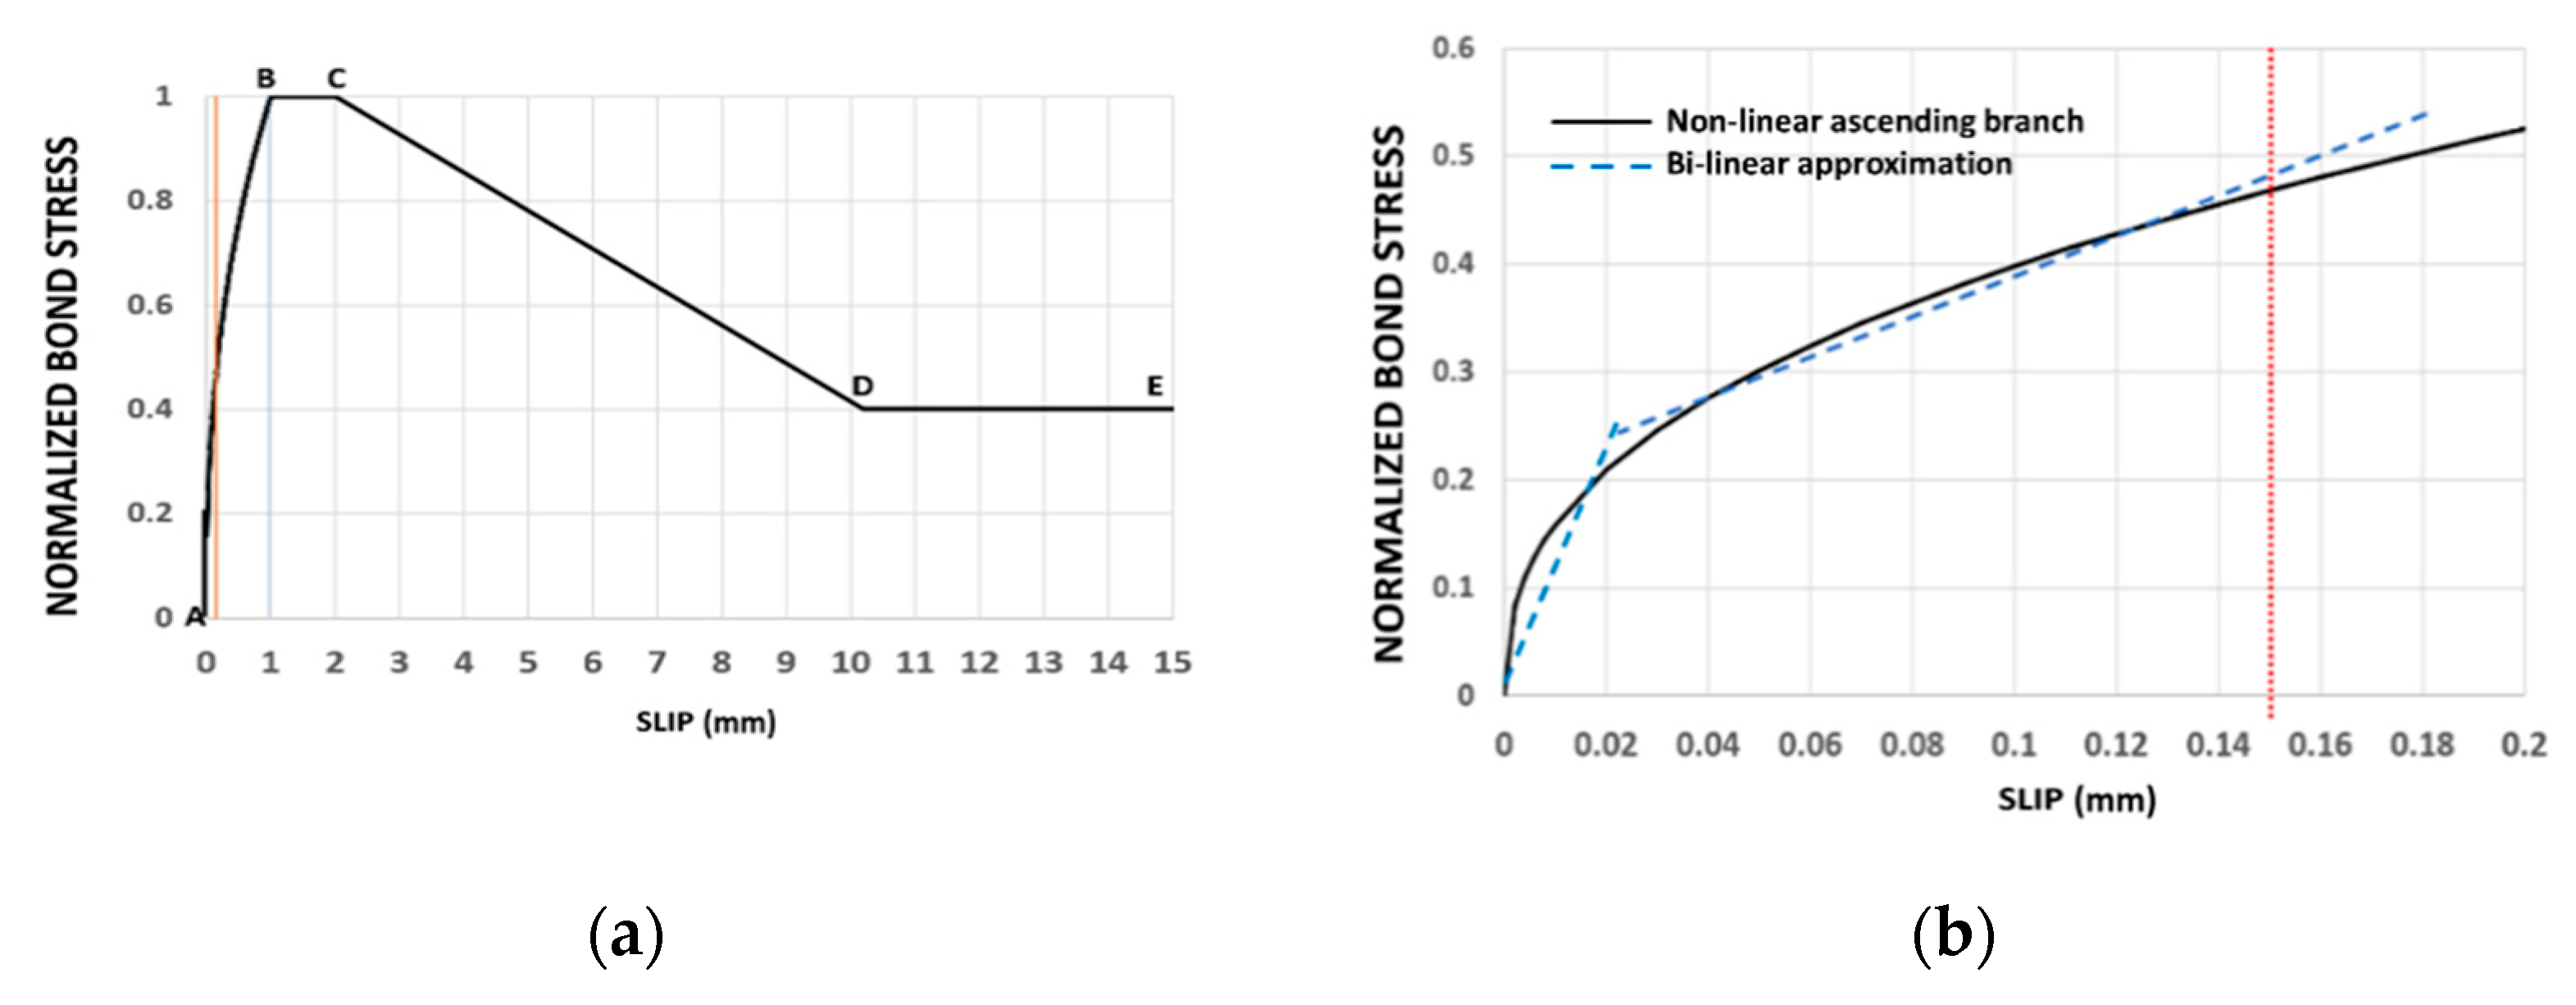
Another result of the tension-stiffening test which is of major importance is the assessment of crack width and its dependence on the loading, but unfortunately the crack width is rarely measured in these tests. This is mainly because the exact location of a crack is unknown in advance, and a short transducer to enable precise crack width measurements cannot be connected to the test specimen a priori. The serviceability limit-states in structural design aim at assuring that a structural element will perform adequately in normal use. One of the limit-states that should be controlled is the crack width, intending to control that it should not exceed the limit value of crack width specified for expected exposure classes. The Fib Model Code 2010 [17] limits the allowable crack width of a structural RC element to 0.2–0.3 mm depending on the exposure conditions. As mentioned above, the crack width is the sum of the rebar slips at both sides of a crack, hence the above crack width criterion is compatible with a maximum slip of 0.1–0.15 mm. Although this slip magnitude is about 10% of the maximum slip developed along the ascending branch of a typical bond-slip curve, it cannot be adequately described by a linear bond-slip relationship; the latter may describe reasonably well the behavior under limited slips only. This slip range that is applicable from the serviceability limit state consideration should be compared with the complete bond-slip relationship that is obtained in pullout tests. The bond-slip curve is described in the Fib Model Code as an idealized four-segment non-linear relationship (Figure 1a) that is composed of: a non-linear ascending branch AB up to a slip of 1 mm, a constant maximum bond stress along a limited slip between 1–2 mm (BC), a descending branch of decreasing bond stress with increasing slip (CD), and a constant residual stress (friction) along DE.
The present model extends the previously published model where a linear bond-slip relationship had been assumed [18]; the present model assumes a bi-linear bond-slip relationship which may represent the nonlinear bond-slip over a larger slip range and better simulate the nonlinear characteristics of the real bond-slip relationship.
The entire bond-slip relationship is required to describe the slip behavior until pullout is reached, however, in the present problem of tension stiffening, slips are limited as the rebar displacement at half-length is always zero. As discussed above, it turns out that a maximum slip of 0.15 mm is sufficient for a complete analysis of the problem. This limited range slip within the ascending branch is marked by the orange line (Figure 1a). A closer view at the slip range of interest is shown in Figure 1b. The pronounced nonlinearity even within that limited slip range is evident. Thus, a bi-linear bond-slip seems appropriate for a simplified close approximation of the real non-linear behavior and it is superior to any linear model. The earlier developed linear bond-slip relationship [18] may reasonably represent the behavior only for small slips and limited crack widths. The linear model [18] presents a set of analytical expressions enabling to calculate the variation of major parameters of the tension stiffening problem along the RC element. These parameters include displacements, strains and stresses in steel and concrete, and the slip and bond-stress, assuming a linear bond-slip relationship. This law may simulate reasonably well the early part of the nonlinear ascending branch of the bond-slip relationship (Figure 1). With increasing slips, the linear model overpredicts the bond stresses and under predicts the overall element elongation, and the need for an advanced bond-slip representation is evident. That is the motivation for the bi-linear bond-slip based model presented herein.
The Fib Model Code [8] calculates the crack width using a simplified average constant bond stress assumption. Other models use the linear bond-slip assumption (e.g., ACI PRC-224-01 [19]) as a mathematically convenient approach. However, the above discussion leads to implementing a bi-linear model to cover the entire relevant range of slips and predict properly the cracks’ widths within the serviceability limit. The bi-linear bond-slip relationship and the extended multi-linear bond-slip model have been suggested [20,21] and employed via an exact finite-element formulation that allows to apply the appropriate bond-slip law at different levels of loading in a numerical solution. The simplified linear analytical solution shows a good result for the low level of loading [18].
This paper is the further stage of the analytical study that presents an analytical formulation of the 1-D tension stiffening problem using a bi-linear bond-slip relationship. Opposed to the finite-element numerical analysis, the analytical formulation provides closed form expressions for the different variables and allows to gain insight and general conclusions on the behavior that cannot be obtained from any numerical analysis.
2. The Problem
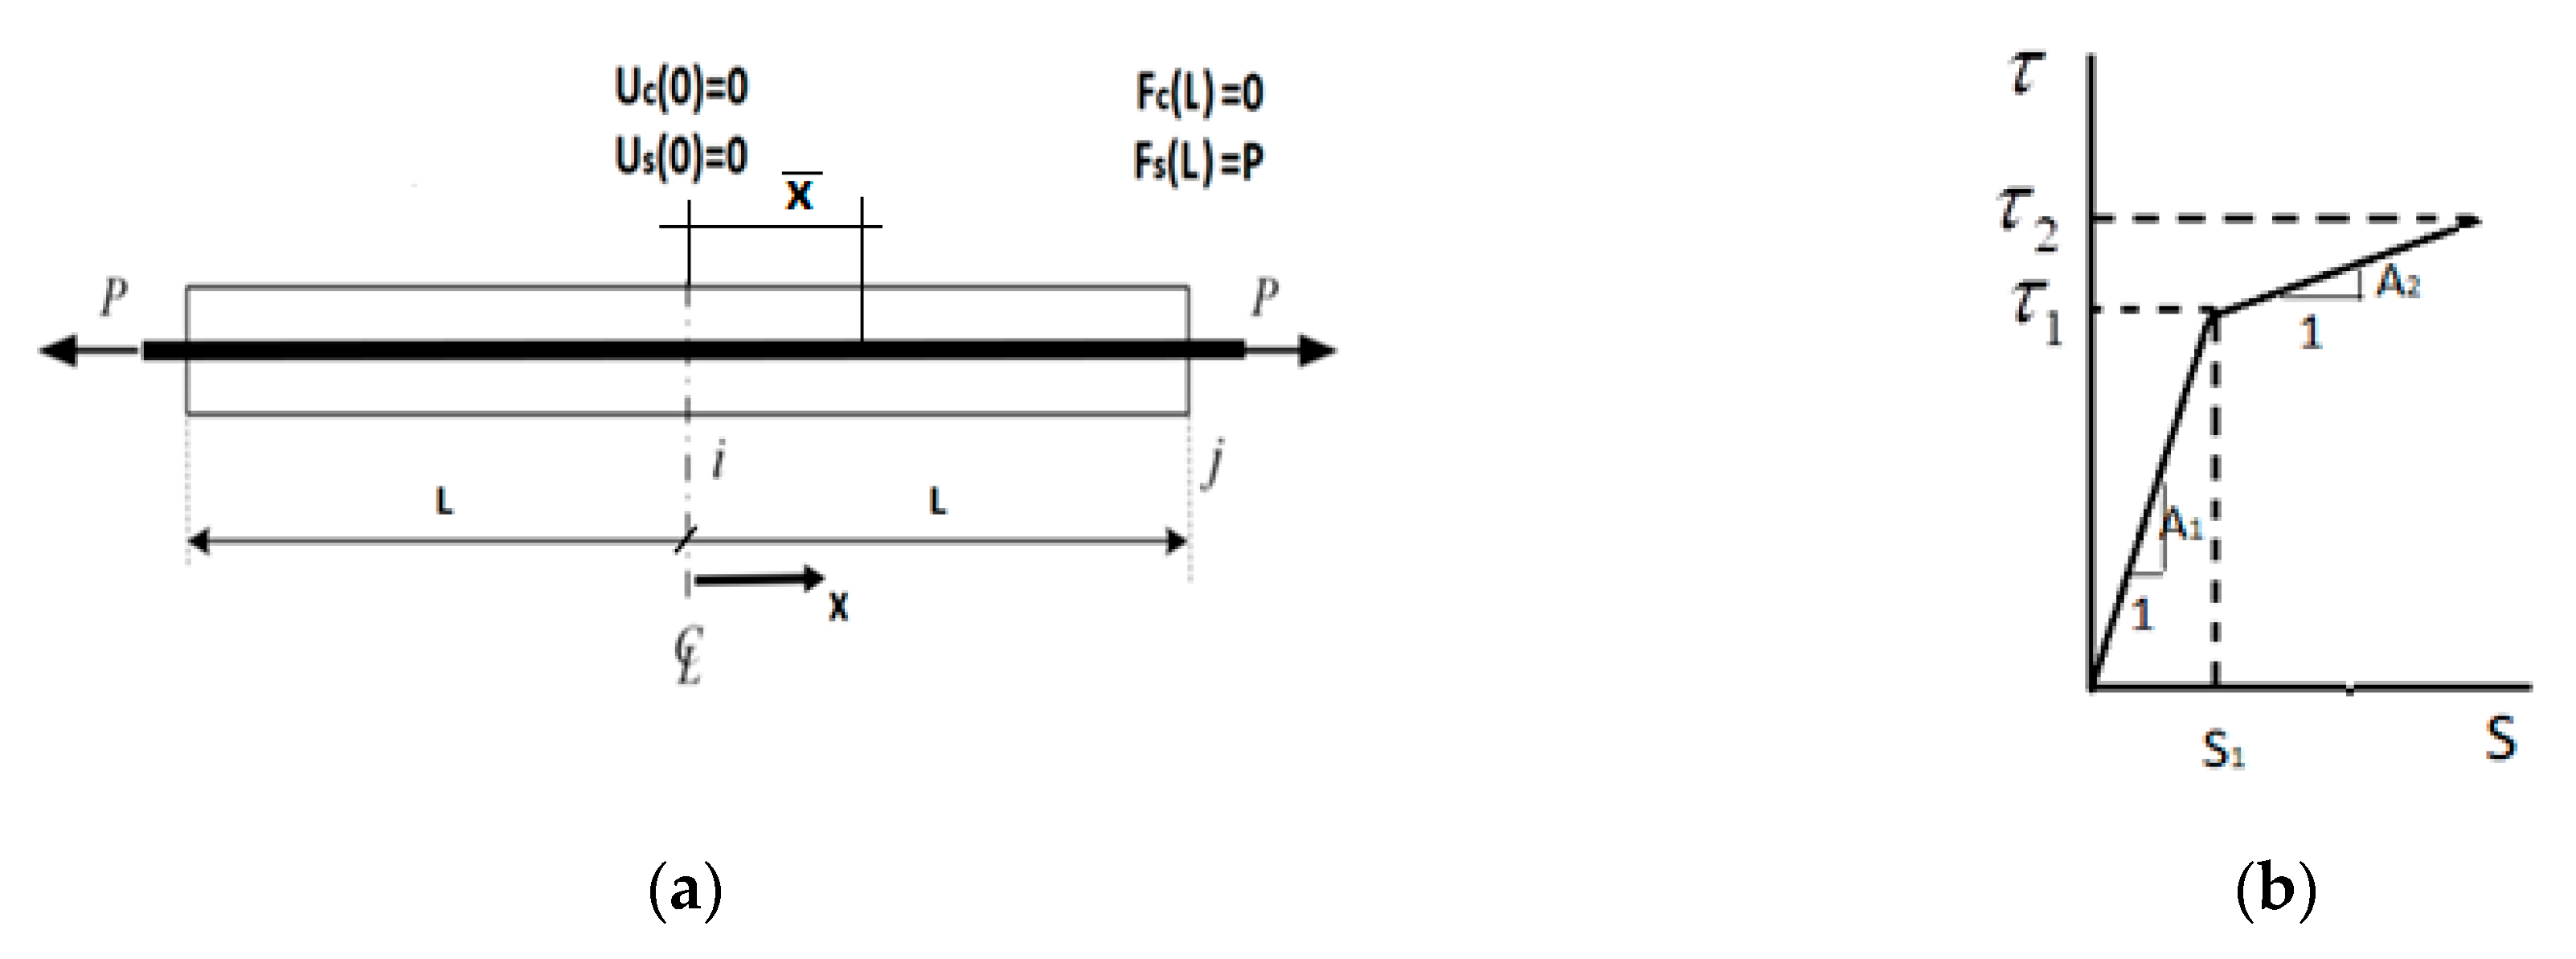
Refer to a RC element of length 2L, having a cross-section area Ac and a diameter Dc of an equivalent cylinder. The element includes a reinforcing bar located along the axis of symmetry, with a diameter Ds and a cross-sectional area As (Figure 2a). A pair of tensile forces P is applied at both ends of the rebar.
It is assumed that the rebar-concrete interface satisfies a bi-linear bond-slip relationship τ(S) (Figure 2b):
The slip S(x) varies with the coordinate x along the element. Due to the element symmetry, the coordinate origin is placed at the central point along the axis, at a distance L away from the element side faces (Figure 2a). The bi-linear relationship is composed of two linear segments. The first segment covers the slip range , where S1 is a slip corresponding to a bond stress τ1 (Figure 2b), joining the first and second linear segments. The second bond-slip segment covers the slip range up to a slip S2 corresponding to a bond stress τ2. The slopes of the linear segments are A1 and A2 as it is shown in Figure 2b.
Basic Assumptions
- It is assumed that the concrete element diameter Dc is several times larger than the rebar diameter Ds such that good confinement conditions exist on the one hand, and that the displacement, strain, and stress fields are insensitive to the radial coordinate and solely dependent on the longitudinal coordinate on the other hand.
- The non-linear bond-slip behavior is idealized by a bi-linear relationship.
- The tensile stress-strain behavior of the steel rebar and the concrete are assumed linear elastic over the entire stress range up to the steel rebar yield stress fsy and concrete cracking stress ft, with Young’s moduli Es and Ec, respectively.
- The material non-linearity is only due to the bond-slip relationship that is idealized by a bi-linear relationship.
- As a 1-D behavior is considered, the Poisson’s effect is disregarded.
3. The Analytical Solution
3.1. Equilibrium Equations
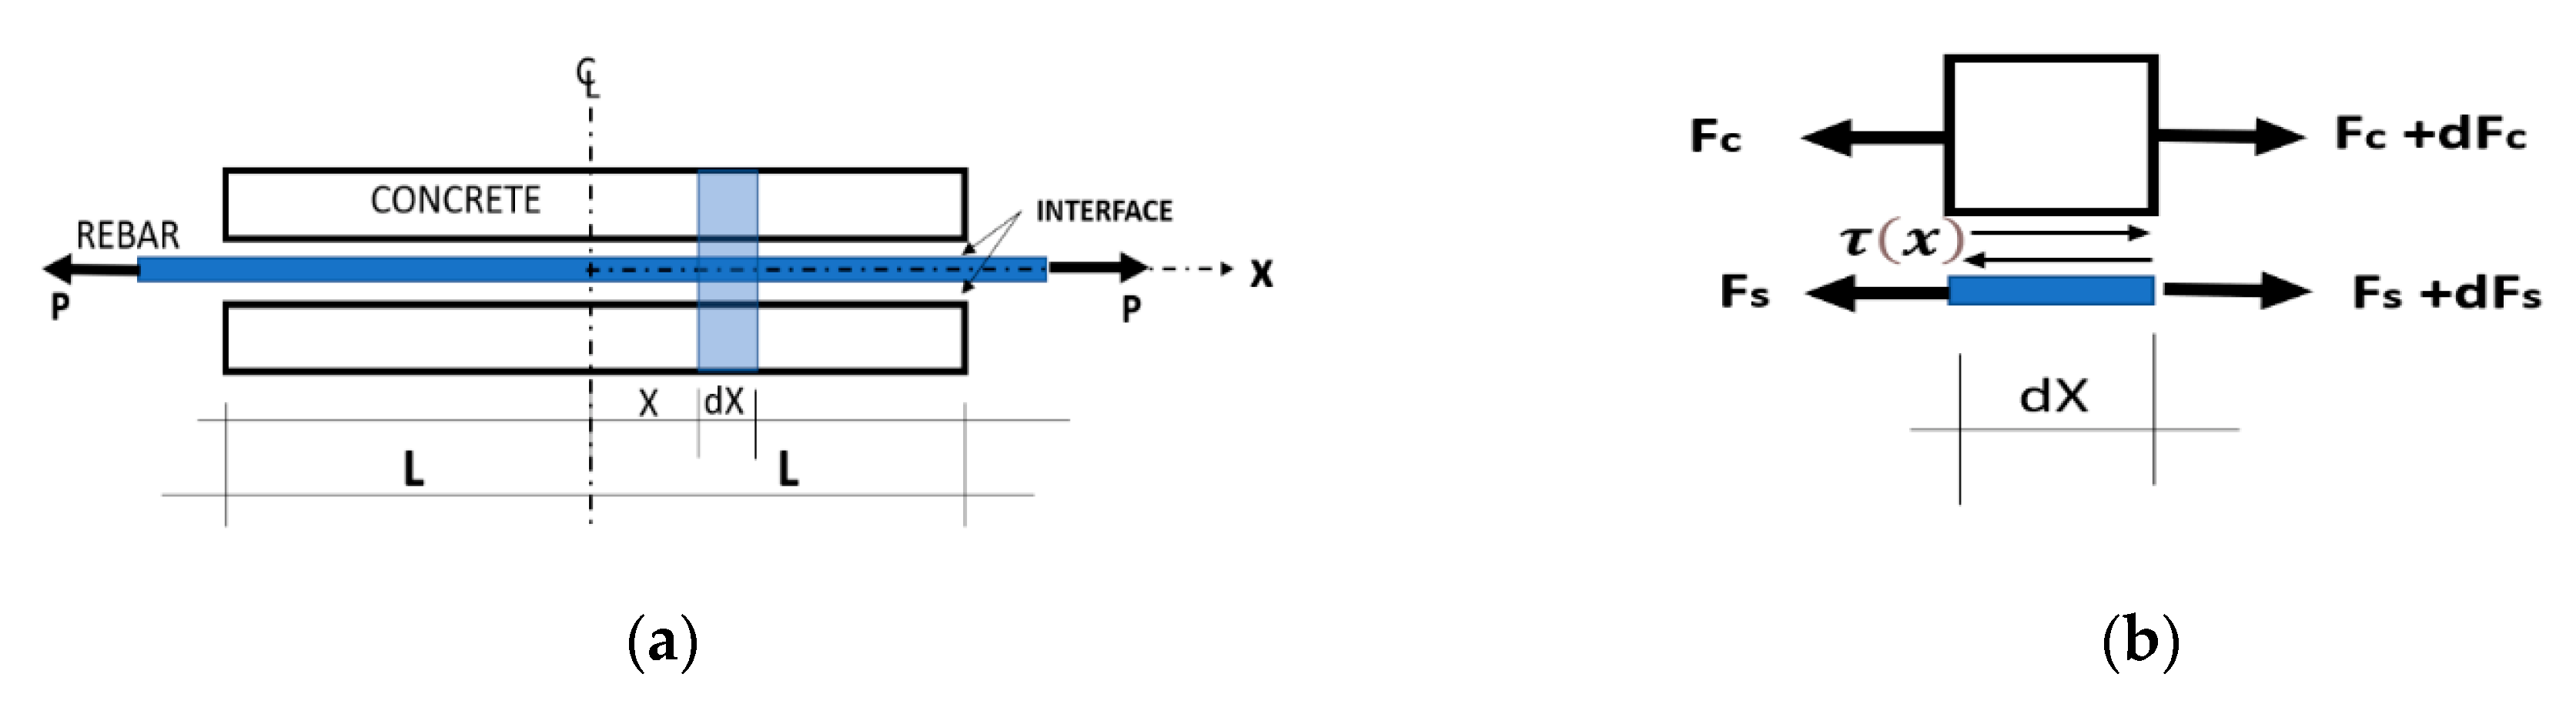
The equilibrium equations have been derived for a differential two-phase element of length dx that consists of the steel rebar, the concrete cover, and the interfacial bond-slip as presented in [18,21,22]. This element may be represented in the form of two free bodies (concrete and rebar) which interaction is given by the unknown interaction bond stress τ(x) acting on the interfacial surfaces (see Figure 3).
The local force is expressed by the local strain, which in turn is expressed as the derivative of the local displacements Uc(x) and Us(x), in the concrete and the steel respectively [21].
The differential equations of equilibrium for the concrete body and for the rebar are shown in Equations (2) and (3), respectively:
The concrete–rebar interfacial slip S (x) is defined for any 0 ≤ x ≤ L as:
S(x) = Us (x)–Uc (x)
Substituting Equations (2) and (3) into the second derivative of Equation (4), yields:
where n = Es/ Ec; ρ = As/ Ac.
Equation (5) is the unified equilibrium differential equation which expresses the local unknown slip S(x) as function of the local unknown bond stress τ(x); these two unknown functions are related by the bond-slip relationship.
As the bond-slip relationship is bi-linear, separate solutions will be derived for each of the bond-slip segments.
3.2. Solution for Small Slips along the Entire Element (S < S1)
For a low value of the tension force, the entire element is under a linear bond-slip relationship (first segment in Figure 2b). This case has represented the element behavior until a certain load level () when the maximum slip in the element becomes S1 (see Figure 2b), that is the upper limit of first linear segment. The present section analysis aims at analyzing this linear behavior while the latter, that is somewhat more complicated, is derived in Section 3.2.
For the present case Equation (5) turns into:
where:
Solution of Equation (6) is:
Due to the symmetry of the problem the boundary condition at x = 0 is:
S = 0
Substituting Equation (8) into Equation (9) yields , and Equation (8) becomes:
and using Equation (10) yields:
Substituting Equation (11) and Equation (12) into Equation (4) yields:
Substitution of Equation (10) to Equation (13) yields that for any coordinate x:
i.e., both the coefficients before x and the free term are zero:
The boundary conditions for Equations (11) and (12) are:
- Symmetry at x = 0 determines that Us (0) = 0.
- Prior to cracking at x = 0, the displacement of the concrete at that point is Uc (0) = 0.Note that this condition is also obtained from Equation (4) noting that Us (0) = 0.Substituting this condition into Equation (11) yields F2 = 0 and Equations (9) and (13) lead to the following:
- The strain in the rebar at x = L:
- The strain in concrete at the stress-free face at x = L is:
Applying Equations (17) and (18) on Equation (11) and Equation (12) yields the following system of equations:
The solution of Equation (19) is:
With these parameters, the solution of the problem within the first segment zone is:
- -
- Slip:
- -
- Displacements:
- -
- Stresses:
The rebar elongation (equals to 2Us(L)):
The above solution is valid if the maximum slip (at x = L) is smaller than or equal to S1 or until cracking of the concrete at x = 0 occurs. That solution may be used when a linear approximation of the bond-slip relationship [18] is considered or as part of the bi-linear solution for the specified slip limit and cracking condition.
If cracking at x = 0 has not occurred, the maximum load P (denoted as ) is determined from Equation (21) for the condition S = S1:
The cracking load at x = 0 may be determined from Equation (24) for the condition = ft:
It turns out that the cracking load depends on the element half-length L. Therefore, the load Pcr1 refers to the first crack at the center of the original element of length 2L and splits the element into two sub-elements of length L. This load is obtained from Equation (29) using the half-length L. The second cracking load Pcr2 refers to the following two cracks that are formed at the centers of the two sub-elements of length L and is obtained from Equation (29) using the sub-element half-length L/2, and so forth. Therefore, the following cracking loads are expected to be of equal or higher magnitude, depending on the hyperbolic expression which depends on the element half-length.
In order to demonstrate the derived expressions of the model and to analyze its features, a specific set of data is defined: 2L = 1500 mm, Es = 210 GPa, Ec = 30 GPa (n = 7), ft = 2.5 MPa, Ds = 10 mm, As = 78.54 mm2, S1 = 0.023 mm, Ac = 7775 mm2 (ρ = 0.01), A1 = 174 MPa/mm, A2 = 29 MPa/mm. This set of data will be used in the following examples.
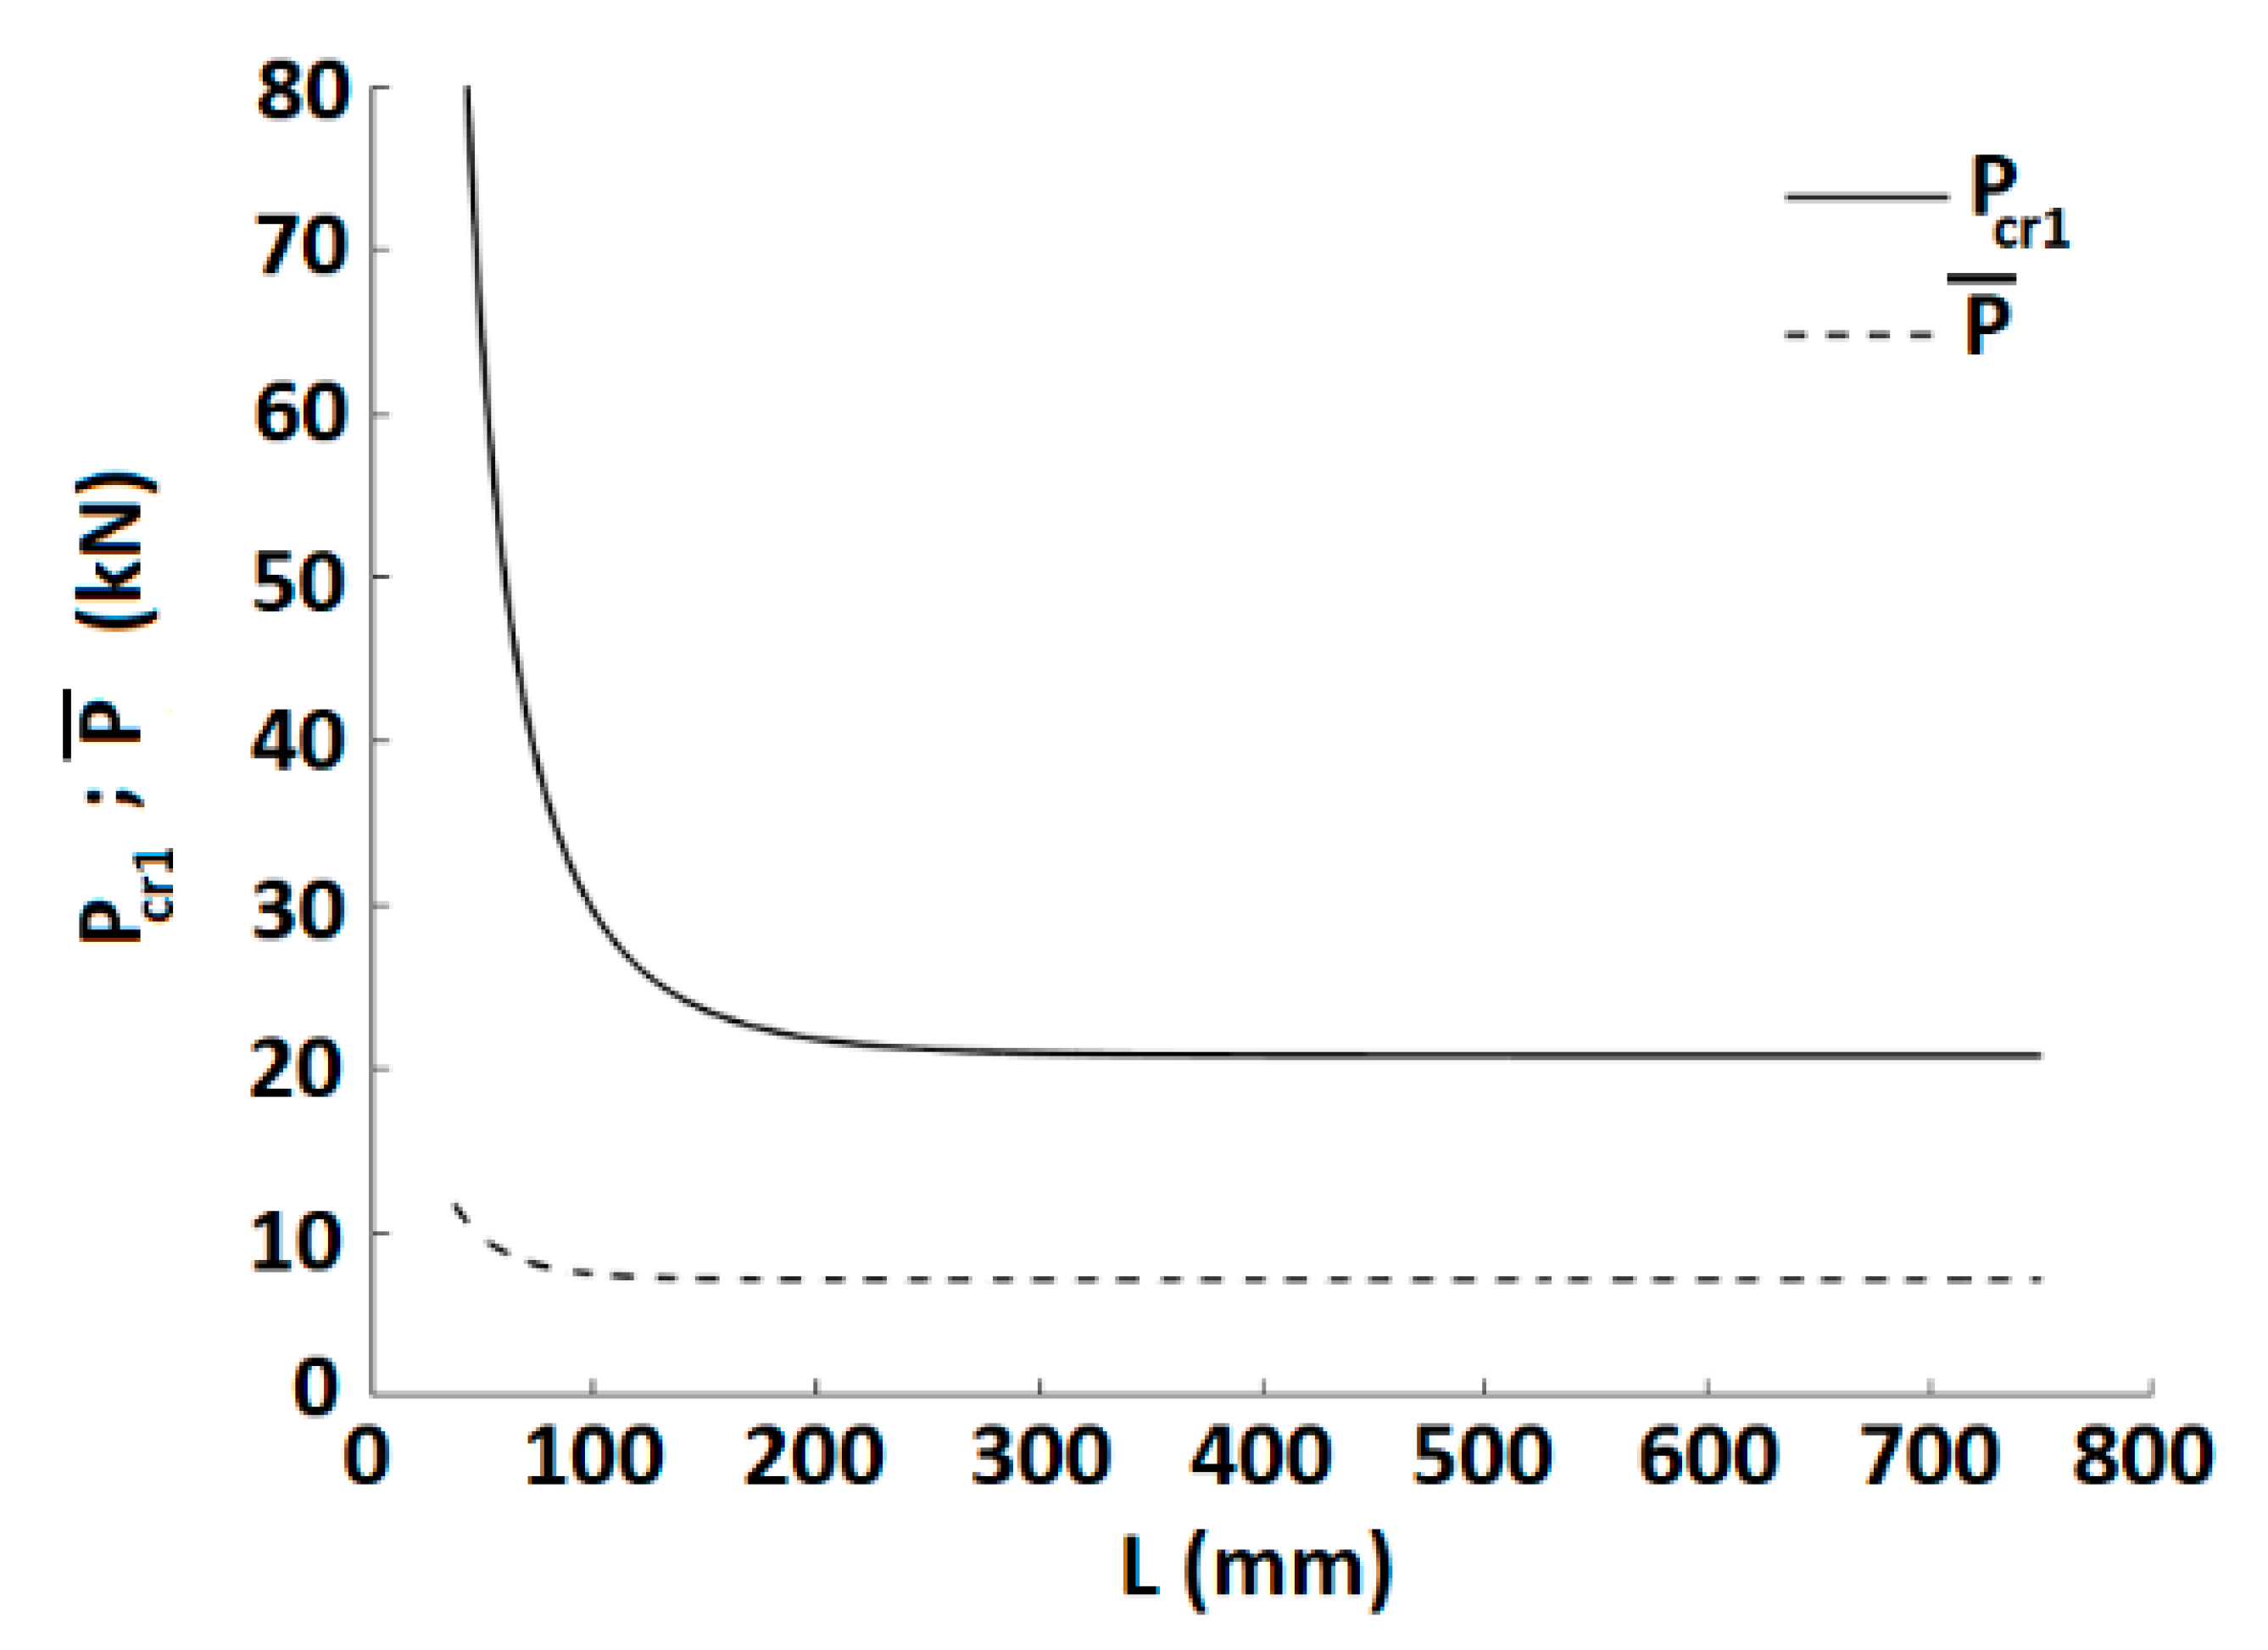
Figure 4 presents the dependence of the cracking load for this set of data on the sub-element length. It starts with the half-length of the original element (L = 750 mm) and theoretically examines cases of higher cracking stages with shorter half-lengths respectively. For comparison, the upper load limit at which a slip S1 is developed is shown as well.
The figure shows that for the given data the cracking load is independent of the length for sufficiently long elements. In such cases, the second cracking load may be of the same magnitude (e.g., for L = 750 mm for the first crack and L/2 = 375 mm for the second level cracks in Figure 4 and the magnitude is presented by the horizontal asymptote). At shorter half-lengths, the cracking load increases rapidly. For this specific set of data, the maximum possible load that yields the slip S1 is smaller than the cracking load, hence cracking will occur at a higher load after the transition to two bond-slip zones where the maximum slip in the RC element exceeds S1. This is not necessarily a general conclusion, and could satisfy the condition when:
This leads to the following condition:
This inequality is not satisfied for the specified data and therefore the first cracking load is larger than the maximum load This is mainly due to the relatively small slip S1. A considerably larger slip S1 could cause a cracking load within the first segment.
From the above expressions one may gain other insights as well. Let us examine two extreme conditions: a smooth interface and a perfect bond. In the first case there is no bond stress regardless of the slip. From Figure 1b it turns out that it corresponds to a segment slope . From Equation (7) that means . With this value, Equation (27) yields a rebar elongation of which corresponds to the expected elongation of a bare rebar of the length 2L.
The other extreme case means that there is no slip and therefore , hence Therefore, in that case that corresponds to the elongation of a RC bar with a perfect steel-concrete interfacial contact without cracking, that is equal to .
3.3. Solution for Larger Slips along the Entire Element (S < S2)
The previous section referred to low loading levels at limited slips where the maximum slip does not exceed S1 (Section 3.2), and the entire element is governed by segment-1 bond-slip relationship (Figure 2b, first segment). Upon further load increase (), the slip field along the entire element is subdivided into two slip zones: the central zone of small slips where that is governed by a linear elastic relationship of the first segment (Figure 2b), and the zone of larger slips where that is governed by the relationship of the second segment (Figure 2b). The transition between the first zone and the second zone occurs at a coordinate at which S = S1 and the continuity conditions between the two zones are fulfilled. The transition coordinate varies with loading and shifting from the element end towards its center with load increase. This two zones solution is developed in the following.
First consider the solution for the slip field.
For the slip follows the solution governed by the first segment and expressed by Equation (10). At the slip is S() = S1 and from Equation (10) yields:
and therefore:
for Equation (5) in view of Equation (1) is transformed into the form:
where:
The solution of Equation (34) is:
The condition of continuity at is:
where S− is given by Equation (33) and S+ is given by Equation (36). These conditions at lead to the following system of equations:
That yield the following solution:
Finally, the slip in the range may be rewritten in the form:
Hence, the bond stress along the entire element is:
The displacements of the rebar and concrete in the range of (where according to symmetry ) are obtained similarly to Equations (11) and (12) in the form:
In the range of , the equations for these displacements are obtained by the substitution of the bond-slip relationship for the second segment in Equation (1) into Equations (2) and (3):
The solution of these equations is:
Subtracting Equation (47) from Equation (48) and substituting the difference into Equation (4) yields:
From Equation (41) and in view that Equation (49) is valid for any x, one may conclude that:
The continuity conditions for displacement and strain (stress) in the concrete at are:
The continuity conditions for the steel rebar at are obtained automatically considering Equation (51).
According to the second condition of Equation (51), the strain continuity in concrete at is obtained using Equations (47) and (43):
Hence:
Substituting Equations (47) and (43) for into the first condition of Equation (51) yields:
Substituting Equation (53) into Equation (54) yields:
Substituting Equation (55) into the second equation in Equation (50) yields:
Substituting Equations (55) and (56) into Equations (47) and (48) yields:
The boundary conditions at the element end (x = L) are the zero stress in concrete and the stress in the rebar due to the applied load P:
Using Equation (59) yields:
Hence:
Substitution of Equation (57) and Equation (62) and applying the boundary condition in Equation (60) leads to the following transcendent equation for evaluation of the coordinate
Substituting of Equation (63) into Equation (62) leads to a simple expression for the constant F1:
Note that it is equal to the corresponding constant obtained for the first segment in Equation (20).
3.4. Summary of the Bi-Linear Model Expressions
At the end of the above derivations, the expressions of the present model using a bi-linear bond-slip relationship that are required for analysis of a typical problem, are summarized in the following:
- -
- The Slip (Equations (33) and (41)):
- -
- Displacements:The displacements along the concrete and the steel rebar are given by Equations (57) and (58) respectively.
- -
- Stresses in the concrete and steel:The expressions for the stresses in the concrete and the steel rebar are obtained from Equations (57) and (58) respectively:
- -
- Bond stress:The bond stress is given by Equation (42).
- -
- Rebar elongation:The rebar elongation is equal to 2Us(L) (see Equation (58)):
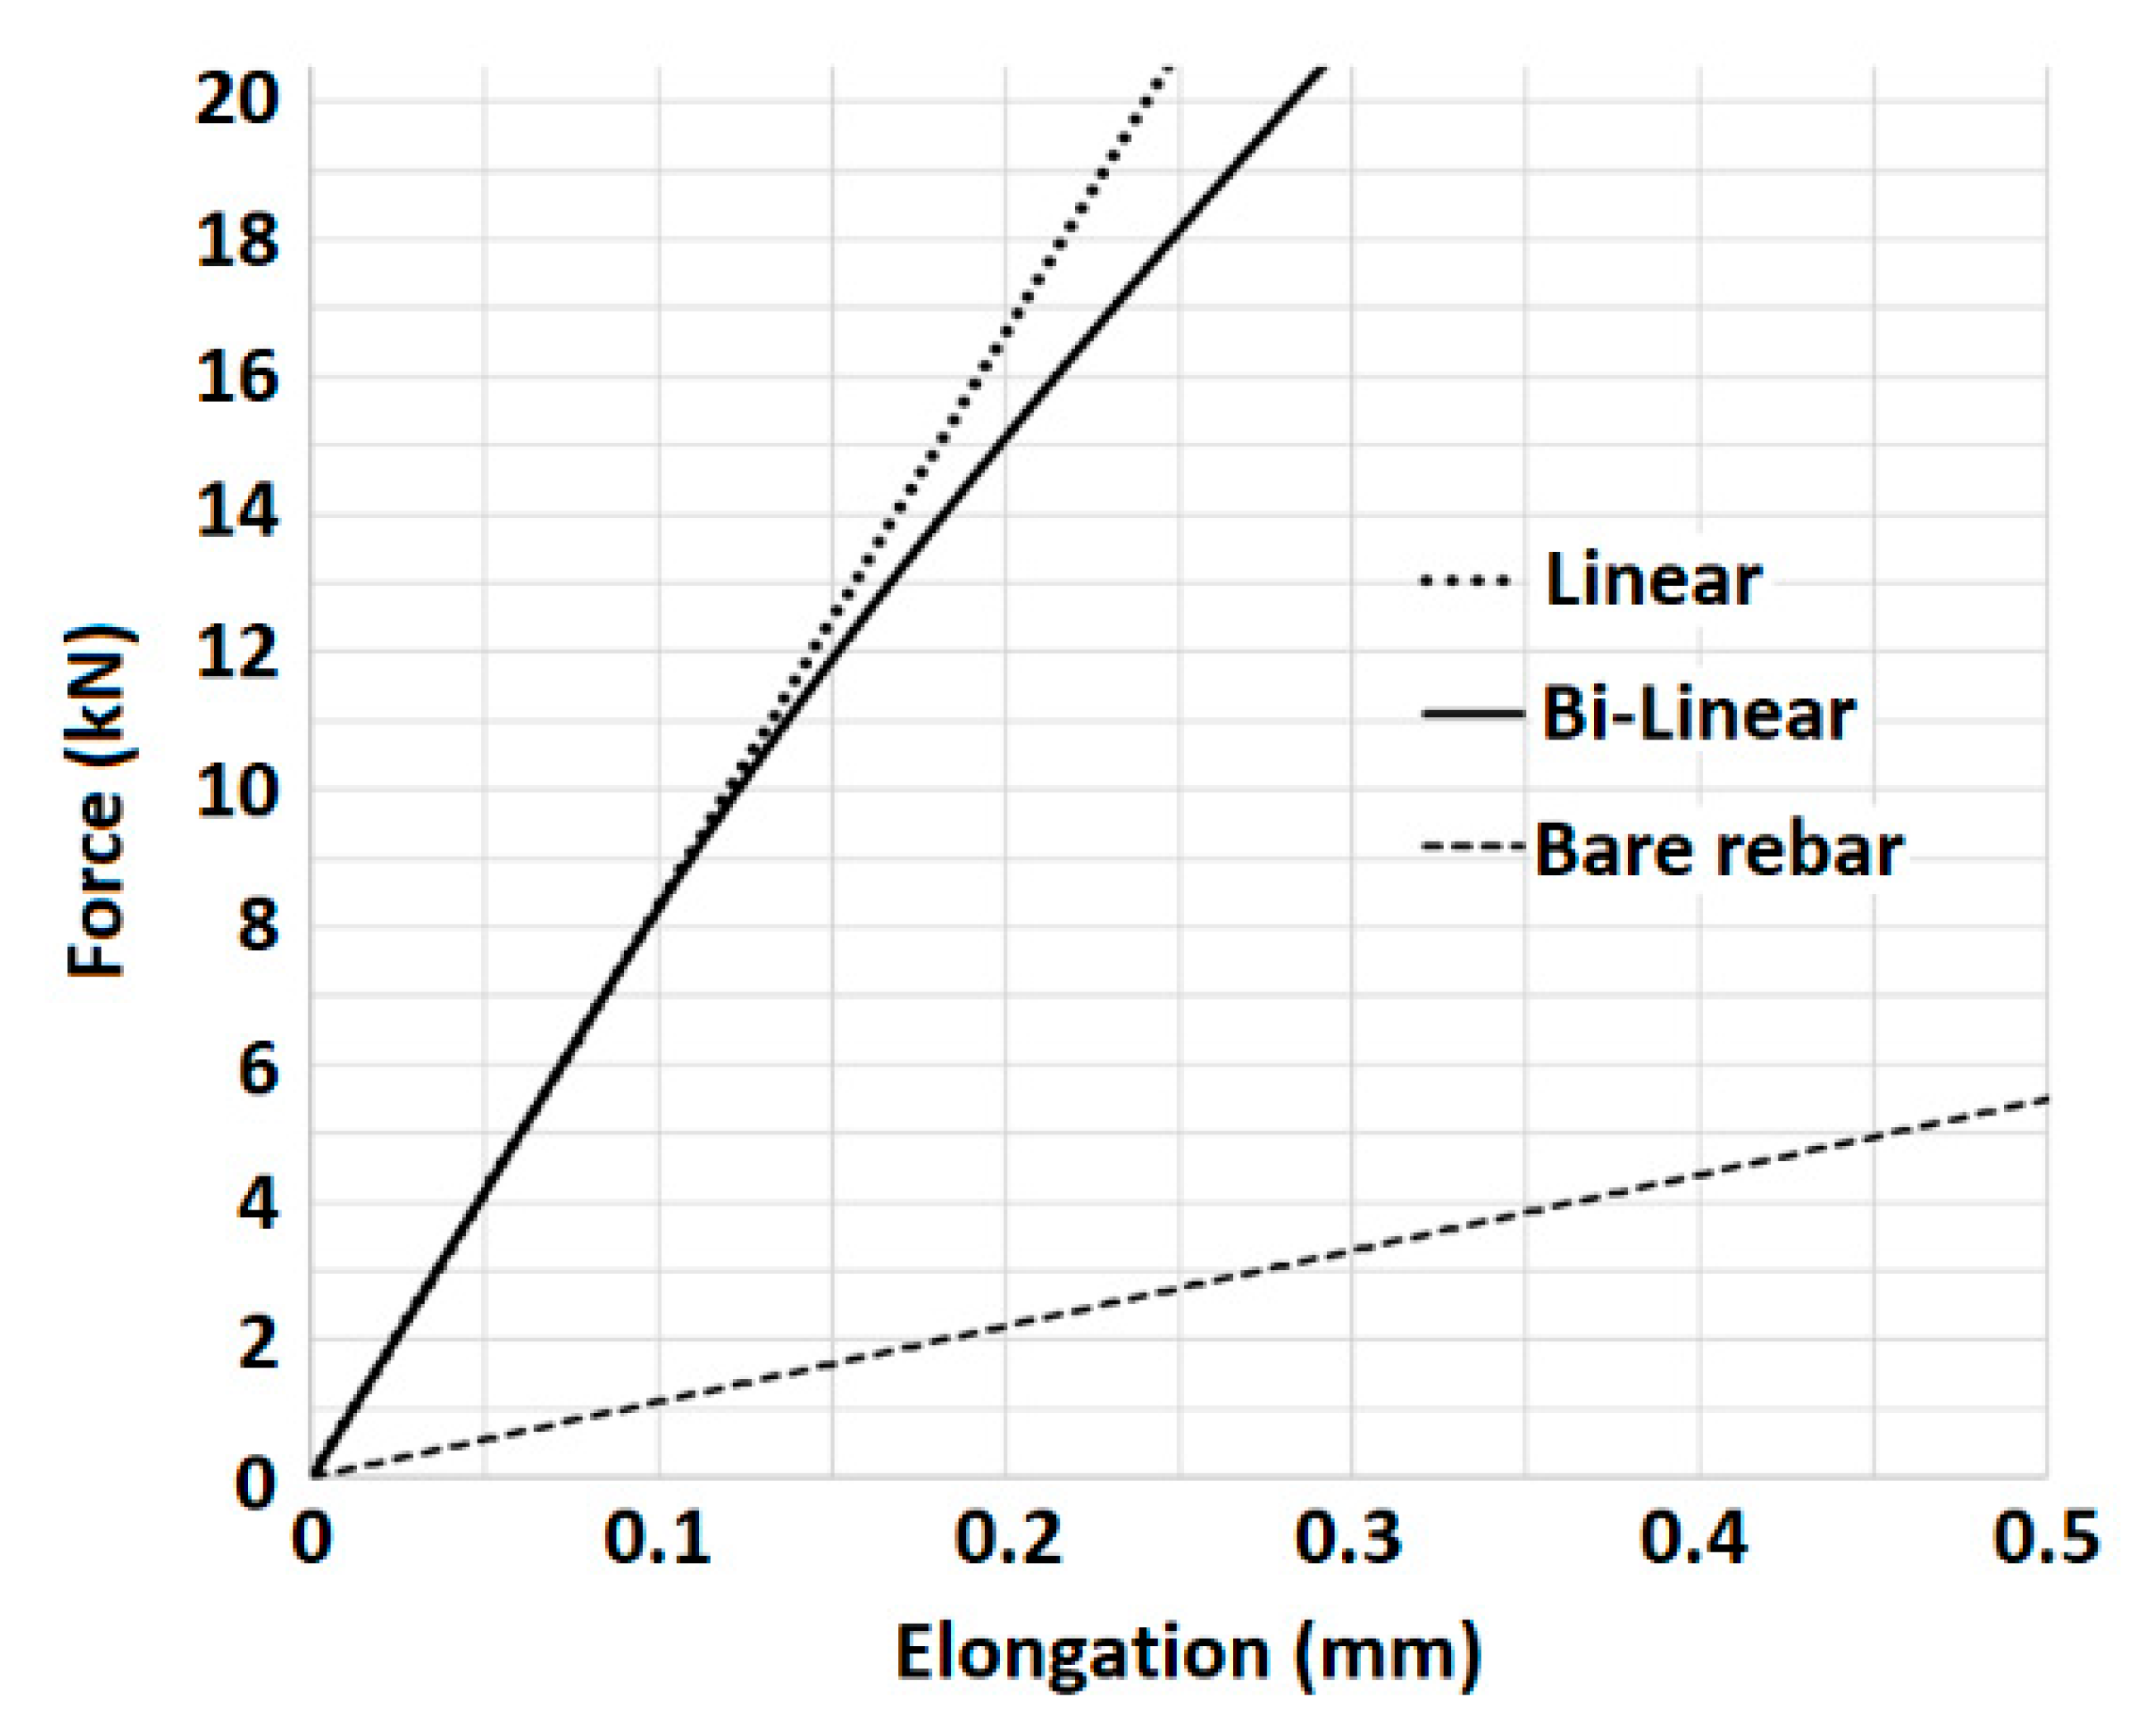
Figure 5 presents a comparison of the bar elongations, calculated by the linear (see [18] and Section 3.2 above) and by the bi-linear models up to first cracking load level, using the same set of data that is specified above. It should be noted that the stiffness of the bond-slip relationship (Figure 1) is identical for the linear model and the bi-linear model along the lower level of the bond stresses. Then the bi-linear follows the second segment of the bond-slip curve while the linear model follows the initial stiffness.
It may be seen that both linear and bi-linear models are identical until a force level of ≈ 7.2 kN (see Equation (28)). Beyond this level the bi-linear model predicts larger elongation, and this difference increases with the load. Furthermore, the force-elongation behavior becomes non-linear as a result of the shifting of the transition point toward the segment’s center. This non-linear behavior continues up to a cracking load at about 21 kN that causes the crack formation at the segment’s mid-section (see below).
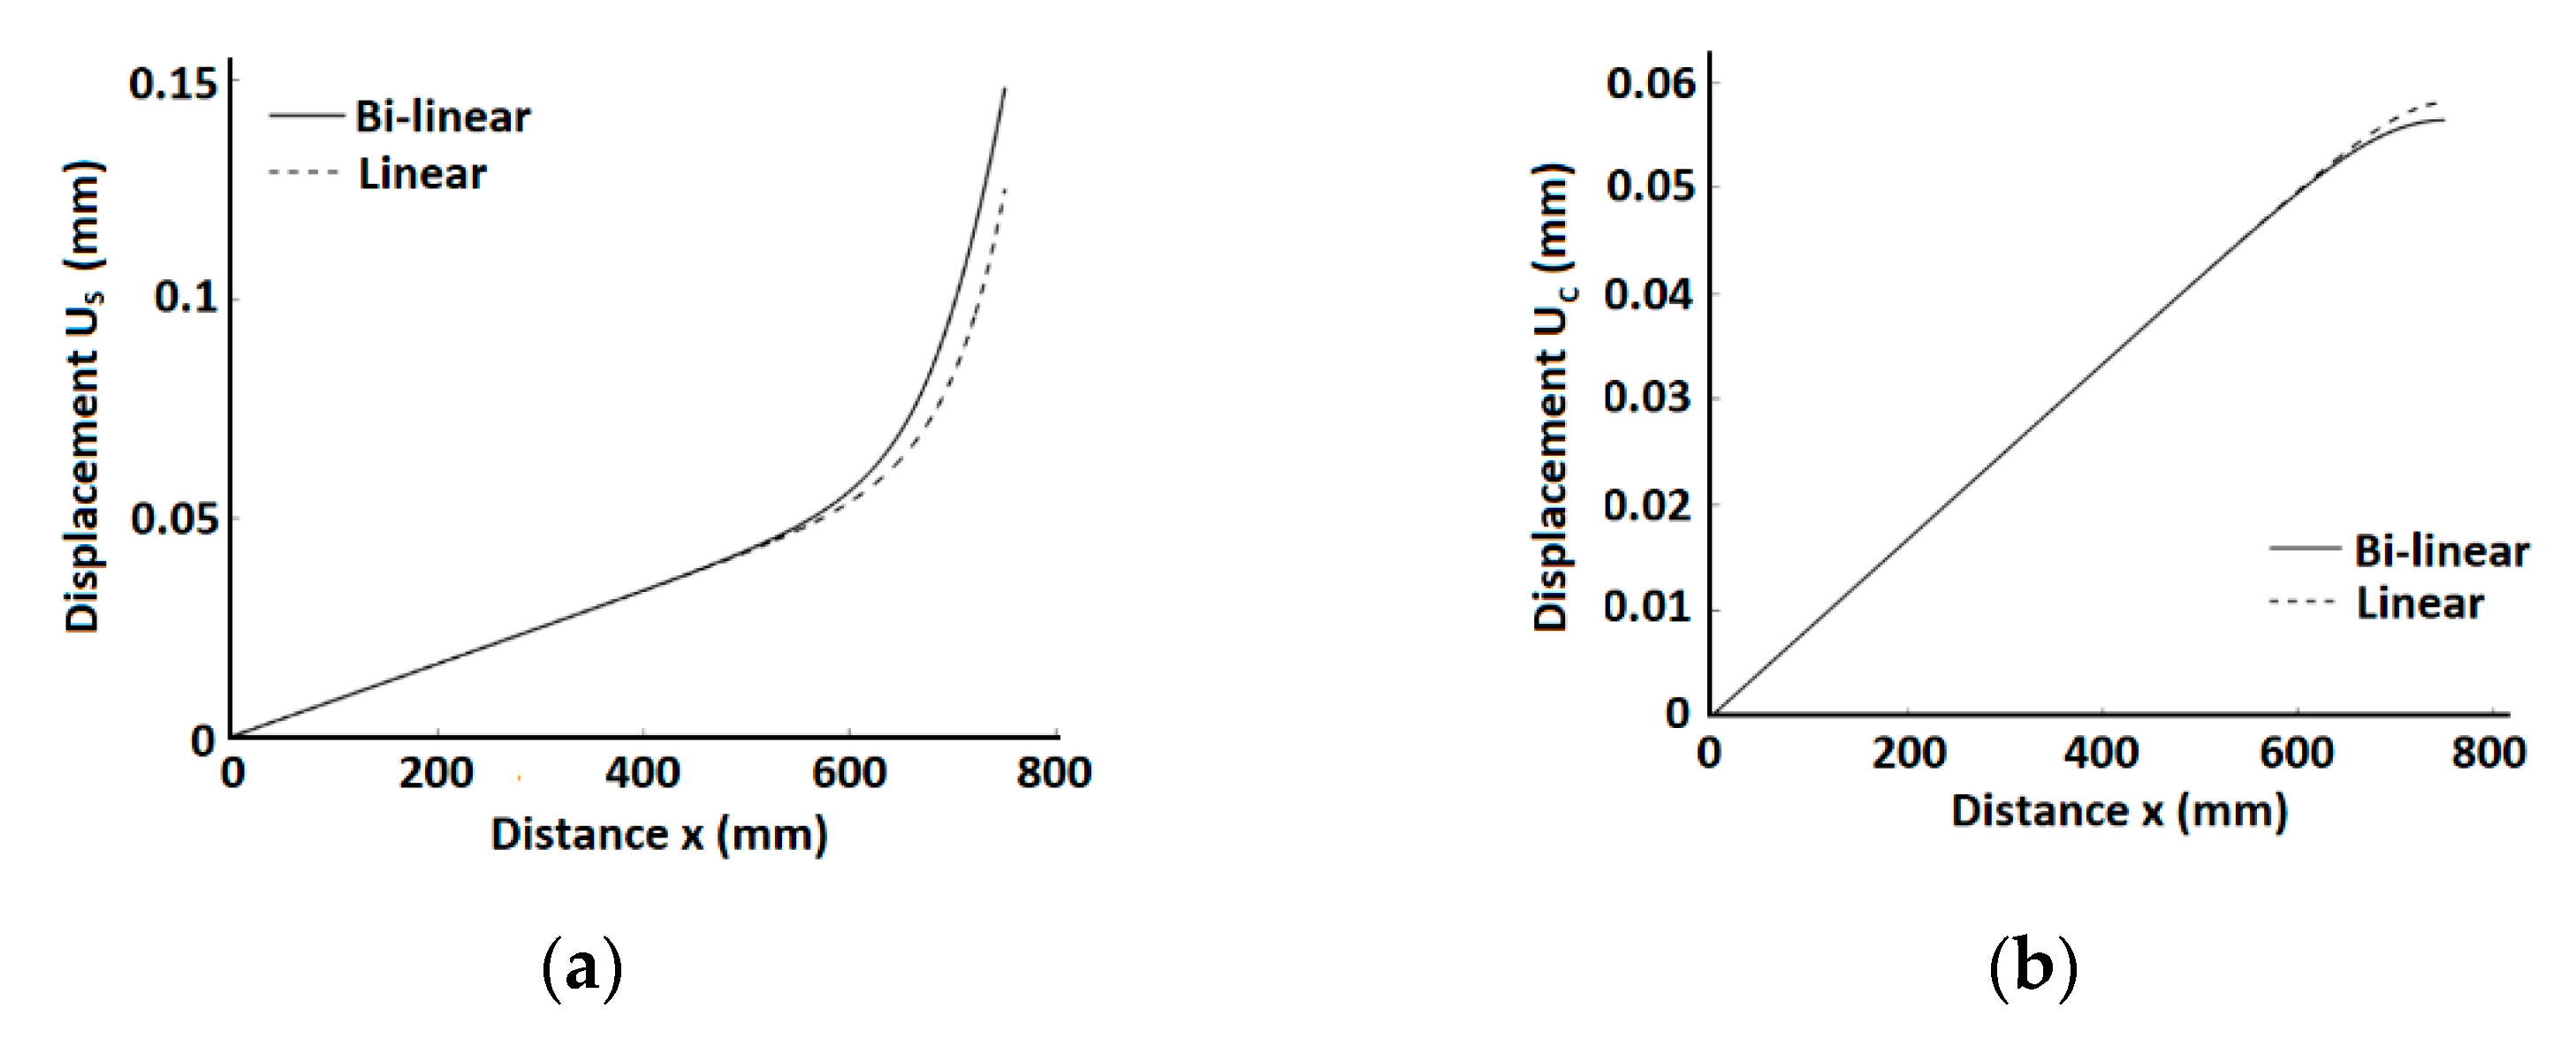
Figure 6 compares the analysis results of the present bi-linear and the previous linear [18] solutions for a stage where the maximum stress in the steel rebar is ~270 MPa. Differences between the linear and the bi-linear solutions are observed at larger values of x, i.e., closer to the element ends and to the cracks’ locations. The difference between the models’ predictions of the bond stresses (Figure 6f) is significant for the calculated bond stress due to the smaller stiffness of the bi-linear bond-slip relationship which affects the bond stresses at larger slips, thus the linear model calculated bond stress at x = 750 mm is twice larger than the bond stress obtained by the bi-linear model. The slip calculated by the bi-linear model at that location is much larger than that obtained by the linear model. As the crack width depends on the slip, that result reflects on the effect of the model on the calculated crack width.
For the sake of comparison with the bi-linear model solution, the range of the linear solution, which is valid for the low level of loading only, is artificially extended beyond S1, to allow comparisons with the bi-linear solution. The latter follows closely the bond-slip relationship beyond S1 and its results are valid up to S = 0.15 mm (see Figure 1b). This means that several possible cracking levels may be covered by the bi-linear model. Using the bi-linear model, the first cracking of the concrete, occurs when the peak stress in the concrete reaches the concrete tensile strength ft.
In general, if cracking occurs where , the cracking force is given by Equation (29); otherwise, this cracking force is obtained using Equation (66) for x = 0, where the maximum stress in concrete is developed (see also Figure 6d):
Thus, the first cracking force using the bi-linear model (denoted Pcr1-BL) is obtained as follows:
where the critical value of is obtained by the solution of the algebraic equation:
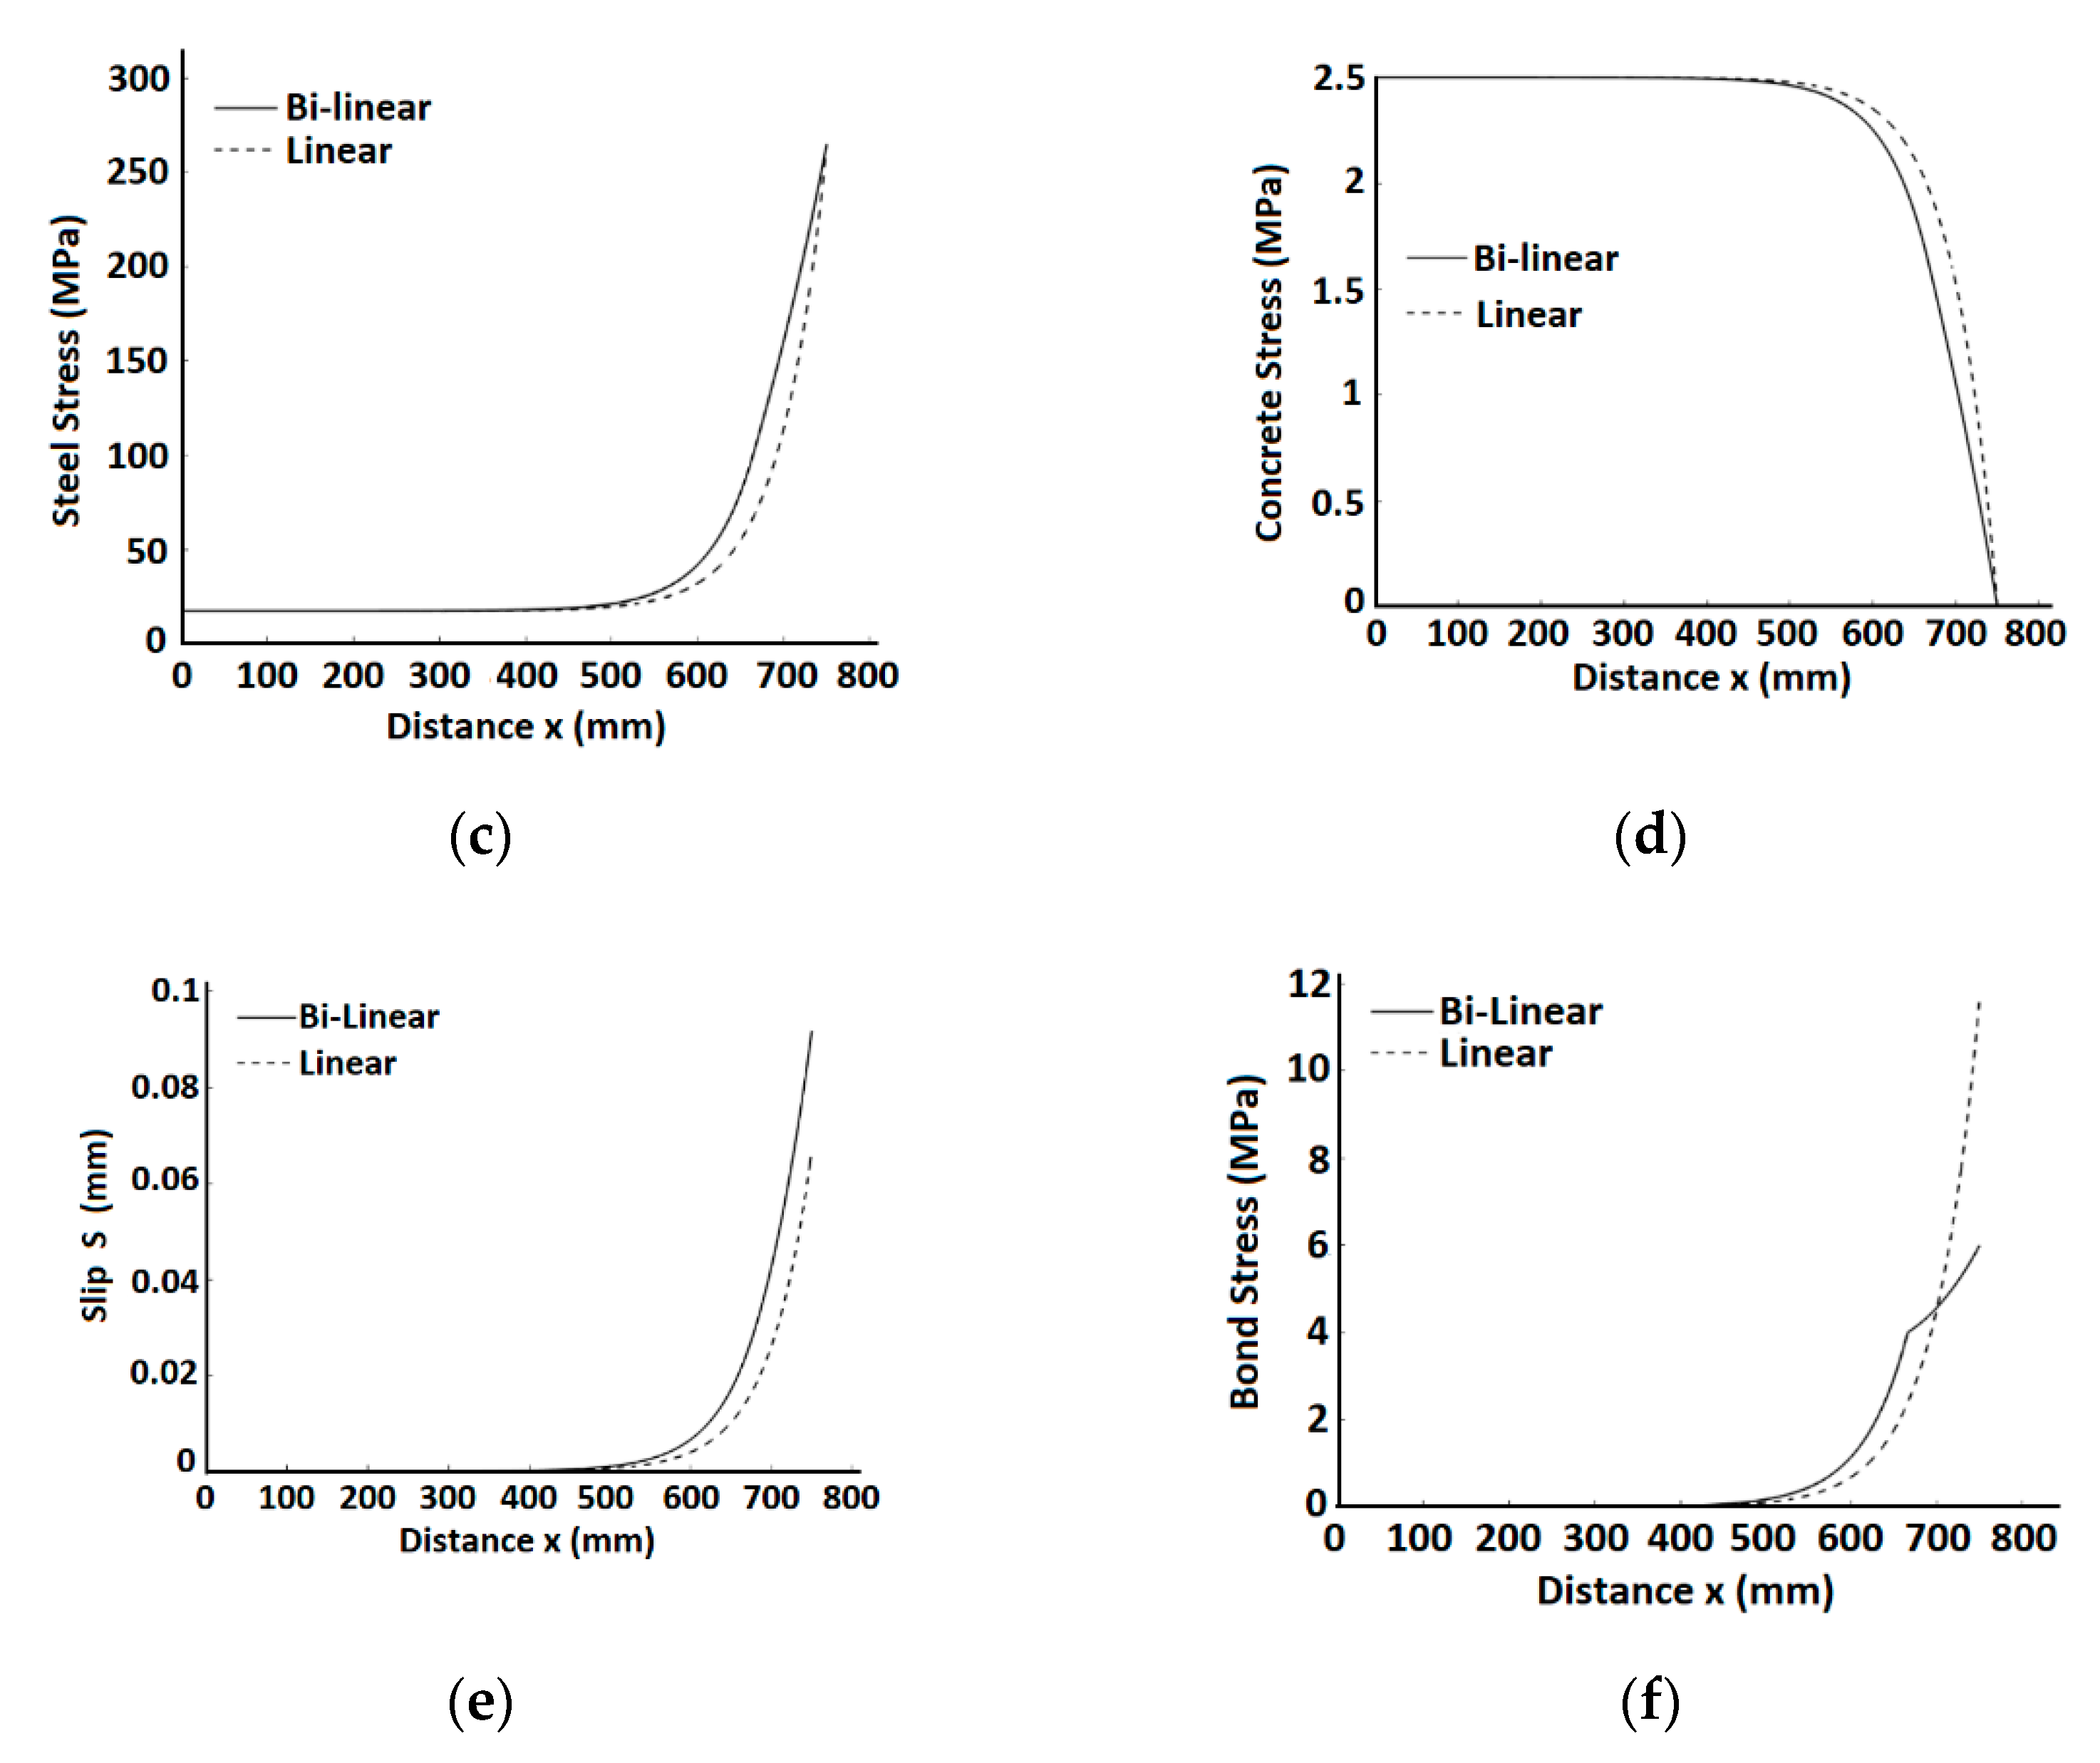
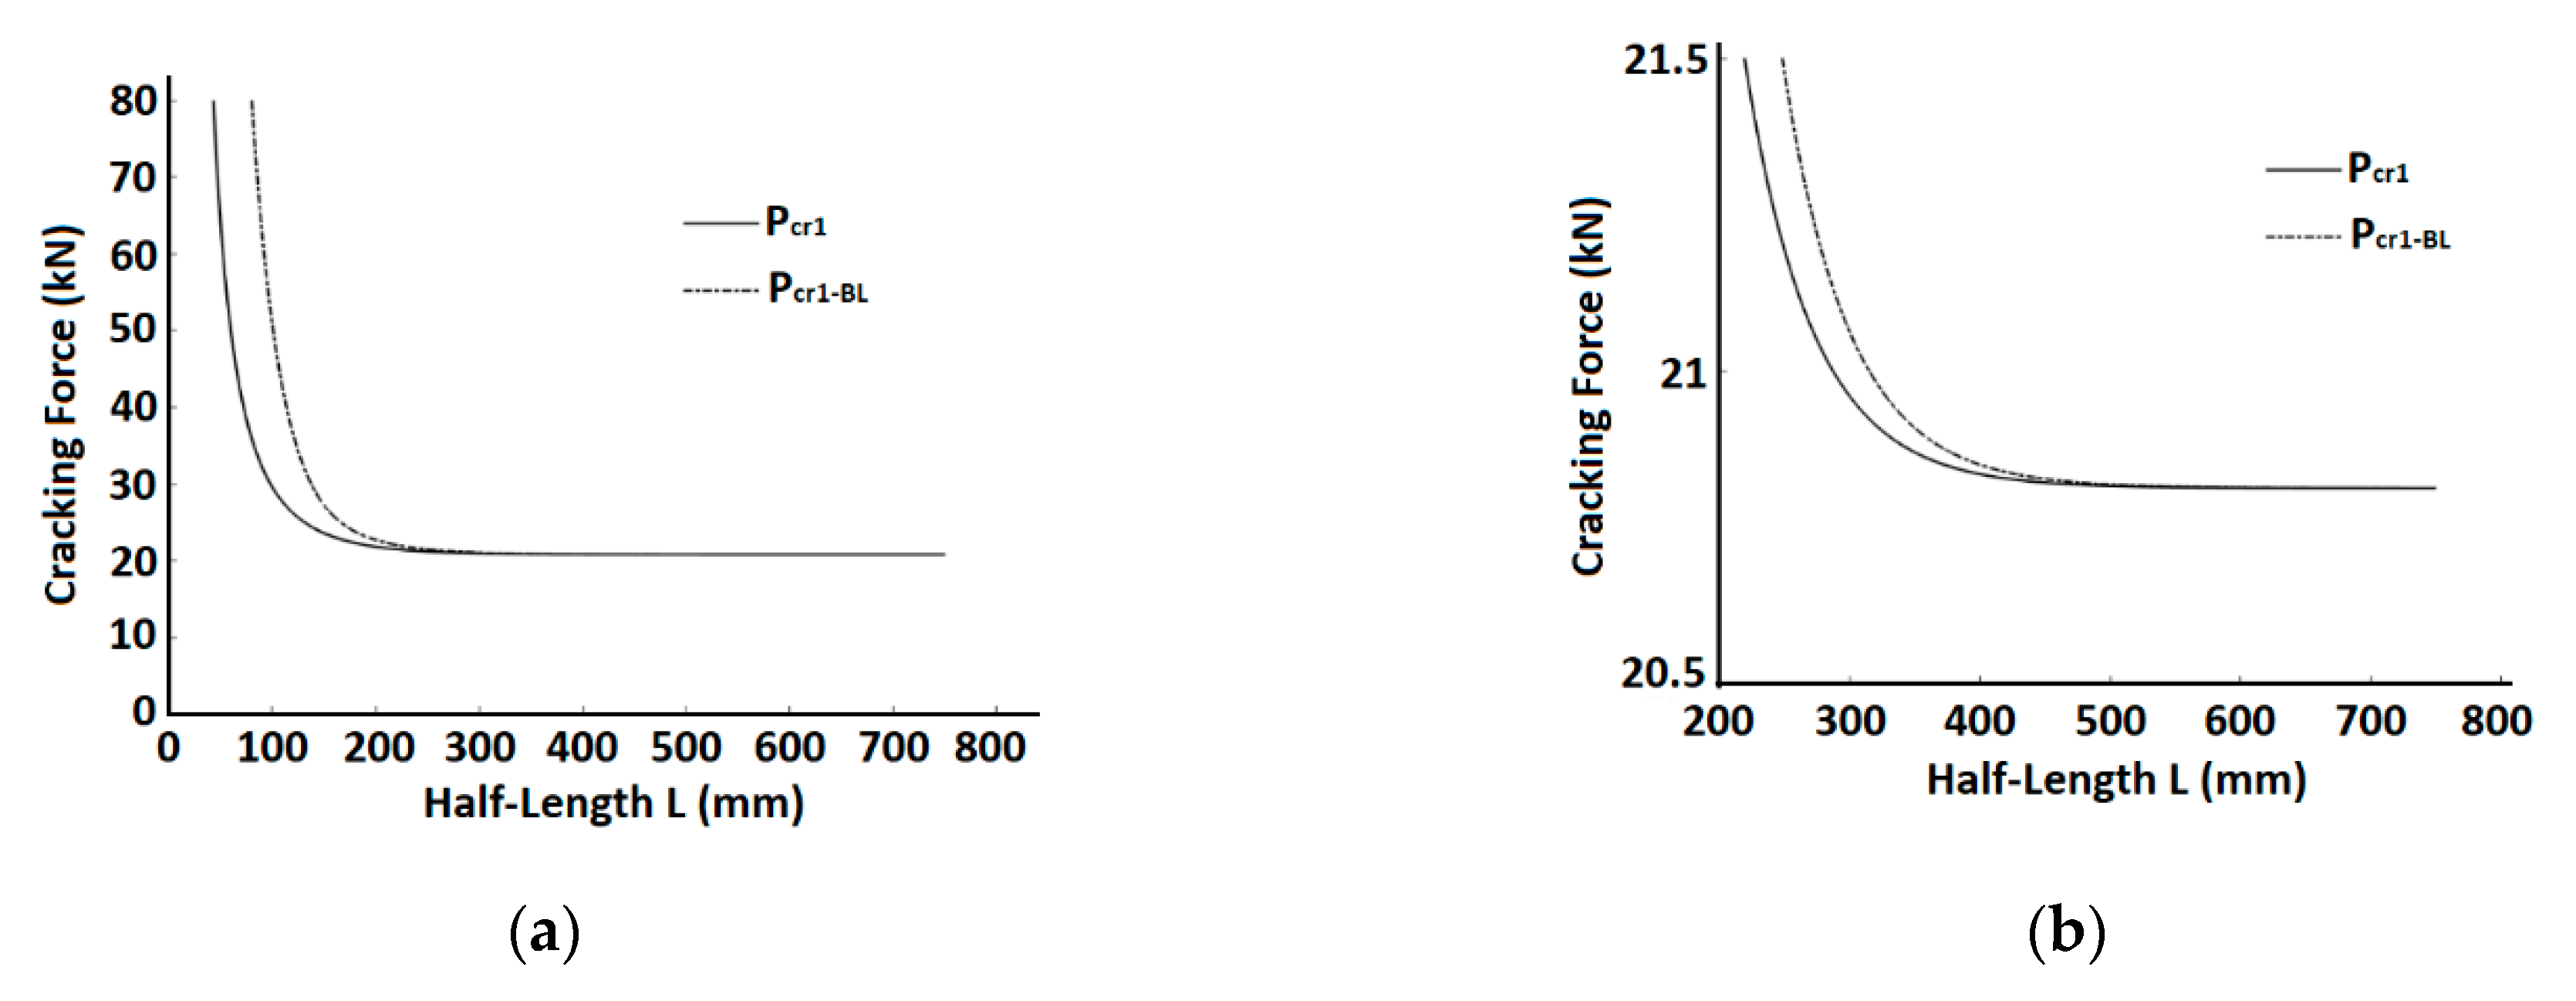
The dependence of the first cracking force (c in a linear model (see Equation (29)) and in the bi-linear model (see Equation (29)), on the element length is demonstrated in Figure 7.
The figure shows that for a half-length that is larger than ~400 mm the cracking force magnitude is insensitive of the element length, i.e., for a long element, several cracks may develop under a similar force magnitude (see Table 1 below). The possible number of these cracks depends on the initial element length.
For a relatively large L (for the given example, larger than ~400 mm), the linear [18] and the present bi-linear predictions for the first cracking force are similar. This follows from the fact that for a large L the second segment zone of the bond-slip relationship is small compared to the entire element length (e.g., see Figure 6f). This can also be verified from the limit state where L → ∞. According to Equation (71) when L → ∞, and therefore according to Equation (70) that is equal to (see Equation (29)).
For the examined set of data, the cracking force at the first crack level (L = 750) is almost identical in the two bond-slip models (the difference is less than 1‰). For the following cracking level (see below) the difference between the cracking force using the linear or the bi-linear models becomes significant, because of the shorter L.
3.5. Solution for the following Cracking Stages
Upon the development of the first crack at the element half-length, the concrete stress at that cross section drops to zero. The full-length element is split into two identical sub-elements of length L (i.e., the half-length of the sub-element is L/2) that are like the original element. To calculate the cracking force that will open two more cracks at the centers of these sub-elements the same expression using L/2 as the half-length is used. Following the first crack, the elongation of the entire element is the sum of elongations of the two sub-elements or four times the steel displacements at x = L/2 of the sub-element. This procedure may continue to the following cracking level that occurs at the center of each sub-element.
A comparison of the cracking forces Pcr-L (according to the linear model [18]) and Pcr-BL (according to the bi-linear model) for the examined specific set of data, is presented in Table 1. Note that in this specific case, the bi-linear model predicts 3 cracking stages, with seven cracks in total, up to the rebar yielding, while the linear model predicts 4 cracking stages (with fifteen cracks in total).
As it was pointed out previously (Figure 7), both models predict similar cracking forces for the first cracking stage. In the following cracking stages higher cracking forces are obtained, because of the decreasing sub-element length, and the difference between the calculated cracking forces in the two models increases (Table 1).
The origin of the x axis in the solution presented in Section 4.3 referring to the pre-cracking stage was set at the element center; after the first cracking stage it should be translated to the center of the sub-element which is L/2 away from the original position. For each cracking stage, the variables of displacement, stress, and slip should be calculated with respect to the new coordinate system with the origin set at the center of the newly formed sub-element, and the results should be super imposed with the previous accumulated results. Alternatively, the following adjustment may be performed, to enable continuous calculation of the variation of these parameters. For example, to follow the accumulated displacements in the concrete and steel of the “sub-element” after the first crack formation and until the second cracking stage, an adjustment of Equations (57) and (58) is required by adding a rigid body translation to the new origin. The translation term is equal to the displacement of the rebar’s end at the stage of these sub-elements’ formation. For example, after the first crack’s formation this translation term is obtained by substituting x = L/2 in the second expression of Equation (58) in the following form:
4. Model Validation
The model was validated with experimental results conducted to study the cracking behavior of reinforced concrete members subjected to pure tension [5,10,11].
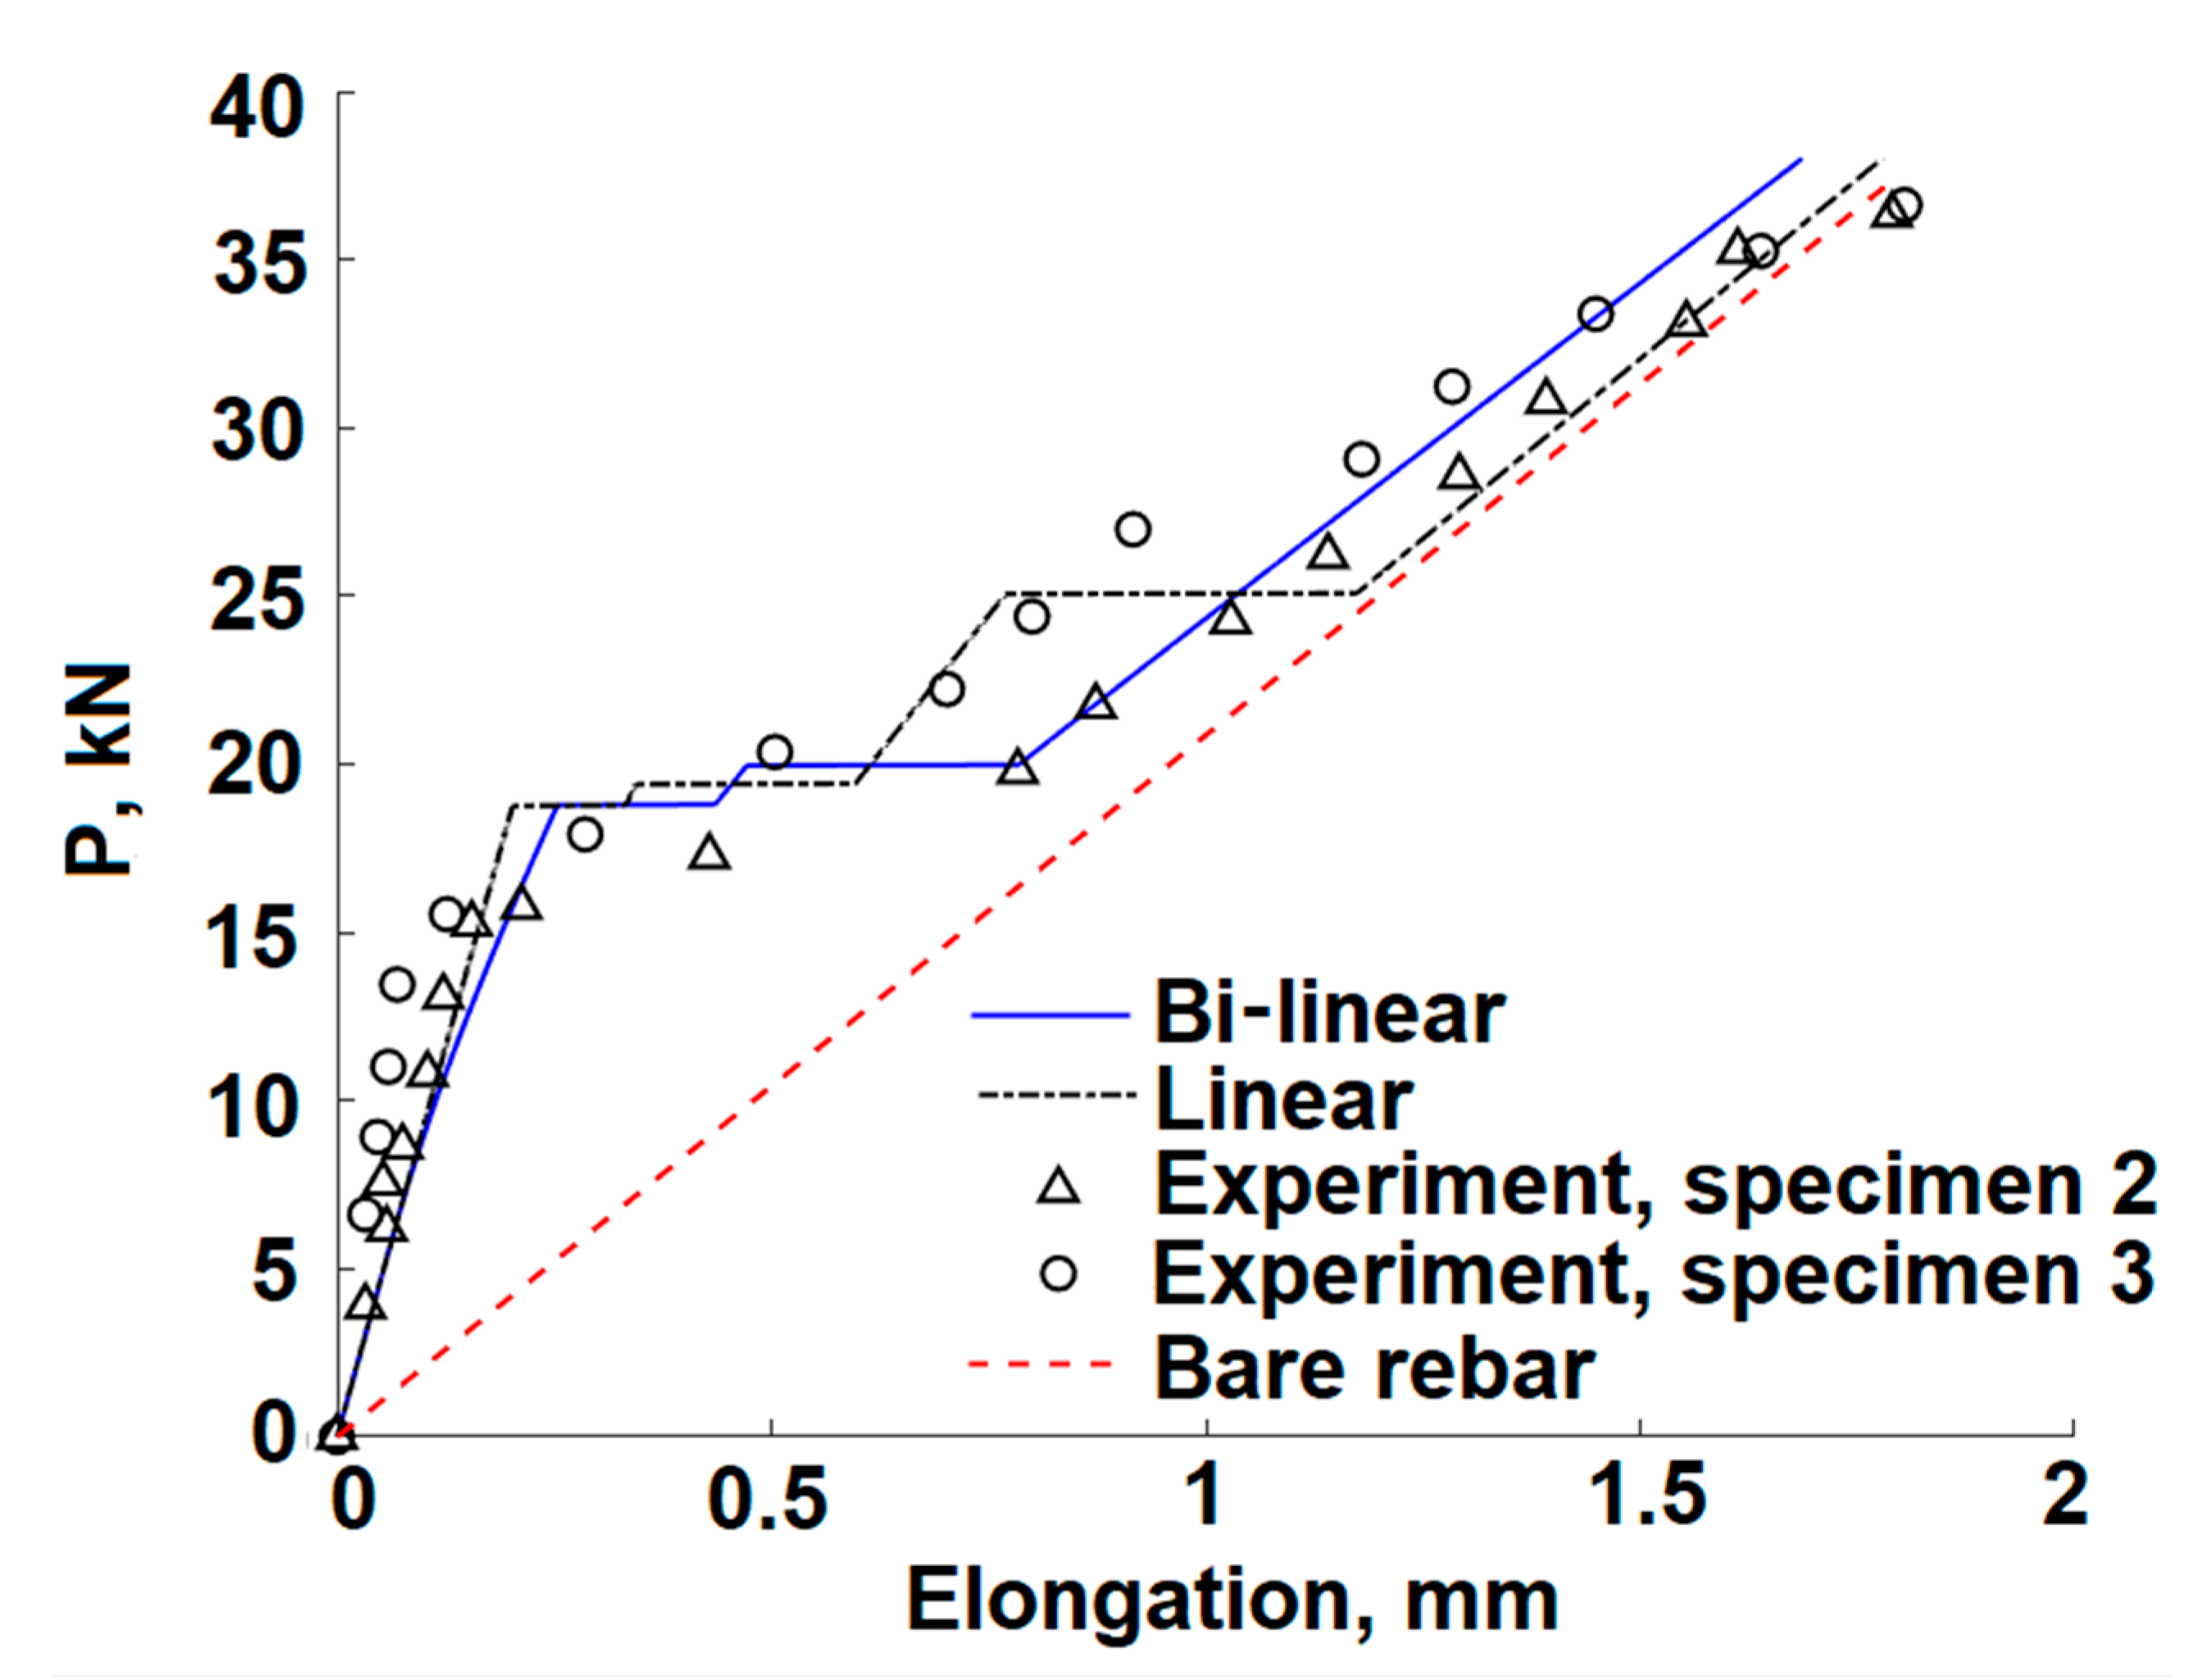
4.1. Comparison with the Experiments of Rizkalla et al.
The comparison refers to specimens 2 and 7 in the series of testing with longitudinal reinforcement but without any transverse reinforcement. Both specimens of 178 × 305 × 762 mm were reinforced with eight φ10 rebars. An equivalent axisymmetric RC element with a single φ10 rebar of 762 mm length that is surrounded by an equivalent concrete cylinder with a diameter of Dc = 93 mm represented the test element. The following data taken from the test report was used for the analysis: EC = 27794 MPa, ES = 158970 MPa, ft = 2.62 MPa, A1 = 174 MPa/mm, A2 = 29 MPa/mm.
The elongation of the rebar that was measured in both tests was compared with the bi-linear and with the linear [18] models and are presented in Figure 8.
The predicted response for both specimens agrees well with the experimental results at the lower load level and yields similar cracking forces for the first and second cracking stages. At the higher load range, the prediction of bi-linear model differs from the linear model and in total it predicts two cracking stages whereas the linear model predicts three cracking stages.
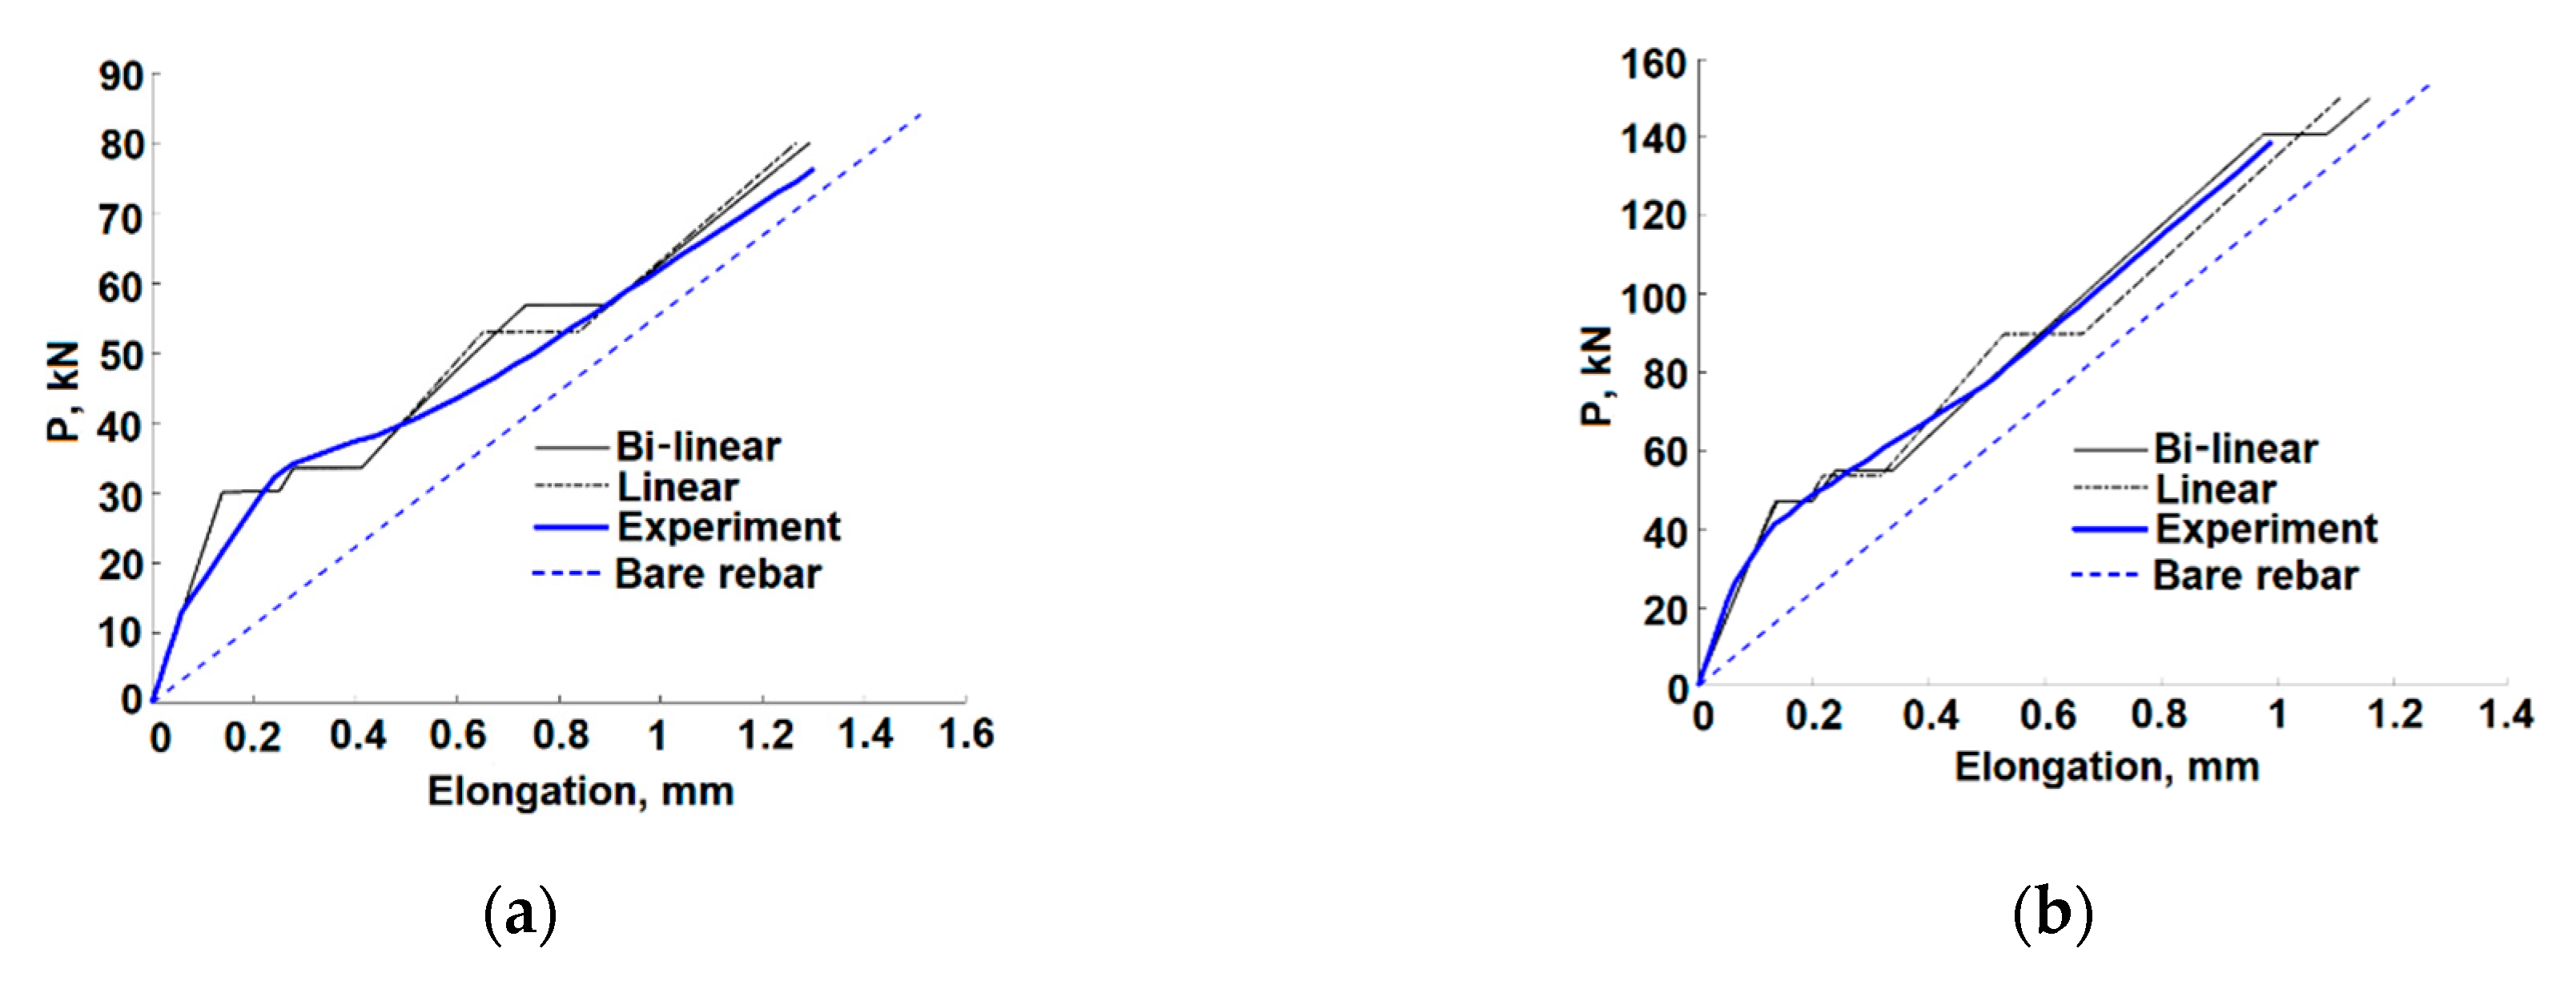
4.2. Comparison with the Experiments of Mirza et al.
Experiments conducted by Mirza et al. [5,11] deal with an axisymmetric and a prismatic RC element with a single centered rebar. The material properties are as follows:
- For both members: Es = 200 GPa, DS = 25.4 mm, A1 = 174 MPa/mm, A2 = 29 MPa/mm
- For the axisymmetric member of the external diameter DC = 152.4 mm and half-length L = 1829 mm: EC =2 4823 MPa, ft = 1.38 MPa.
- For the prismatic member of the rectangular cross-section of 88.9 × 202.5 mm and half-length L = 838 mm: Ec = 23788 MPa, fct = 2.12 MPa.
Figure 9 shows the comparison of the measured bar elongation with those obtained by linear [18] and bi-linear models.
For the axisymmetric bar that is relatively long (see discussion in Section 3 and Figure 7) both models demonstrate similarly reasonable predictions. For the shorter prismatic bar, the models are similar to each other before the second cracking stage, at P~60 kN, after which the bi-linear model shows better agreement with the test results, while the linear model predicts somewhat larger elongations.
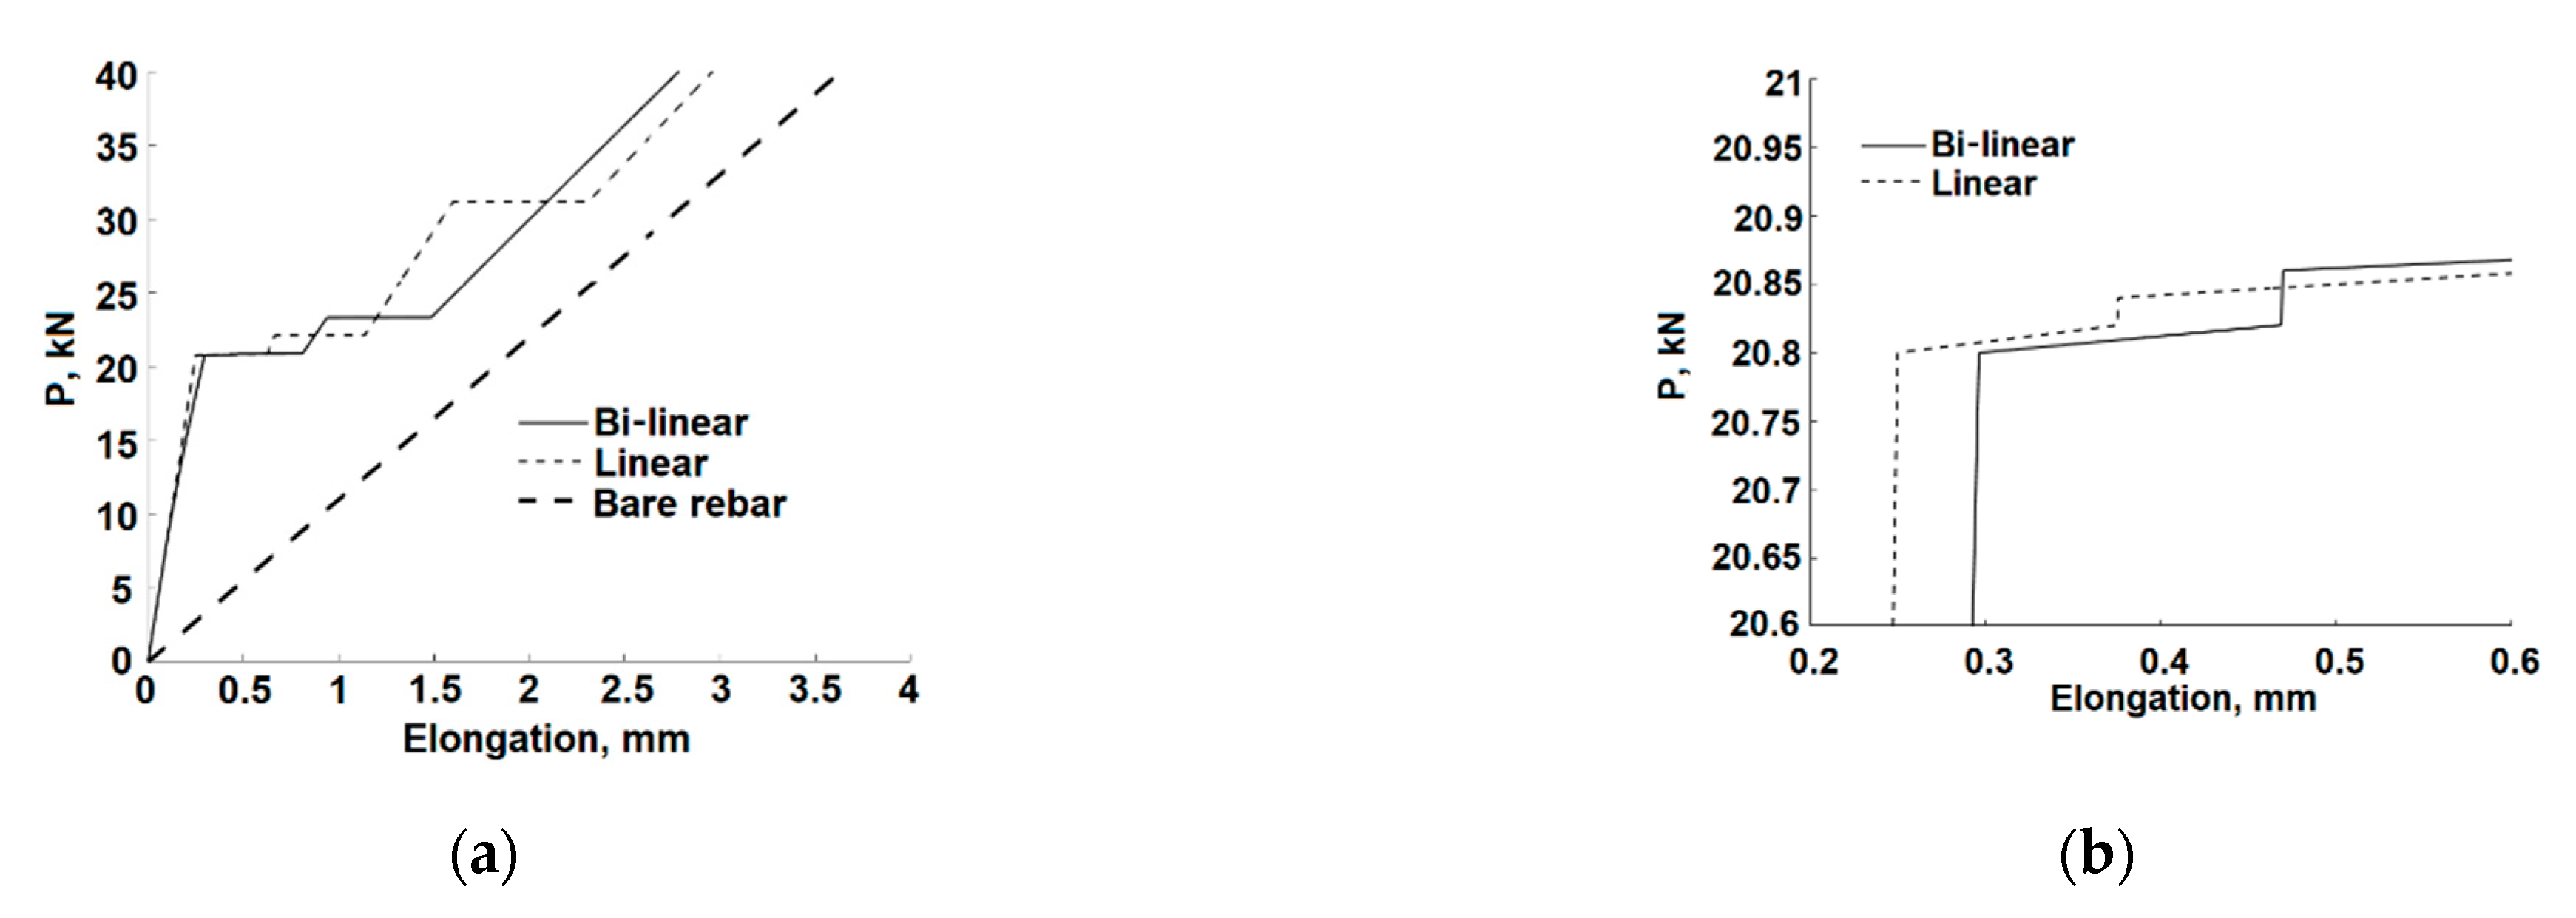
4.3. Features of the Model and Its Implementation
In order to investigate the features of the present bi-linear model and compare its results with the basic tension stiffening solution that is based on a simplified linear [18] bond-slip, this section presents a case study where further analysis is conducted on a 1500 mm long RC element with the data set presented in Section 3.2.
Figure 10 shows a comparison of the bi-linear and linear analytical solutions for the bar. Figure 10a shows an excellent match at the lower loading level, good agreement between the two models at the first cracking load level and an increasing difference between the models at increased loading. The bi-linear model predicts two cracking levels whereas the linear model predicts a third cracking level at a considerably higher load. Figure 10b shows that the predicted first and second cracking forces are only somewhat different, in accordance with Figure 7 and Table 1.
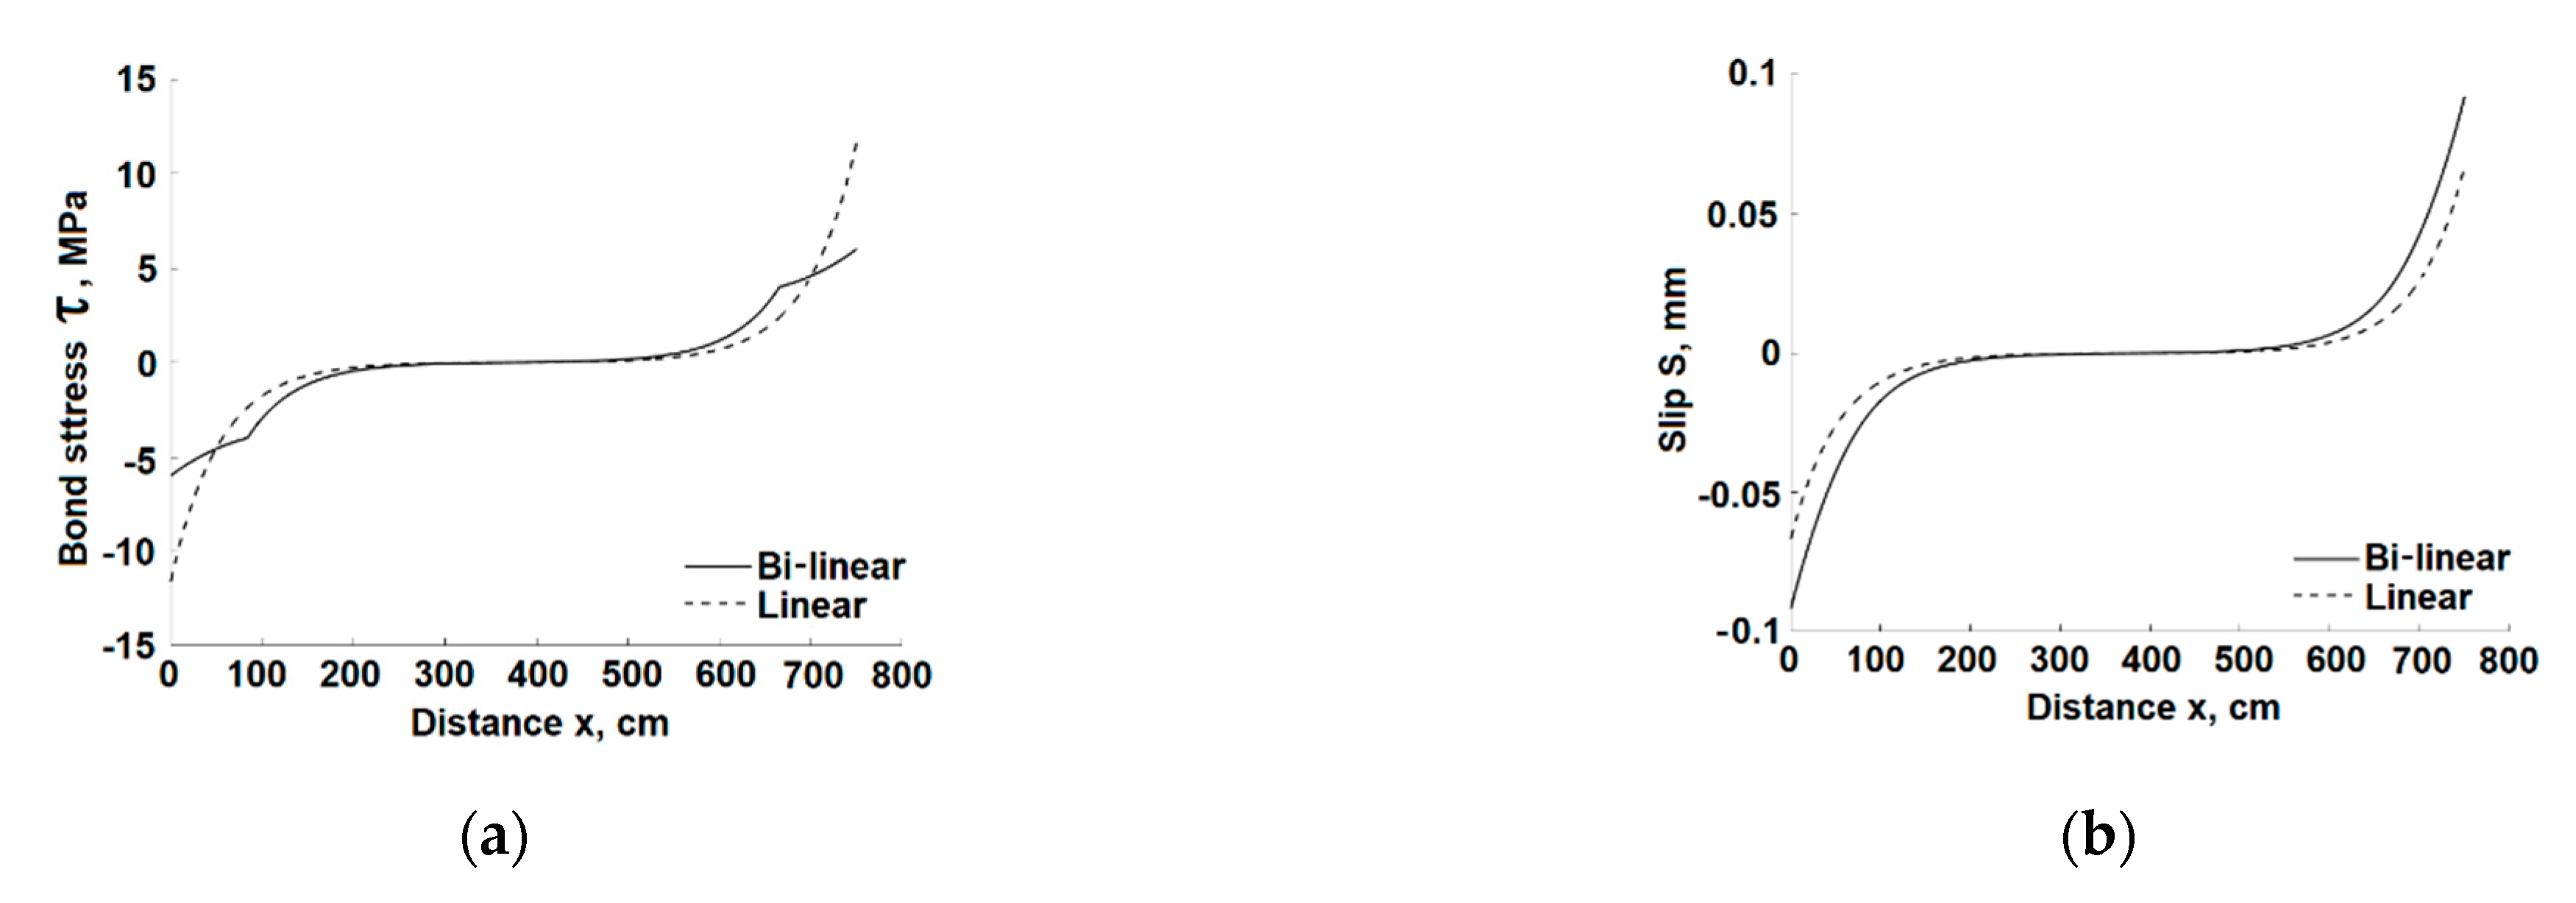
Figure 11 presents the slip and stresses distributions along half-length of the element during the cracking process following the first crack formation and complement the distribution for the stage prior to first cracking shown in Figure 6c–f above.
The increasing differences during the cracking process between the linear and bi-linear solutions is evident (especially for the bond stress). This finally leads to totally different distributions at the rebar yield load level due to different predicted number of cracks. The difference between the distributions of both concrete and rebar displacements along half of the RC element becomes significant even after the first cracking, as shown in Figure 12.
Figure 11, Figure 13, Figure 14 and Figure 15a show that during the cracking process, as the length of each sub-element decreases, the effect of non-linear bond-slip behavior along the entire bar increases. This occurs because the second bond-slip zone (where S(x) > S1) spreads over a larger part of the element.
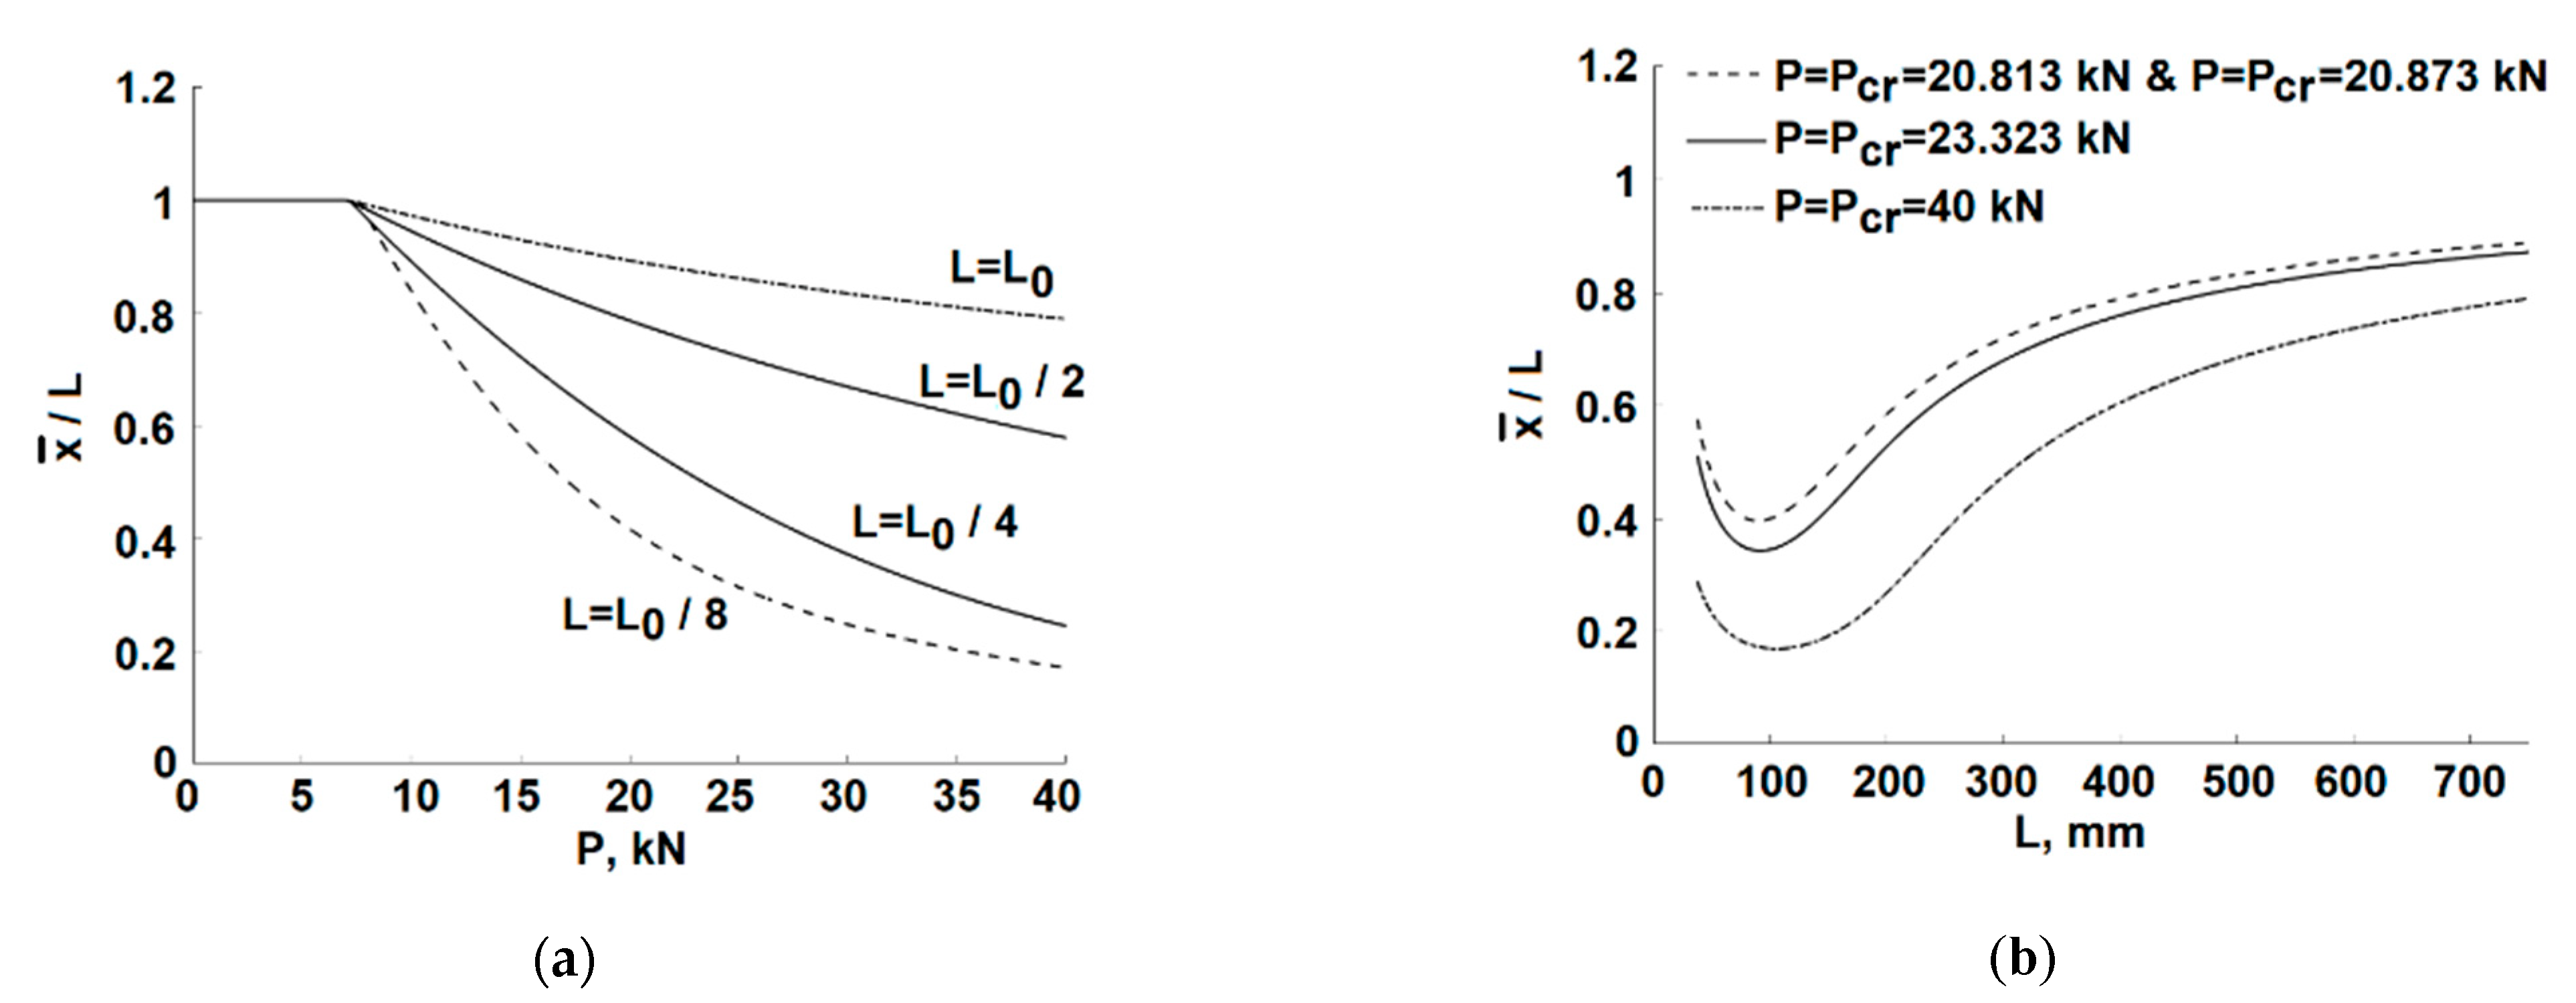
The dependence of the normalized coordinate of the transition point, , between the bond zones (Equation (61)) on the tensile force P is presented in Figure 16a. The half-length of the original RC element L0 is 750 mm. The normalisation is done with the length of the current uncracked sub-element, L (L = L0, L0/2, L0/4 or L0/8, depending on the number of cracks).
Note, that the case of L0/8 is hypothetical as it is not developing in this bi-linear model solution because P > Pyield (see Table 1). It is presented here to demonstrate that for very short sub-elements the dependence ~P look different from those obtained for relatively longer sub-elements. This fact results from the non-monotonic dependence of /L on the bar length L as shown in Figure 16b. This non-monotonic behavior was obtained for all levels of the tensile force. For a large L, this value is equal to 1, indicating the negligible effect of the second bond-stress zone on the element behavior. When L decreases (as low as ~100 mm), the second zone increases (up to ~80% of entire length).
5. Summary and Conclusions
This paper presents an extended formulation of the 1-D tension stiffening problem implementing a bi-linear bond-slip model to allow coverage of a large range of loading and follow cracks growth until reaching their maximum allowable width. Assuming linear elastic behavior of the rebar in tension, only the nonlinear bond-slip relationship and the variation of topology due to cracking development are responsible for the non-linear behavior.
The analytical solution of the problem is developed separately for the low level and for the higher level of loading. The lower level of loading produces limited slips that are within the first bond-slip segment. This formulation yields a closed form solution of the problem. For the higher load levels, the two segments of the bi-linear bond-slip relationship are required. The part of the RC element that is closer to the applied load is characterized by larger slips for which the second bond-slip segment applies. The other part that is closer to the RC element center is characterized by small slips that satisfy the first bond-slip segment law. The transition point between the two zones varies with the level of loading and its location is obtained by a numerical solution of a transcendental equation. In both solutions analytical expressions are obtained for the variation of displacements, strains, and stresses in the rebar and concrete, as well as the slip and bond stress along the interface.
The paper also suggests a repetitive approach to determine the cracking loads at higher load levels and the corresponding analytical expression for the variation of these variables along the sub-elements.
Analysis of the cracking load for any RC element shows that in a relatively long element the cracking force is insensitive to the element length, and in fact several cracks may develop at similar load magnitudes. The general analysis also shows that in a long element the linear and bi-linear solutions yield similar magnitudes of the first cracking load, because in that case the effect of the second bond-slip segment is limited. At higher loads, where further cracking develops, the difference between the cracking forces predicted by the two models increases and is affected by the decreasing sub-element’s length.
The model validation in comparisons with existing test results shows a good agreement. A detailed analysis of a particular RC element is presented as a case study. The analysis demonstrates the increasing difference between the proposed bi-linear and the simpler linear models with increasing load. It also demonstrates the increasing differences in stress and slip variations along the element during the cracking process. This difference is even more pronounced for the bond stress variation. It may be concluded that while the linear bond-slip representation may provide good results for the lower load levels, the bi-linear bond-slip model covers well the relevant bond-slip range that is compatible with the allowable crack width range and predicts results that are in good agreement with the experimental data.
These conclusions demonstrate the superiority of the present model to more accurate evaluation of the cracks development during loading up to high loading levels, where the nonlinear behavior of the bond-slip curve is effective. An example shows that the difference may affect the number of cracks and their widths, which is crucial for a reliable assessment required to satisfy the serviceability limit state of reinforced-concrete bridges. The present model may cover the entire range of crack width up to the maximum size allowed by the standards. It provides the analytical expressions that allow re-consideration of design parameters and examine their effect on the crack width.
Author Contributions
Conceptualization, D.Z.Y.; Methodology, D.Z.Y.; Validation, Y.S.K.; Formal analysis, Y.S.K. and V.R.F.; Investigation, D.Z.Y., Y.S.K. and V.R.F.; Supervision, D.Z.Y.; Writing—original draft preparation, Y.S.K.; Writing—review & editing, D.Z.Y., Y.S.K. and V.R.F. All authors have read and agreed to the published version of the manuscript.
Funding
This research received no external funding.
Institutional Review Board Statement
Not applicable.
Informed Consent Statement
Not applicable.
Data Availability Statement
The study did not report any data.
Acknowledgments
This work was supported by a joint grant from the Centre for Absorption in Science of the Ministry of Immigrant Absorption, the Committee for Planning and Budgeting of the Council for Higher Education under the framework of the KAMEA Program.
Conflicts of Interest
The authors declare no conflict of interest.
References
- Sharabi, M.N. Numerical modeling of reinforced-concrete bond. Nucl. Eng. Des. 1986, 91, 207–216. [Google Scholar] [CrossRef]
- Lettow, S.; Eligehausen, R. The Simulation of Bond between Concrete and Reinforcement in Nonlinear Three-dimensional Finite Element Analysis. In Proceedings of the 5th International PhD Symposium in Civil Engineering, Delft, The Netherlands, 19–21 September 2003; University of Stuttgart: Stuttgart, Germany, 2003. [Google Scholar]
- Ožbolt, J.; Lettow, S.; Kožar, I. Discrete Bond Element for 3d Finite Element Analysis of Reinforced Concrete Structures. In Beiträge aus der Befestigungstechnik und dem Stahlbetonbau, Proceedings of the 3rd International Symposium: Bond in Concrete-from Research to Standards, Budapest, Hungary, 20–22 November 2002; University of Technology and Economics: Budapest, Hungary, 2002. [Google Scholar]
- Lundgren, K.; Gylltoft, K. Three-Dimensional Modelling of Bond. In Advanced Design of Concrete Structures; CIMNE: Barcelona, Spain, 1997; pp. 65–72. [Google Scholar]
- Chan, H.C.; Cheung, Y.K.; Huang, Y.P. Crack analysis of reinforced concrete tension members. J. Struct. Eng. 1992, 118, 2118–2132. [Google Scholar] [CrossRef]
- Aryanto, A.; Shinohara, Y. Bond Behavior between Steel and Concrete in Low Level Corrosion of Reinforcing Steel. In Proceedings of the 15th World Conference on Earthquake Engineering, Lisbon, Portugal, 24–28 September 2012; pp. 2039–2048. [Google Scholar]
- Beeby, A.W.; Scott, R.H. Mechanism of long-term decay of tension stiffening. Mag. Concr. Res. 2006, 580, 255–266. [Google Scholar] [CrossRef]
- Vollum, R.L.; Afshar, N.; Izzuddin, B.A. Modelling short-term tension stiffening in tension members. Mag. Concr. Res. 2008, 60, 291–300. [Google Scholar] [CrossRef]
- Wenkenbach, I. Tension Stiffening in Reinforced Concrete Members with Large Diameter Reinforcement. Ph.D. Thesis, Durham University, Durham, UK, 2011. [Google Scholar]
- Rizkalla, S.H.; Hwang, L.S.; El Shahawi, M. Transverse reinforcement effect on cracking behavior of RC members. Can. J. Civ. Eng. 1983, 10, 566–581. [Google Scholar] [CrossRef]
- Houde, J.; Mirza, M.S. A study of bond stress-slip relationship in reinforced concrete. J. Proc. 1972, 76, 19–46, No. 72-8. [Google Scholar]
- Di Prisco, M.; Plizzari, G.; Vandewalle, L. Fiber reinforced concrete: New design perspectives. Mater. Struct. 2009, 42, 1261–1281. [Google Scholar] [CrossRef]
- Deluce, J.R.; Vecchio, F.J. Cracking behavior of steel fiber-Reinforced concrete members containing conventional reinforcement. ACI Struct. J. 2013, 110, 481–490. [Google Scholar]
- Dancygier, A.N.; Karinski, Y.S.; Navon, Z. Cracking localization in tensile conventionally reinforced fibrous concrete bars. Constr. Build. Mater. 2017, 149, 53–61. [Google Scholar] [CrossRef]
- Leibovich, O.; Yankelevsky, D.Z.; Dancygier, A.N. Role of Internal Damage Mechanisms in Controlling Bond-Slip Behavior in Pullout Tests in Concrete. J. Mater. Civ. Eng. 2019, 31, 1–14. [Google Scholar] [CrossRef]
- Leibovich, O.; Yankelevsky, D.Z.; Dancygier, A.N. Circumferential strains of a concrete specimen in a pullout test. Struct. Concr. 2019, 20, 986–995. [Google Scholar] [CrossRef]
- Fib Model Code for Concrete Structures 2010; Ernst & Sohn, Wiley: Berlin, Germany, 2013.
- Yankelevsky, D.Z.; Karinski, Y.S.; Feldgun, V.R. Analytical Modeling of Crack Widths and Cracking Loads in Structural RC Members. Infrastructures 2022, 7, 40. [Google Scholar] [CrossRef]
- ACI PRC-224-01; Control of Cracking in Concrete Structures (Reapproved 2008). ACI: Farmington Hills, MI, USA, 2002.
- Yankelevsky, D.Z. A new finite element for bond–slip analysis. J. Struct. Eng. Div. 1984, 11, 1533–1542. [Google Scholar] [CrossRef]
- Yankelevsky, D.Z. A two-phase one-dimensional model for steel concrete interaction. Comput. Struct. 1997, 65, 781–794. [Google Scholar] [CrossRef]
- Yankelevsky, D.Z.; Jabareen, M.; Abutbul, A.D. One-dimensional analysis of tension stiffening in reinforced concrete with discrete cracks. Eng. Struct. 2008, 30, 206–217. [Google Scholar] [CrossRef]
Figure 1.
The Fib Model Code [17] bond-slip relationship. (a) The complete bond-slip relationship; (b) view at the slip range S < 0.15 mm.
Figure 1.
The Fib Model Code [17] bond-slip relationship. (a) The complete bond-slip relationship; (b) view at the slip range S < 0.15 mm.

Figure 2.
Problem definition. (a) RC element; (b) Bi-linear bond-slip relationship.

Figure 3.
The differential element. (a) General scheme; (b) The differential elements.

Figure 4.
Dependence of cracking load on the rebar length.

Figure 5.
Bar elongations.

Figure 6.
Displacements, slip, and stress distributions along the element half-length. (a) rebar displacement; (b) concrete displacement; (c) rebar stress, (d) concrete stress; (e) slip; (f) bond stress.
Figure 6.
Displacements, slip, and stress distributions along the element half-length. (a) rebar displacement; (b) concrete displacement; (c) rebar stress, (d) concrete stress; (e) slip; (f) bond stress.


Figure 7.
Dependence of cracking forces for linear [18] and bi-linear models on the bar length. (a) The entire range of half-length L; (b) Zoom at half-length L > 200 mm.
Figure 7.
Dependence of cracking forces for linear [18] and bi-linear models on the bar length. (a) The entire range of half-length L; (b) Zoom at half-length L > 200 mm.

Figure 8.
Comparison of bar elongation [10].
Figure 8.
Comparison of bar elongation [10].

Figure 9.
Comparison of bar elongation [11]. (a) axisymmetric bar; (b) prismatic bar.
Figure 9.
Comparison of bar elongation [11]. (a) axisymmetric bar; (b) prismatic bar.

Figure 10.
Bar elongation for the cracking process. (a) entire range of loading; (b) zoomed zone of first and second cracks initialization.
Figure 10.
Bar elongation for the cracking process. (a) entire range of loading; (b) zoomed zone of first and second cracks initialization.

Figure 11.
Slip and stresses distributions after first crack formation (P = 20.84 kN). (a) bond stress; (b) slip; (c) concrete stress; (d) rebar stress.
Figure 11.
Slip and stresses distributions after first crack formation (P = 20.84 kN). (a) bond stress; (b) slip; (c) concrete stress; (d) rebar stress.


Figure 12.
Concrete and rebar displacements along half-length of the element after the 1st cracking stage. (a) Rebar; (b) Concrete.
Figure 12.
Concrete and rebar displacements along half-length of the element after the 1st cracking stage. (a) Rebar; (b) Concrete.

Figure 13.
Slip and stresses distributions after second cracking stage (P = 20.9 kN). (a) bond stress; (b) slip; (c) concrete stress; (d) rebar stress.
Figure 13.
Slip and stresses distributions after second cracking stage (P = 20.9 kN). (a) bond stress; (b) slip; (c) concrete stress; (d) rebar stress.


Figure 14.
Slip and stresses distributions after third cracking stage (P = 23.36 kN). (a) bond stress; (b) slip; (c) concrete stress; (d) rebar stress.
Figure 14.
Slip and stresses distributions after third cracking stage (P = 23.36 kN). (a) bond stress; (b) slip; (c) concrete stress; (d) rebar stress.

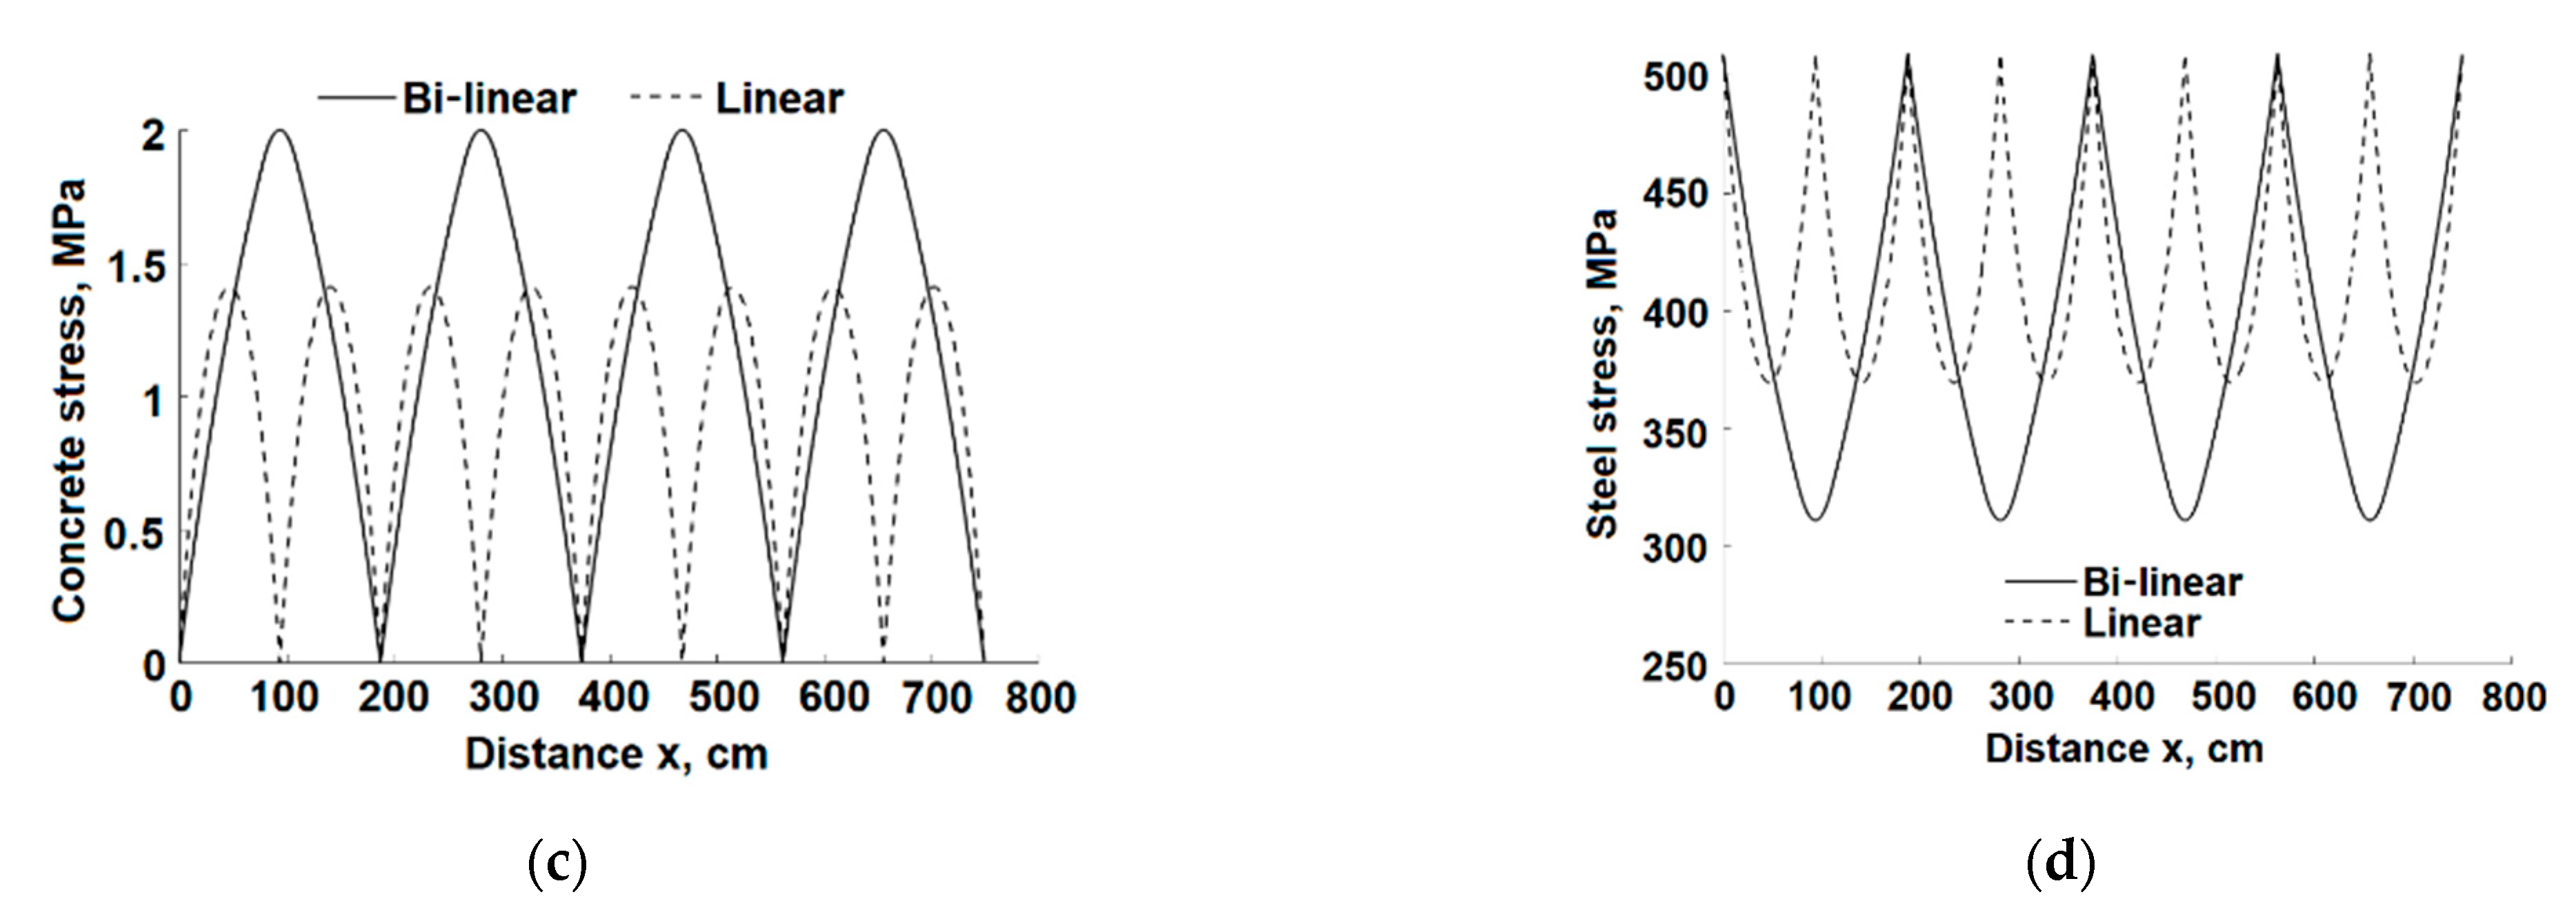
Figure 15.
Slip and stresses distributions at the rebar yielding (P = 40.00 kN). (a) bond stress; (b) slip; (c) concrete stress; (d) rebar stress.
Figure 15.
Slip and stresses distributions at the rebar yielding (P = 40.00 kN). (a) bond stress; (b) slip; (c) concrete stress; (d) rebar stress.


Figure 16.
Boundary between the 1st and second bond-slip zones. (a) dependence on tensile load; (b) dependence on the bar length.
Figure 16.
Boundary between the 1st and second bond-slip zones. (a) dependence on tensile load; (b) dependence on the bar length.


Table 1.
Cracking forces.
| Cracking Stage | Length of Uncracked Sub-Element (mm) | Pcr−L (kN) | Pcr−BL (kN) |
|---|---|---|---|
| 1st cracking stage | 750.00 | 20.81 | 20.81 |
| 2nd cracking stage | 375.00 | 20.85 | 20.87 |
| 3d cracking stage | 187.50 | 22.11 | 23.32 |
| 4th cracking stage | 93.75 | 31.18 | 57.99 * |
* Theoretical value (see Equations (70) and (71)) that exceeds the rebar yield limit of ~40 kN.
Publisher’s Note: MDPI stays neutral with regard to jurisdictional claims in published maps and institutional affiliations. |
© 2022 by the authors. Licensee MDPI, Basel, Switzerland. This article is an open access article distributed under the terms and conditions of the Creative Commons Attribution (CC BY) license (https://creativecommons.org/licenses/by/4.0/).
Share and Cite
MDPI and ACS Style
Karinski, Y.S.; Yankelevsky, D.Z.; Feldgun, V.R. Bi-Linear Bond-Slip Modelling for 1-D Tension Stiffening Behavior of a RC Element. Infrastructures 2022, 7, 125. https://doi.org/10.3390/infrastructures7100125
AMA Style
Karinski YS, Yankelevsky DZ, Feldgun VR. Bi-Linear Bond-Slip Modelling for 1-D Tension Stiffening Behavior of a RC Element. Infrastructures. 2022; 7(10):125. https://doi.org/10.3390/infrastructures7100125
Chicago/Turabian StyleKarinski, Yuri S., David Z. Yankelevsky, and Vladimir R. Feldgun. 2022. "Bi-Linear Bond-Slip Modelling for 1-D Tension Stiffening Behavior of a RC Element" Infrastructures 7, no. 10: 125. https://doi.org/10.3390/infrastructures7100125