
Flood Risk Assessment Index for Urban Mobility with the Aid of Quasi-2d Flood Model Applied to an Industrial Park in São Paulo, Brazil
 , and
, and
Abstract
:1. Introduction
2. Literature Review
2.1. Risk Assessment Definitions
2.2. Urban Transport Disruption
3. Materials and Methods
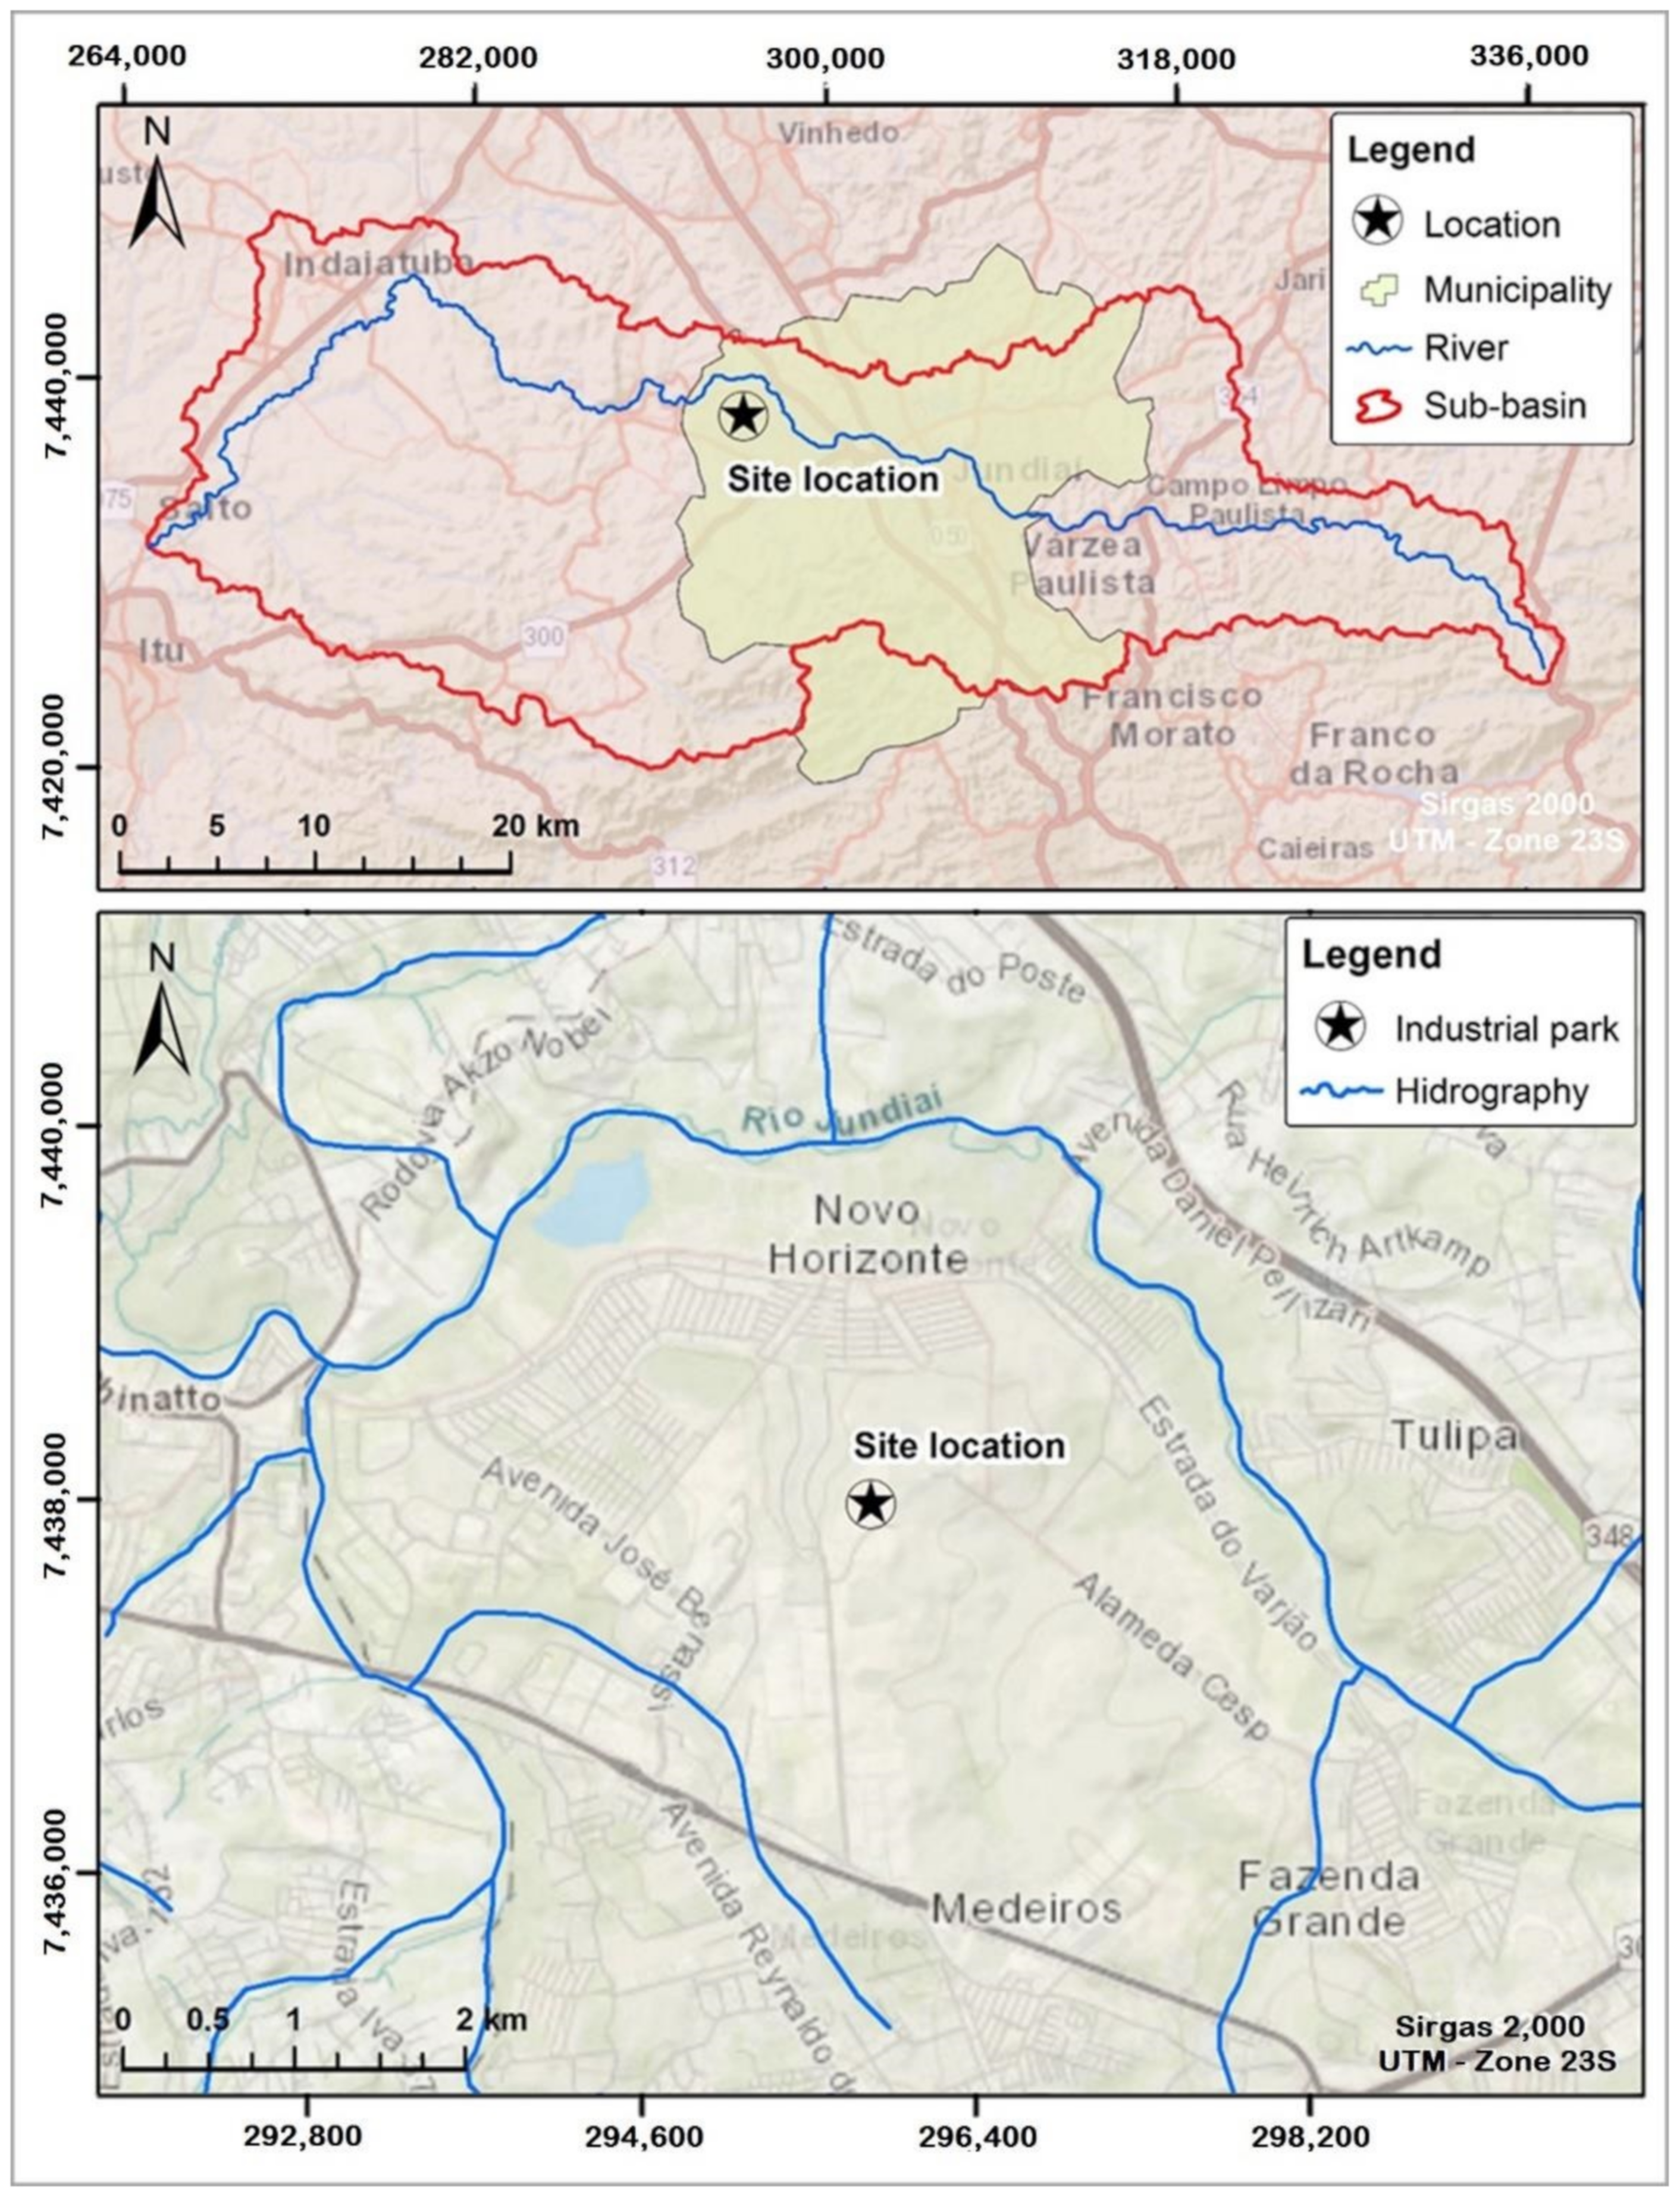
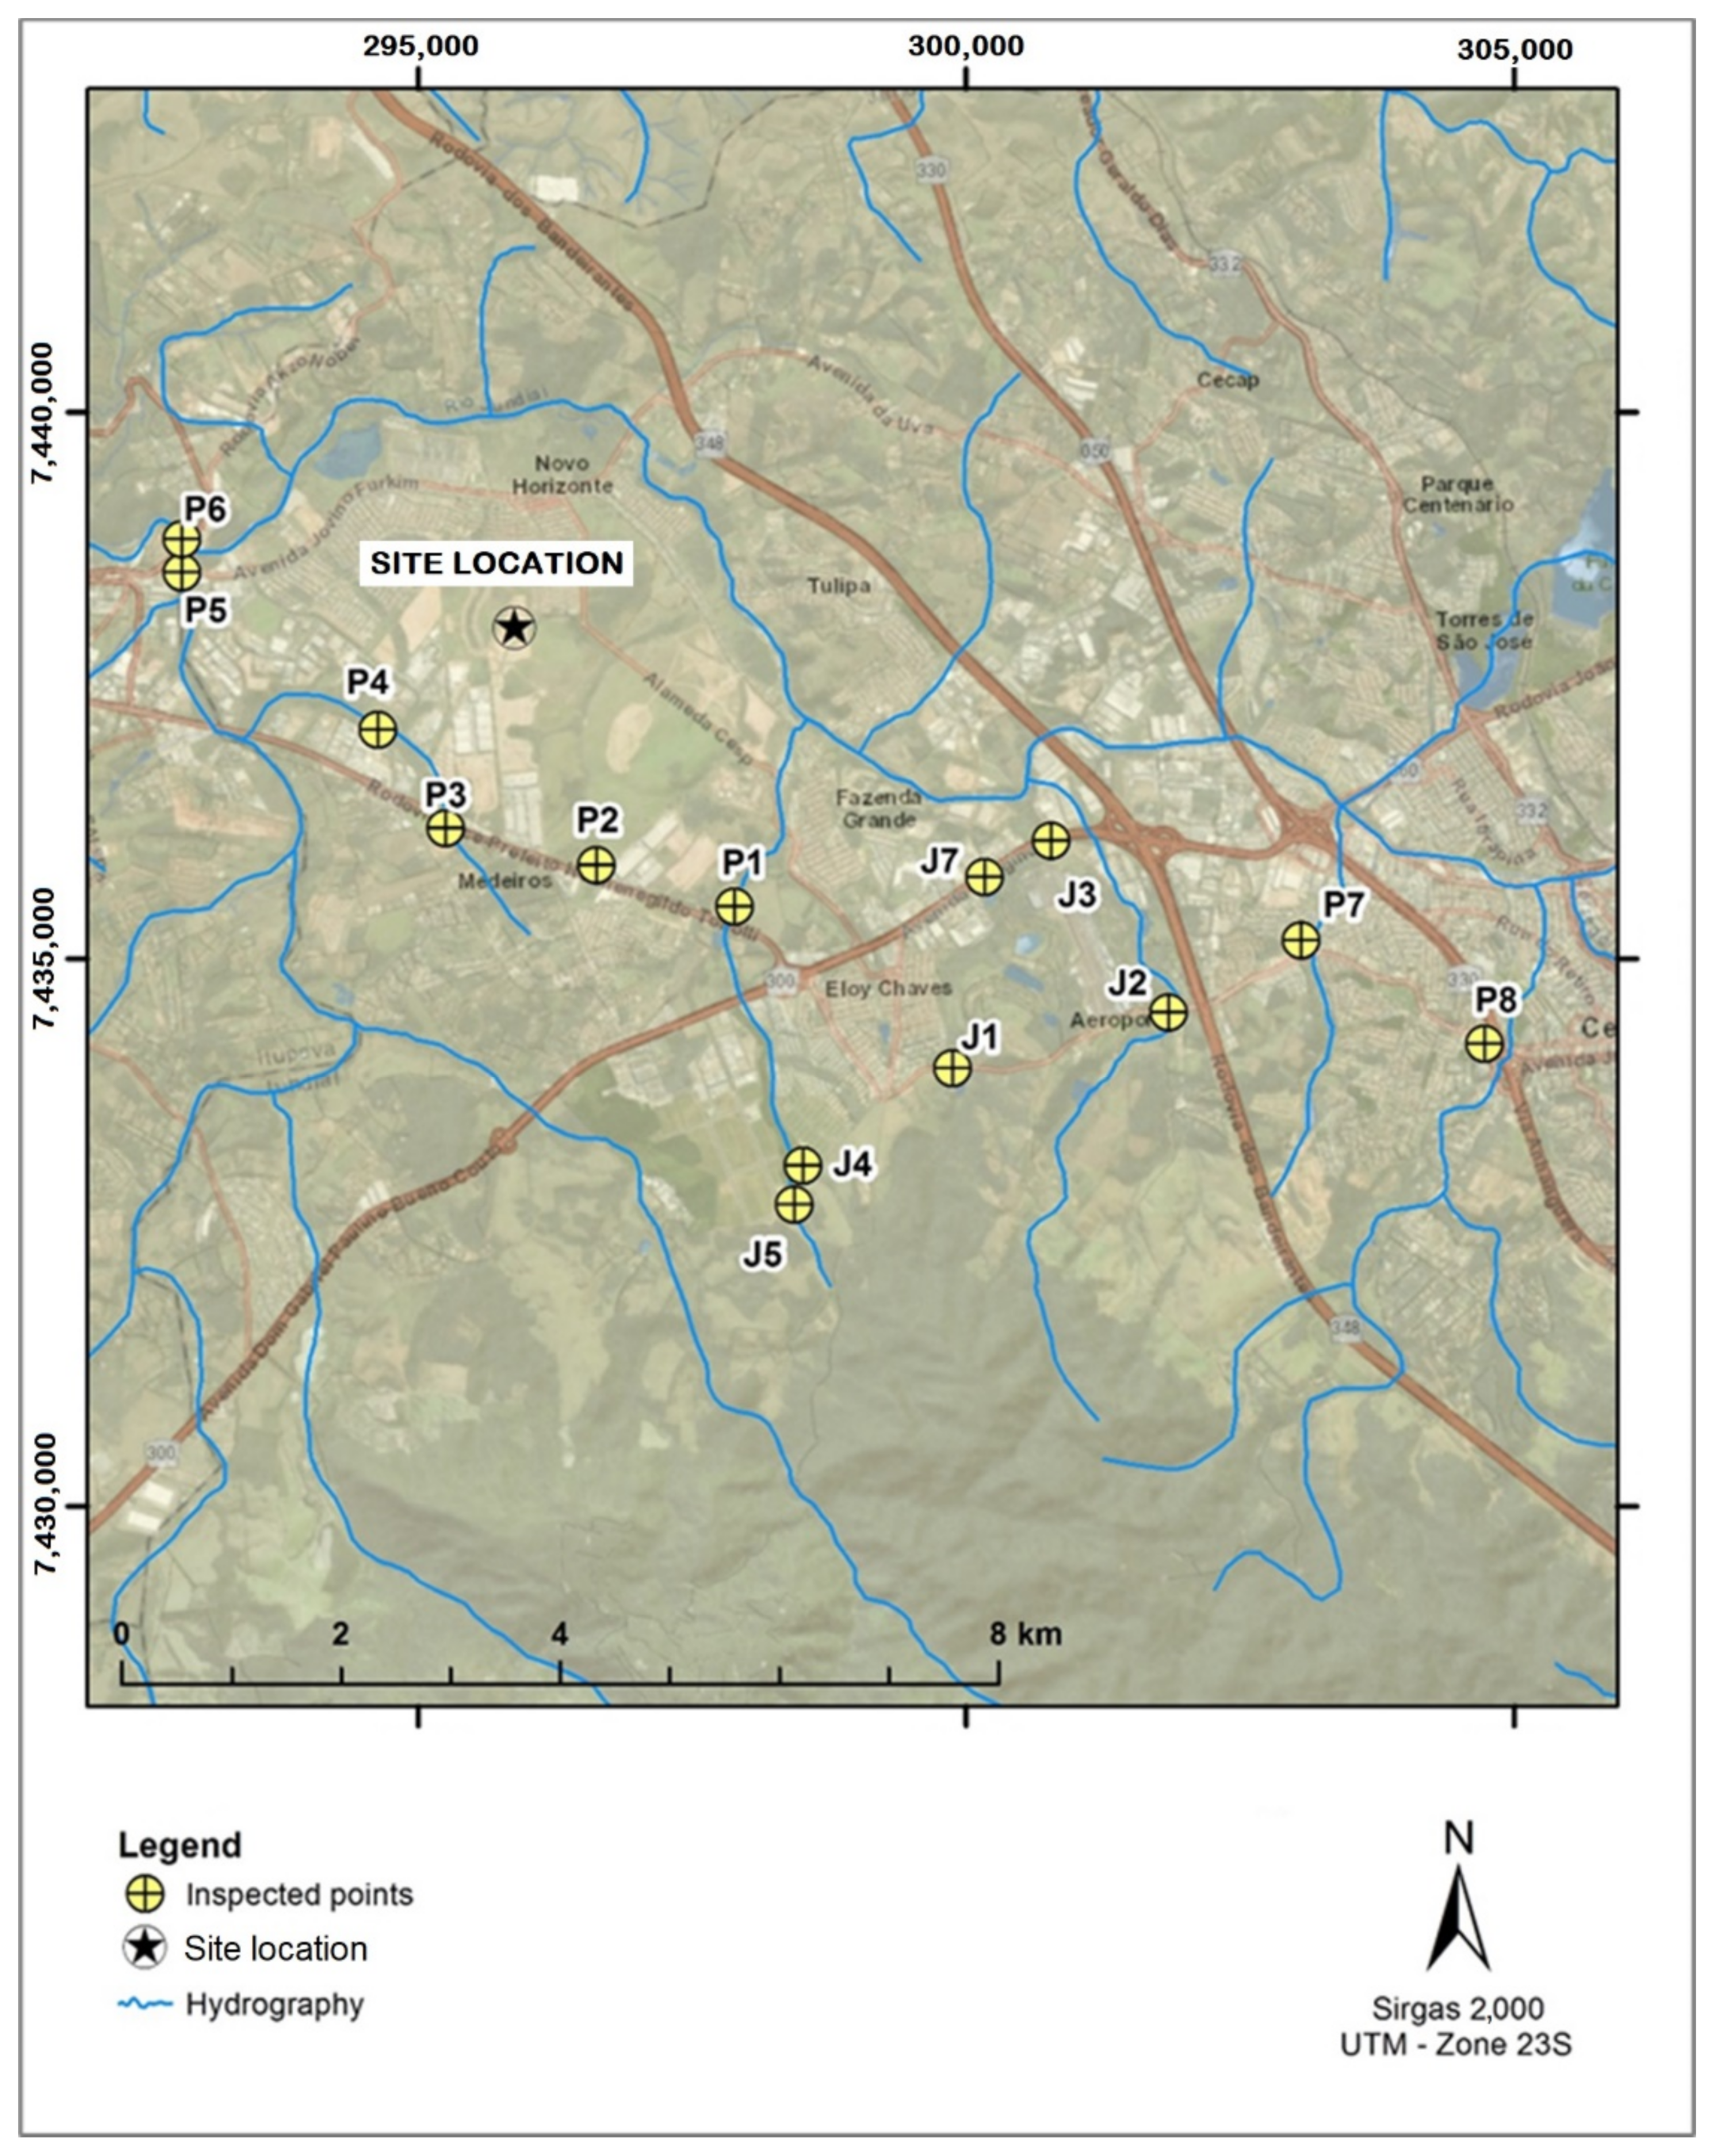
3.1. Study Area
3.2. Research Procedure
3.2.1. Phase 1: Previous Studies
3.2.2. Phase 2: The Vulnerability to Floods Assessment
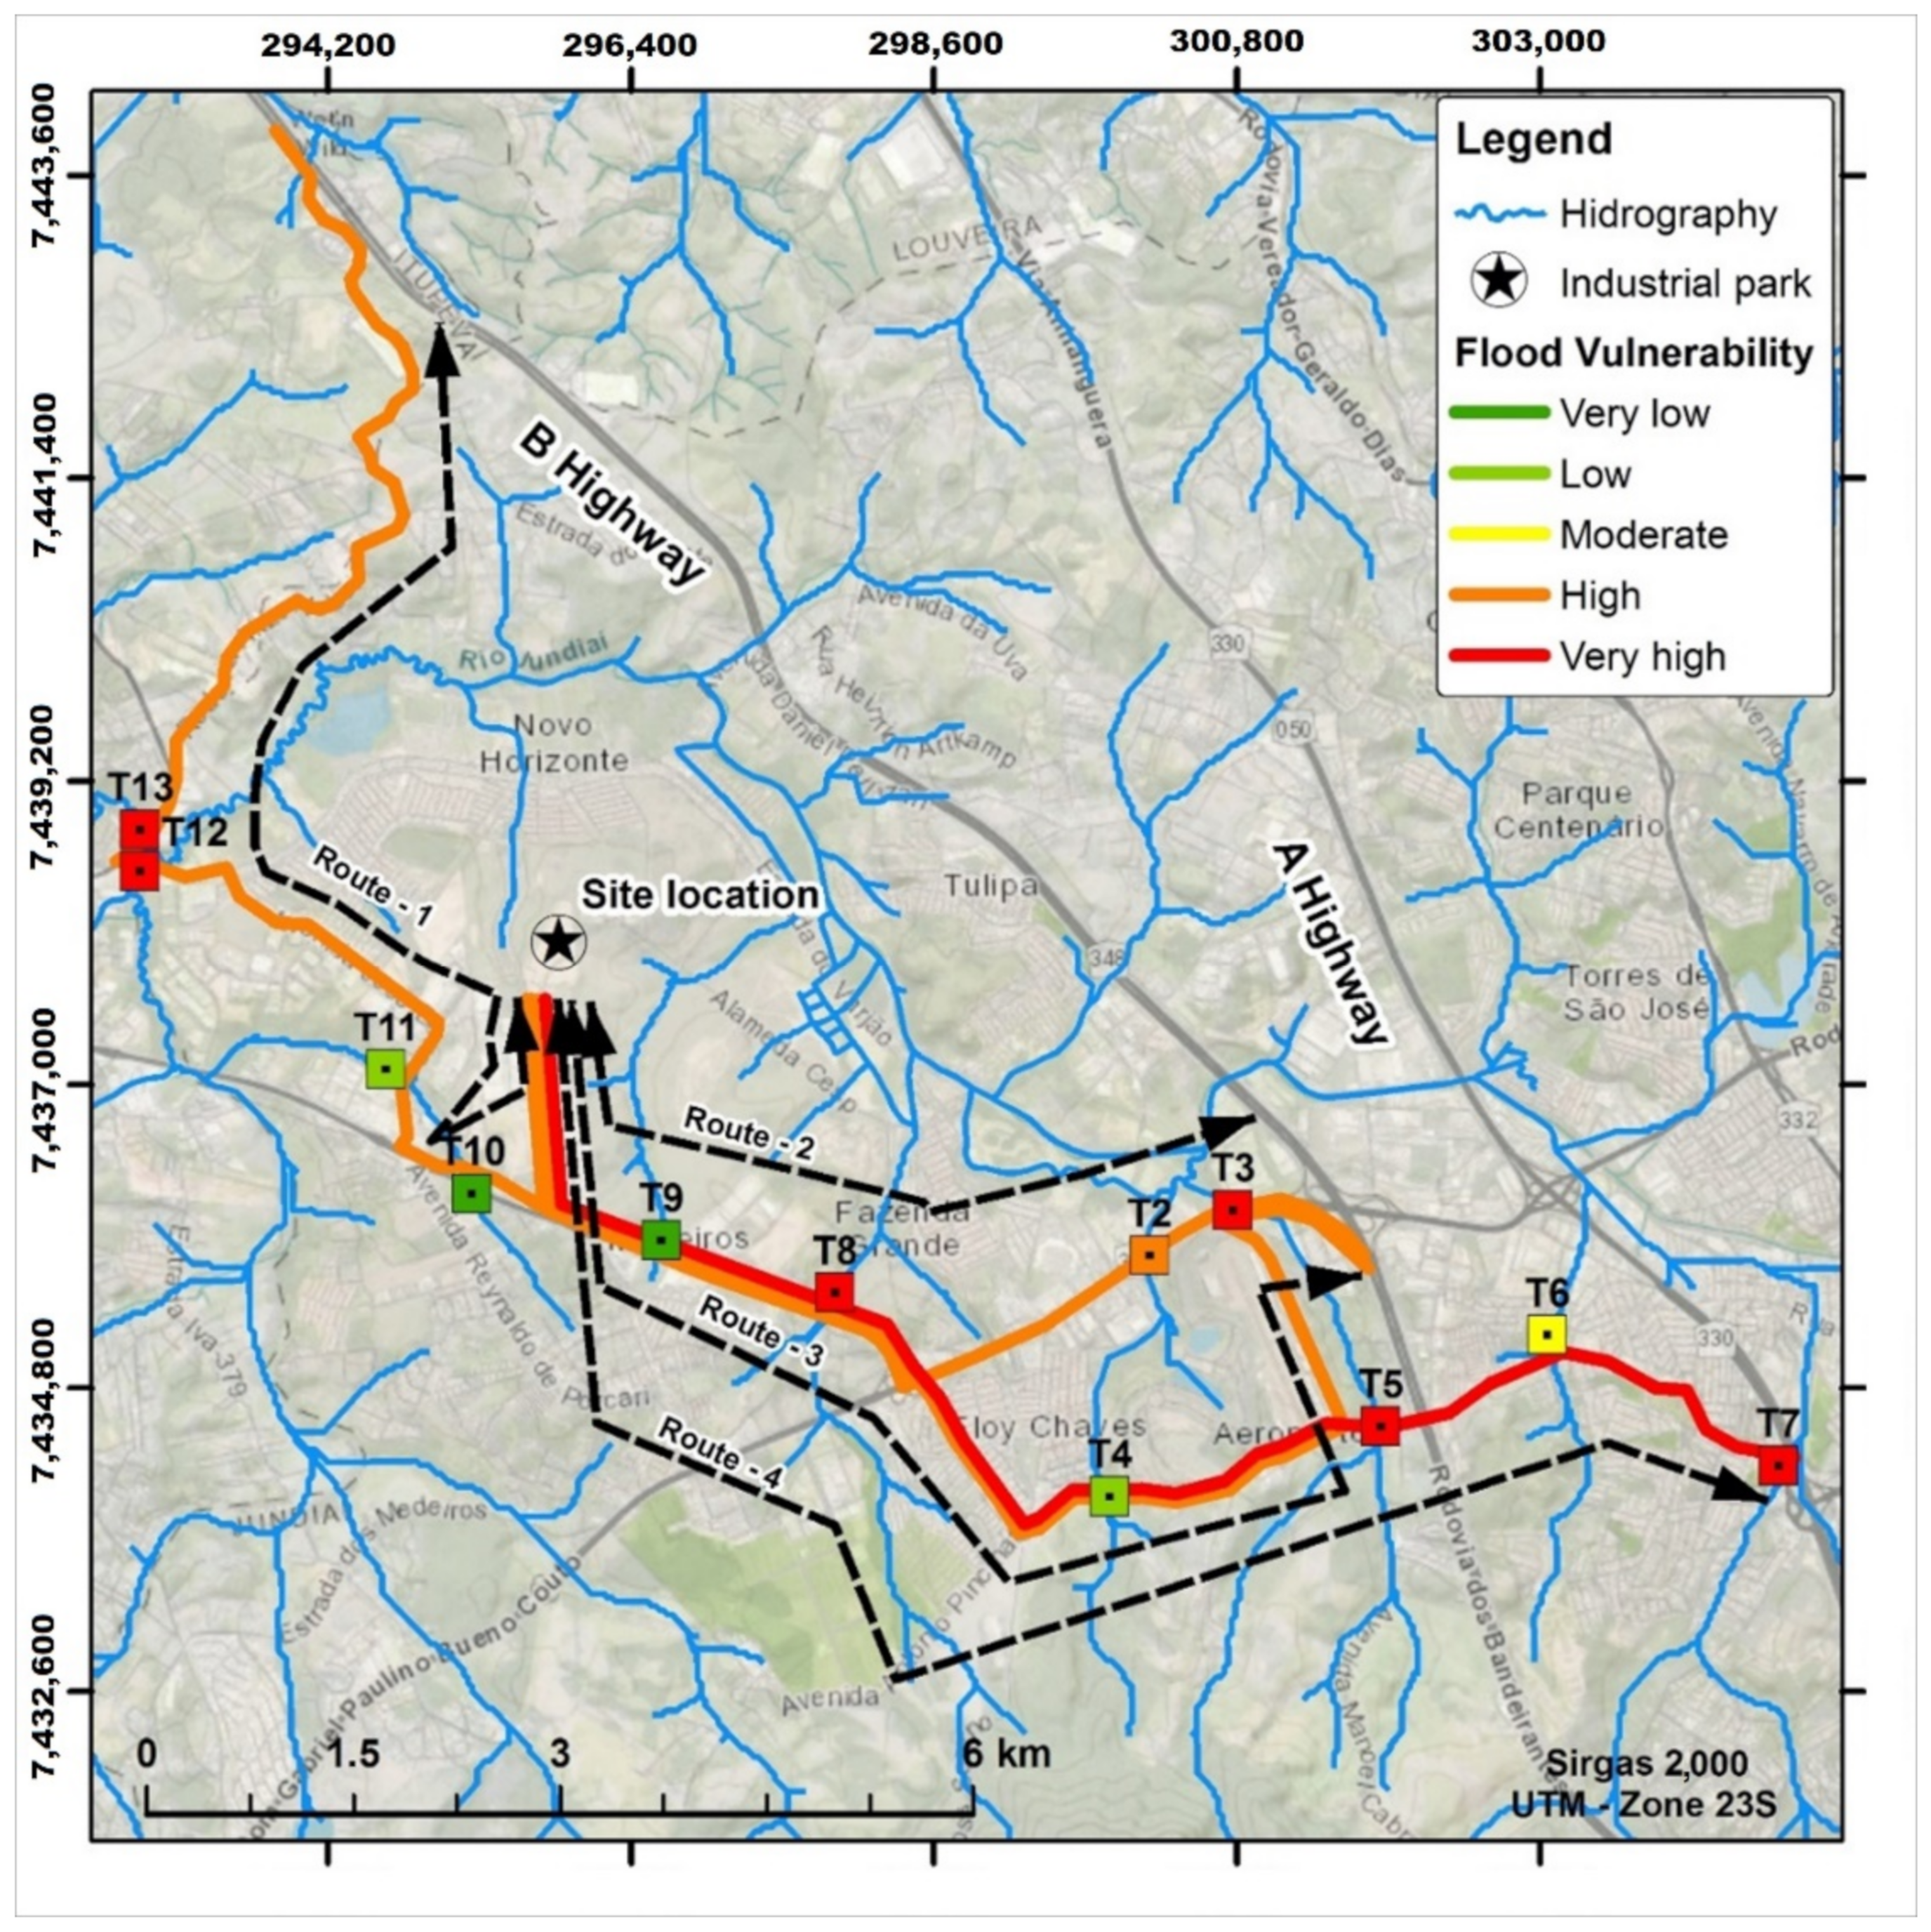
- Indicating the possible routes between the site and the nearest highway.
- Highlighting the existing bridges and culverts on each route.
- Defining the watershed area of each river crossing (bridges and culverts).
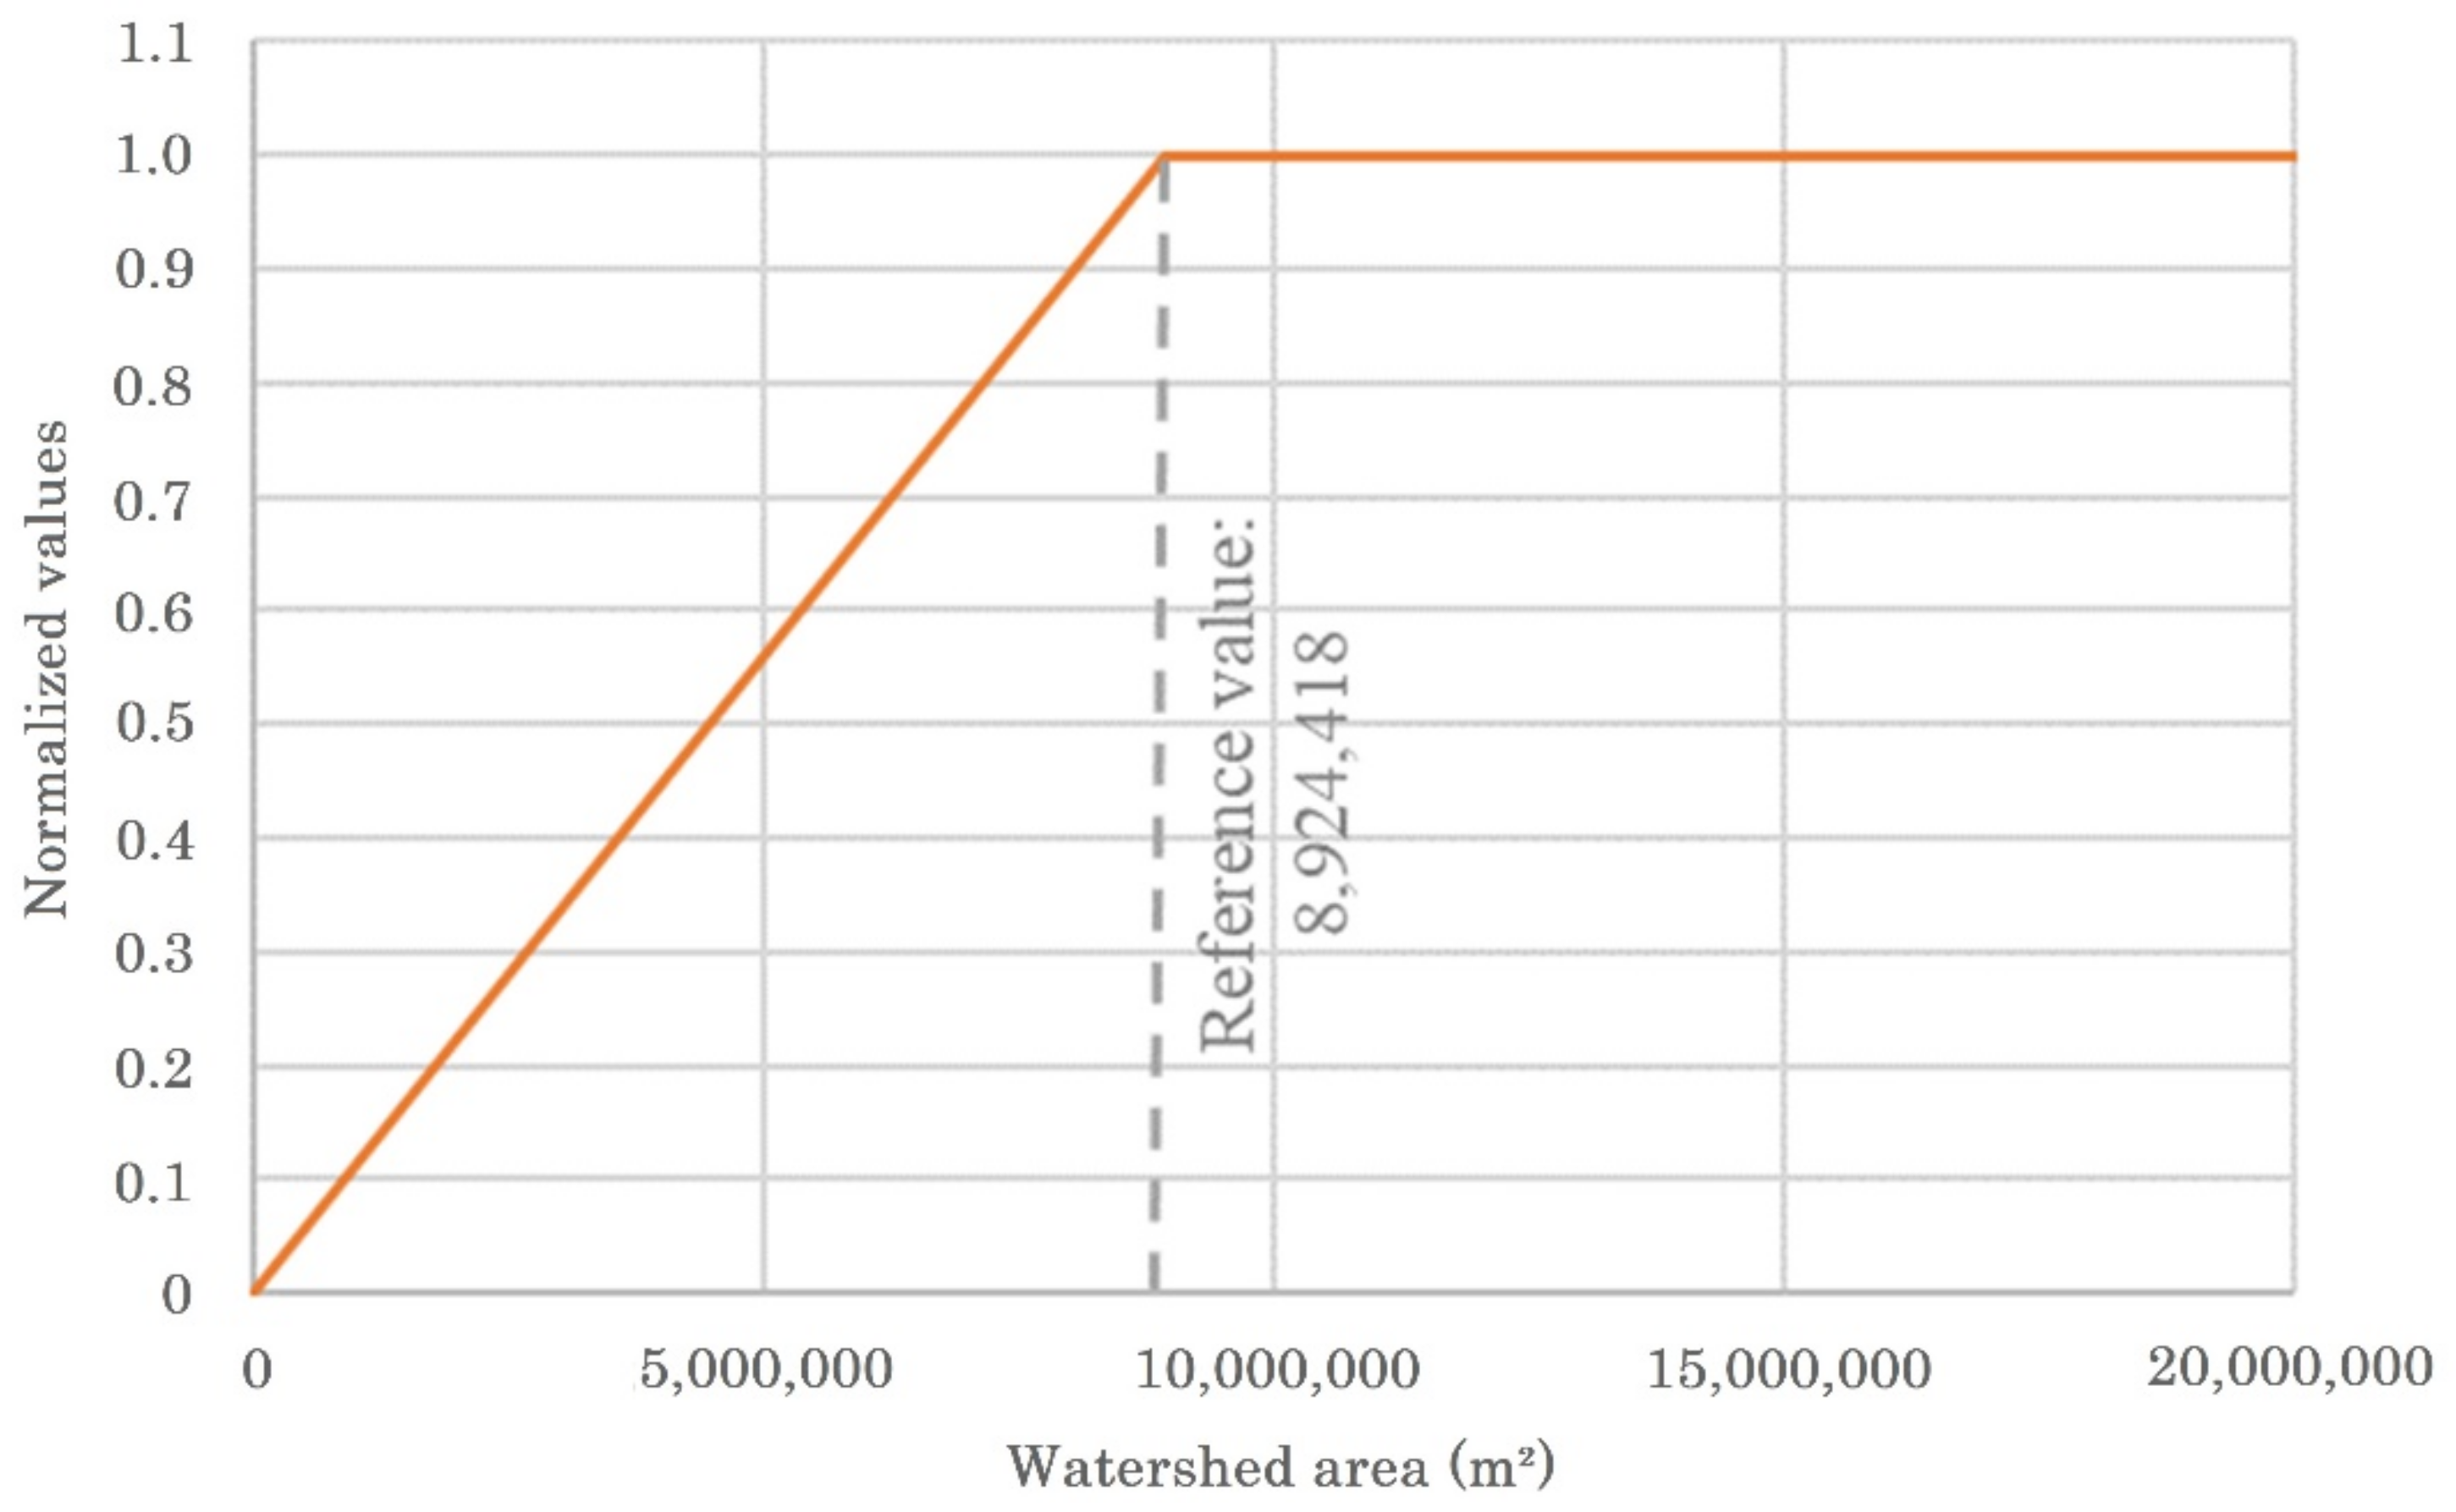
- Calculating the hydrological vulnerability of each river crossing based on the normalization of its watershed area with values between 0 and 1, with a higher value being more vulnerable (Equation (1)).where:
- wa—watershed areas of each river crossing (m2);
- hv—hydrological vulnerability of a river crossing;
- —area normalization function. The area equivalent to the density value for the third quartile of the entire sample is taken as a reference value. Any watershed with an area greater than this reference value is at the maximum normalized value, that is equal to 1. For watersheds with areas smaller than this reference, the normalized value is based on a linear distribution. This procedure was made to reduce possible “flattening” of the evaluation scale, due to the presence of extreme values.
- Computing the route vulnerability. The route vulnerability is then given by the highest value among two options (OP 1 and OP 2). This configuration aims to eliminate the potential bias of routes with several river crossings, but only a few of them with high vulnerability, in a situation that could lead to a false low value of vulnerability. The adopted options were:
- OP 1: the route vulnerability is given by the simple average of the hydrological vulnerability of all existing river crossings on the route (Equation (2));where:
- —route vulnerability option 1;
- hv—hydrological vulnerability of existing river crossings on the route;
- n—number of all of the existing river crossings on the route.
- OP 2: the route vulnerability is given by the normalization of the average watershed area of all river crossings on its way. Firstly, the average area of the watershed of all river crossings on each route is taken (Equation (3)). Then this average area value is normalized with the same normalization function previously presented (Equation (4)).where:
- AWA—average of watershed areas of all river crossings on the route (m2);
- wa—watershed areas of each river crossing on the route (m2);
- n—number of all of the existing river crossings on the route.
- —route vulnerability option 2;
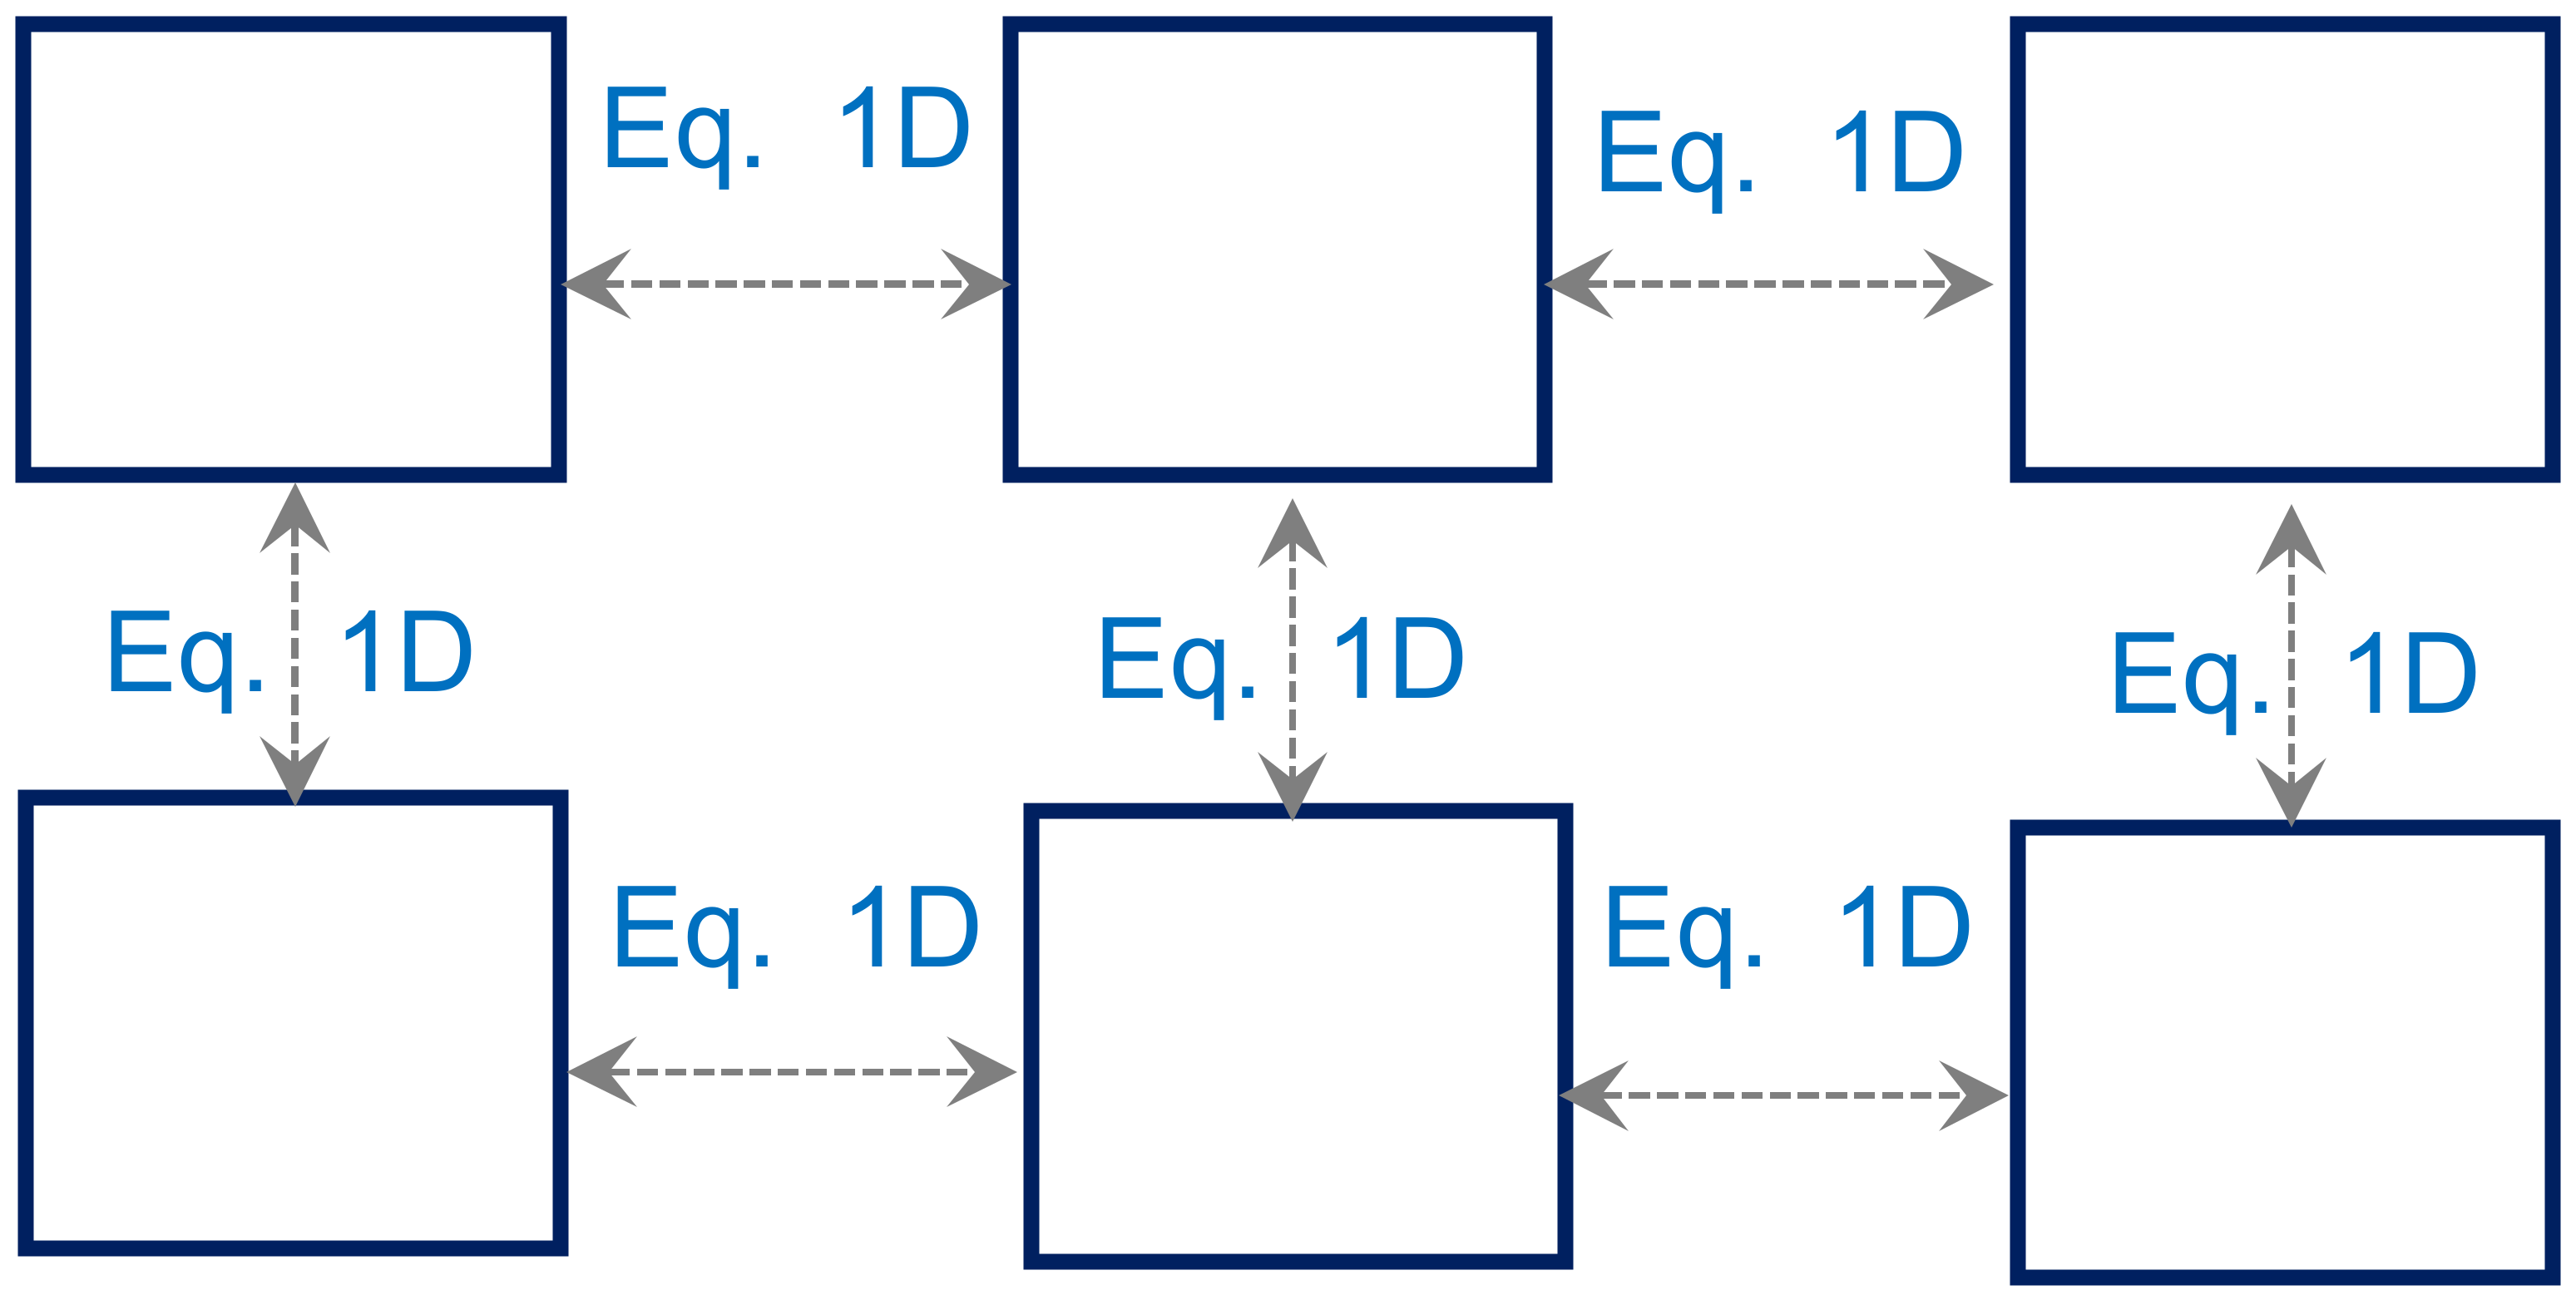
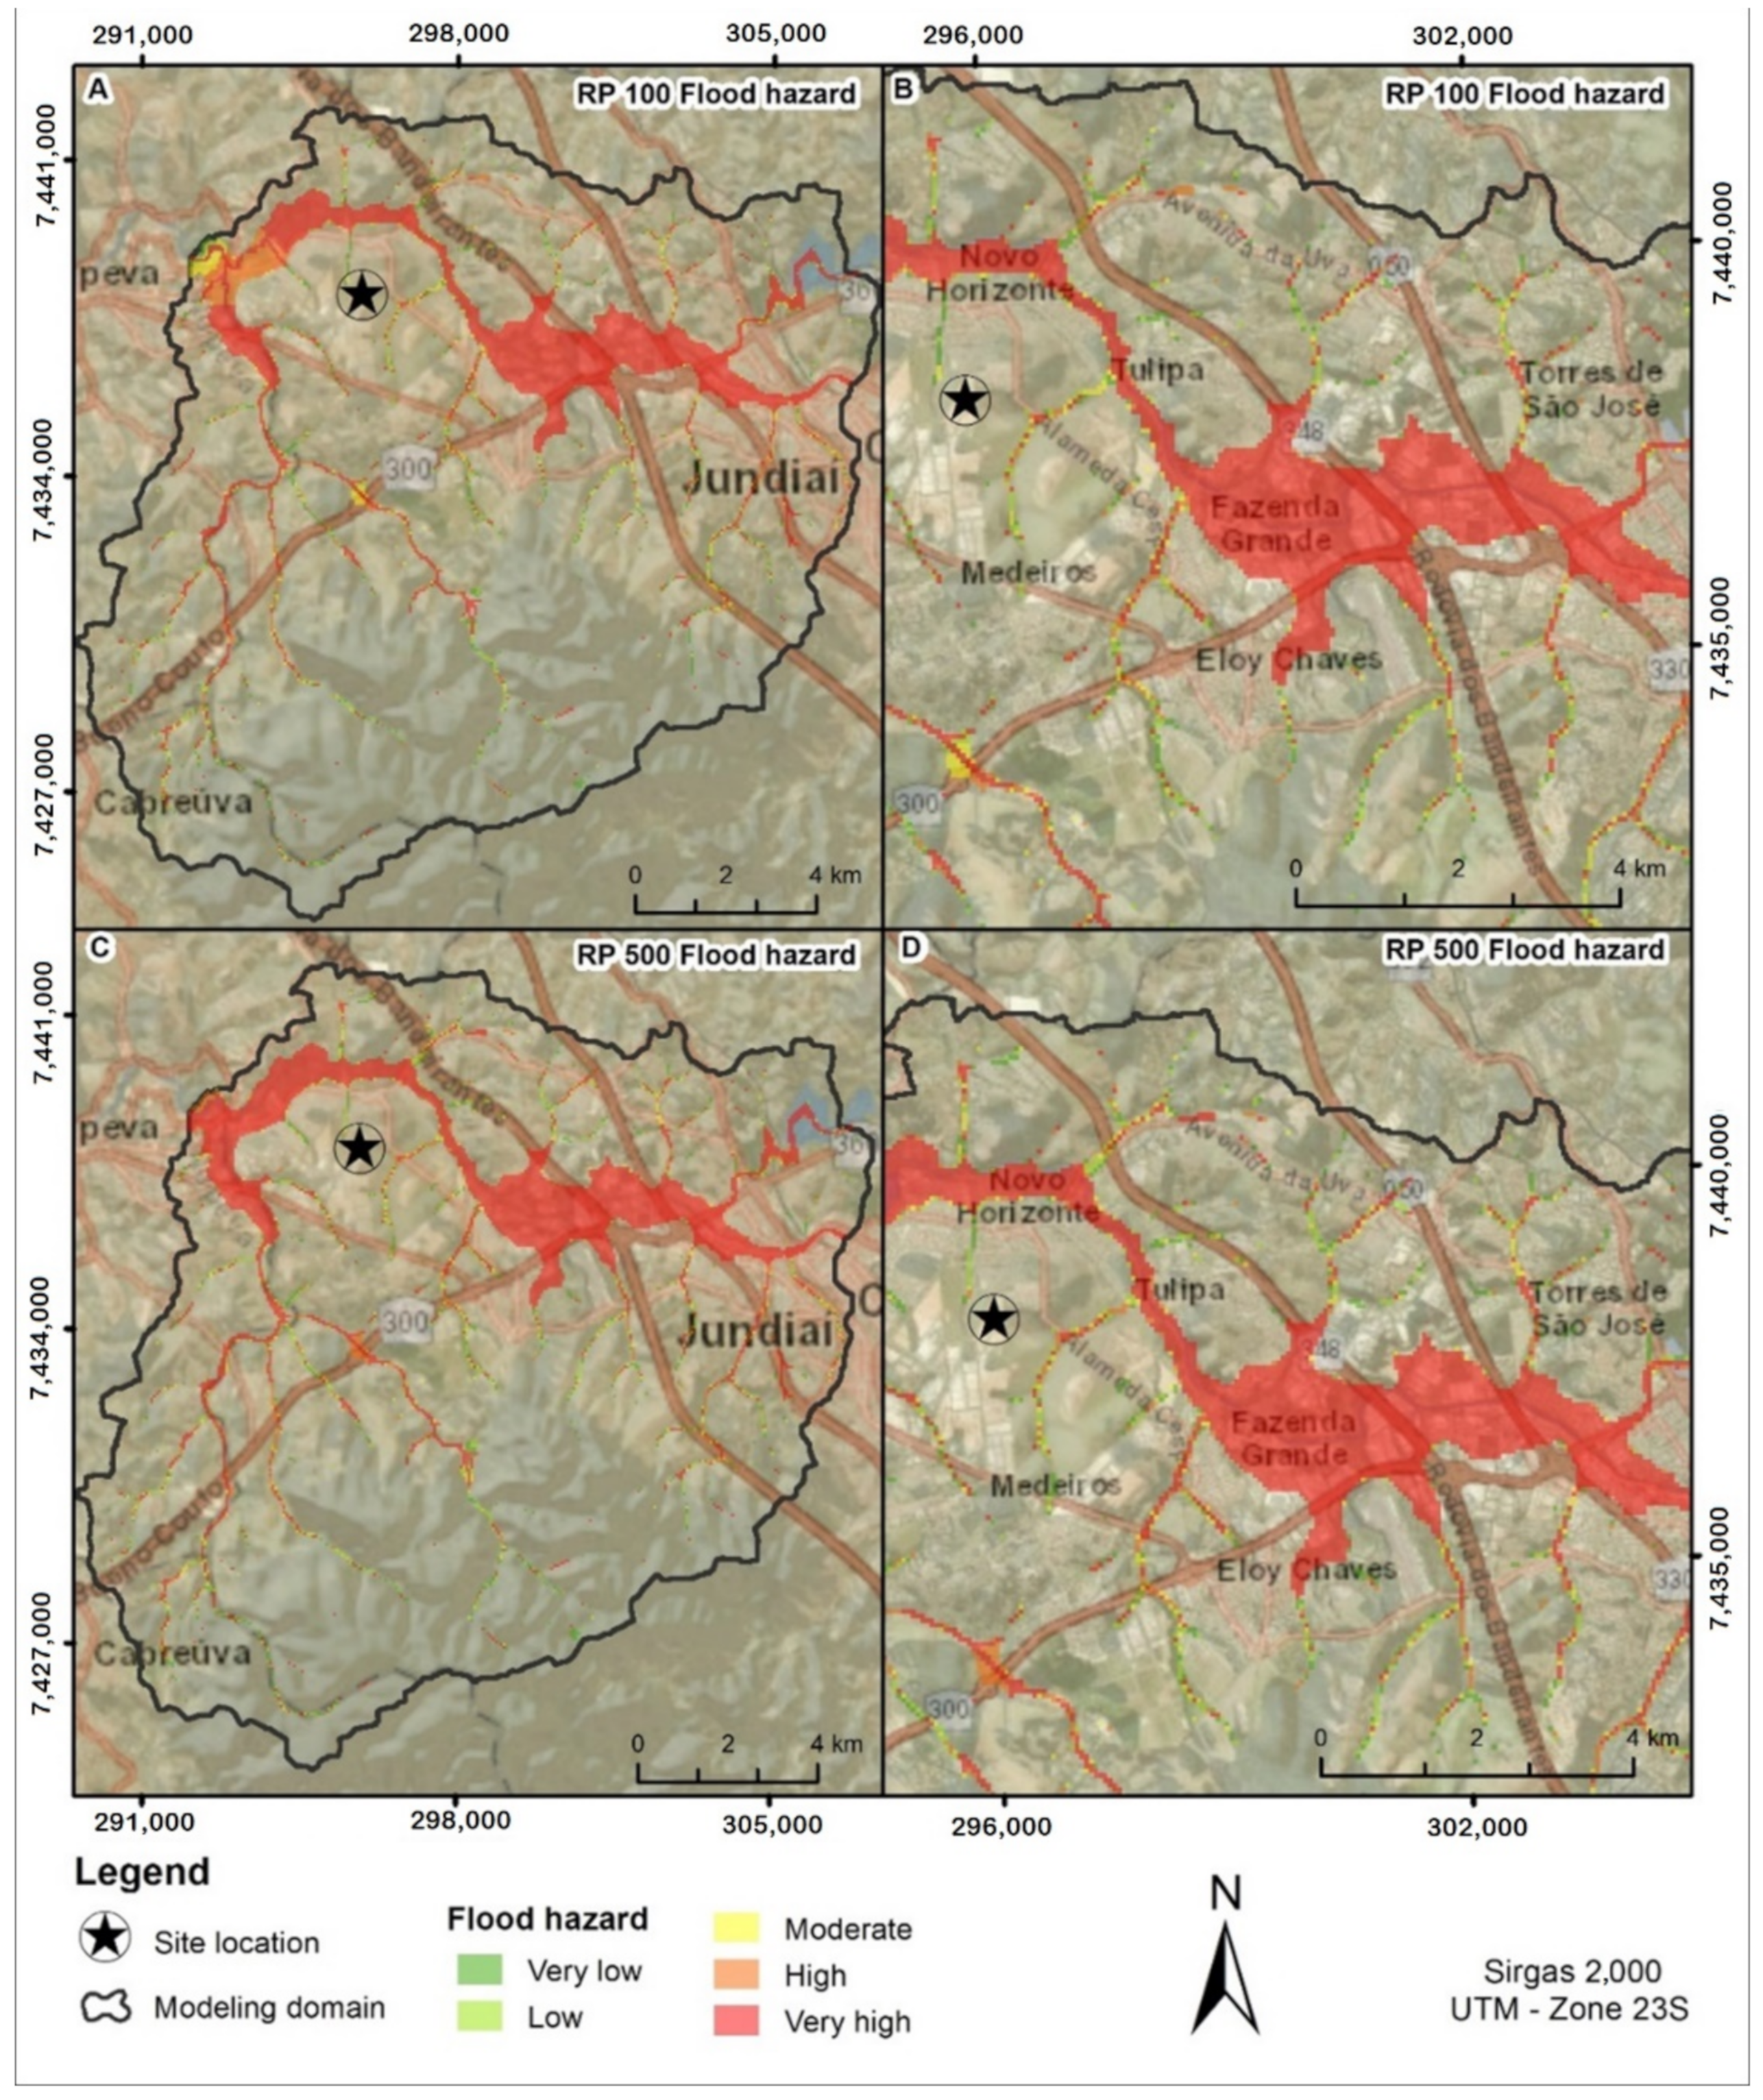
3.2.3. Phase 3: The Flood Hazard Assessment
- Qi,k—discharge between neighboring cells i and k;
- Zi—water level in the center of the cell i;
- Asi—the surface area of the water mirror in the cell i;
- Pi—discharge produced by the rainfall occurring on the cell i;
- t—independent time variable.
3.2.4. Phase 4: The Risk Assessment
- R—flood risk;
- V—flood vulnerability;
- H100—Flood hazard for the 100-year storm. Equivalent to the maximum flood depth resulting from the 100-year storm;
- H500—Flood hazard for the 500-year storm. Equivalent to the maximum flood depth resulting from the 500-year storm.
4. Results
4.1. Phase 1: Previous Studies
4.2. Phase 2: The Flood Vulnerability Assessment
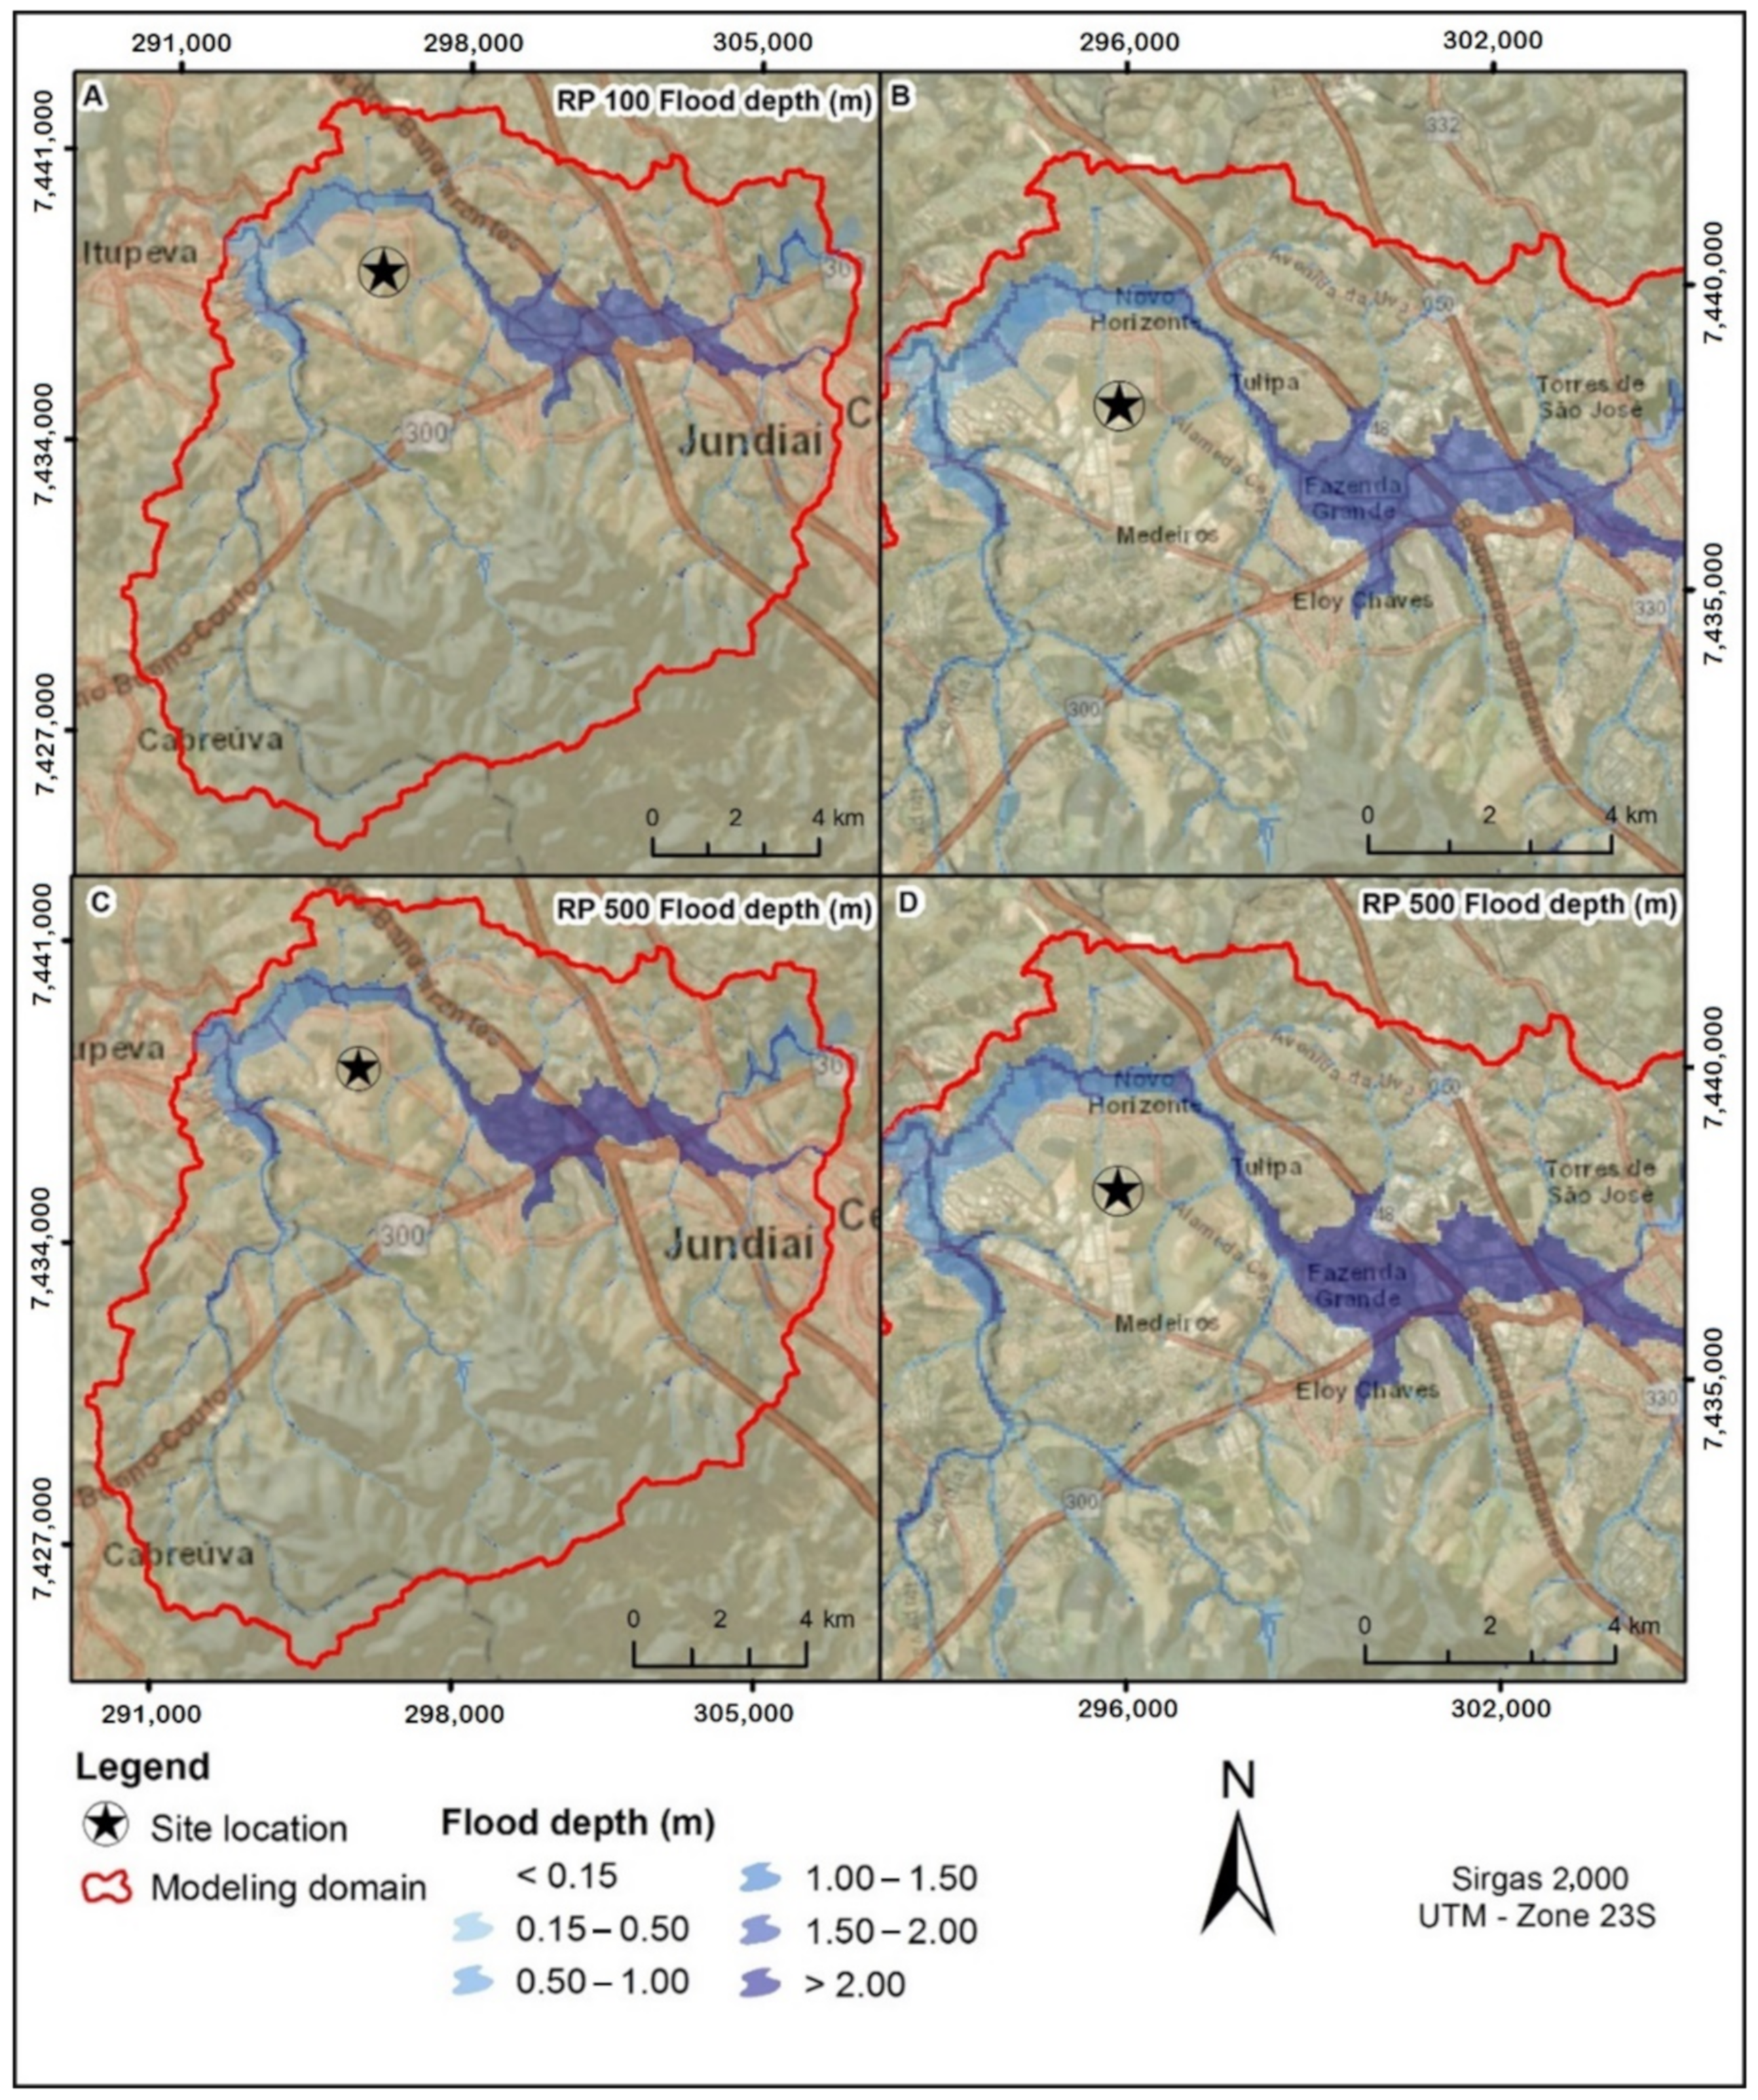
4.3. Phase 3: The Flood Hazard Assessment
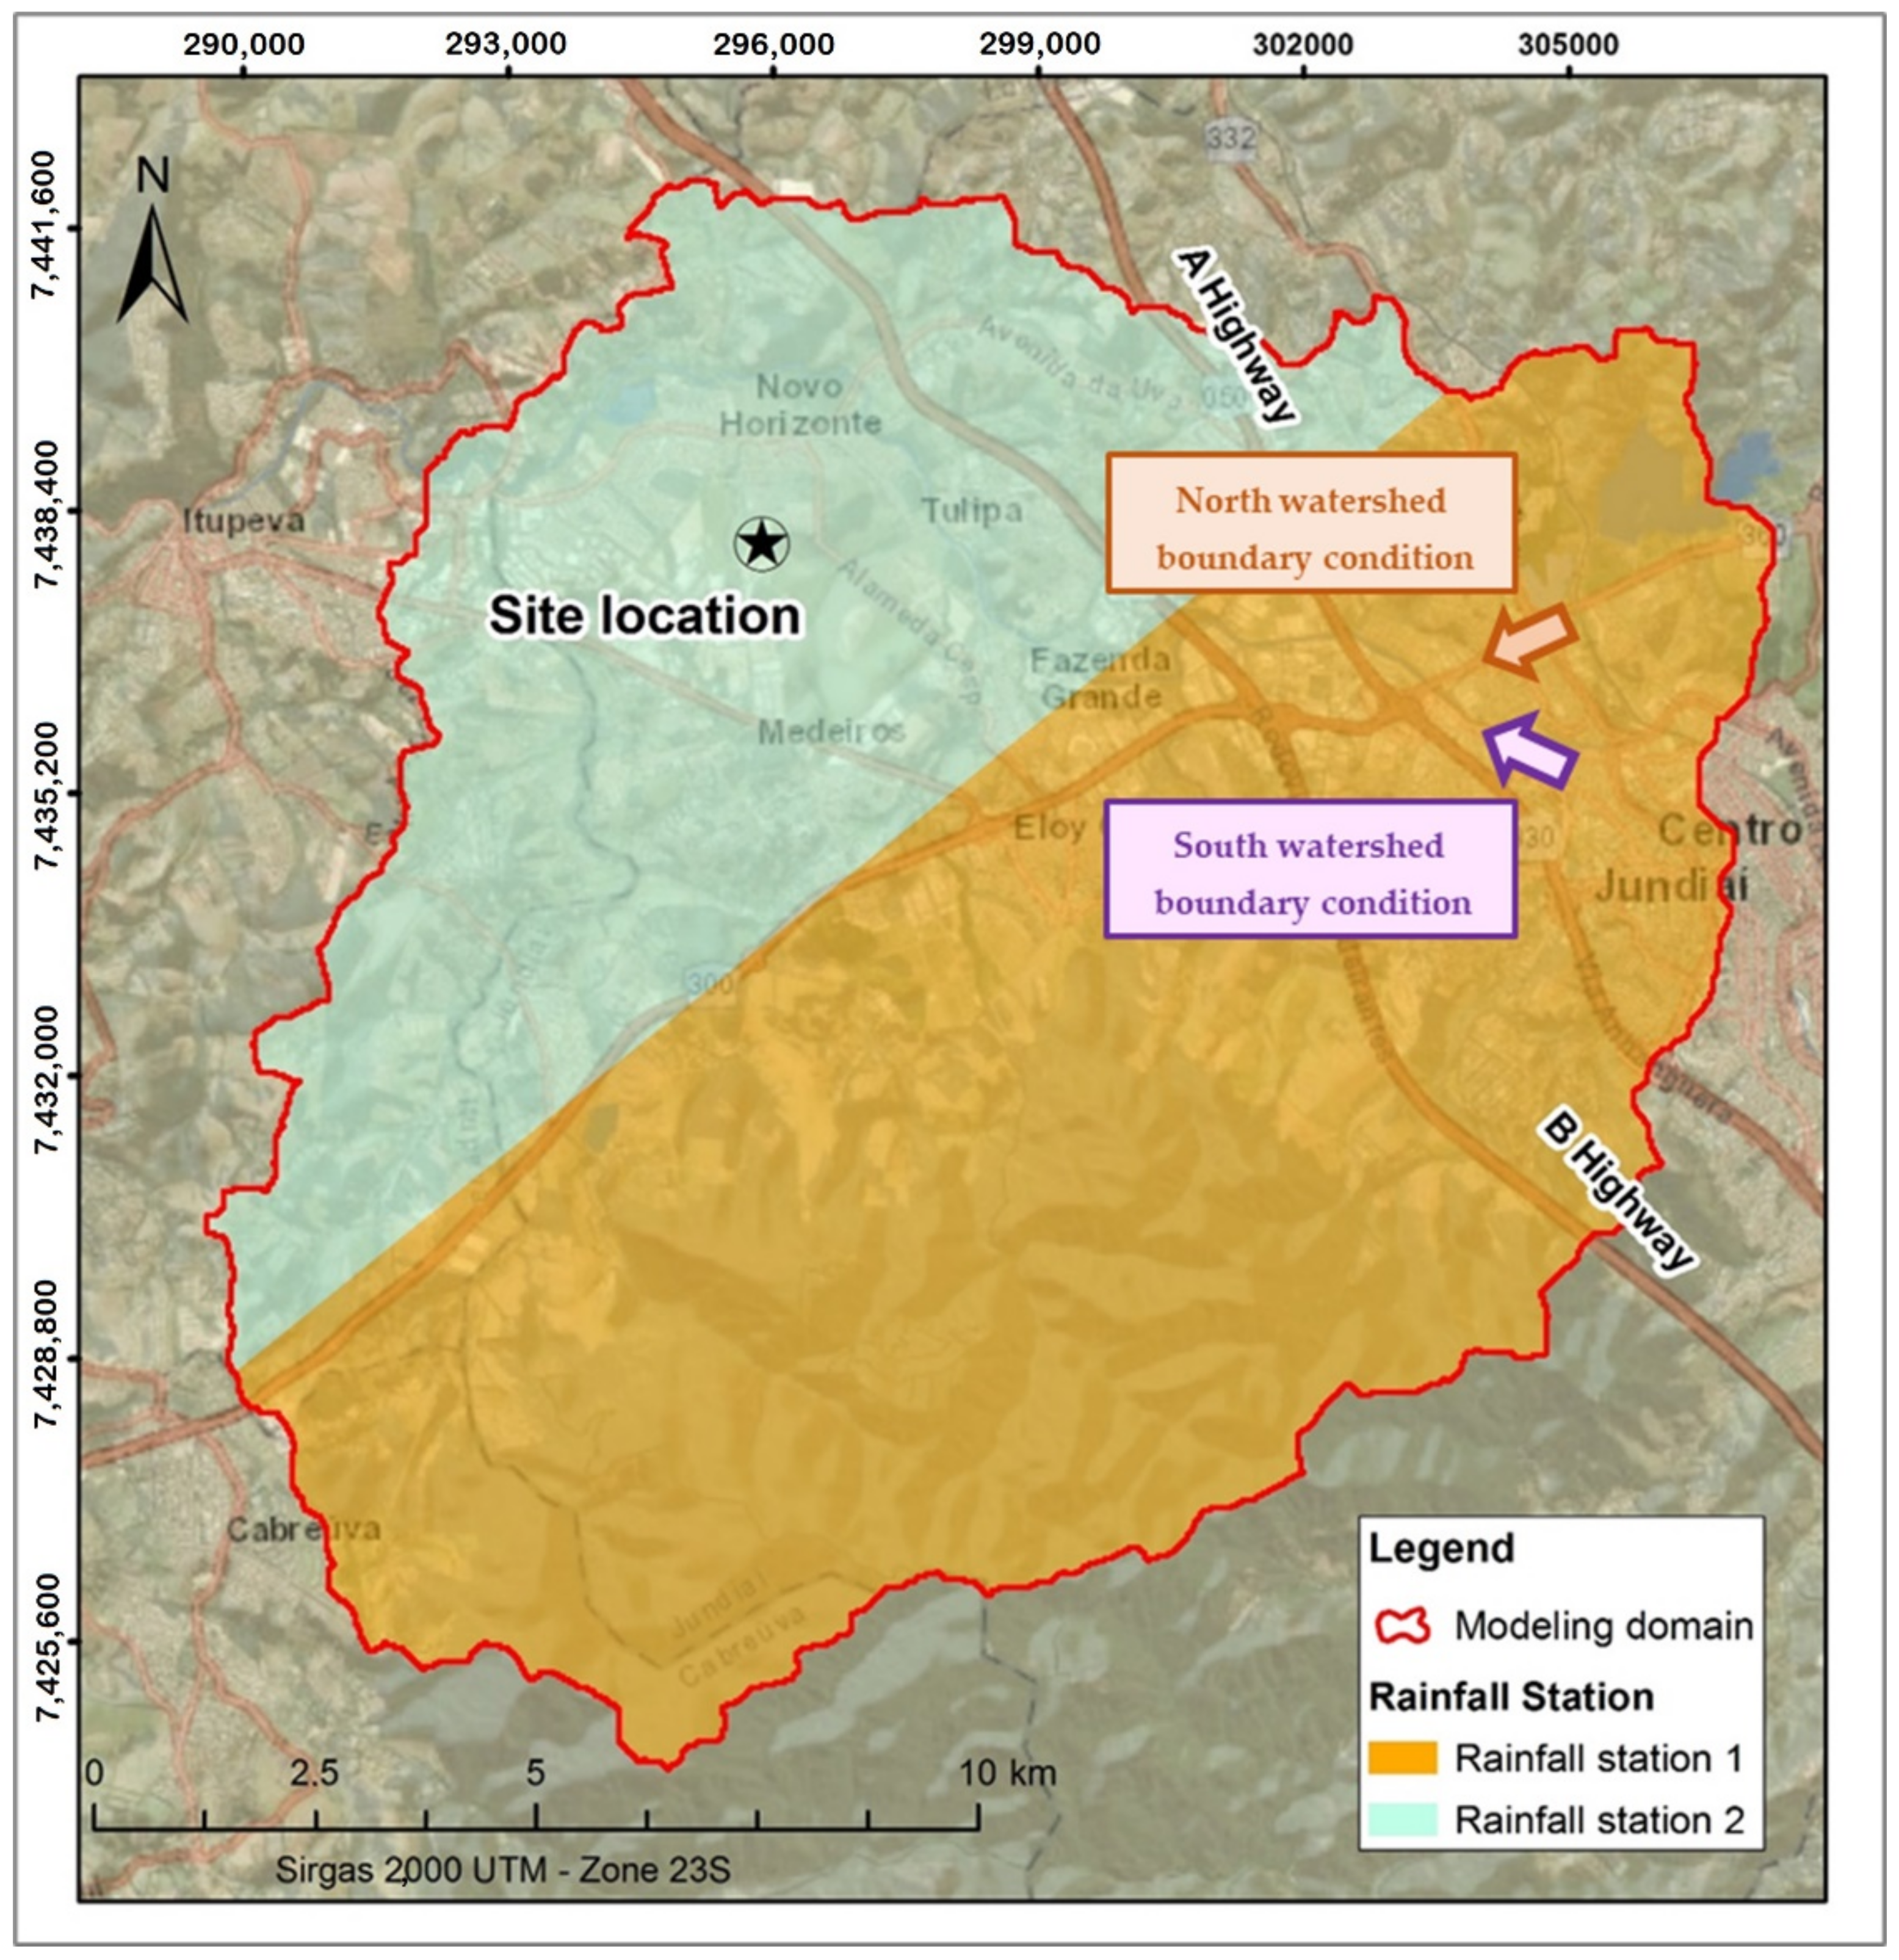
4.3.1. Characterization of the Watershed
4.3.2. Design Storm
- L—Length of main watershed valley (km);
- S—Average slope of the basin (M/m);
- p—Coefficient of vegetation cover of the basin.
- i—rainfall intensity, corresponding to the duration t and recurrence time T, in mm/min;
- T—recurrence time in years;
- t—duration of rainfall in minutes.
- i—rainfall intensity, corresponding to the duration t and recurrence time T, in mm/min;
- T—recurrence time in years;
- t—duration of rainfall in minutes.
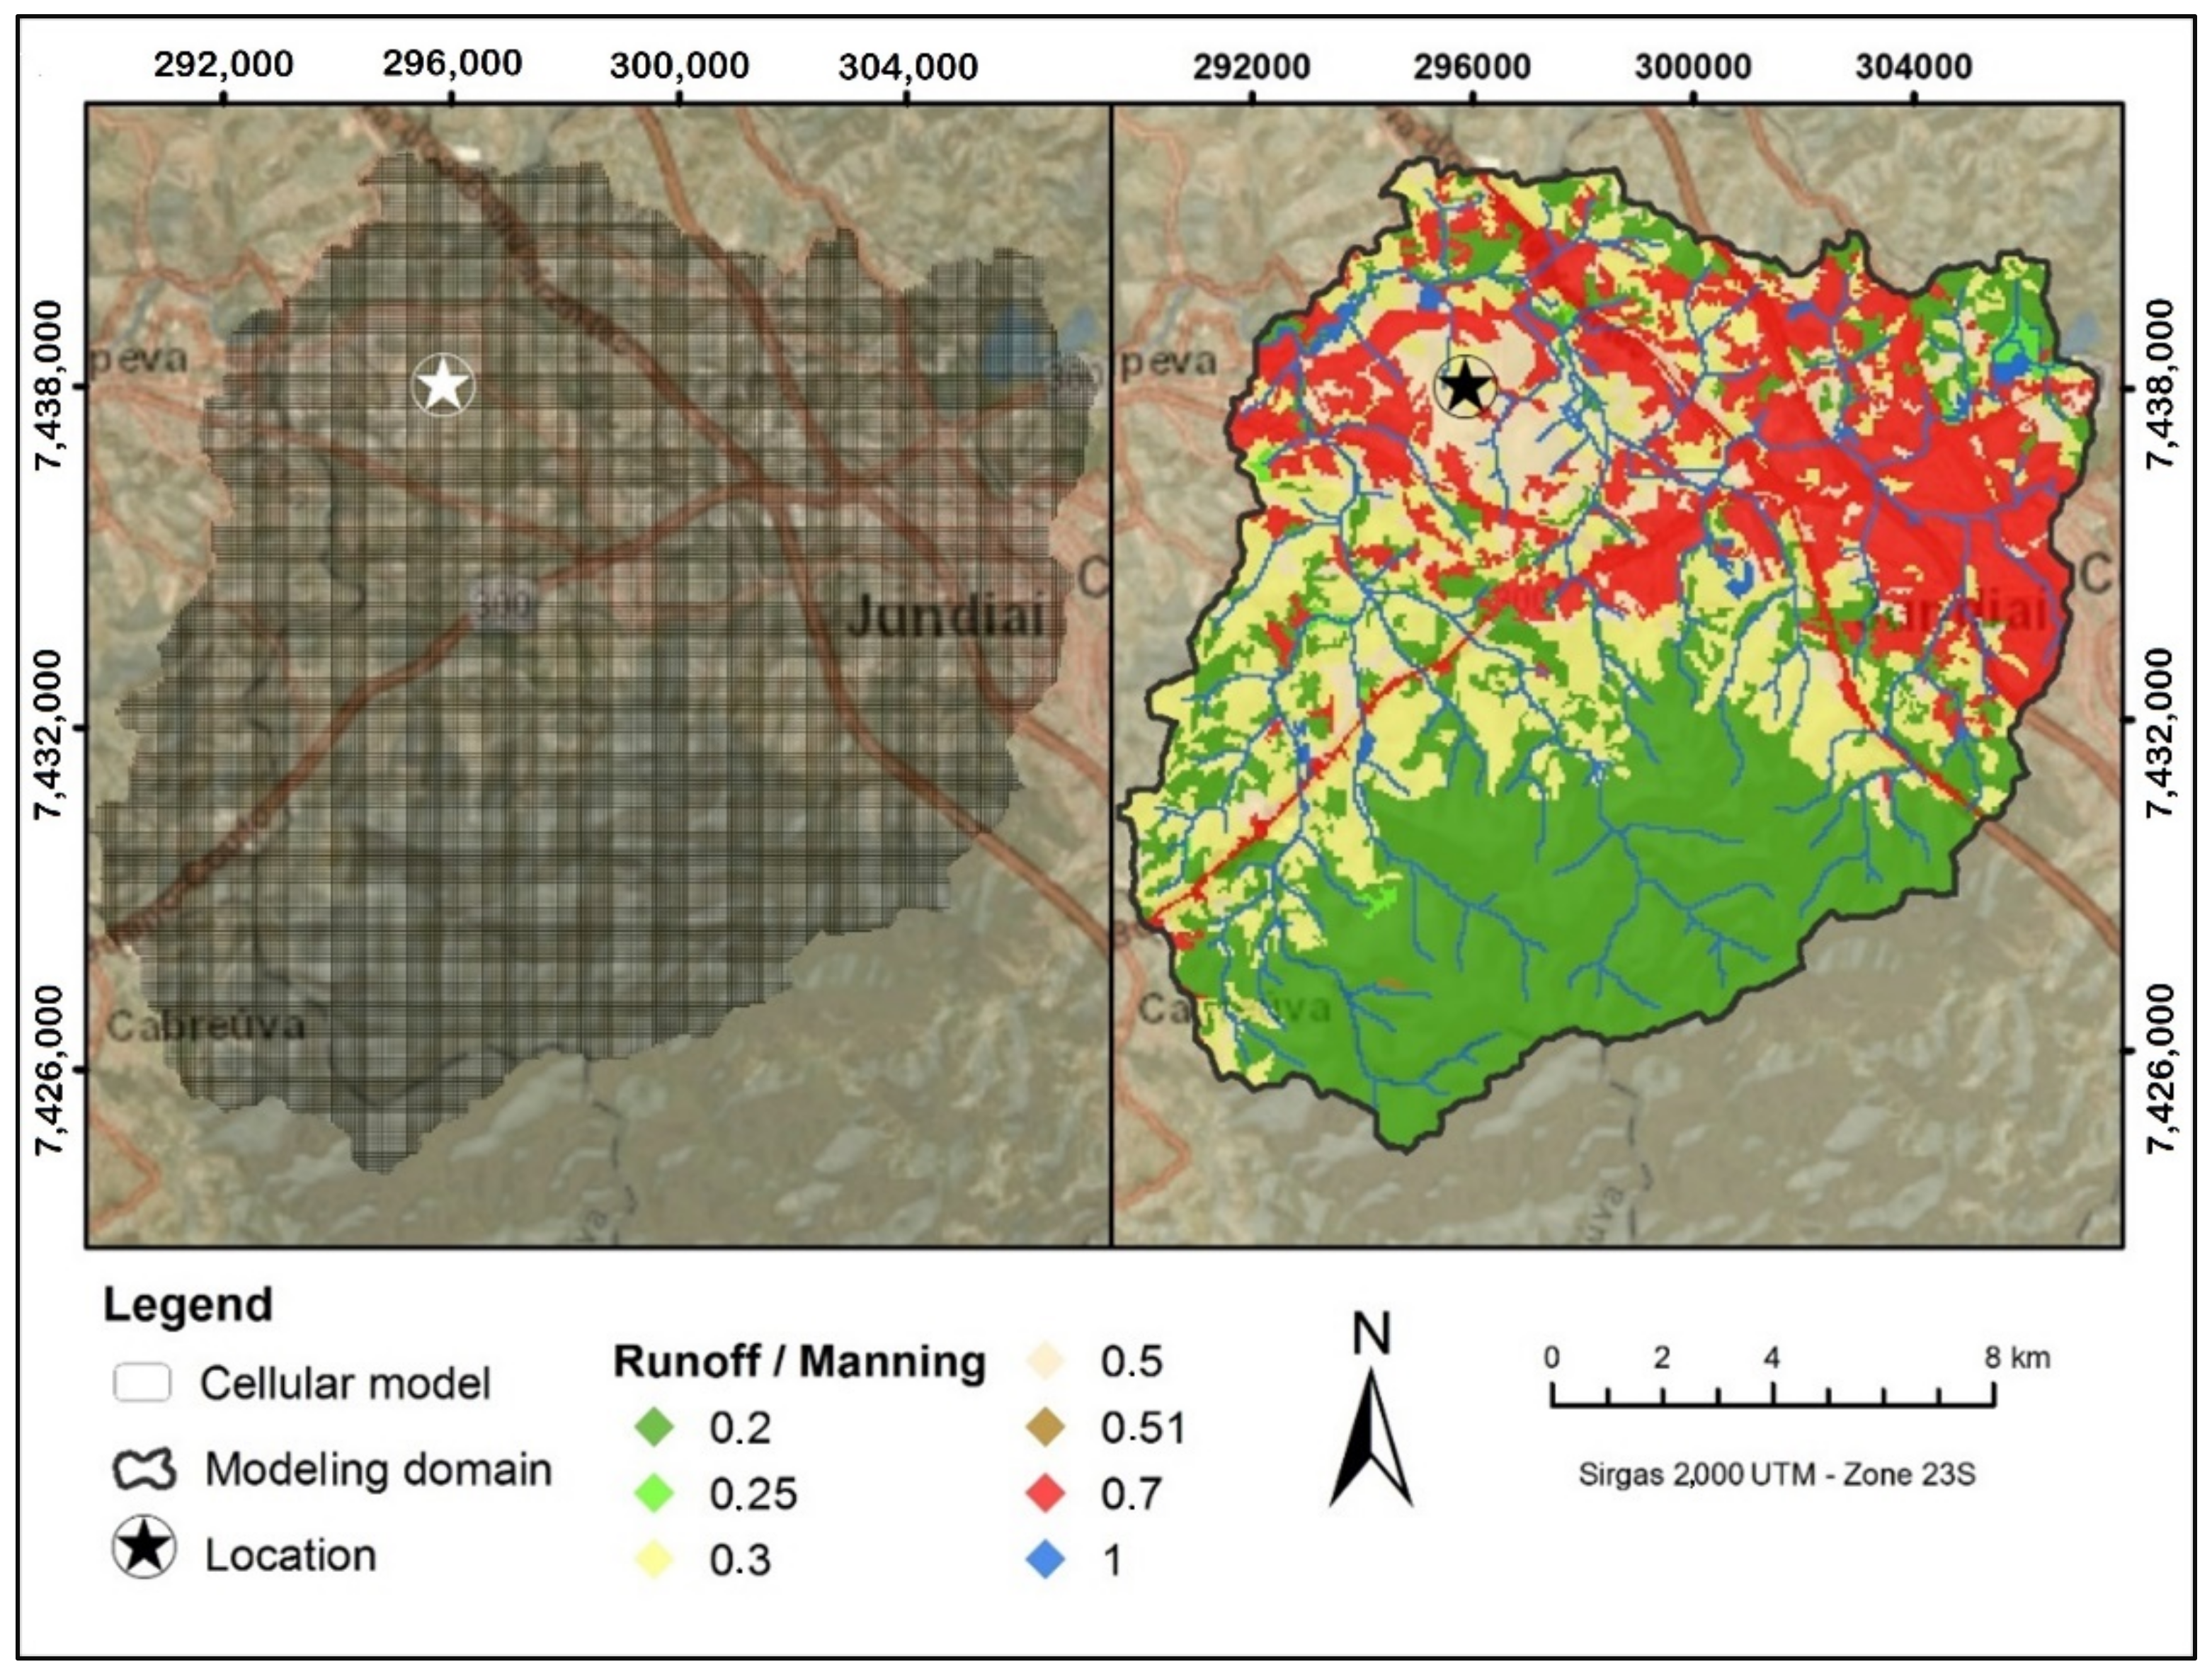
4.3.3. Hydrodynamic Studies
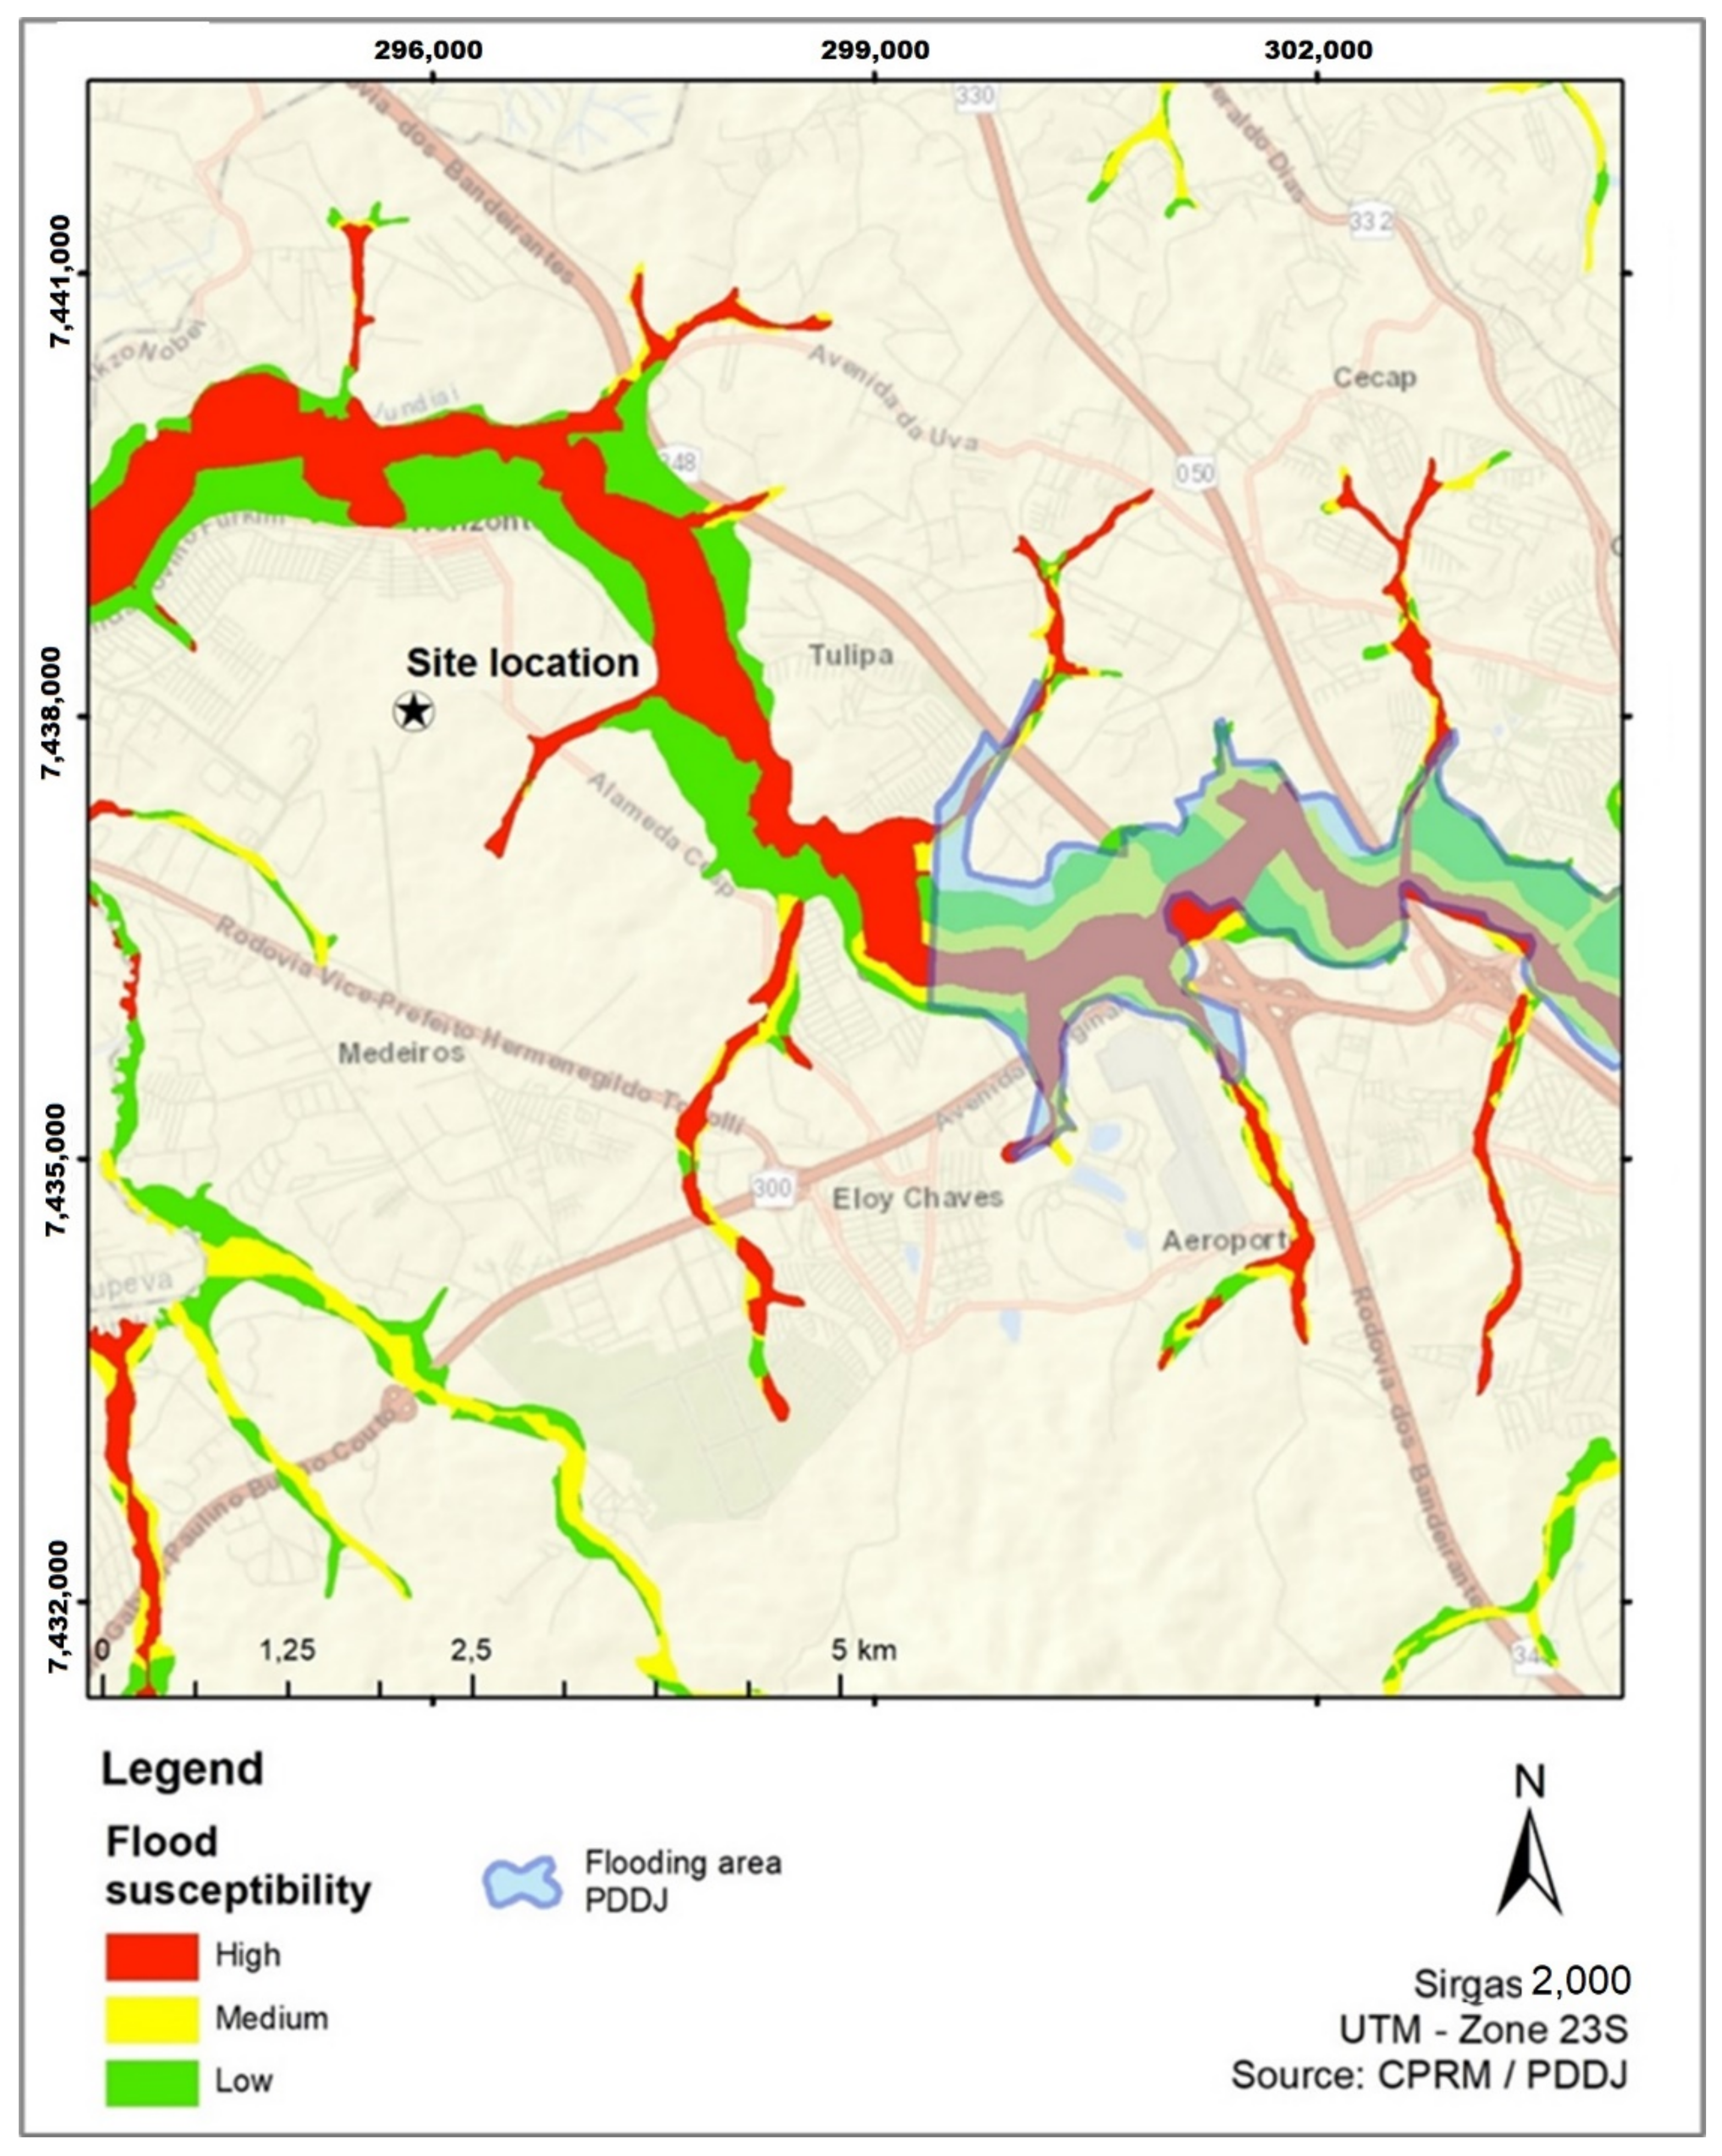
4.3.4. The Flood Hazard Assessment
4.4. Phase 4: The Risk Assessment
5. Discussions and Conclusions
Author Contributions
Funding
Data Availability Statement
Acknowledgments
Conflicts of Interest
References
- Barendrecht, M.H.; Viglione, A.; Blöschl, G. A dynamic framework for flood risk. Water Secur. 2017, 1, 3–11. [Google Scholar] [CrossRef]
- Rezende, O.M.; Miranda, F.M.; Haddad, A.N.; Miguez, M.G. A framework to evaluate urban flood resilience of design alternatives for flood defence considering future adverse scenarios. Water 2019, 11, 1485. [Google Scholar] [CrossRef] [Green Version]
- Yazdani, M.; Mojtahedi, M.; Loosemore, M. Enhancing evacuation response to extreme weather disasters using public transportation systems: A novel simheuristic approach. J. Comput. Des. Eng. 2020, 7, 195–210. [Google Scholar] [CrossRef]
- Miguez, M.G.; Veról, A.P. A catchment scale Integrated Flood Resilience Index to support decision making in urban flood control design. Environ. Plan. B Urban Anal. City Sci. 2017, 44, 925–946. [Google Scholar] [CrossRef]
- FIESP. XXII FIESP/CIESP Week—Environment; Federação das Indústrias do Estado de São Paulo—FIESP: São Paulo, Brazil, 2010; Volume 1, pp. 1–44. [Google Scholar]
- Kappes, M.S.; Keiler, M.; Elverfeldt, K. Von Challenges of analyzing multi-hazard risk: A review. Nat. Hazards 2012, 64, 1925–1958. [Google Scholar] [CrossRef] [Green Version]
- Ward, P.J.; Blauhut, V.; Bloemendaal, N.; Daniell, J.E.; de Ruiter, M.C.; Duncan, M.J.; Emberson, R.; Jenkins, S.F.; Kirschbaum, D.; Kunz, M.; et al. Review article: Natural hazard risk assessments at the global scale. Nat. Hazards 2020, 20, 1069–1096. [Google Scholar] [CrossRef] [Green Version]
- UNISDR. Terminology on Disaster Risk Reduction; United Nations International k Reduction Strategy for Disaster Reduction (UNISDR): Geneva, Switzerland, 2009. [Google Scholar]
- Plate, E.J. Flood risk and flood management. J. Hydrol. 2002, 267, 2–11. [Google Scholar] [CrossRef]
- Antwi, E.K.; Boakye-Danquah, J.; Barima Owusu, A.; Loh, S.K.; Mensah, R.; Boafo, Y.A.; Apronti, P.T. Community vulnerability assessment index for flood prone savannah agro-ecological zone: A case study of Wa West District, Ghana. Weather Clim. Extrem. 2015, 10, 56–69. [Google Scholar] [CrossRef] [Green Version]
- Souza, C.R.G. Risco a inundações, enchentes e alagamentos em regiões costeiras. In Proceedings of the Simpósio Brasileiro de Desastres Naturais GEDN/UFSC, Florianópolis, Brazil, 27–30 September 2004; pp. 231–247. [Google Scholar]
- Tingsanchali, T. Urban flood disaster management. Procedia Eng. 2012, 32, 25–37. [Google Scholar] [CrossRef] [Green Version]
- Bennet, B.T. Understanding, Assessing, and Responding to Terrorism: Protecting Critical Infrastructure and Personnel; Wiley & Sons: New York, NY, USA, 2018. [Google Scholar]
- Rinaldi, S.M.; Peerenboom, J.P.; Kelly, T.K. Identifying, understanding, and analyzing critical infrastructure interdependencies. IEEE Control Syst. 2001, 21, 11–25. [Google Scholar] [CrossRef]
- Najafi, M.R.; Zhang, Y.; Martyn, N. A flood risk assessment framework for interdependent infrastructure systems in coastal environments. Sustain. Cities Soc. 2021, 64, 102516. [Google Scholar] [CrossRef]
- Yang, Y.; Ng, S.T.; Xu, F.J.; Skitmore, M. Towards sustainable and resilient high density cities through better integration of infrastructure networks. Sustain. Cities Soc. 2018, 42, 407–422. [Google Scholar] [CrossRef]
- Hammond, M.J.; Chen, A.S.; Djordjevic, S.; Butler, D.; Mark, O. Urban flood impact assessment: A state-of-the-art review. Urban Water J. 2015, 12, 14–29. [Google Scholar] [CrossRef] [Green Version]
- Qiang, Y. Flood exposure of critical infrastructure in the United States. Int. J. Disaster Risk Reduct. 2019, 39, 101240. [Google Scholar] [CrossRef]
- Vamvakeridou-Lyroudia, L.S.; Chen, A.S.; Khoury, M.; Gibson, M.J.; Kostaridis, A.; Stewart, D. Assessing and visualising hazard impacts to enhance the resilience of Critical Infrastructure to urban flooding. Sci. Total Environ. 2020, 707, 136078. [Google Scholar] [CrossRef]
- Pregnolato, M.; Ford, A.; Wilkinson, S.M.; Dawson, R.J. The impact of flooding on road transport: A depth-disruption function. Transp. Res. Part D Transp. Environ. 2017, 55, 67–81. [Google Scholar] [CrossRef]
- Argyroudis, S.A.; Mitoulis, S.; Winter, M.G.; Kaynia, A.M. Fragility of transport assets exposed to multiple hazards: State-of-the-art review toward infrastructural resilience. Reliab. Eng. Syst. Saf. 2019, 191, 106567. [Google Scholar] [CrossRef]
- Rozenberg, J.; Alegre, X.E.; Avner, P.; Fox, C.; Koks, S.H.E.; Tariverdi, J.R.M. From a Rocky Road to Smooth Sailing. In Proceedings of the Irish Economic Association Annual Conference 2017, Dublin, Ireland, 4–5 May 2017. [Google Scholar]
- Zhang, N.; Alipour, A. A multi-step assessment framework for optimization of flood mitigation strategies in transportation networks. Int. J. Disaster Risk Reduct. 2021, 63, 102439. [Google Scholar] [CrossRef]
- Fereshtehpour, M.; Burian, S.J.; Karamouz, M. Flood Risk Assessments of Transportation Networks Utilizing Depth-Disruption Function. World Environ. Water Resour. Congr. 2018, 1, 134–142. [Google Scholar] [CrossRef]
- Choo, K.-S.; Kang, D.-H.; Kim, B.-S. Impact Assessment of Urban Flood on Traffic Disruption using Rainfall—Depth—Vehicle speed relationship. Water 2020, 12, 926. [Google Scholar] [CrossRef]
- Abdulla, B.; Kiaghadi, A.; Rifai, H.S.; Birgisson, B. Characterization of vulnerability of road networks to fluvial flooding using SIS network diffusion model. J. Infrastruct. Preserv. Resil. 2020, 1, 6. [Google Scholar] [CrossRef] [Green Version]
- Singh, P.; Sinha, V.S.P.; Vijhani, A.; Pahuja, N. Vulnerability assessment of urban road network from urban flood. Int. J. Disaster Risk Reduct. 2018, 28, 237–250. [Google Scholar] [CrossRef]
- Sohn, J. Evaluating the significance of highway network links under the flood damage: An accessibility approach. Transp. Res. Part A 2006, 40, 491–506. [Google Scholar] [CrossRef]
- Fehidro Plano Estadual de Recursos Hídricos 2020–2023—Resumo Executivo; Government of São Paulo: São Paulo, Brazil, 2020.
- SMA Modelo Digital de Elevação (MDE) do Estado de São Paulo. Available online: https://www.infraestruturameioambiente.sp.gov.br/cpla/modelo-digital-de-elevacao-mde-do-estado-de-sao-paulo/ (accessed on 3 September 2021).
- James, W.P.; Winsor, P.W.; Williams, J.R. Synthetic Unit Hydrograph. J. Water Resour. Plan. Manag. 1987, 113, 70–81. [Google Scholar] [CrossRef] [Green Version]
- Mascarenhas, F.C.B.; Miguez, M.G. Urban Flood Control through a Mathematical Cell. Water Int. 2002, 27, 208–218. [Google Scholar] [CrossRef]
- Zanobetti, D.; Lorgeré, H. Le modèle mathématique du delta du mékong. La Houille Blanche 1968, 5, 363–378. [Google Scholar] [CrossRef] [Green Version]
- Cunge, J.A.; Holly, F.M., Jr.; Verwey, A. Practical Aspects of Computational River Hydraulics; Pitman Advanced Publishing Program Ed.; The Pitman Press: London, UK, 1980. [Google Scholar]
- Miguez, M.G.; Battemarco, B.P.; de Sousa, M.M.; Rezende, O.M.; Veról, A.P.; Gusmaroli, G. Urban flood simulation using MODCEL-an alternative quasi-2D conceptual model. Water 2017, 9, 445. [Google Scholar] [CrossRef] [Green Version]
- Jacob, A.C.P.; Rezende, O.M.; de Sousa, M.M.; de França Ribeiro, L.B.; de Oliveira, A.K.B.; Arrais, C.M.; Miguez, M.G. Use of detention basin for flood mitigation and urban requalification in Mesquita, Brazil. Water Sci. Technol. 2019, 79, 10. [Google Scholar] [CrossRef]
- Moura Rezende, O.; Ribeiro da Cruz de Franco, A.B.; Beleño de Oliveira, A.K.; Pitzer Jacob, A.C.; Gomes Miguez, M. A framework to introduce urban flood resilience into the design of flood control alternatives. J. Hydrol. 2019, 576, 478–493. [Google Scholar] [CrossRef]
- Scionti, F.; Miguez, M.G.; Barbaro, G.; de Sousa, M.M.; Foti, G.; Canale, C. Integrated Methodology for Urban Flood Risk Mitigation in Cittanova, Italy. J. Water Resour. Plan. Manag. 2018, 144, 05018013. [Google Scholar] [CrossRef]
- Nardini, A.; Gomes Miguez, M. An Integrated Plan to Sustainably Enable the City of Riohacha (Colombia) to Cope with Increasing Urban Flooding, while Improving Its Environmental Setting. Sustainability 2016, 8, 198. [Google Scholar] [CrossRef] [Green Version]
- Miguez, M.G.; Veról, A.P.; de Sousa, M.M.; Rezende, O.M. Urban floods in lowlands-levee systems, unplanned urban growth and river restoration alternative: A case study in Brazil. Sustainability 2015, 7, 11068–11097. [Google Scholar] [CrossRef] [Green Version]
- Bates, P.D.; Horritt, M.S.; Fewtrell, T.J. A simple inertial formulation of the shallow water equations for efficient two-dimensional flood inundation modelling. J. Hydrol. 2010, 387, 33–45. [Google Scholar] [CrossRef]
- Castellarin, A.; Domeneghetti, A.; Brath, A. Identifying robust large-scale flood risk mitigation strategies: A quasi-2D hydraulic model as a tool for the Po river. Phys. Chem. Earth 2011, 36, 299–308. [Google Scholar] [CrossRef]
- Dimitriadis, P.; Tegos, A.; Oikonomou, A.; Pagana, V.; Koukouvinos, A.; Mamassis, N.; Koutsoyiannis, D.; Efstratiadis, A. Comparative evaluation of 1D and quasi-2D hydraulic models based on benchmark and real-world applications for uncertainty assessment in flood mapping. J. Hydrol. 2016, 534, 478–492. [Google Scholar] [CrossRef]
- Gregoretti, C.; Degetto, M.; Boreggio, M. GIS-based cell model for simulating debris flow runout on a fan. J. Hydrol. 2016, 534, 326–340. [Google Scholar] [CrossRef]
- Horritt, M.S.; Bates, P.D. Predicting floodplain inundation: Raster-based modelling versus the finite-element approach. Hydrol. Process. 2001, 15, 825–842. [Google Scholar] [CrossRef]
- Hunter, N.M.; Horritt, M.S.; Bates, P.D.; Wilson, M.D.; Werner, M.G.F. An adaptive time step solution for raster-based storage cell modelling of floodplain inundation. Adv. Water Resour. 2005, 28, 975–991. [Google Scholar] [CrossRef]
- Moussa, R.; Bocquillon, C. On the use of the diffusive wave for modelling extreme flood events with overbank flow in the floodplain. J. Hydrol. 2009, 374, 116–135. [Google Scholar] [CrossRef]
- Oikonomou, A.; Dimitriadis, P.; Koukouvinos, A.; Tegos, A.; Pagana, V.; Panagopoulos, P.; Mamassis, N.; Koutsoyiannis, D. Floodplain mapping via 1D and quasi-2D numerical models in the valley of Thessaly, Greece. In Proceedings of the European Geosciences Union General Assembly 2013, Vienna, Austria, 7–13 April 2013; Volume 15, p. 10366. [Google Scholar]
- Paz, A.R.; Collischonn, W. River reach length and slope estimates for large-scale hydrological models based on a relatively high-resolution digital elevation model. J. Hydrol. 2007, 343, 127–139. [Google Scholar] [CrossRef]
- Skinner, C.J.; Coulthard, T.J.; Parsons, D.R.; Ramirez, J.A.; Mullen, L.; Manson, S. Simulating tidal and storm surge hydraulics with a simple 2D inertia based model, in the Humber Estuary, U.K. Estuar. Coast. Shelf Sci. 2015, 155, 126–136. [Google Scholar] [CrossRef]
- Paz, A.R.D.; Collischonn, W.; Tucci, C.E.; Padovani, C.R. Large-scale modelling of channel flow and floodplain inundation dynamics and its application to the Pantanal (Brazil). Hydrol. Process. 2011, 25, 1498–1516. [Google Scholar] [CrossRef]
- Horritt, M.S.; Bates, P.D. Evaluation of 1D and 2D numerical models for predicting river flood inundation. J. Hydrol. 2002, 268, 87–99. [Google Scholar] [CrossRef]
- ANA. Atlas de Vulnerabilidade a Inundações; Agência Nacional de Águas (ANA): Brasilia, Brazil, 2014; p. 15.
- CPRM. Cartas de Suscetibilidade a Movimentos Gravitacionais de Massa e Inundações: 1:25.000 (Livro Eletrônico); CPRM: Brasilia, Brazil, 2014.
- Wilken, P.S. Engenharia de Drenagem Superficial (Superficial Drainage Engineering); CETESB: São Paulo, Brazil, 1978.
- Ribeiro, G. Acerca do calculo da vasão de obras d’arte: Tempo de concentração. Rev. Clube Eng. 1961, 294, 16–19. [Google Scholar]
- DAEE. Equações de Chuvas Intensas do Estado de São Paulo; Departamento de Águas e Energia Elétrica Ed.; Convênio Departamento de Águas e Energia Elétrica e Escola Politécnica da Universidade de São Paulo: São Paulo, Brazil, 1999.


| Flood Vulnerability Classes | Flood Vulnerability Ranges | |
|---|---|---|
| very low | 0.00–0.15 | |
| low | 0.15–0.30 | |
| moderate | 0.30–0.50 | |
| high | 0.50–0.75 | |
| very high | 0.75–1.00 | |
| Flood Hazard Classes | Flood Depth (cm) | |
|---|---|---|
| very low | <20 | |
| low | 20–30 | |
| moderate | 30–40 | |
| high | 40–60 | |
| very high | >60 | |
| Flood Risk Classes | Flood Risk Ranges | |
|---|---|---|
| very low | 0.00–0.15 | |
| low | 0.15–0.30 | |
| moderate | 0.30–0.50 | |
| high | 0.50–0.75 | |
| very high | 0.75–1.00 | |
| Route | River Crossing | Watershed Area of Each River Crossing | Hydrological Vulnerability | Route Vulnerability OP 1 | Average of Watershed Area of All River Crossings on the Route | Route Vulnerability OP 2 | Final Route Vulnerability |
|---|---|---|---|---|---|---|---|
| 1 | T10 | 1,305,083 | 0.15 | 0.60 | 79,432,076 | 1 | 1 |
| T11 | 2,270,885 | 0.25 | |||||
| T12 | 98,220,736 | 1.00 | |||||
| T13 | 215,931,600 | 1.00 | |||||
| 2 | T9 | 459,834 | 0.05 | 0.61 | 5,597,322 | 0.63 | 0.63 |
| T8 | 6,772,344 | 0.76 | |||||
| T2 | 5,766,430 | 0.65 | |||||
| T3 | 9,390,680 | 1.00 | |||||
| 3 | T9 | 459,834 | 0.05 | 0.52 | 4,788,740 | 0.54 | 0.54 |
| T8 | 6,772,344 | 0.76 | |||||
| T4 | 2,532,100 | 0.28 | |||||
| T3 | 9,390,680 | 1.00 | |||||
| 4 | T9 | 459,834 | 0.05 | 0.56 | 6,223,719.67 | 0.70 | 0.70 |
| T8 | 6,772,344 | 0.76 | |||||
| T4 | 2,532,100 | 0.28 | |||||
| T5 | 7,525,630 | 0.84 | |||||
| T6 | 3,680,110 | 0.41 | |||||
| T7 | 16,372,300 | 1.00 | |||||
| Reference Value | 8,924,418 | ||||||
| Parameters | River Watershed |
|---|---|
| Drainage area | 592.52 km2 |
| Maximum level difference | 600 m |
| Length of the largest valley | 61.36 km |
| Average slope | 0.004726 m/m |
| Land Use and Cover | North Watershed | South Watershed | ||
|---|---|---|---|---|
| Area | CN | Area | CN | |
| Building area | 9,973,249.35 | 77 | 63,760,635.71 | 77 |
| Humid area | 54,676.21 | 79 | 355,839.46 | 79 |
| Tree cover | 45,699,883.98 | 69 | 126,044,704.37 | 69 |
| Herbaceous bush cover | 49,738,638.28 | 60 | 65,108,219.38 | 60 |
| Water body | 373,536.74 | 100 | 542,563.55 | 100 |
| Exposed soil | 5,145,324.99 | 73 | 19,382,941.66 | 73 |
| Final CN | 66.6 | 67.6 | ||
| Rain Gauge 1 | Rain Gauge 2 | |||
|---|---|---|---|---|
| Recurrence time | RP100 Years | RP500 Years | RP100 Years | RP500 Years |
| Total rainfall (mm) | 138 | 161 | 117 | 147 |
| Land Cover | Manning Coefficient | Runoff Coefficient |
|---|---|---|
| Building area | 0.100 | 0.80 |
| Humid area | 0.060 | 0.90 |
| Tree cover | 0.150 | 0.20 |
| Herbaceous bush cover | 0.080 | 0.35 |
| Water body | 0.033 | 1.00 |
| Exposed soil | 0.030 | 0.40 |
| Shadow and cloud | 0.031 | 0.60 |
| Singularity | Estimated Discharge (m3/s) | ||||||
|---|---|---|---|---|---|---|---|
| Cross Section | Bottom Slope (m/m) | Adopted Manning | Hydraulic Capacity (m3/s) | RT100 | RT500 | Situation | |
| J2 | Culvert (3.0 m × 3.0 m) | 0.0061 | 0.02 | 35.15 | 52.38 | 64.73 | Overcapacity for both design discharges |
| J3 | Double Culvert (3.0 m × 3.0 m) | 0.0010 | 0.02 | 28.46 | 32.7 | 36.79 | Overcapacity for both design discharges |
| J4 | Culvert (2.7 m × 1.6 m) | 0.0003 | 0.02 | 3.04 | 12.14 | 15.7 | Overcapacity for both design discharges |
| J5 | Culvert (2.0 m × 1.6 m) | 0.0374 | 0.02 | 22.39 | 2.46 | 3.14 | Adequate for both design discharges |
| J7 | Culvert (3.0 m × 1.6 m) | 0.0692 | 0.02 | 48.82 | 27.14 | 39.44 | Adequate for both design discharges |
| P1 | No visual access | ||||||
| P2 | No visual access | ||||||
| P3 | Culvert (D = 1.5 m) | 0.0596 | 0.02 | 11.22 | 8.66 | 10.96 | Adequate for both design discharges |
| P4 | Culvert (D = 1.5 m) | 0.0100 | 0.02 | 4.59 | 12.85 | 24.09 | Overcapacity for both discharges |
| P5 | Bridge (8.0 m × 4.0 m) | 0.0050 | 0.035 | 102.63 | 57.87 | 73.37 | Adequate for both design discharges |
| P6 | Bridge (18.0 m × 8.0 m) | 0.0050 | 0.035 | 761.56 | 40.53 * | 43.82 * | Adequate for both design discharges |
| P7 | Double Culvert (2.0 m × 2.0 m and D = 1.5 m) | 0.0042 | 0.02 | 12.87 | 37.58 | 44.89 | Overloaded for both discharges |
| P8 | Double Culvert (3.0 m × 2.0 m) | 0.0024 | 0.02 | 35.08 | 76.25 | 104.15 | Overloaded for both discharges |
| Route | Route Vulnerability | Route Hazard * | Route Risk | Site Flood Risk |
|---|---|---|---|---|
| Rt 1 | 1.00 | 0.94 | 0.95 | 0.86 |
| Rt 2 | 0.63 | 1.00 | 0.89 | |
| Rt 3 | 0.54 | 1.00 | 0.85 | |
| Rt 4 | 0.70 | 0.68 | 0.75 |
Publisher’s Note: MDPI stays neutral with regard to jurisdictional claims in published maps and institutional affiliations. |
© 2022 by the authors. Licensee MDPI, Basel, Switzerland. This article is an open access article distributed under the terms and conditions of the Creative Commons Attribution (CC BY) license (https://creativecommons.org/licenses/by/4.0/).
Share and Cite
de Sousa, M.M.; Rezende, O.M.; Jacob, A.C.P.; de França Ribeiro, L.B.; de Magalhães, P.M.C.; Maquera, G.; Miguez, M.G. Flood Risk Assessment Index for Urban Mobility with the Aid of Quasi-2d Flood Model Applied to an Industrial Park in São Paulo, Brazil. Infrastructures 2022, 7, 158. https://doi.org/10.3390/infrastructures7110158
de Sousa MM, Rezende OM, Jacob ACP, de França Ribeiro LB, de Magalhães PMC, Maquera G, Miguez MG. Flood Risk Assessment Index for Urban Mobility with the Aid of Quasi-2d Flood Model Applied to an Industrial Park in São Paulo, Brazil. Infrastructures. 2022; 7(11):158. https://doi.org/10.3390/infrastructures7110158
Chicago/Turabian Stylede Sousa, Matheus Martins, Osvaldo Moura Rezende, Ana Caroline Pitzer Jacob, Luiza Batista de França Ribeiro, Paula Morais Canedo de Magalhães, Gladys Maquera, and Marcelo Gomes Miguez. 2022. "Flood Risk Assessment Index for Urban Mobility with the Aid of Quasi-2d Flood Model Applied to an Industrial Park in São Paulo, Brazil" Infrastructures 7, no. 11: 158. https://doi.org/10.3390/infrastructures7110158