Article

Analyzing the Service Quality of E-Trike Operations: A New Sustainable Transportation Infrastructure in Metro Manila, Philippines

by
Ma. Janice J. Gumasing
1,2,
Yogi Tri Prasetyo
1,2,*,
Ardvin Kester S. Ong
1,
Satria Fadil Persada
3 and
Reny Nadlifatin
4
1
School of Industrial Engineering and Engineering Management, Mapúa University, 658 Muralla St., Intramuros, Manila 1002, Philippines
2
School of Graduate Studies, Mapúa University, 658 Muralla St., Intramuros, Manila 1002, Philippines
3
Entrepreneurship Department, BINUS Business School Undergraduate Program, Bina Nusantara University, Malang 65154, Indonesia
4
Department of Information Systems, Institut Teknologi Sepuluh Nopember, Kampus ITS Sukolilo, Surabaya 60111, Indonesia
*
Author to whom correspondence should be addressed.
Infrastructures 2022, 7(5), 69; https://doi.org/10.3390/infrastructures7050069
Submission received: 28 March 2022 / Revised: 16 April 2022 / Accepted: 18 April 2022 / Published: 5 May 2022

Abstract

:
The electric tricycle, often known as an e-trike, is a three-wheeled electric vehicle designed to transport a small group of people over short distances on side streets. This study aims to develop a service quality model of sustainable e-trike operations in the city of Manila, Philippines using stepwise regression analysis. A total of 230 participants from three districts in the City of Manila: Binondo, Recto, and Intramuros, were selected using the stratified sampling method. The main contribution of this study emerges from the quantification of the influence of sustainability indicators on the perceived service quality of e-trike passengers. The study identified 10 indicators: PWD accessibility (β = 0.2128), smoothness of the ride (β = 0.1001), noise level (β = 0.0886), discount rate (β = 0.0886), land use (β = 0.0835), comfort load (β = 0.0723), fare acceptability (β = 0.0577), e-trike intensity (β = 0.0420), fare affordability (β = 0.0339), and ease of availability (β = 0.0317) have significant importance in the service quality of e-trike operations. These indicators revealed the areas where improvements are needed to ensure the long-term viability of e-trike operations. Therefore, it is concluded that these factors should be the focus and priority for the improvement of e-trike operators, drivers, and transport groups to attain sustainability of e-trike operation in the country. Moreover, this study can also be used for other public transportations to improve their current service quality and operations.

1. Introduction

Public transportation is widely emphasized as a critical component in creating sustainable cities [1]. It is an essential part of a country for transit users who value and demand various types of transportation. Public transportation networks are critical components of cities since they enable spatial mobility for at least half of a city’s population who cannot use private transportation [2]. Public transportation is also an important component that acts as the lifeblood for economic, social, political, and demographic mobility. It expands in tandem with and responds to numerous fields and sectors [3,4].
One of the countries that widely utilize public transportation is the Philippines. In the Philippines, public transportation is an important economic sector that connects people and economic hubs across the islands. The Philippines’ public transportation system includes road, marine, air, and train transportation. Road transport is an essential subsector with 98% passenger travel and 58% freight traffic [5]. Road transport such as e-trikes, jeepneys, public utility vehicles, taxis, tricycles, and pedicabs dominate urban public transportation in the Philippines, with some providing door-to-door service. Since the roads in the country are narrower, smaller, and frequently congested, the number of commuters who prefer e-trikes has expanded dramatically.
The e-trike is a three-wheeled electric vehicle used to transport a small group of people over short distances on side streets. Some commuters use it as one of their primary modes of transportation because it is the most accessible and affordable mode of public transport in the country [6]. Because of the rising demand for e-trikes in the country, the Department of Energy (DOE) launched the E-vehicle strategy to encourage more efficient energy use and lower GHG emissions in the country [7]. In addition, the Department of Transportation and Communications (DOTC) laid out plans to improve e-trike networks in recent years. Furthermore, DOTC promotes alternative e-trike mobility options and promotes greener e-trike via alternative fuels as one of the sustainable public transportation systems [6].
Furthermore, e-trikes are found to be more economical compared to motorized tricycles. In a study by Balaria [8], it was proved that E-trike is more fuel-efficient in every way while also tripling the number of passengers it can transport. Compared to motorized vehicles, an e-trike can carry up to nine passengers. The four-stroke engine uses a lead battery, but the two-stroke engine uses a lithium rechargeable battery. Unlike motorized tricycles, which run on gasoline, e-trikes run on electricity, which costs P 11.00 (USD 0.22) per kWh. As a result, for every kilometer driven on a motorized tricycle, the cost of gasoline is P 1.20 (US$ 0.024), and the cost of electricity is P 0.30 (USD 0.006). Thus, the E-trike is estimated to save P 0.90 (USD 0.018) on gasoline [8].
A sustainable public transportation system is based on technologies for the transformation and improvement of infrastructure and service availability and quality [9,10], bridging the gap between the government and the public, as well as between organizational [11] and infrastructure management standards for all actors, with sustainable development as a background [12,13,14]. Given that achieving sustainability is a significant challenge for modern cities [15,16], transport policies in the transportation industry are critical to the fundamental transformation required by climate change commitments [17,18]. The development of sustainable urban mobility, which is seen as a significant challenge in rapidly urbanizing growing cities and causing severe health, economic, social, and environmental problems, is one critical step in sustainable cities [19,20]. Furthermore, sustainable urban mobility will play a crucial role [21,22].
Technological innovation and the accompanying industrial and entrepreneurial ecosystems can help reduce urban environmental risks while also preserving urban surroundings [23]. In recent years, significant resources have been spent on reducing emissions and developing environmentally friendly transportation. As a result, electric vehicles emerged as a strategic alternative for achieving the transportation sector’s goals of decarbonization, ecological balancing, commercialization, and technological innovation. The transition to such vehicles necessitates a significant and costly technological and organizational revolution in the public transportation industry [24]. Due to the increasing demand for passengers in public transport, the public transportation industry has undergone an innovation race to meet society’s demand and safety and environmental requirements worldwide. The remarkable effect of global warming has necessitated a restructuring of the use of resources, requiring sustainable development strategies to reduce the carbon footprint within the communities [25]. Globally, urban transportation faces air pollution and inefficient resource utilization, which can impede economic development [26]. Thus, the zero-emission equipment creates an essential practical experience for the public by integrating an innovative and alternative drive idea into the public transportation system. From the standpoint of sustainable public transportation, shifting from conventional vehicles to electric vehicles can be a flagship initiative for future mobility concepts and solutions in the name of climate protection and sustainability.
Public transport sustainability has been a crucial issue. Discussions about sustainable transportation are becoming more serious as a critical component of addressing climate change [27,28]. The environmental, social, and economic components of sustainable development form the foundation of public transportation sustainability studies. Public transport sustainability is a way of integrating and balancing economic, social, and environmental concerns to make our cities more livable with an overall contribution to the quality of life [29]. It is important to define the sustainability dimensions to enhance public transport sustainability.
There are three dimensions of sustainability: economic, environmental, and social [30]. The environmental factor of sustainability considers the effects of human activities and advances on changing local and global surroundings. On the other side, economic sustainability focuses on developing a community toward financial goals such as greater wealth, employment, productivity, and eventually welfare. In contrast, social sustainability is typically concerned with concerns of equity and inclusion [31].
Sustainability studies have been conducted extensively worldwide to assess the environmental, economic, and social impact of practices that satisfy society’s current and future demands [3]. In India, Romeiro [32] studied the policy on transportation to enhance the ridership of Bengaluru Metropolitan Transport Corporation (BMTC). They found that this ridership of BMTC can reduce the city’s overall traffic emissions, which subsequently also enhances sustainability. They also show that initiatives as simple as bus pricing restructuring can substantially influence ridership and can be used to help Bengaluru become more livable [33]. In Poland, Wolek et al. [34] explored the issues that affect the trolleybus system using in-motion charging (IMC) technology. They used an economic model to evaluate the total cost of trolleybuses and proved that trolleybuses using IMC technology are more cost-efficient than diesel buses [34]. Thus, it is more economically efficient, contributing to public sustainability [34]. Furthermore, in Europe, Scorrano et al. [34] also studied the difference between electric light commercial vehicles (eLCV) in comparison to petrol and diesel vehicles. They found that eLCV models transporting in the city are more suitable and efficient for short-distance travel and more cost-effective than their petrol and diesel counterparts [34]. In addition, they also suggest that electric vehicles are practical in urban settings and that public initiatives that encourage their use are beneficial [34].
Although there is plenty of literature about sustainability measurements in transportation systems, very little information for measuring the service quality of sustainable e-trike operations exists. In Manila and Southern Luzon in the Philippines, Luansing et al. [35] only developed a study on designing systems to support long-term e-trike commercialization. The paper only presented an improved e-trike design that offers a comfortable and safe riding experience for passengers based on the principle of ergonomics. In addition, the study focuses only on the three significant factors for design improvement, namely functionality, safety, and comfort. Moreover, the proposed changes in e-trike design are only developed based on customer requirements gained from the survey. In Cabanatuan City, the Philippines, Balaria et al. [8] also conducted a study on the sustainability of e-trikes, mainly related to the payback period of e-trikes compared to the cost and return among other modes of transportation in the city. However, the study simply highlighted the economic dimension and determined the return on investment. Thus, a further study that evaluates the sustainable e-trike operations based on the sustainability dimensions is highly required.
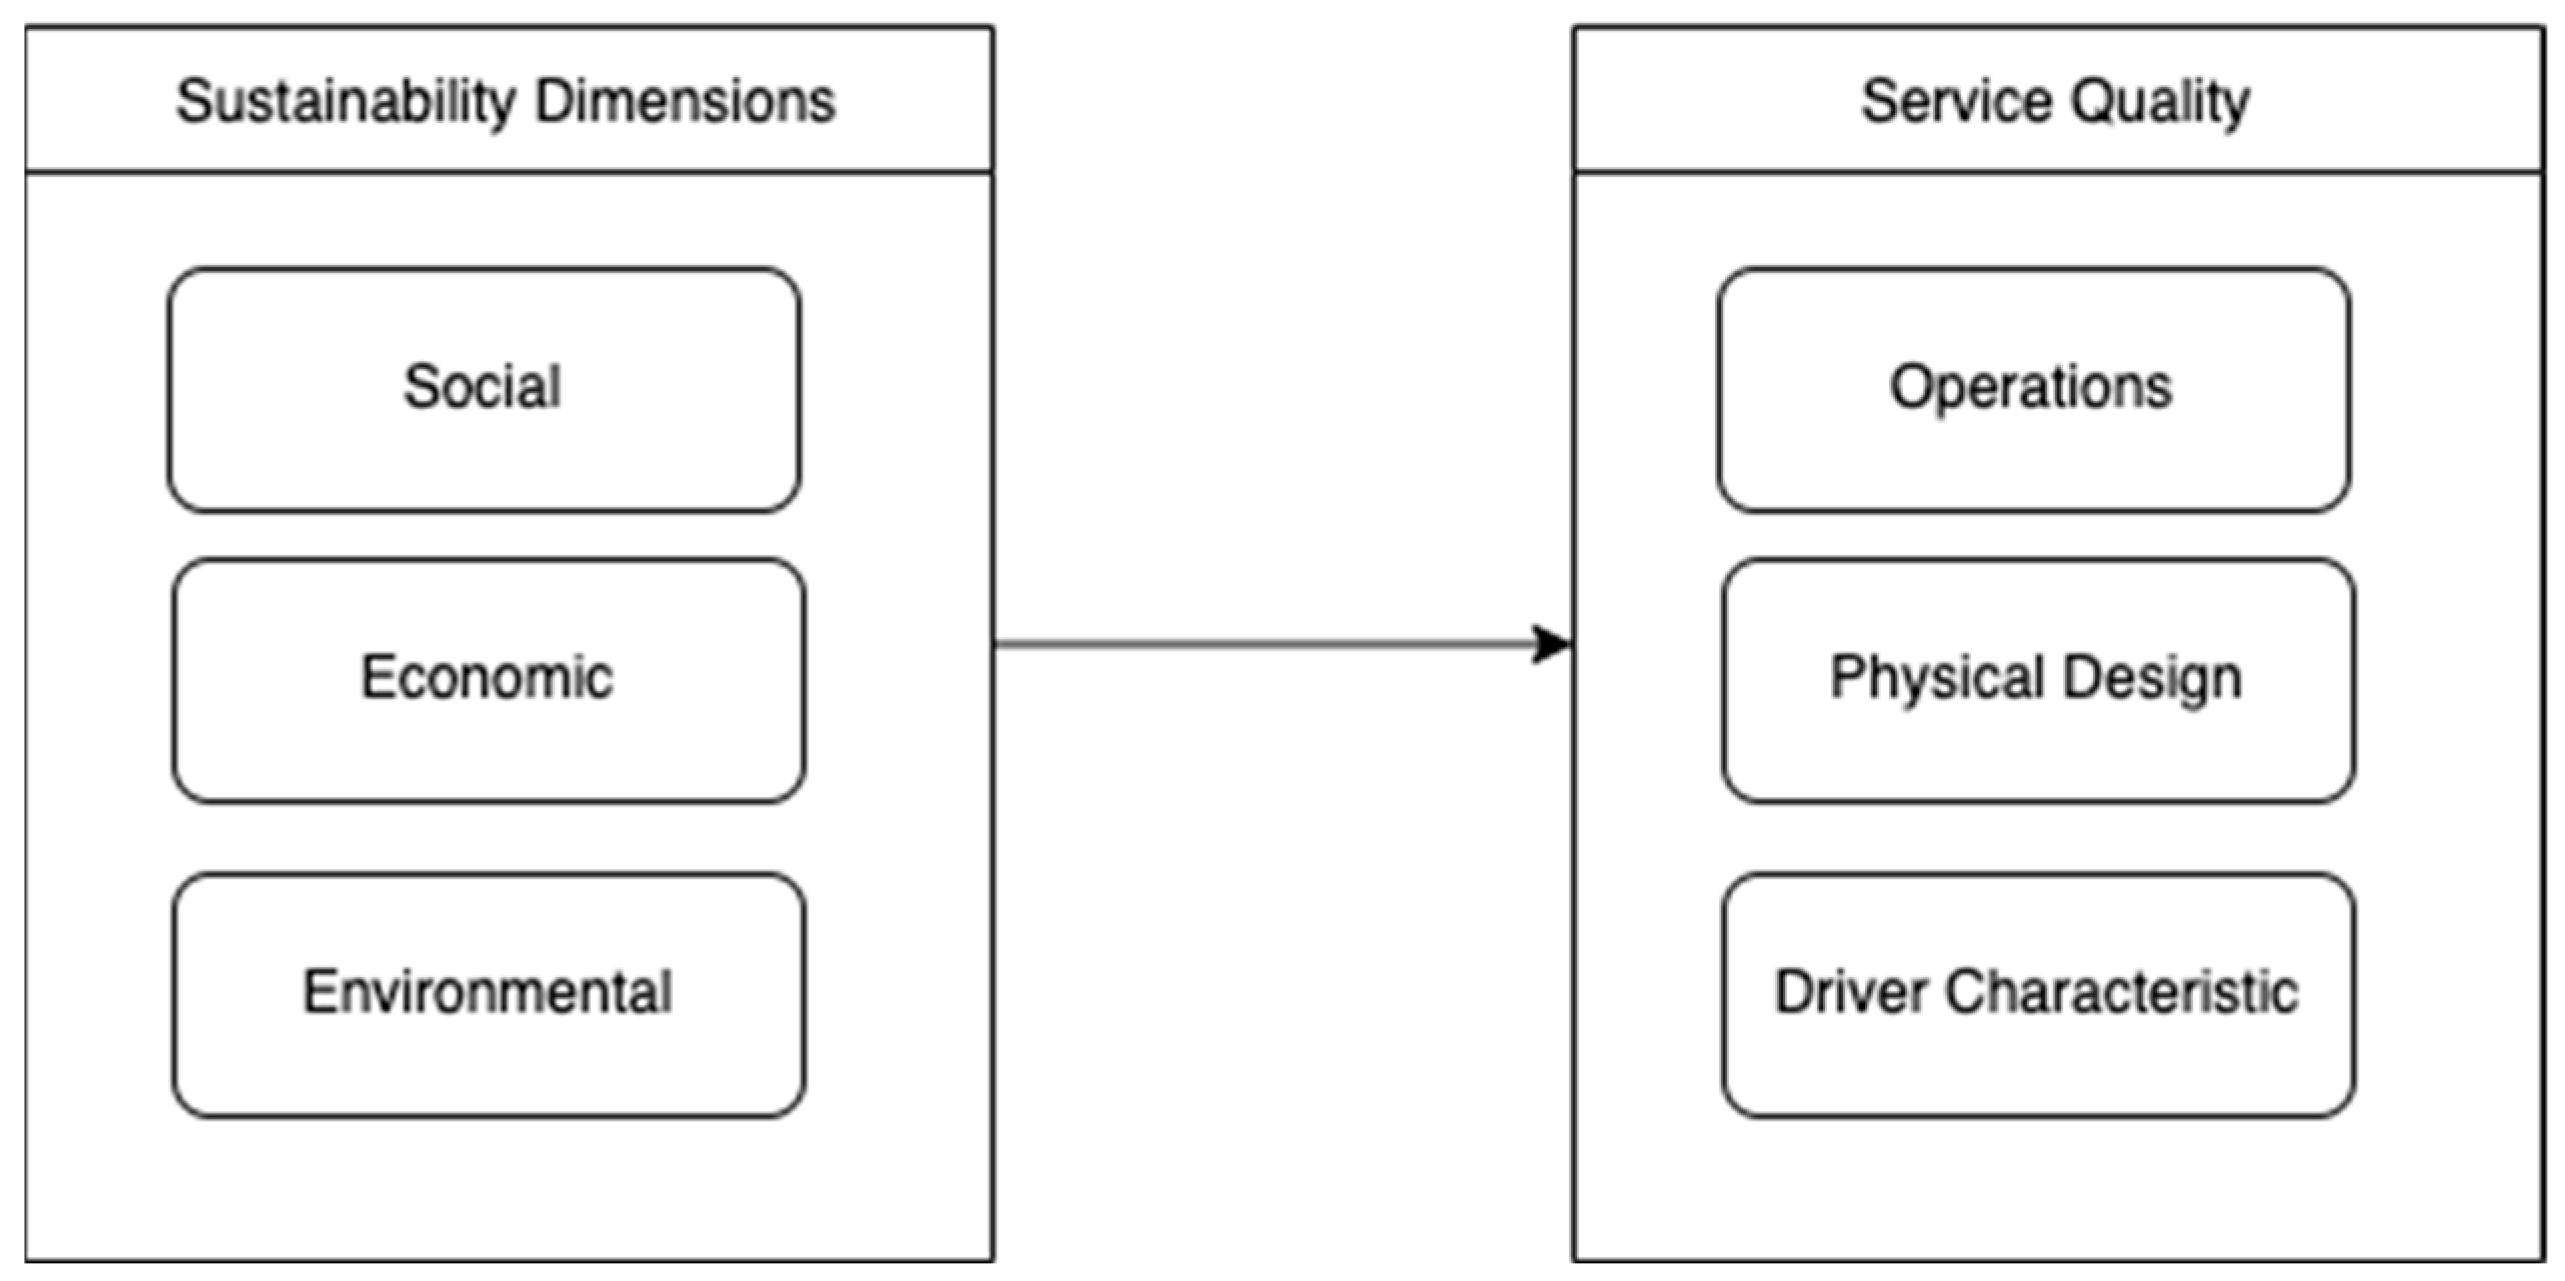
This research aims to develop a service quality model of sustainable e-trike operations in the city of Manila, Philippines using stepwise regression analysis. This technique presumes the selection of several service quality attributes under operations, physical design, and driver characteristics. Several indicators mainly predict this service quality under three sustainability dimensions, which consist of social, economic, and environmental. The service quality model developed in this study can be utilized to quantify e-trike transportation service quality inside the roadway environment based on passenger perception of how well a service or facility is operating. This study can be used for other public transportations to improve their current service quality and operations further.

2. Conceptual Framework

Figure 1 represents the conceptual framework of this study. The study adopted the concept of sustainable development as a framework for predicting the service quality of e-trikes. Sustainable development necessitates promoting connections between environmental protection, economic efficiency, and development when it comes to transportation systems. The goal of the environmental dimension is to comprehend the common effects of the physical environment and industry practices and ensure that all parts of the transportation industry address environmental concerns. The goal of the economic dimension is to direct advancement in the direction of economic efficiency. Transportation must be both cost-effective and adaptable to shifting demands. The purpose of the social dimension is to raise living standards and improve quality of life [36].
An evaluation of service quality is critical for both e-trike operators and public transportation authorities since increased service quality in public transportation has been shown to play a crucial role in attracting new passengers to use public transportation [37,38], and as a result, reducing traffic pollution [39]. Based on previous studies, the variables that were used to assess the service quality of public transport were related to infrastructures such as operations [40,41], driver characteristics [42], and physical design [35]. According to European Commission [43], one way to deliver high-quality urban public transport operations is to introduce quality indicators linked with programs to improve service quality. Thus, in the context of public transport, service quality has a crucial role in pursuing sustainable development in our societies and achieving sustainable public transportation infrastructure.
Table 1 represents the summary of the indicators under the sustainability dimensions. Supported by several previous studies [44,45,46,47,48,49,50,51,52,53], these indicators cover the three dimensions of public transport sustainability as (1) social: service frequency, ease of availability, intensity of e-trike, waiting time for e-trike, travel time ratio, presence of public transport, comfort load, headway regularity, smoothness of the ride, accessibility,% of accidents involved, accessibility to PWD, social priority, and signal priority; (2) economic: fare affordability, fare acceptability, ratio of public transport, discount rates, staff/e-trike ratio, operating ratio, and modal share; and (3) environmental: energy consumption, land use, pollution emission, and noise pollution.
On the other hand, Table 2 summarizes the indicators under service quality dimensions. Supported by several previous studies [52,53,54,55,56,57], these indicators cover the three dimensions of service quality of public transport operations, which consist of (1) physical design: appearance, comfort, seating capacity, cleanliness, booth accessibility, ventilation, features; (2) operations: convenient schedule, security; and (3) driver characteristic: safety, driving skills, attitude, dependability, neatness, friendliness, attention, sympathy, helpfulness, and interest. Indicator 1 refers to operations that relate to the convenience of e-trike schedules and the feeling of security of passengers while traveling. Indicator 2 refers to the physical design of e-trike that relates to appearance, comfort, and overall ride experience. Lastly, indicator 3 refers to drivers’ characteristics associated with the driving manner, personality, and social skills.

3. Methodology

3.1. Sampling Design

This study builds on one exploratory case study of e-trike operations in Manila City. Manila City is the Philippines’ capital and second-most populous city. It is highly urbanized and was the world’s most densely populated proper city as of 2019 [58]. Manila city operates one of the most extensive e-trike operations in the country. In 2018, Manila planned to phase out all gasoline-run tricycles and pedicabs and replace them with e-trikes and distributed 10,000 e-trikes to qualified tricycle drivers from the city [59]. The city has already distributed e-trikes to several drivers and operators in Binondo, Ermita, Malate, Intramuros, Recto, and Santa Cruz [60]. The study was conducted among the three (3) districts in the City of Manila, namely, Binondo, Recto, and Intramuros, where many e-trike operators were located.
Data were collected through both surveys and focus group discussions. The survey focused on the passengers’ perspective of service quality, while the focus groups with non-passengers provided data on e-trike operations. The focus group involved interviews with people from operations areas and transport agencies.
The survey was administered through a pen and paper questionnaire, and respondents were divided into three districts of Manila City (Intramuros, Recto, Binondo). Using a stratified sampling technique, a probability sampling approach was used in data gathering. The target population’s elements are divided into distinct groups or strata in this technique. Within each stratum, the elements are similar to each other with respect to selecting characteristics of importance to the survey [61]. This was used to improve the efficiency of the sample design concerning cost and estimator precision. The stratified sampling was deployed to collect at least 60 responses from each district.

3.2. Participants

The participants in the study include operators, drivers, passengers, and transport agencies. A total of 230 participants were involved in the study, including 32 e-trike operators and 198 e-trike passengers. The sample size of 230 is compared against the computed sample size of 124 for a public transport line following the study of dell’Olio et al. [62], as shown in Equation (1).
n p 1 p e z 2 + p 1 p N
where n is the number of passengers to be surveyed on the line, and p is the proportion of passengers who are traveling to a determined destination, which is taken to be 0.328 based on the travel demand forecast for tricycles as shown in Table 3. An e equivalent to 5% is the level of assumed error, z equivalent to 1.96 is the value of the random variable in a standard normal distribution, and N equal to 200 is the observed flow of passengers on the line. Thus, the sample can be represented with a level of confidence of 95%.
Table 4 presents the descriptive statistics of respondents’ profiles. The majority of the respondents are female (57.39%). Almost 30% of the respondents are between 21–25 years old. The highest percentage of respondents are employed (73.48%). This is particularly noteworthy given that the study aims to assess commuters’ perceptions of service quality. As a result, employed commuters, as opposed to unemployed commuters, make many trips, followed by students. The median income is in the PHP 10,000–20,000 range in terms of monthly allowance or income. This characteristic corresponds to the median daily travel allowance expense of PHP 101–150, which equates to an average monthly expenditure of PHP 3000. Daily, the majority of the respondents traveled between 3 km-5 km (35.65%) with commuting times between 31–60 min/day (44.35%).

3.3. E-Trike Sustainability Dimensions Survey

This study focuses on the public perceptions of sustainable e-trike operations, specifically on the mechanisms of influence by which different district characteristics shift passenger perception. We investigated the factors that impact the passenger perception of sustainable transportation dimensions to provide a guide for public transport planners and policymakers.
A survey questionnaire on sustainability dimensions for the e-trike operation was developed using indicators derived from the literature to assess e-trike sustainability. The indicators reflect the three dimensions of transport sustainability that focus on social, economic, and environmental. Based on the three dimensions, we drew down supplementary indicators such as service frequency, ease of availability, intensity, waiting time, travel time ratio, presence of organized public transport, passenger comfort load, headway regularity, smoothness of ride, accessibility, safety, accessibility for PWD, social priority, signal priority, transport expense, discount rate, fare affordability, staff ratio, operating ratio, modal share, fare acceptability, land use, pollution, energy consumption, and noise. The parameters and rubrics for each indicator are rated on a 4-point Likert scale ranging from the lowest to highest score. The variables that were used to evaluate dimensions and indicators allowed for the precise determination of the points at which information may be obtained through the associated questionnaire items, as shown in Table 5.

3.4. E-Trike Operation Service Quality Survey

It is critical to comprehend the aspects that underlie travel satisfaction for various groups of people to create a transportation service that fits individual travel needs. Service quality evaluation needs to be defined and carried out carefully since this refers to a complex relationship between tangible and intangible characteristics of service and users’ demands. This encompasses subjective perceptions, expectations, prior experience, and the well-being of travelers. Varied travelers have different needs and priorities, which affect their pleasure and enjoyment of the many quality components of their services.
A service quality questionnaire was designed to collect data from commuters of e-trikes. The questionnaire was composed of 19 questions about the perceived service quality level of e-trike operations. Service quality in the public transportation system constitutes internal and external factors that affect the commuter’s perception of the public transport services. Internal factors included operations and driver characteristics, while external factors included physical design. The questionnaire was created using indicators for evaluating the quality of e-trike services that were obtained from the literature, which consisted of the following: convenient schedule, security, appearance, comfort, seating capacity, cleanliness, booth accessibility, ventilation, updated features, safety, interest, trust, attitude, neatness, friendliness, attention, skills, sympathy, and helpfulness. Each indicator’s parameters and rubrics are scored on a 4-point Likert scale, ranging from strongly disagree to strongly agree, where the given rubrics are shown in Table 6.

3.5. Statistical Analysis

A predictive model using stepwise regression analysis was developed for this study. Stepwise regression is the iterative creation of a regression model in which the independent variables to be utilized in the final model are chosen step by step. It entails incrementally adding or eliminating potential explanatory factors, with each iteration requiring statistical significance assessment. Stepwise regression analysis generates an equation to describe the statistical relationship between one or more predictor variables and the response variable. The significance and relationship of independent variables were determined and used as the functional equations to interpret the impact of the independent variables on the dependent variable. In this study, the result of the perceived service quality score was identified as the dependent variable, while the indicators for sustainability dimensions were identified as independent variables. The service quality score was based on the arithmetic mean of 19 items on the scale used for measuring the service quality of e-trike in terms of operations, physical design, and driver characteristics. A Cronbach’s alpha coefficient calculation of 0.811 showed that the items have internal consistency and reliability. After which, with the use of Minitab 18 software, the general equation for the predictive model of service quality was developed using a significance level of 5%.

4. Results

4.1. Service Quality

Table 7 shows the descriptive statistics of respondents’ responses regarding the perceived service quality of e-trike operations. A total of 19 variables were captured from the survey questionnaire focused on three factors: operations, physical design, and driver characteristics. The average scores for the measurement of variables were calculated to obtain the mean scores to test the respondent’s degree of satisfaction. Based on the 4-point Likert scale, a mean of 2.0 was taken as the minimum acceptable mean score, which indicates that any item with a mean score above 2.0 agreed that respondents are satisfied with the service quality of e-trike based on the given variable. Based on the results, respondents are satisfied with all the service quality variables. However, the variable that has the highest rating is as follows, for the operations factor, the highest service quality score is the feeling of security while traveling; for the physical design factor, the highest score is e-trike ventilation level; and for driver characteristic factor, the highest score is neatness of drivers. Overall, the highest rating factor is operations, followed by physical design, and the least is the driver characteristic.

4.2. Indicators for Public Transport Sustainability

Table 8 shows the summary data for the indicators of transport sustainability of e-trike. Based on the data gathered, the indicator with the highest social dimension score is the smoothness of the e-trike ride, with a mean score of 3.74. For the economic dimension, the highest score indicator is fare acceptability, with a mean score of 3.48. Lastly, for the environmental factor, the highest indicator is pollution, with a mean score of 3.8. Overall, the highest rating factor is environmental, followed by social, and the least is economic.

4.3. Regression Model

Before the regression analysis, a multicollinearity test using correlation analysis was performed to verify if high intercorrelations among two or more independent variables in a regression model existed. This is used to confirm the reliability of statistical inferences. The examination of the correlation between independent variables resulted in a correlation coefficient value lower than the pairwise variables, indicating a low possibility of collinearity. Furthermore, the absolute value of the Pearson correlation coefficient from the analysis resulted in a value between 0.254 and 0.478. Therefore, multicollinearity among variables does not exist.
After performing a multicollinearity test, a stepwise regression was calculated to predict the model for service quality of e-trike based on sustainability dimensions. An automated stepwise regression selection process was used to obtain the optimal model. The tests are carried out at each stage in the stepwise solution to determine the influence or contribution of each variable already in the equation as if it had been entered last. As a result, it is possible to choose a group of independent variables that best predict the dependent variable and eliminate extraneous variables. In this process, the contribution of each variable to explaining the variance in the independent variable determines the order in which the independent variables are included [63].
In this case, the variable that explains the most variance is input first, followed by the variable that explains the most variance when used with the first variable, and so on. The independent variables that do not fulfill the pre-established statistical requirements for inclusion in the equation are removed at each step. From there, a regression model was developed. A significant regression equation was found with an R2 of 0.5510. The predicted model for service quality of e-trike is shown in Equation (2).
Service Quality = 1.910 + 0.0317 Ease of availability + 0.0420 Intensity of e-trike + 0.0723 Comfort load + 0.1001 Smoothness of ride + 0.2128 Accessibility of PWD + 0.0886 Discounted rates + 0.0339 Fare affordability + 0.0577 Fare acceptability + 0.0835 Land Use + 0.0886 Noise Level
The models were simplified by leaving only the coefficients significantly different from 0, having p < 0.05. The coefficient indicates that for every one value increase in the score of sustainability indicators, one can expect an increase in the perceived service quality of e-trike passengers. Therefore, indicators that can predict the service quality of e-trike operations are ease of availability, the intensity of e-trike, comfort load, smoothness of the ride, accessibility of PWD, discounted rates, fare affordability, fare acceptability, land use, and noise level. For these data, accessibility of PWD (0.2128) and smoothness of ride (0.1001) have the highest coefficient value, indicating the strongest positive relationship to service quality. The result of the regression analysis is shown in Table 9.
The R-square value is calculated, and it measures how close the data is to the regression fit line. The model summary of the regression analysis incurred an adjusted R2 of 55.10%, which indicated that independent variables in the equation were strong predictors for the service quality of e-trikes operation.
The data were checked using the normal probability plot and residual scatter plot to see if the data met the conditions of linearity, homoscedasticity, and independence conditions. As shown in Figure 2, the residual plots were almost as close to the normal straight diagonal line as the normal probability plot, indicating that the residuals were of approximate normal distribution. Furthermore, the scatter plot revealed that most of the plots clustered in an almost rectangular form along the zero line, with approximately equal dispersion around zero and no strong tendency to be larger or less than zero, indicating that the residuals were linear homoscedastic. As a result, there was no cause to be concerned about the regression assumptions being violated.

5. Discussion

The launching of e-trikes in the country started in 2012 with the government’s aim to enhance the country’s position to be at the forefront of green transport in Asia [4]. The use of e-trike drives to promote energy efficiency and sustainable technologies in the country’s transportation sector. The creation of a transportation system that has a positive impact on the environment and the social and economic prosperity of communities can help ensure the sustainability of public transportation. Thus, these three elements are at the heart of the foundation concept for implementing sustainability in public transport. In this study, the indicators under sustainability dimensions were analyzed to predict the service quality of e-trike operation using stepwise regression analysis.
For the environmental dimension, it was found that indicators such as land use and noise level significantly affect the service quality of passengers. According to Litman [45], the quality of transportation services improves when land use in transportation facilities is decreased to the extent that local and regional ecosystem conservation objectives are accomplished. Understanding people’s interactions, land use and occupation, activity distribution across territories, and the accessibility of various services is critical to developing a sustainable city that efficiently and equitably uses and distributes its resources [64]. Thus, transportation systems must make optimal use of land and other natural resources to achieve environmental sustainability while also ensuring habitat protection [45]. Moreover, the noise level on public transport also affects the service quality of commuters. According to researchers, bursts of intense noise on both public and private forms of transportation may put people at risk of noise-induced hearing loss [65]. Since e-trikes are quieter than diesel and petrol vehicles, both residential areas and commuters will benefit tremendously from reducing noise levels.
Subsequently, for the economic dimension, it was found that indicators such as discount rate, fare affordability, and fare acceptability have significant effects on service quality. According to Jin et al. [66], providing affordable public transportation is linked to a wide range of issues, including urban development, traffic regulation, environmental concerns, general notions of fairness, and providing an essential degree of mobility for all.
Hensher et al. [36] explored the challenge of assessing service quality, demonstrating that fare is a significant factor in user satisfaction with public transportation [36]. Similarly, Gomez-Lobo [67] also proved that travel expense and fare affordability appear to have a significant explanatory effect on perceived service quality for public transport. Thus, it is suggested to develop improvement strategies to lower the fare and provide more discounts to achieve higher service quality among existing passengers. Developing policies for fare reduction could make transport cheaper, improve its affordability, and stimulate ridership.
Lastly, for the social dimension, indicators such as ease of availability, e-trike intensity, comfortability, smoothness of the ride, and PWD accessibility were found to have significant effects on service quality. These findings were supported by Jasti & Ram [46], who also found that ease of availability and vehicle intensity are good performance indicators of transport sustainability. Hensher [36] also found out that onboard safety, defined by the smoothness and comfort of the ride, is statistically vital for passengers’ perceived service quality. Moreover, a study by Stjernborg [68] reported that the most reported challenge for PWD in riding public transport is boarding and disembarking from vehicles. Thus, PWD accessibility strongly relates to the service quality of passengers.
In the predictive model for service quality of e-trike, the two strongest predictors are accessibility to PWD and smoothness of the ride. Thus, this should be the priority and focus of e-trike operators to improve their service quality. Accessibility to PWD is one of the most pressing concerns in today’s public transportation. According to the United Nations Convention on the Rights of Persons with Disabilities (NCRPD), it is mandatory to provide accessible transportation to people with disabilities to participate in society on an equal level with everyone else [52]. To make it easier for PWD to utilize public transportation facilities, Union Internationale des Transports Publics (UITP) suggests that public vehicles should be adapted to people with diverse abilities; with regards to the user experience, knowledge skills are easy to understand; they can be used efficiently and comfortably with minimum fatigue; and they should have appropriate size and spaces provided for manipulation of PWD passengers [69]. On the other hand, since the smoothness of the ride is also an essential aspect of the service quality of e-trikes, public transport operators should also focus on improving the quality of the ride itself by providing a smoother ride for passengers. The smoothness of the ride offers comfort for the driver and passengers on long journeys. According to Santos [70], the significant factors which affect the smoothness of the ride are the stiffness of the suspension components. Thus, to ensure a smooth ride for e-trike, it is suggested that operators install the appropriate tires; change the bushings, install springs, shock absorbers, and anti-roll bars; and soften the suspension of e-trikes [70].
In this study, several indicators proved to influence the service quality of e-trike operations in the city of Manila were found to support the results from previous studies. In Scotland, a study by Morton et al. [71] found that perceived convenience of bus operations appeared to have a strong positive explanatory influence when it comes to service quality of bus transport services, indicating that improvements in service frequency, availability, reliability, and stability are likely to increase existing passengers’ perceived satisfaction. A similar study was also performed in the United Kingdom [56] to quantify the relationship between the perceived service quality of passengers in bus service and service attributes using the logistic regression model. Results revealed that indicators found to have importance on the service quality are frequency of the service, reliability of the service, waiting and transfer time, security at stop/station, the comfort of the bus, availability of monthly/seasonally discounted tickets, information at stop/station, bus fare, need for transfer, bus stop location, and the availability of a park and ride service [56]. These findings provide an opportunity to develop strategies for improving transport service quality in a new way.
As a result, finding inefficiencies in the e-trike transportation system will enhance service management, expand coverage, and make public transportation more appealing. Excellent service quality is widely acknowledged as a source of competitive advantage. The key to providing excellent service quality is determining the customer’s demands accurately and responding to them consistently to ensure their satisfaction.
This study is the first study that highlighted the significant factors that influenced the service quality of e-trike based on sustainability indicators. These indicators have shown the areas where improvement actions must be taken to achieve e-trike operation sustainability. With a greater emphasis on achieving sustainability and reducing adverse effects on society and the environment, public transportation is at the forefront of resolving urban region and modern transportation system concerns. Because public transportation is one of the prerequisites for long-term mobility, special attention must be paid to increasing the attractiveness of provided service quality, which is widely recognized as a critical determinant for an organization’s success and survival in today’s competitive environment. To summarize, the study’s predictive model can be adopted and used for public transportation services, since it allows for a better knowledge of service quality indicators in public transportation. Designing and executing a functional and successful regulation of public transport in developing countries such as the Philippines is difficult due to the many limits and limitations that governments and operators confront. Thus, careful attention to the public transport services, especially the attributes that contribute to service quality, seems imperative.

5.1. Theoretical Contributions

This study contributes to the theoretical framework of the sustainability model for public transport. As the first comprehensive study related to the sustainability of e-trike operations, the findings of this study could serve as a model for public transport operators to improve their service quality to achieve sustainability. The indicators found in this study to have significant contributions to the service quality of e-trikes could also serve as a basis for other public transport operators. For both operators and public transport authorities, it is essential to develop a model for service quality because it will play a key role in attracting more commuters to utilize public transport and help reduce traffic pollution.

5.2. Practical Implications

The significant findings of this study shed some light on the relevance of focusing on enhancing service quality in the public transportation industry to boost customer satisfaction. Moreover, the results of this study will provide transport management companies with an effective tool for use in their customer service quality surveys. This could encourage operating companies of public transport to include some of the indicators found significant in the study in their customers’ surveys. As a result, the gap between practitioner demands and scientific research will be met.
The findings of this study will also provide a better opportunity for the government to invest in sustainable transport systems such as e-trikes and other electric vehicles for public transport. This would support cleaner technology and improve the community’s air quality while simultaneously providing passengers with a safe and comfortable mode of transportation.

5.3. Limitations and Future Research

The authors would like to acknowledge several limitations of this study. First, the indicators used to measure the service quality of e-trike operations were only limited to three dimensions, namely operations, physical design, and driver characteristics. Researchers in the future can investigate these factors, utilizing the most up-to-date methods and models available that are applicable in this type of study, such as structural equation modeling [72,73,74,75]. Second, the study also focuses only on passengers of e-trike in the Manila area. Future research can circumvent these constraints by looking at different regions of the country and applying this type of research to other modes of public transportation.

6. Conclusions

The electric tricycle, often known as an e-trike, is a three-wheeled electric vehicle designed to transport a small group of people over short distances on side streets. This study aims to develop a service quality model for sustainable e-trike operations in the city of Manila, Philippines using a stepwise regression model. A total of 230 participants from three districts in the City of Manila: Binondo, Recto, and Intramuros, were selected using the stratified sampling method. Although the availability of much of the literature for measuring sustainability in transportation systems may be found in current works, very little information for measuring the service quality of sustainable e-trike operations exists. Thus, this is the first study to look at the significant elements that influenced the quality of e-trike service based on sustainability indicators.
The main contribution of this study emerges from the quantification of the influence of sustainability indicators on the perceived service quality of e-trike passengers. The study identified 10 indicators: ease of availability, e-trike intensity, comfort level, smoothness of the ride, PWD accessibility, discount rate, fare affordability, fare acceptability, land use, and noise level, to have significant importance on the service quality of e-trike operations. These indicators revealed the areas where improvements are needed to ensure the long-term viability of e-trike operations. Therefore, it is concluded that these factors should be the focus and priority for the improvement of e-trike operators, drivers, and transport groups to attain sustainability of e-trike operation in the country.
This study will also give the government a more significant opportunity to invest in sustainable public transportation systems such as e-trikes and other electric vehicles. This will encourage cleaner technology and improve air quality in the community while also providing passengers with a safe and comfortable form of transportation. This study can also be utilized as a basis for other public transportations to further improve their current service quality and operations.

Author Contributions

Conceptualization, M.J.J.G.; methodology, M.J.J.G.; software, M.J.J.G.; validation, Y.T.P., A.K.S.O., S.F.P. and R.N.; formal analysis, M.J.J.G.; investigation, M.J.J.G.; resources, M.J.J.G.; data curation, M.J.J.G.; writing—original draft preparation, M.J.J.G.; writing—review and editing, Y.T.P., A.K.S.O., S.F.P. and R.N.; visualization, Y.T.P.; supervision, Y.T.P., S.F.P. and R.N.; project administration, M.J.J.G.; funding acquisition, M.J.J.G. and Y.T.P. All authors have read and agreed to the published version of the manuscript.

Funding

This research was funded by Mapúa University Directed Research for Innovation and Value Enhancement (DRIVE) (Funding No. FM-RS-03-02).

Institutional Review Board Statement

This study was approved by the School of Industrial Engineering and Engineering Management Mapua University Research Ethics Committees.

Informed Consent Statement

Informed consent was obtained from all subjects involved in the study.

Data Availability Statement

The data presented in this study are available on request from the corresponding author.

Acknowledgments

The authors would like to thank all the respondents who voluntary participated in this study.

Conflicts of Interest

The authors declare no conflict of interest.

References

  1. Golbabaei, F.; Yigitcanlar, T.; Paz, A.; Bunker, J. Individual Predictors of Autonomous Vehicle Public Acceptance and Intention to Use: A Systematic Review of the Literature. J. Open Innov. Technol. Mark. Complex. 2020, 6, 106. [Google Scholar] [CrossRef]
  2. Petrov, A.; Petrova, D. Open Business Model of COVID-19 Transformation of an Urban Public Transport System: The Experience of a Large Russian City. J. Open Innov. Technol. Mark. Complex. 2021, 7, 171. [Google Scholar] [CrossRef]
  3. Nasution, A.A.; Erwin, K.; Bartuska, L. Determinant Study of Conventional Transportation and Online Transportation. Transp. Res. Procedia 2020, 44, 276–282. [Google Scholar] [CrossRef]
  4. Ong, A.K.S.; Robielos, R.A.C.; Jou, Y.T.; Wee, H.M. Three-Level Supply Chain considering Direct and Indirect Transportation Cost and Carbon Emissions. IOP Conf. Ser. Mater. Sci. Eng. 2020, 847, 012050. [Google Scholar] [CrossRef]
  5. Transport Sector Assessment, Strategy, and Road Map. Available online: https://www.adb.org/documents/philippines-transport-sector-assessment-strategy-and-road-map (accessed on 19 September 2021).
  6. Luansing, R.; Pesigan, C.; Rustico, E. An e-trike ICE Project—Innovative, Concrete and Ergonomic: Systems Design to Support Sustainable e-trike Commercialization. Procedia Manuf. 2015, 3, 2333–2340. [Google Scholar] [CrossRef] [Green Version]
  7. Electric Tricycles to Reduce Transport Sector’s Gasoline Consumption by 5.6 MMB. Available online: https://www.doe.gov.ph/press-releases/electric-tricycles-reduce-transport-sectors-gasoline-consumption-56-mmb?ckattempt=1 (accessed on 19 September 2021).
  8. Balaria, F.E.; Pascual, M.P.; Santos, M.D.; Ortiz, A.F.; Gabriel, A.G.; Mangahas, T.L.S. Sustainability of E-Trike as Alternative Mode of Public Transportation System: The Case of Cabanatuan City, Philippines. Open J. Civ. Eng. 2017, 7, 362–377. [Google Scholar] [CrossRef] [Green Version]
  9. Kimpimäki, J.-P.; Malacina, I.; Lähdeaho, O. Open and sustainable: An emerging frontier in innovation management? Technol. Forecast. Soc. Chang. 2021, 174, 121229. [Google Scholar] [CrossRef]
  10. Lu, Q.; Chesbrough, H. Measuring open innovation practices through topic modelling: Revisiting their impact on firm financial performance. Technovation 2021, 102434. [Google Scholar] [CrossRef]
  11. Chaudhary, S.; Kaur, P.; Talwar, S.; Islam, N.; Dhir, A. Way off the mark? Open innovation failures: Decoding what really matters to chart the future course of action. J. Bus. Res. 2022, 142, 1010–1025. [Google Scholar] [CrossRef]
  12. Lima, E.G.; Chinelli, C.K.; Guedes, A.L.A.; Vazquez, E.G.; Hammad, A.W.A.; Haddad, A.N.; Soares, C.A.P. Smart and Sustainable Cities: The Main Guidelines of City Statute for Increasing the Intelligence of Brazilian Cities. Sustainability 2020, 12, 1025. [Google Scholar] [CrossRef] [Green Version]
  13. Ahvenniemi, H.; Huovila, A.; Pinto-Seppä, I.; Airaksinen, M. What are the differences between sustainable and smart cities? Cities 2017, 60, 234–245. [Google Scholar] [CrossRef]
  14. Haarstad, H. Constructing the sustainable city: Examining the role of sustainability in the ‘Smart City’ Discourse. J. Environ. Policy Plan. 2016, 19, 423–437. [Google Scholar] [CrossRef]
  15. Monfaredzadeh, T.; Krueger, R. Investigating Social Factors of Sustainability in a Smart City. Procedia Eng. 2015, 118, 1112–1118. [Google Scholar] [CrossRef] [Green Version]
  16. Caputo, F.; Walletzký, L.; Štepánek, P. Towards a systems thinking based view for the governance of a smart City’s ecosystem. Kybernetes 2019, 48, 108–123. [Google Scholar] [CrossRef]
  17. Sidorchuk, R.; Skorobogatykh, I.; Lukina, A.; Mkhitaryan, S.; Stukalova, A. Access to the Rail Station as a Customer Value: Simulation of Passenger Flows in Rail Stations with Disinfection Gateway Installations. J. Open Innov. Technol. Mark. Complex. 2020, 6, 122. [Google Scholar] [CrossRef]
  18. Umar, M.; Ji, X.; Kirikkaleli, D.; Xu, Q. COP21 Roadmap: Do innovation, financial development, and transportation infrastructure matter for environmental sustainability in China? J. Environ. Manag. 2020, 271, 111026. [Google Scholar] [CrossRef] [PubMed]
  19. Banister, D. The sustainable mobility paradigm. Transp. Policy 2008, 15, 73–80. [Google Scholar] [CrossRef]
  20. Pojani, D.; Stead, D. Sustainable Urban Transport in the Developing World: Beyond Megacities. Sustainability 2015, 7, 7784–7805. [Google Scholar] [CrossRef] [Green Version]
  21. Park, C.; Park, J.; Choi, S. Emerging clean transportation technologies and distribution of reduced greenhouse gas emissions in Southern California. J. Open Innov. Technol. Mark. Complex. 2017, 3, 8. [Google Scholar] [CrossRef] [Green Version]
  22. Singh, R.; Mishra, S.; Tripathi, K. Analysing acceptability of E-rickshaw as a public transport innovation in Delhi: A responsible innovation perspective. Technol. Forecast. Soc. Chang. 2021, 170, 120908. [Google Scholar] [CrossRef]
  23. Larranaga, A.M.; Arellana, J.; Rizzi, L.I.; Strambi, O.; Cybis, H.B.B. Using best–worst scaling to identify barriers to walkability: A study of Porto Alegre, Brazil. Transportation 2019, 46, 2347–2379. [Google Scholar] [CrossRef]
  24. Dodourova, M.; Bevis, K. Networking innovation in the European car industry: Does the Open Innovation model fit? Transp. Res. Part A Policy Pr. 2014, 69, 252–271. [Google Scholar] [CrossRef] [Green Version]
  25. Yigitcanlar, T.; Kankanamge, N.; Regona, M.; Maldonado, A.; Rowan, B.; Ryu, A.; DeSouza, K.C.; Corchado, J.M.; Mehmood, R.; Li, R.Y.M. Artificial Intelligence Technologies and Related Urban Planning and Development Concepts: How Are They Perceived and Utilized in Australia? J. Open Innov. Technol. Mark. Complex. 2020, 6, 187. [Google Scholar] [CrossRef]
  26. Bıyık, C.; Abareshi, A.; Paz, A.; Ruiz, R.; Battarra, R.; Rogers, C.; Lizarraga, C. Smart Mobility Adoption: A Review of the Literature. J. Open Innov. Technol. Mark. Complex. 2021, 7, 146. [Google Scholar] [CrossRef]
  27. How Can We Make Transport More Sustainable? Available online: https://blog.ptvgroup.com/en/city-and-mobility/how-can-we-make-transport-more-sustainable/ (accessed on 19 September 2021).
  28. Ali, S.; Poulova, P.; Yasmin, F.; Danish, M.; Akhtar, W.; Javed, H. How Big Data Analytics Boosts Organizational Performance: The Mediating Role of the Sustainable Product Development. J. Open Innov. Technol. Mark. Complex. 2020, 6, 190. [Google Scholar] [CrossRef]
  29. American Public Transportation Association. Available online: https://www.apta.com/research-technical-resources/sustainability/apta-sustainability-commitment/ (accessed on 19 September 2021).
  30. Tjahjadi, B.; Soewarno, N.; Hariyati, H.; Nafidah, L.; Kustiningsih, N.; Nadyaningrum, V. The Role of Green Innovation between Green Market Orientation and Business Performance: Its Implication for Open Innovation. J. Open Innov. Technol. Mark. Complex. 2020, 6, 173. [Google Scholar] [CrossRef]
  31. Cano, J.; Londoño-Pineda, A. Scientific Literature Analysis on Sustainability with the Implication of Open Innovation. J. Open Innov. Technol. Mark. Complex. 2020, 6, 162. [Google Scholar] [CrossRef]
  32. Romeiro, A.R. Sustainable development: An ecological economic perspective. Estud. Avançados 2012, 26, 65–92. [Google Scholar] [CrossRef] [Green Version]
  33. Harsha, V.; Karmarkar, O.; Verma, A. Sustainable Urban Transport Policies to Improve Public Transportation System: A Case Study of Bengaluru, India. Transp. Res. Procedia 2020, 48, 3545–3561. [Google Scholar] [CrossRef]
  34. Wołek, M.; Wolański, M.; Bartłomiejczyk, M.; Wyszomirski, O.; Grzelec, K.; Hebel, K. Ensuring sustainable development of urban public transport: A case study of the trolleybus system in Gdynia and Sopot (Poland). J. Clean. Prod. 2021, 279, 123807. [Google Scholar] [CrossRef]
  35. Scorrano, M.; Danielis, R.; Giansoldati, M. Electric light commercial vehicles for a cleaner urban goods distribution. Are they cost competitive? Res. Transp. Econ. 2021, 85, 101022. [Google Scholar] [CrossRef]
  36. Hensher, D.A. Sustainable public transport systems: Moving towards a value for money and network-based approach and away from blind commitment. Transp. Policy 2007, 14, 98–102. [Google Scholar] [CrossRef] [Green Version]
  37. Guirao, B.; García-Pastor, A.; López-Lambas, M.E. The importance of service quality attributes in public transportation: Narrowing the gap between scientific research and practitioners’ needs. Transp. Policy 2016, 49, 68–77. [Google Scholar] [CrossRef]
  38. Barabino, B.; Cabras, N.A.; Conversano, C.; Olivo, A. An integrated approach to select key quality indicators in transit services. Soc. Indic. Res. 2020, 149, 1045–1080. [Google Scholar] [CrossRef]
  39. González, L.; Perdiguero, J.; Sanz, À. Impact of public transport strikes on traffic and pollution in the city of Barcelona. Transp. Res. Part D Transp. Environ. 2021, 98, 102952. [Google Scholar] [CrossRef]
  40. Sun, S.; Duan, Z. Modeling passengers’ loyalty to public transit in a two-dimensional framework: A case study in Xiamen, China. Transp. Res. Part A Policy Pr. 2019, 124, 295–309. [Google Scholar] [CrossRef]
  41. Amponsah, C.T.; Adams, S. Service quality and customer satisfaction in public transport operations. Int. J. Serv. Oper. Manag. 2017, 25, 531. [Google Scholar] [CrossRef]
  42. Frinaldi, A.; Embi, M.A.; Bila, A.; Angriani, S.; Uttami, A.A. The Effect of Driver Service Quality on Passenger Satisfaction in Public Transportation. In Proceedings of the International Conference on Public Administration, Policy and Governance (ICPAPG 2019), Padang, Indonesia, 4–6 November 2019; pp. 51–60. [Google Scholar]
  43. European Union. QUATTRO—4th F.P. Project Quality Approach in Tendering/Contracting Urban Public Transport op-Erations. Final Report. Synthesis and Recommendations. 1998. Available online: http://www.transport-research.info/web/projects/project_details.cfm?id=636 (accessed on 29 July 2014).
  44. Becker, B. Sustainability Assessment: A Review of Values, Concepts, and Methodological Approaches; Issues in Agricultural Series; CGIAR: Washington, DC, USA, 1997; p. 10. Available online: https://cgspace.cgiar.org/bitstream/handle/10947/5759/issues10.pdf?sequence=1 (accessed on 27 March 2022).
  45. Lois, D.; Monzón, A.; Hernández, S. Analysis of satisfaction factors at urban transport interchanges: Measuring travellers’ attitudes to information, security and waiting. Transp. Policy 2018, 67, 49–56. [Google Scholar] [CrossRef]
  46. Litman, T. Well Measured: Developing Indicators for Sustainable and Livable Transport Planning. Transp. Res. Rec. 2017, 2007, 10–15. [Google Scholar]
  47. Jasti, P.C.; Ram, V.V. Integrated and Sustainable Service Level Benchmarking of Urban Bus System. Transp. Res. Procedia 2016, 17, 301–310. [Google Scholar] [CrossRef]
  48. Black, W. Social and Economic Factors in Transportation. In Transportation in the New Millennium; Indiana University Bloomington: Bloomington, IN, USA, 2010. [Google Scholar]
  49. Cheba, K.; Saniuk, S. Urban Mobility—Identification, Measurement and Evaluation. Transp. Res. Procedia 2016, 14, 1230–1239. [Google Scholar] [CrossRef] [Green Version]
  50. Diana, M.; Daraio, C. Performance indicators for urban public transport systems with a focus on transport policy effectiveness issues. In Proceedings of the World Conference on Transport Research, Lisbon, Portugal, 11–15 July 2010. [Google Scholar]
  51. Wang, L. Framework for Evaluating Sustainability of Transport System in Megalopolis and its Application. IERI Procedia 2014, 9, 110–116. [Google Scholar] [CrossRef] [Green Version]
  52. Bongardt, D.; Schmid, D.; Huizenga, C.; Litman, T. Developing Practical Tools for Evaluation in the Context of the CSD Process; United Nations Department of Economic and Social Affairs: Eschborn, Germany, 2011. [Google Scholar]
  53. Sancho, D. Escaping India’s culture of education: Migration desires among aspiring middle-class young men. Ethnography 2017, 18, 515–534. [Google Scholar] [CrossRef]
  54. Yaya, L.H.P.; Fortià, M.F.; Canals, C.S.; Marimon, F. Service quality assessment of public transport and the implication role of demographic characteristics. Public Transp. 2015, 7, 409–428. [Google Scholar] [CrossRef]
  55. De Oña, J.; De Oña, R. Quality of Service in Public Transport Based on Customer Satisfaction Surveys: A Review and Assessment of Methodological Approaches. Transp. Sci. 2014, 49, 605–622. [Google Scholar] [CrossRef] [Green Version]
  56. Mahmoud, M.; Hine, J. Measuring the influence of bus service quality on the perception of users. Transp. Plan. Technol. 2016, 39, 284–299. [Google Scholar] [CrossRef]
  57. Balinado, J.; Prasetyo, Y.; Young, M.; Persada, S.; Miraja, B.; Redi, A.P. The Effect of Service Quality on Customer Satisfaction in an Automotive after-Sales Service. J. Open Innov. Technol. Mark. Complex. 2021, 7, 116. [Google Scholar] [CrossRef]
  58. Caruncho, E.S. Manila-the World’s Most Densely-Populated City-Reimagined by Harvard. Inquirer Lifestyle. 2018. Available online: https://lifestyle.inquirer.net/308785/manila-worlds-densely-populated-city-reimagined-harvard/ (accessed on 7 April 2022).
  59. Clapano, J.R. Manila: No More Trikes, Pedicabs Next Month. 2016. Available online: https://www.philstar.com/metro/2016/09/18/1624916/manila-no-more-trikes-pedicabs-next-month (accessed on 7 April 2022).
  60. Omoto, A. Completion of 3000 Electric Tricycle Project for Doe. Updates|BEMAC Electric Transportation Philippines. 2019. Available online: https://www.bemac-philippines.com/en/updates/news-from-the-web (accessed on 7 April 2022).
  61. Parsons, V.L. Stratified Sampling. In Wiley StatsRef: Statistics Reference Online; Balakrishnan, N., Colton, T., Everitt, B., Piegorsch, W., Ruggeri, F., Teugels, J.L., Eds.; Wiley: Hoboken, NJ, USA, 2017. [Google Scholar]
  62. Dell’Olio, L.; Ibeas, A.; de Oña, J.; de Oña, R. How to Study Perceived Quality in Public Transport. Public Transp. Qual. Serv. 2018, 7–32. [Google Scholar] [CrossRef]
  63. Hair, J.F.; Anderson, R.; Tatham, R.; Black, W.C. Multivariate Data Analysis, 5th ed.; Prentice Hall: Upper Saddle River, NJ, USA, 1998. [Google Scholar]
  64. Cruz, S.S.; Paulino, S.R. Experiences of innovation in public services for sustainable urban mobility. J. Urban Manag. 2021, 11, 108–122. [Google Scholar] [CrossRef]
  65. Yao, C.M.; Ma, A.K.; Cushing, S.L.; Lin, V.Y. Noise exposure while commuting in Toronto—A study of personal and public transportation in Toronto. J. Otolaryngol.—Head Neck Surg. 2017, 46, 62. [Google Scholar] [CrossRef] [Green Version]
  66. Jin, Z.; Schmöcker, J.-D.; Maadi, S. On the interaction between public transport demand, service quality and fare for social welfare optimisation. Res. Transp. Econ. 2019, 76, 100732. [Google Scholar] [CrossRef]
  67. Gómez-Lobo, A. Affordability of public transport, a methodological clarification. J. Transp. Econ. Policy (JTEP) 2011, 45, 437–456. [Google Scholar]
  68. Stjernborg, V. Accessibility for All in Public Transport and the Overlooked (Social) Dimension—A Case Study of Stockholm. Sustainability 2019, 11, 4902. [Google Scholar] [CrossRef] [Green Version]
  69. The Importance of Public Transport Accessibility and Social Inclusion. Available online: https://www.uitp.org/news/the-importance-of-public-transport-accessibility-and-social-inclusion/ (accessed on 19 September 2021).
  70. Santos, H.D.L. Understanding Springs and Ride Quality—Car Craft Magazine. MotorTrend. 2016. Available online: https://www.motortrend.com/how-to/ccrp-0303-springs-ride-quality/ (accessed on 8 April 2022).
  71. Morton, C.; Caulfield, B.; Anable, J. Customer Perceptions of Quality of Service in Public Transport: Evidence for Bus Transit in Scotland. Case Stud. Transp. Policy 2016, 4, 199–207. [Google Scholar] [CrossRef]
  72. Prasetyo, Y.T.; Senoro, D.B.; German, J.D.; Robielos, R.A.; Ney, F.P. Confirmatory factor analysis of vulnerability to natu-ral hazards: A household vulnerability assessment in Marinduque Island, Philippines. Int. J. Disaster Risk Reduct. 2020, 50, 101831. [Google Scholar] [CrossRef]
  73. Chuenyindee, T.; Ong, A.K.; Prasetyo, Y.T.; Persada, S.F.; Nadlifatin, R.; Sittiwatethanasiri, T. Factors affecting the per-ceived usability of the COVID-19 contact-tracing application “Thai chana” during the early COVID-19 omicron period. Int. J. Environ. Res. Public Health 2022, 19, 4383. [Google Scholar] [CrossRef]
  74. Prasetyo, Y.; Castillo, A.; Salonga, L.; Sia, J.; Chuenyindee, T.; Young, M.; Persada, S.; Miraja, B.; Redi, A. Factors Influencing Repurchase Intention in Drive-Through Fast Food: A Structural Equation Modeling Approach. Foods 2021, 10, 1205. [Google Scholar] [CrossRef]
  75. Ong, A.K.; Prasetyo, Y.T.; Salazar, J.M.; Erfe, J.J.; Abella, A.A.; Young, M.N.; Chuenyindee, T.; Nadlifatin, R.; Ngurah Perwira Redi, A.A. Investigating the acceptance of the reopening Bataan Nuclear Power Plant: Integrating Protection Moti-vation Theory and extended theory of planned behavior. Nucl. Eng. Technol. 2022, 54, 1115–1125. [Google Scholar] [CrossRef]
Figure 1. The conceptual framework.
Infrastructures 07 00069 g001
Figure 2. Normal probability plot for service quality scores.
Infrastructures 07 00069 g002
Table 1. Summary of indicators for sustainability dimensions.
FactorsIndicatorsDescriptionRelated Literature (Source)
Socialservice frequencye-trike inter-arrival time in minutes[44,45,46,49,50,51]
ease of availabilityno. of e-trike stops in the area[46,47]
intensity of e-trikeno. of e-trike available in the area[49]
waiting timepassenger waiting time in minutes[46,52]
travel time ratioduration of round-trip travel in minutes[46,49,50]
presence of organized public transportno. of e-trike driver associations in the area (e.g., toda)[48]
passenger comfort load factoruser rating for comfort level[47]
headway regularityduration between e-trikes in a transit system during peak hours (in mins)[47,50]
smoothness of e-trike rideuser rating for smoothness of ride[47,51]
accessibility of e-trikeuser rating for accessibility of ride[51]
safety% of accidents of e-trike in a year[45,50]
accessibility of physically disableduser rating on accessibility for pwd[47]
social priority% of total transport network for e-trike[47,50]
signal priority% of designated road signs for e-trike[47,50,51]
Economicthe ratio of public transport to personal transport expenseportion of daily expenditure devoted to e-trike transport cost[46,50]
discount rates% of commuters benefiting from discounted fares (e.g., students, pwd, senior, etc.)[47]
fare affordabilityuser rating for affordability of fare[46,47,52]
staff/e-trike ratiototal drivers and maintenance staff per total no. of e-trikes[46,49]
operating ratioearnings per e-trike per vehicle operating cost[46,47,52]
the modal share of e-trike% of travelers using e-trike as a mode of transportation[47]
fare acceptabilityuser rating for fare acceptability[46]
Environmentalland use% of land used by e-trike operations (e.g., terminal, maintenance area, etc.)[46,51]
pollutionper-capita emissions of ‘conventional’ air pollutants emitted by e-trike[46,49]
energy consumptioncharging cost[46,52]
noise pollutionnoise level of e-trike in decibels[47,53]
Table 2. Summary of indicators for service quality survey.
FactorsIndicatorsRelated Literature (Source)
Operationsconvenient schedule of e-trike services[52,53]
customers should feel secure while traveling with e-trike
Physical Designe-trike units have a good appearance in design[55,56]
e-trike units are very comfortable for customers
e-trike units have enough seats for the stated capacity
physical facilities of the e-trike operations are clean
ticket booths are in an easy-access place
e-trike units are well ventilated for customers
e-trike units are always updated technologically
Driverse-trike drivers are driving in a pleasant and safe manner[54,56,57]
the e-trike drivers have their customers’ best interests at heart
e-trike operations staff (drivers/and other employees) are trustworthy.
e-trike drivers are dependable
e-trike drivers appear neat
e-trike drivers are very friendly
e-trike drivers give each customer individual attention
Table 3. Metro Manila travel demand by mode.
ModeNo. of Trips (000)% of Public
Train14858.6
Bus235213.6
Jeepney676339.0
Tricycle568732.8
UV/HOV2611.5
Pedicab6313.6
Others1560.9
Source: JICA [35].
Table 4. Descriptive statistics of the demographic profile of respondents.
VariableCharacteristicsFrequencyProportion
GenderMale9842.61%
Female13257.39%
Age17–20 years old3113.48%
21–25 years old6829.57%
26–30 years old6528.26%
31–35 years old4519.57%
36 years old and older219.13%
Employment StatusStudent4519.57%
Unemployed166.96%
Employed16973.48%
Monthly allowance/incomePHP 10,000 and below6528.26%
PHP 10,000–20,0008336.09%
PHP 20,000–40,0006226.96%
PHP 40,000–70,000146.09%
PHP 70,000–130,00062.61%
Daily Transport AllowanceBelow PHP 50146.09%
PHP 51–1004620.00%
PHP 101–15012253.04%
PHP 151–2003716.09%
PHP 201–25010.43%
PHP 251–30031.30%
PHP 301–35010.43%
PHP 351–40020.87%
PHP 401–45031.30%
PHP 451–50010.43%
Commuting distance on e-trikeless than 3 km5925.65%
3–5 km8235.65%
5–10 km7633.04%
10–15 km83.48%
more than 15 km52.17%
Commuting time on e-trikeless than 10 min2611.30%
11–30 min8737.83%
31–60 min10244.35%
61–90 min156.52%
Table 5. Rubrics for e-trike sustainability survey.
DimensionIndicatorsDescriptionScoreRubrics
Socialservice frequencye-trike inter-arrival time in minutes1≥15 min
211 to 14 min
36 to 10 min
4≤5 min
ease of availabilityno. of e-trike stops in the area1<3
23 to 5
36 to 7
4>7
intensity of e-trikeno. of e-trikes available in the area1<2
22 to 4
34 to 6
4>6
waiting timepassenger waiting time in minutes1>15 min
211 to 15 min
36 to 10 min
4<5 min
travel time ratioduration of round-trip travel in minutes1>50
230 to 50
310 to 30
4<10
presence of organized public transportno. of e-trike driver associations in the area (e.g., toda)11
22
33
44
passenger comfort load factoruser rating for comfort level1poor
2fair
3good
4excellent
headway regularityduration of an e-trike in a transit system during peak hours (in mins)1>15 min
211 to 15 min
36 to 10 min
4<5 min
smoothness of e-trike rideuser rating for smoothness of ride1poor
2fair
3good
4excellent
accessibility of e-trikeuser rating for accessibility of ride1poor
2fair
3good
4excellent
safety% of accidents of e-trikes in a year1>50%
226 to 50%
310 to 25%
4<10%
accessibility of physically disableduser rating on accessibility for pwd1poor
2fair
3good
4excellent
social priority% of total transport network for e-trikes1<25%
225 to 49%
350 to 75%
4>75%
signal priority% of designated road signs for e-trikes1<25%
225 to 49%
350 to 75%
4>75%
Economicthe ratio of public transport to personal transport expenseportion of daily expenditure devoted to e-trike transport cost1>50%
225–50%
310–25%
4≤10%
discount rates% commuters benefiting from discounted fares (e.g., students, pwd, senior, etc.)1<25%
225 to 49%
350 to 75%
4>75%
fare affordabilityuser rating for affordability of fare1poor
2fair
3good
4excellent
staff/e-trike ratiototal drivers and maintenance staff per total no. of e-trikes1>10
28.1 to 10
35.6 to 8
4≤5.5
operating ratioearnings per e-trike per vehicle operating cost1>1.5
21.1 to 1.5
30.6 to 1.0
4≤0.5
the modal share of e- trike% travelers using an e-trike as mode of transportation1<25%
225 to 49%
350 to 75%
4>75%
fare acceptabilityuser rating for fare acceptability1poor
2fair
3good
4excellent
Environmentalland use% of land used by e-trike operations (e.g., terminal, maintenance area, etc.)1>75%
250% to 75%
325% to 49%
4<25%
pollutionper-capita emissions of ‘conventional’ air pollutants emitted by e-trike1>2.0
21.1–2.00
30.51–1.0
4≤0.5
energy consumptioncharging cost1>PHP15/kW
2PHP10-PHP15/kWh
3PHP5- PHP10/kWh
4<PHP5/kWh
noise pollutionnoise level of e-trike in decibels1≥70 dBA
269–60 dBA
359–50 dBA
4<49 dBA
Table 6. Rubrics for e-trike service quality survey.
DimensionIndicatorRubrics
Operationsconvenient schedule1—there is no defined operating time for e-trikes in the area.
2—e-trike has a defined operating schedule but is not convenient for customers at all (e.g., closes at 6 pm).
3—e-trike operations have a defined operating schedule but are based on a few groups of people (e.g., mall shoppers, students, and employees).
4—e-trike has a defined operating schedule convenient enough for all types of people.
security1—e-trikes do not have security and safety features (e.g., handlebars).
2—e-trikes have measures for safety and security but are not well-maintained.
3—e-trikes trips feel secure and safe.
4—safety and security measures are followed always.
Physical Designappearance1—e-trike looks very old and does not look durable.
2—e-trike have an updated design but does not look durable.
3—e-trike has an up-to-date design and looks like it can last a maximum of 3 years.
4—e-trike has an updated design and looks like it can withstand the road conditions on its route for 4 years or more.
comfort1—e-trike has little space for customers (below stated capacity), small legroom, and seats feel very uncomfortable.
2—e-trike has enough space for stated capacity but seats feel uncomfortable.
3—e-trike has enough space for capacity and has comfortable seats.
4—e-trike has ample space for capacity and has ergonomically designed seats that give you enough comfort.
seating capacity1—e-trike units do not have enough space for capacity.
2—e-trike units’ capacity can only fit one less than the stated capacity.
3—stated capacity can be utilized but will leave almost no space for customers to move freely.
4—e-trike can accommodate full capacity without compromising comfortability.
cleanliness1—e-trikes are not well maintained and do not seem to have measures for cleanliness.
2—e-trikes have minimal measures for cleanliness and no staff visible for maintenance. the facility still looks unpleasant.
3—e-trike have just enough equipment for cleanliness and staff for maintenance.
4—the e-trike is pleasant and looks very well maintained and clean. the maintenance staff is present.
booth accessibility1—no ticket booth present within 50 m from your location.
2—only 1 ticket booth but is at least 50 m away from your location requires walking a lot.
3—at least 2 ticket booths within 50 m of your location.
4—at least 2 ticket booths within 40 m of your location.
ventilation1—e-trike units feel hot and humid inside even with windows.
2—minimal ventilation for customers. e-trike units have limited openings.
3—e-trike units are ventilated just enough.
4—e-trike units are very well-ventilated and give customers a relaxed feeling.
updated features1—e-trike units are already outdated and do not show signs of updating their features anytime soon. (e.g., new seat cover, new paint, etc.).
2—e-trike units have features that have been available for a year already but still do not have any signs of updating their features.
3—e-trike units have updated features and updates features gradually.
4—e-trike units always have updated features and almost instantaneously update features.
Driver Characteristicsafety1—the e-trike driver does not follow traffic rules, and you feel unsafe while in the e-trike.
2—the driver follows traffic rules but drives recklessly.
3—the driver follows traffic rules but commits only minor mistakes on the road.
4—the driver follows the rules and drives pleasantly.
interest1—the driver does not mind customers at all and just accepts payments.
2—the driver only grants requests that require little to no effort.
3—the driver considers customers and grants requests.
4—the driver quickly recognizes customers’ needs and helps them right away.
trust1—staff have suspicious movements while in service, and you don’t feel safe.
2—staff do not have suspicious movements, but they don’t interact with customers to be trustworthy.
3—staff are trustworthy and give service with a smile.
4—staff is accommodating and very interactive with customers.
attitude1—drivers are not approachable and do not even talk to customers.
2—drivers are not approachable and show limited knowledge about e-trikes and their operations.
3—drivers show signs of knowledge with e-trike units, operations, and talk with customers.
4—drivers are knowledgeable about all aspects of operations and are always ready to help customers and answer their questions.
neatness1—drivers do not have uniforms and wear clothes that look dirty.
2—drivers have uniforms but look dirty.
3—drivers have clean-looking shirts only as uniforms.
4—drivers have a standard look with their uniforms, including pants and shoes.
friendliness1—drivers are not friendly even with other drivers/staff.
2—drivers are friendly to other staff only.
3—drivers are friendly and greet customers regularly.
4—drivers are very friendly to customers and other staff.
attention1—drivers do not pay attention to customers at all.
2—drivers have a minimal attention span to one customer.
3—driver listens to customers with enough attention span.
4—driver gives full attention to a single customer at a time and ensures that he satisfies your needs.
skills1—e-trike drivers cannot answer any e-trike-related questions.
2—e-trike drivers only know their daily operations of e-trikes but have almost no knowledge of the unit itself.
3—e-trike drivers know only the significant parts of the operations and the units.
4—the drivers are knowledgeable of everything in operations and e-trike units.
sympathy1—e-trike drivers are apathetic; they do not show any care for customers.
2—e-trike drivers consider only caring for customers with minimal needs.
3—e-trike drivers are sympathetic and reassuring but need to be notified of problems.
4—e-trike drivers are sympathetic enough to assess the situation right away when they see a customer in need; they give you a sense of reassurance that the problem will be fixed.
helpfulness1—e-trike driver does not intend to leave his seat to help customers at all.
2—e-trike driver just helps with minimal effort and does not look like he’s willing to help.
3—e-trike driver is willing to help customers upon requests.
4—e-trike drivers are willing to help right away when they see a customer in need.
Table 7. Summary response to service quality survey.
FactorsVariablesMinMaxMeanStd. Dev.
OperationsConvenient schedule of e-trike services142.880.689
Customers should feel secure while traveling with e-trike143.120.746
Physical DesignE-trike units have a good appearance in design1430.782
E-trike units are very comfortable for customers143.040.880
E-trike units have enough seats for the stated capacity142.60.833
Physical facilities of the e-trike operations are clean142.780.864
Ticket booths are located in an easy-access place142.060.740
E-trike units are well ventilated for customers243.20.728
E-trike units are always updated technologically142.180.748
DriversE-trike drivers are driving in a pleasant and safe manner142.30.735
The e-trike drivers have their customers’ best interests at heart142.140.700
E-trike operations staff (drivers/and other employees) are trustworthy142.640.693
E-trike drivers are dependable142.240.657
E-trike drivers appear neat243.220.648
E-trike drivers are very friendly142.440.705
E-trike drivers give each customer individual attention1420.728
Table 8. Summary data for indicators for public transport sustainability.
FactorsIndicatorsMinMaxMeanStd. Dev.
Socialservice frequency131.960.638
ease of availability131.760.657
intensity of e-trike132.560.577
average waiting time for e-trike arrivals131.460.579
travel time ratio243.140.7
presence of organized public transport343.60.495
passenger comfort load factor243.440.577
headway regularity in peak hours as per schedule131.720.607
the smoothness of e-trike ride343.740.443
accessibility of e- trike243.180.661
% of accidents involving e-trike for the last year121.20.404
accessibility of physically disabled121.340.479
social priority121.140.351
signal priority121.160.37
Economicthe ratio of public transport expense versus private transport expense131.60.7
% of commuters benefiting from discounted fares131.80.639
fare affordability142.480.677
staff/e-trike ratio121.320.471
operating ratio243.040.638
the modal share of e-trike121.220.418
fare acceptability243.480.614
Environmentalland use132.020.622
pollution343.80.404
energy consumption243.620.53
noise levels343.70.463
Table 9. Regression analysis of sustainability indicators associated with service quality.
TermCoefSE CoefT-Valuep-ValueVIF
Constant1.9100.26818.310.000
Ease of availability0.03170.01482.140.0331.50
Intensity of e-trike0.04200.01782.370.0191.66
Comfort load0.07230.01813.990.0001.74
Smoothness of ride0.10010.02563.900.0002.10
Accessibility of PWD0.21280.019510.940.0001.43
Discounted rates0.08860.01515.860.0001.51
Fare affordability0.03390.01662.030.0432.00
Fare acceptability0.05770.01793.220.0012.13
Land use0.08350.01744.810.0001.86
Noise level0.08860.01984.480.0001.38
Publisher’s Note: MDPI stays neutral with regard to jurisdictional claims in published maps and institutional affiliations.

