Article

The Use of Envi-Met for the Assessment of Nature-Based Solutions’ Potential Benefits in Industrial Parks—A Case Study of Argales Industrial Park (Valladolid, Spain)

by
Felipe Macedo Alves
1,
Artur Gonçalves
1,* and
M. Rosario del Caz-Enjuto
2
1
Centro de Investigação de Montanha, Instituto Politécnico de Bragança, 5300-253 Bragança, Portugal
2
Departamento de Urbanismo y Representación de la Arquitectura, University of Valladolid, 47002 Valladolid, Spain
*
Author to whom correspondence should be addressed.
Infrastructures 2022, 7(6), 85; https://doi.org/10.3390/infrastructures7060085
Submission received: 1 May 2022 / Revised: 8 June 2022 / Accepted: 9 June 2022 / Published: 16 June 2022

Abstract

:
Urbanization causes major changes in environmental systems, including those related with radiation balances and other meteorological conditions because of changes in surfaces and the physical environment. In addition, cities generate specific microclimates as a consequence of the diverse conditions within the urban fabric. Industrial parks represent vast urban areas, often neglected, contributing to the degradation of the urban environment, including poor thermal comfort as a result of soil sealing and low albedo surfaces. Nature-Based Solutions (NBS) can promote the mitigation of the anthropic effects of urbanization using nature as an inspiration. The present study, aimed at estimating the microclimate conditions in a fraction of the Argales industrial park in the city of Valladolid (Spain), with the use of the ENVI-Met software, assesses the current situation and a planned NBS scenario. Base scenario simulation results demonstrate different conditions across the simulations, with higher temperatures on sun-exposed surfaces with low albedo, and lower temperature spots, mostly associated with shadowed areas near existent buildings. After the simulation of the NBS scenario, the results show that, when compared with the base scenario, the projected air temperature changes reach reductions of up to 4.30 °C for the locations where changes are projected from impervious low albedo surfaces to shaded areas in the vicinity of trees and a water body.

1. Introduction

Climate is one of the factors responsible for variations in landscapes, biological diversity, construction methods and typologies, as well as human habits and customs [1]. The relationship of society with its environment can be analyzed by the architecture of the place, which is, in many cases, related to the climatic and geographical environment [2]. In other words, the balance between humans and their habitat, as well as their harmony and adaptation to the environment through social and cultural expressions, is present across generations [3].
Understanding the urban climate is paramount for the development of design solutions to improve local conditions [4], as it should be considered in city planning and in promoting comfortable, salubrious and low-energy-consuming environments [5]. This idea, associated with that of Oke, Mills and Christen [6], correlates humans and vegetation with urban variables that must be considered in the study of urban climate, such as climate scales, physical and physiological bases, solar radiation, wind, humidity and topography [7].
Decades of research demonstrate that cities are almost always warmer than their surroundings because of the phenomenon known as the urban heat island (UHI) [6,8,9,10]. Assessments of differences in temperature between urban and rural areas contribute to analyses of UHI intensity. Such differences can be attributed to differential heating (from sunrise to sunset) and cooling (from sunset to sunrise) in urban areas [11,12].
The combination of climate change with the aggravated effects of the UHI can be seen as a determining context that should trigger change, thus fostering the implementation of measures that can help to attenuate air temperature in cities [13,14]. Climate change adaptation measures should help to alleviate effects on thermal comfort through adequate urban design policies [15].
In the development of urban sustainable solutions, it is necessary to plan projects that can promote urban transformation, seeking to make urban areas more pleasant to its users [16]. In this context, solutions that seek to mitigate anthropic effects while being inspired in nature are called Nature-Based Solutions (NBSs), and they incorporate natural elements into urban structures and have the premise of regenerating landscapes altered by humans [17,18,19]. Some examples of NBS are linear parks built around water bodies, such as rivers and streams, creating green corridors along their paths. These can integrate other solutions, consequently bringing synergy to already installed alternatives [20]. Green roofs and walls can also reduce temperatures and increase energy savings [21].
In 2021, the European Union developed a common manual for evaluating the impacts of NBS [16,22], which aims to provide professionals with a comprehensive framework for evaluations and a robust set of indicators and methodologies to assess them in 12 social challenges (Climate Resilience; Water Management; Natural and Climate Hazards; Green Space Management; Biodiversity; Air Quality; Place Regeneration; Knowledge and Social Capacity Building for Sustainable Urban Transformation; Participatory Planning and Governance; Social Justice and Social Cohesion; Health and Well-being; and New Economic Opportunities and Green Jobs). Nonetheless, the multiple benefits of NBS vary according to each alternative, as do their costs and benefits, which must be analyzed individually for each case [16].
In recent years, several relevant projects have approached the introduction of NBS in urban environments, including the following H2020 projects: OPERANDUM, BiodivERsA, CLEARING HOUSE, CLEVER Cities and NATURVATION.
NBS can help respond to various urban challenges, including those presented by brownfields, climate change, urban decay and infrastructure degradation [17,19,23]. Industrial zones take part in the physical and anthropic evolution of the city, entailing interactions between the natural and built environment, which can sometimes lead to the degradation of natural ecosystems [19,24]. To avoid this process, the sustainable rehabilitation of industrial parks tries to improve these urban contexts, facing the endemic problems of these frequently highly artificial urban landscapes [25].
Natural phenomena are often very complex, which makes them difficult to study and understand. One way to address complexity is to apply analysis models that allow the understanding and anticipation of these phenomena, and such is the case of using climate models to assess the impact of urban morphological changes on local meteorological conditions [3,26]. Their projections and results give essential information for the improvement of management and decision making because they investigate the degree to which climate change derives from natural variability, human intervention or combinations thereof [27].
The modeling process requires a theoretical, comprehensive and specific study, with the collection of as much information as possible; therefore, the simulations are close to reality and thus can provide reliable information that can inform efficient decision making [13].
One of the most widely recognized software for urban climate modeling is ENVI-Met, a tridimensional model that simulates the interactions of the surface–vegetation–atmosphere and generates simulations for the microscale dimension [28]. This software allows the investigation and quantification of the effects of urban planning and architecture on outdoor microclimate through simulation [29].
Envi-Met is notable for its ability to model changes in solar radiation by building structures and elements in the surroundings of a given location [30]. This software also estimates the effects of vegetation, including the potential temperature of leaves, considering photosynthesis rates, soil moist content and local evaporation rates [31,32]. One of its main advantages is the fact that it reproduces the main atmospheric processes that affect microclimate, including wind, its turbulence, radiation fluxes, air temperature and relative humidity, using the fundamental laws of thermodynamics and fluids mechanics [33,34]. The simulations consider daily cycles in complex urban structures, including buildings and vegetation in numerous shapes and sizes, from a microclimate perspective [35,36].
ENVI-Met has been used in several studies to simulate near-ground air temperatures and to help understand the impact of the urban form on microclimate [37,38,39,40]. This software can be used to simulate scenarios, often testing the benefits of NBSs, and its outputs can be used as a reference for urban design, with the purpose of mitigating the effects of heat islands in urban areas, as well as improving the thermal comfort of users [41,42,43,44,45].
Thus, trying to approach the urban climate through simulation and focusing on the analysis of the public infrastructure in an industrial park, this study aims at estimating microclimate conditions in a section of the Industrial Park of Argales in Valladolid (Spain), assessing the potential benefits of the introduction of NBS and focusing on Climate Resilience, with the help of ENVI-Met Software. This study includes the definition of a base and an NBS scenario, with the definition of 3D models, followed by simulations for equivalent climate conditions.
The study is part of the POCTEP INDNATUR project, developed by a partnership led by the University of Valladolid, along with six other partners, including the Polytechnic Institute of Bragança. The main objective of the project is to promote the improvement of environmental conditions in industrial zones or parks through the implementation of Nature-Based Solutions.

2. Materials and Methods
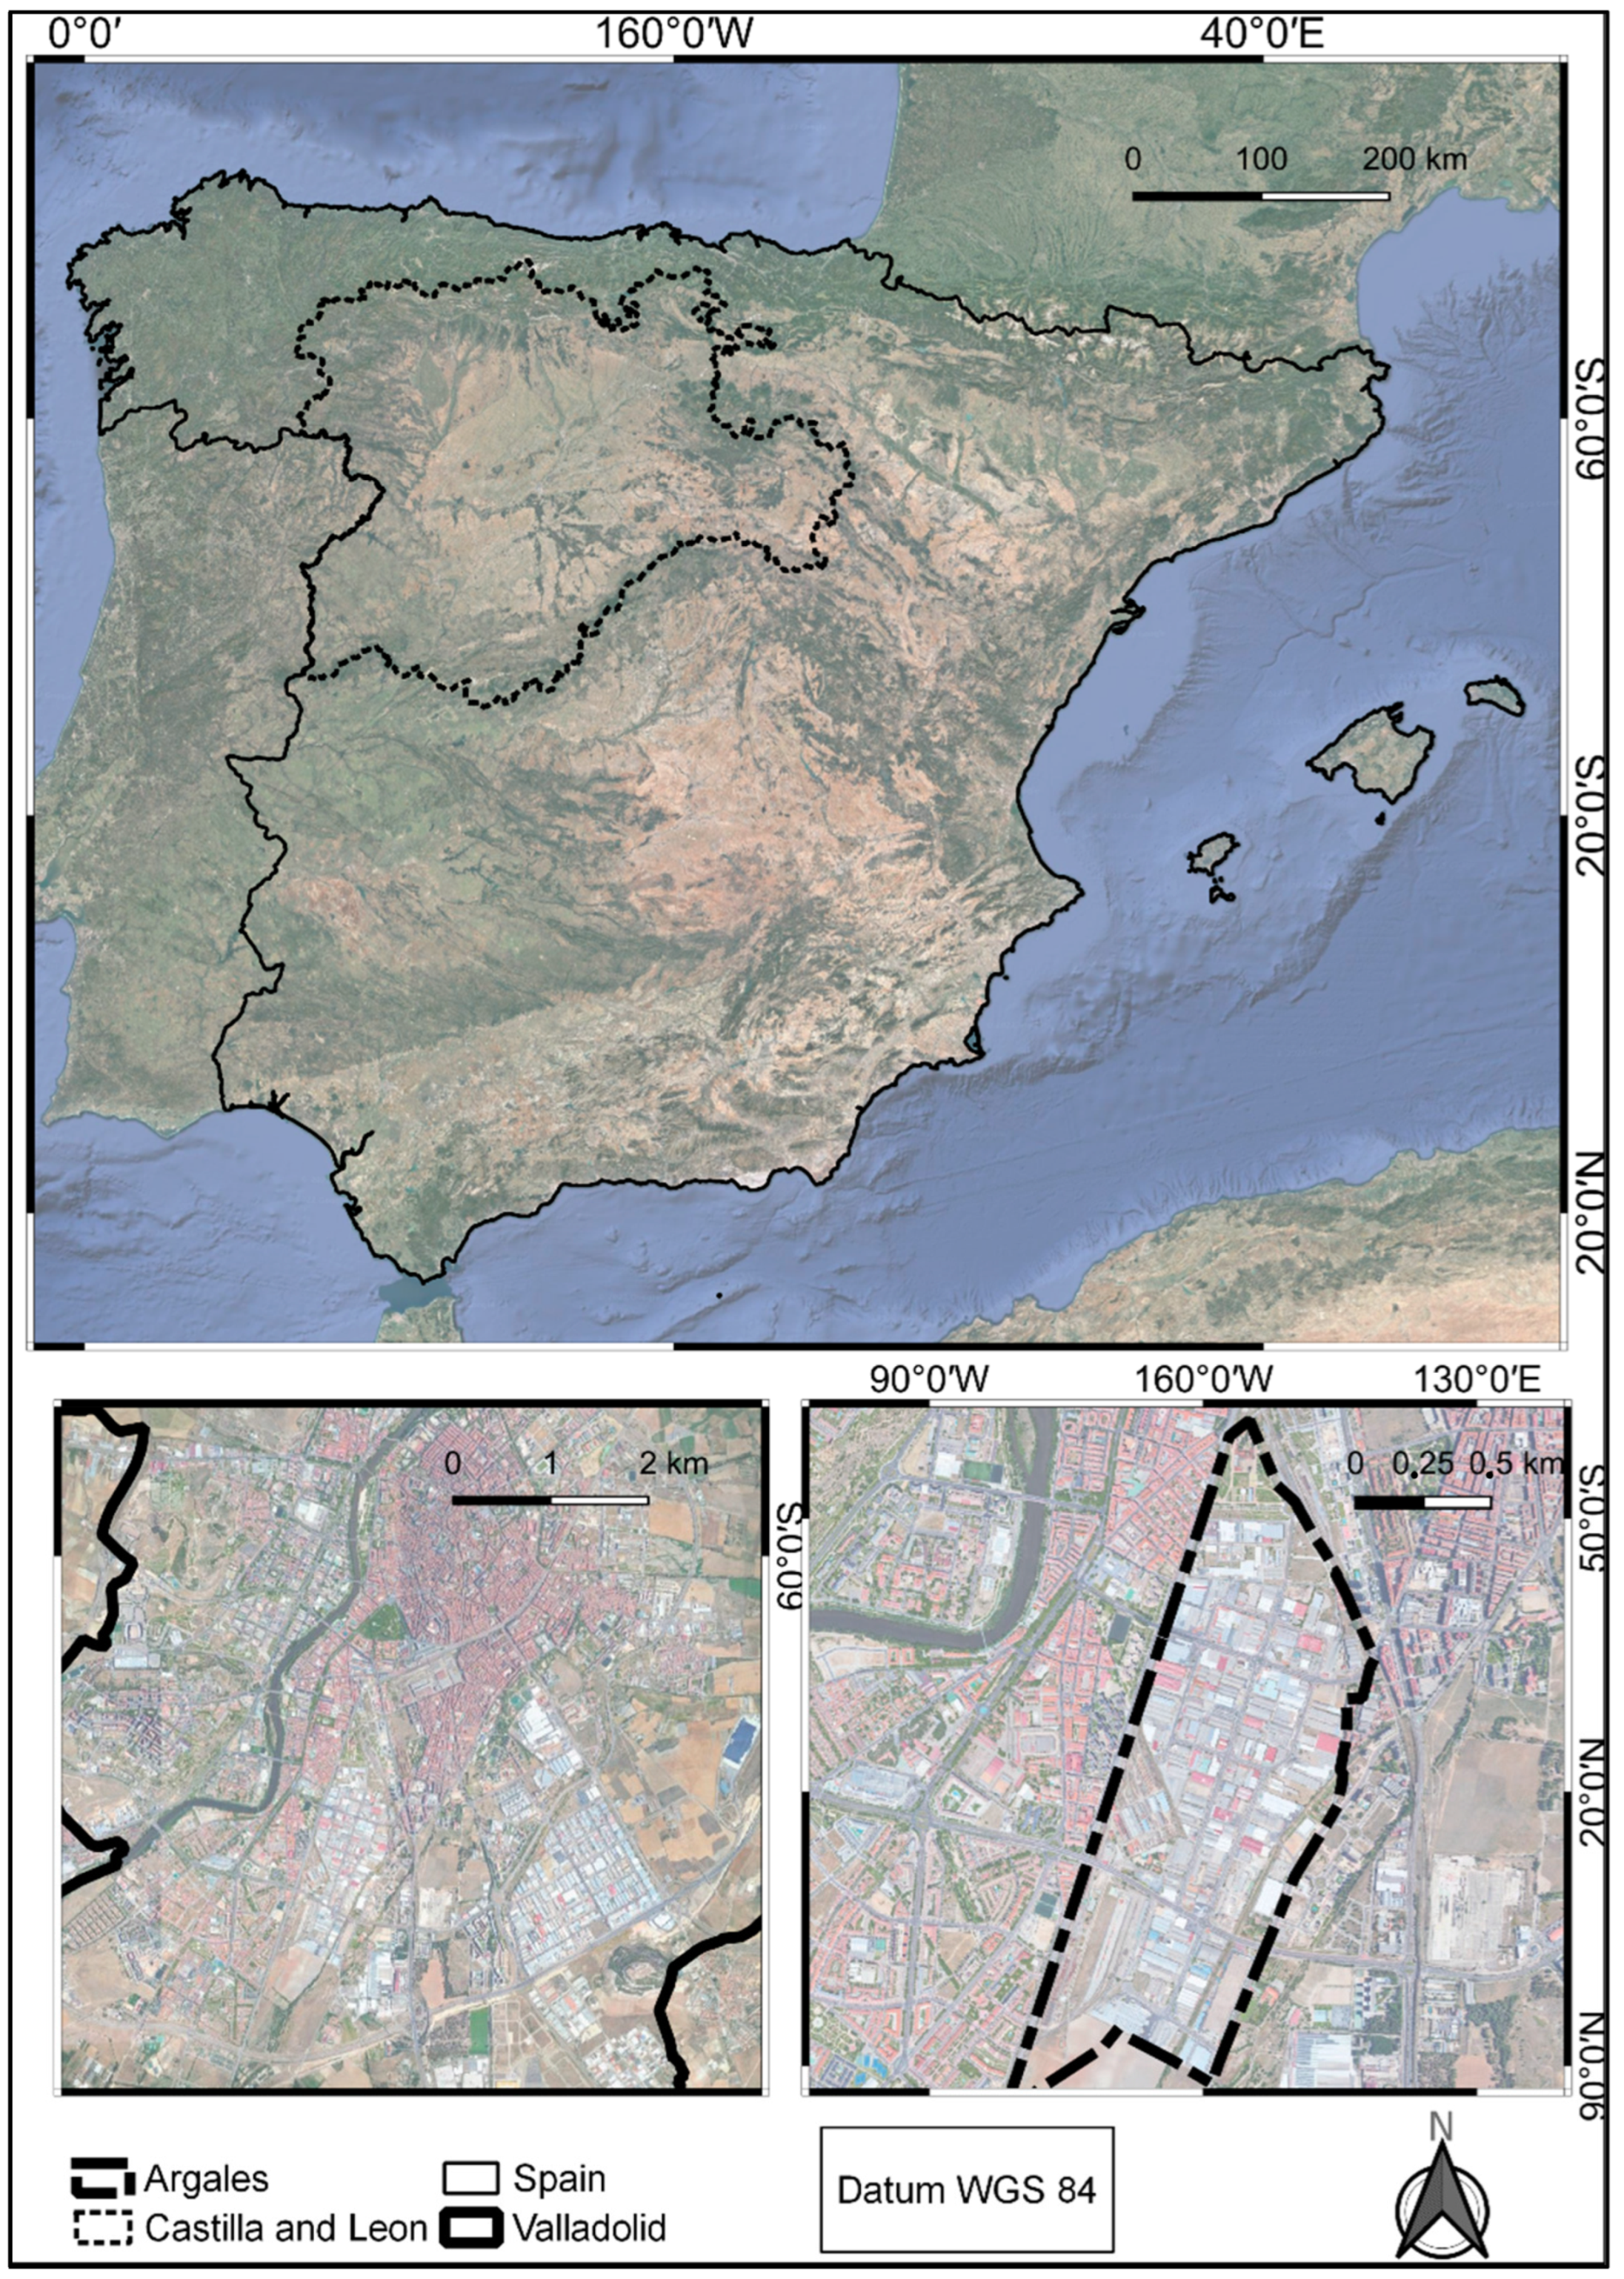
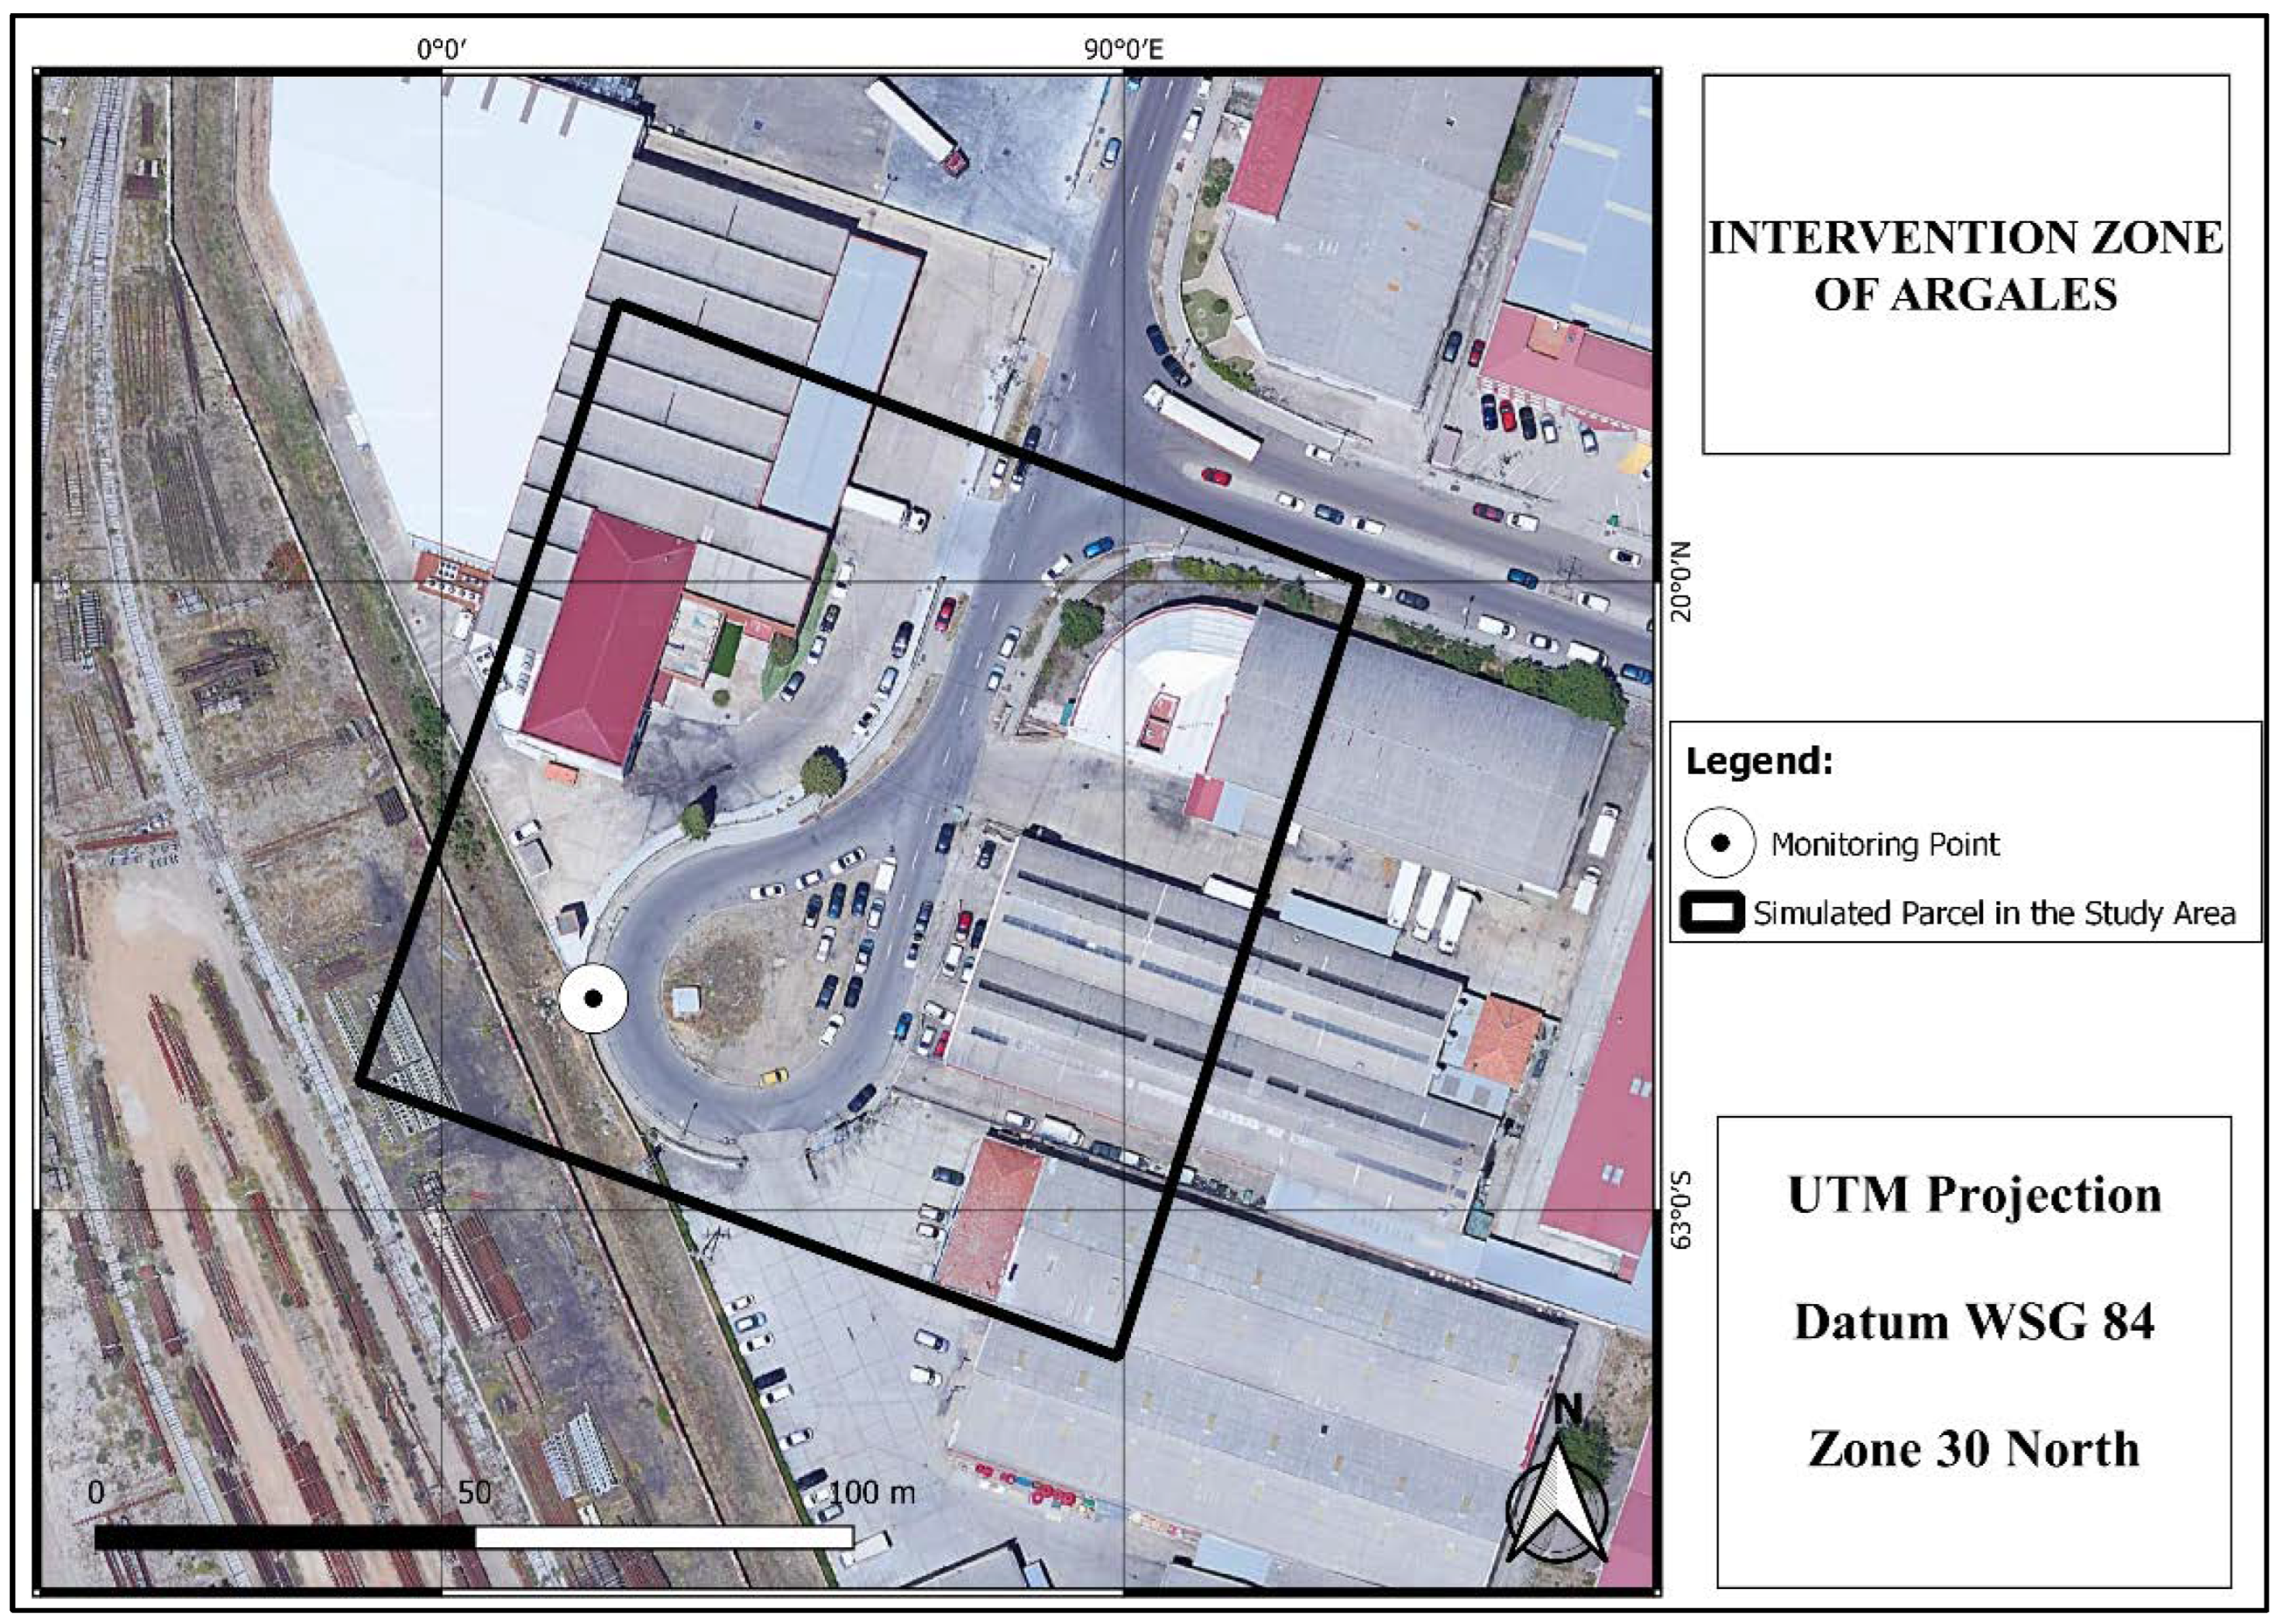
2.1. Study Area

This study takes place in Valladolid, the capital of the Spanish region of Castilla and Leon. It has approximately 300,000 inhabitants and covers over 200 km2 [46]. It has a diversified urban fabric [47], with industrial spaces close to the urban core, as is an industrial tradition [48]. The study area is located within the Argales Industrial Park (Figure 1), an area with a high concentration of industrial and commercial buildings, with vast impermeable areas and no public green spaces.
Valladolid has a Csa Climate by the Köppen–Geiger classification, which is a Mediterranean hot summer climate. This climate has moderate temperatures and changeable rainy weather during the winter. Summers are usually hot and dry.

2.2. Location of the Study Area
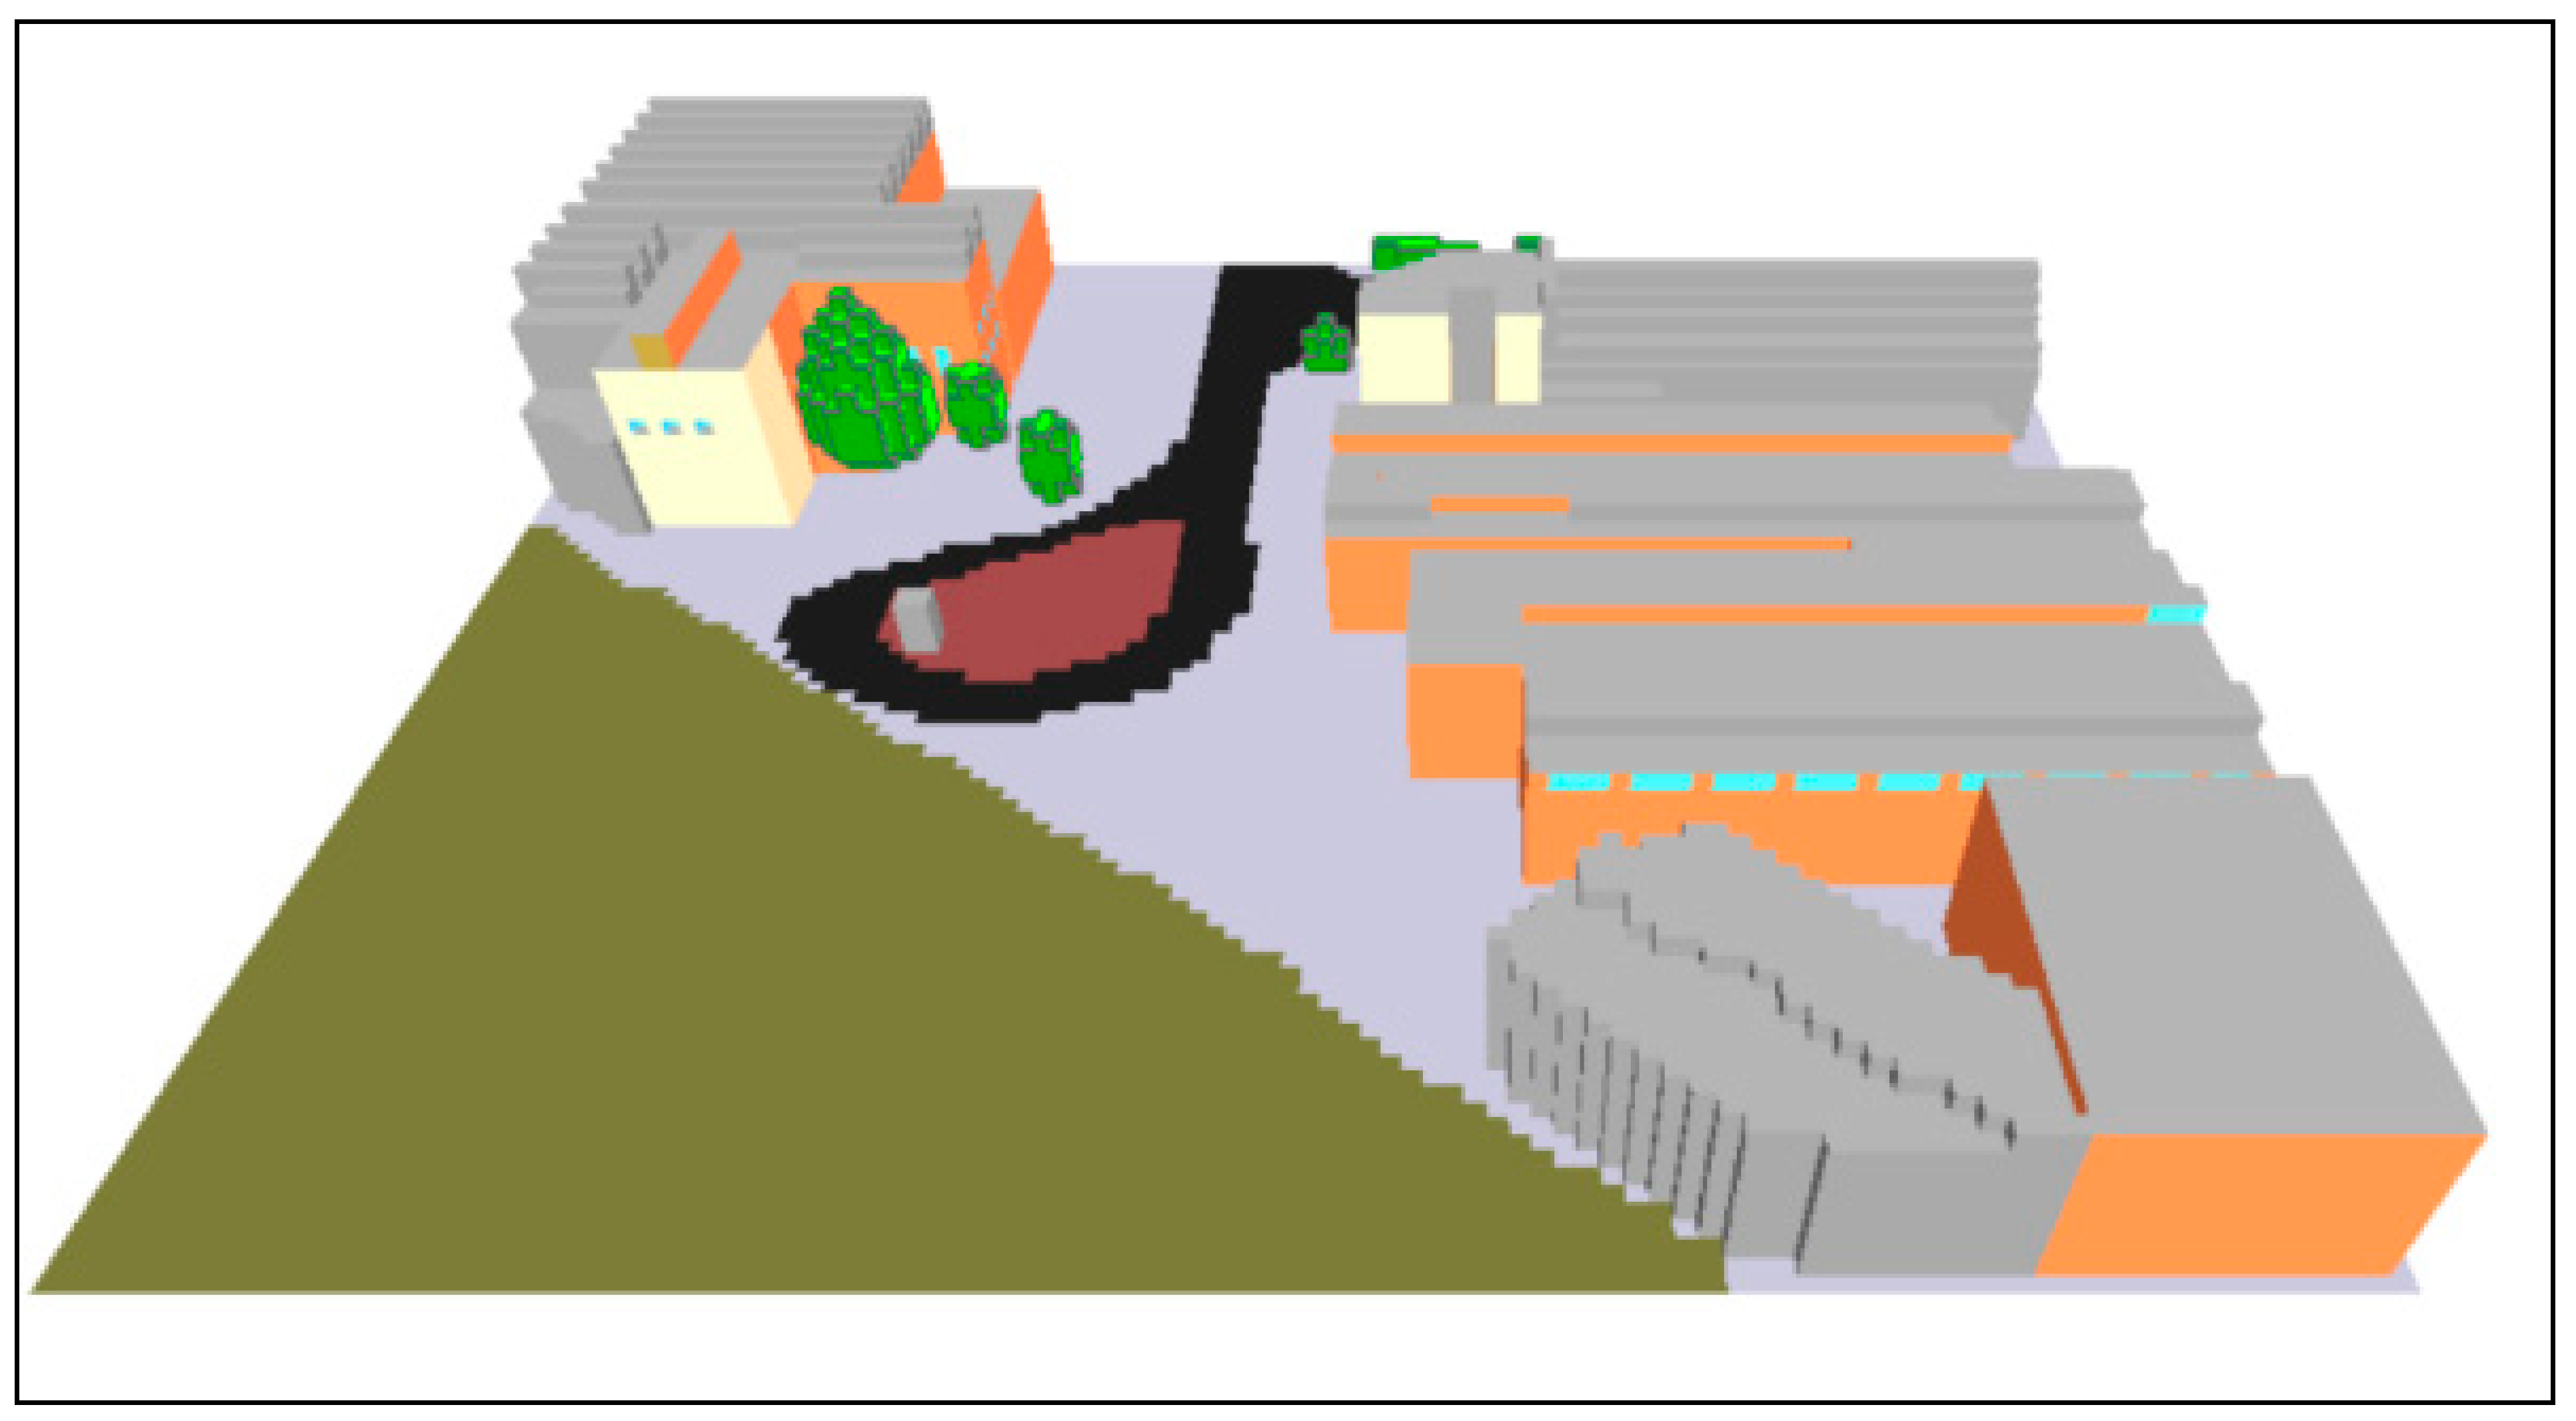
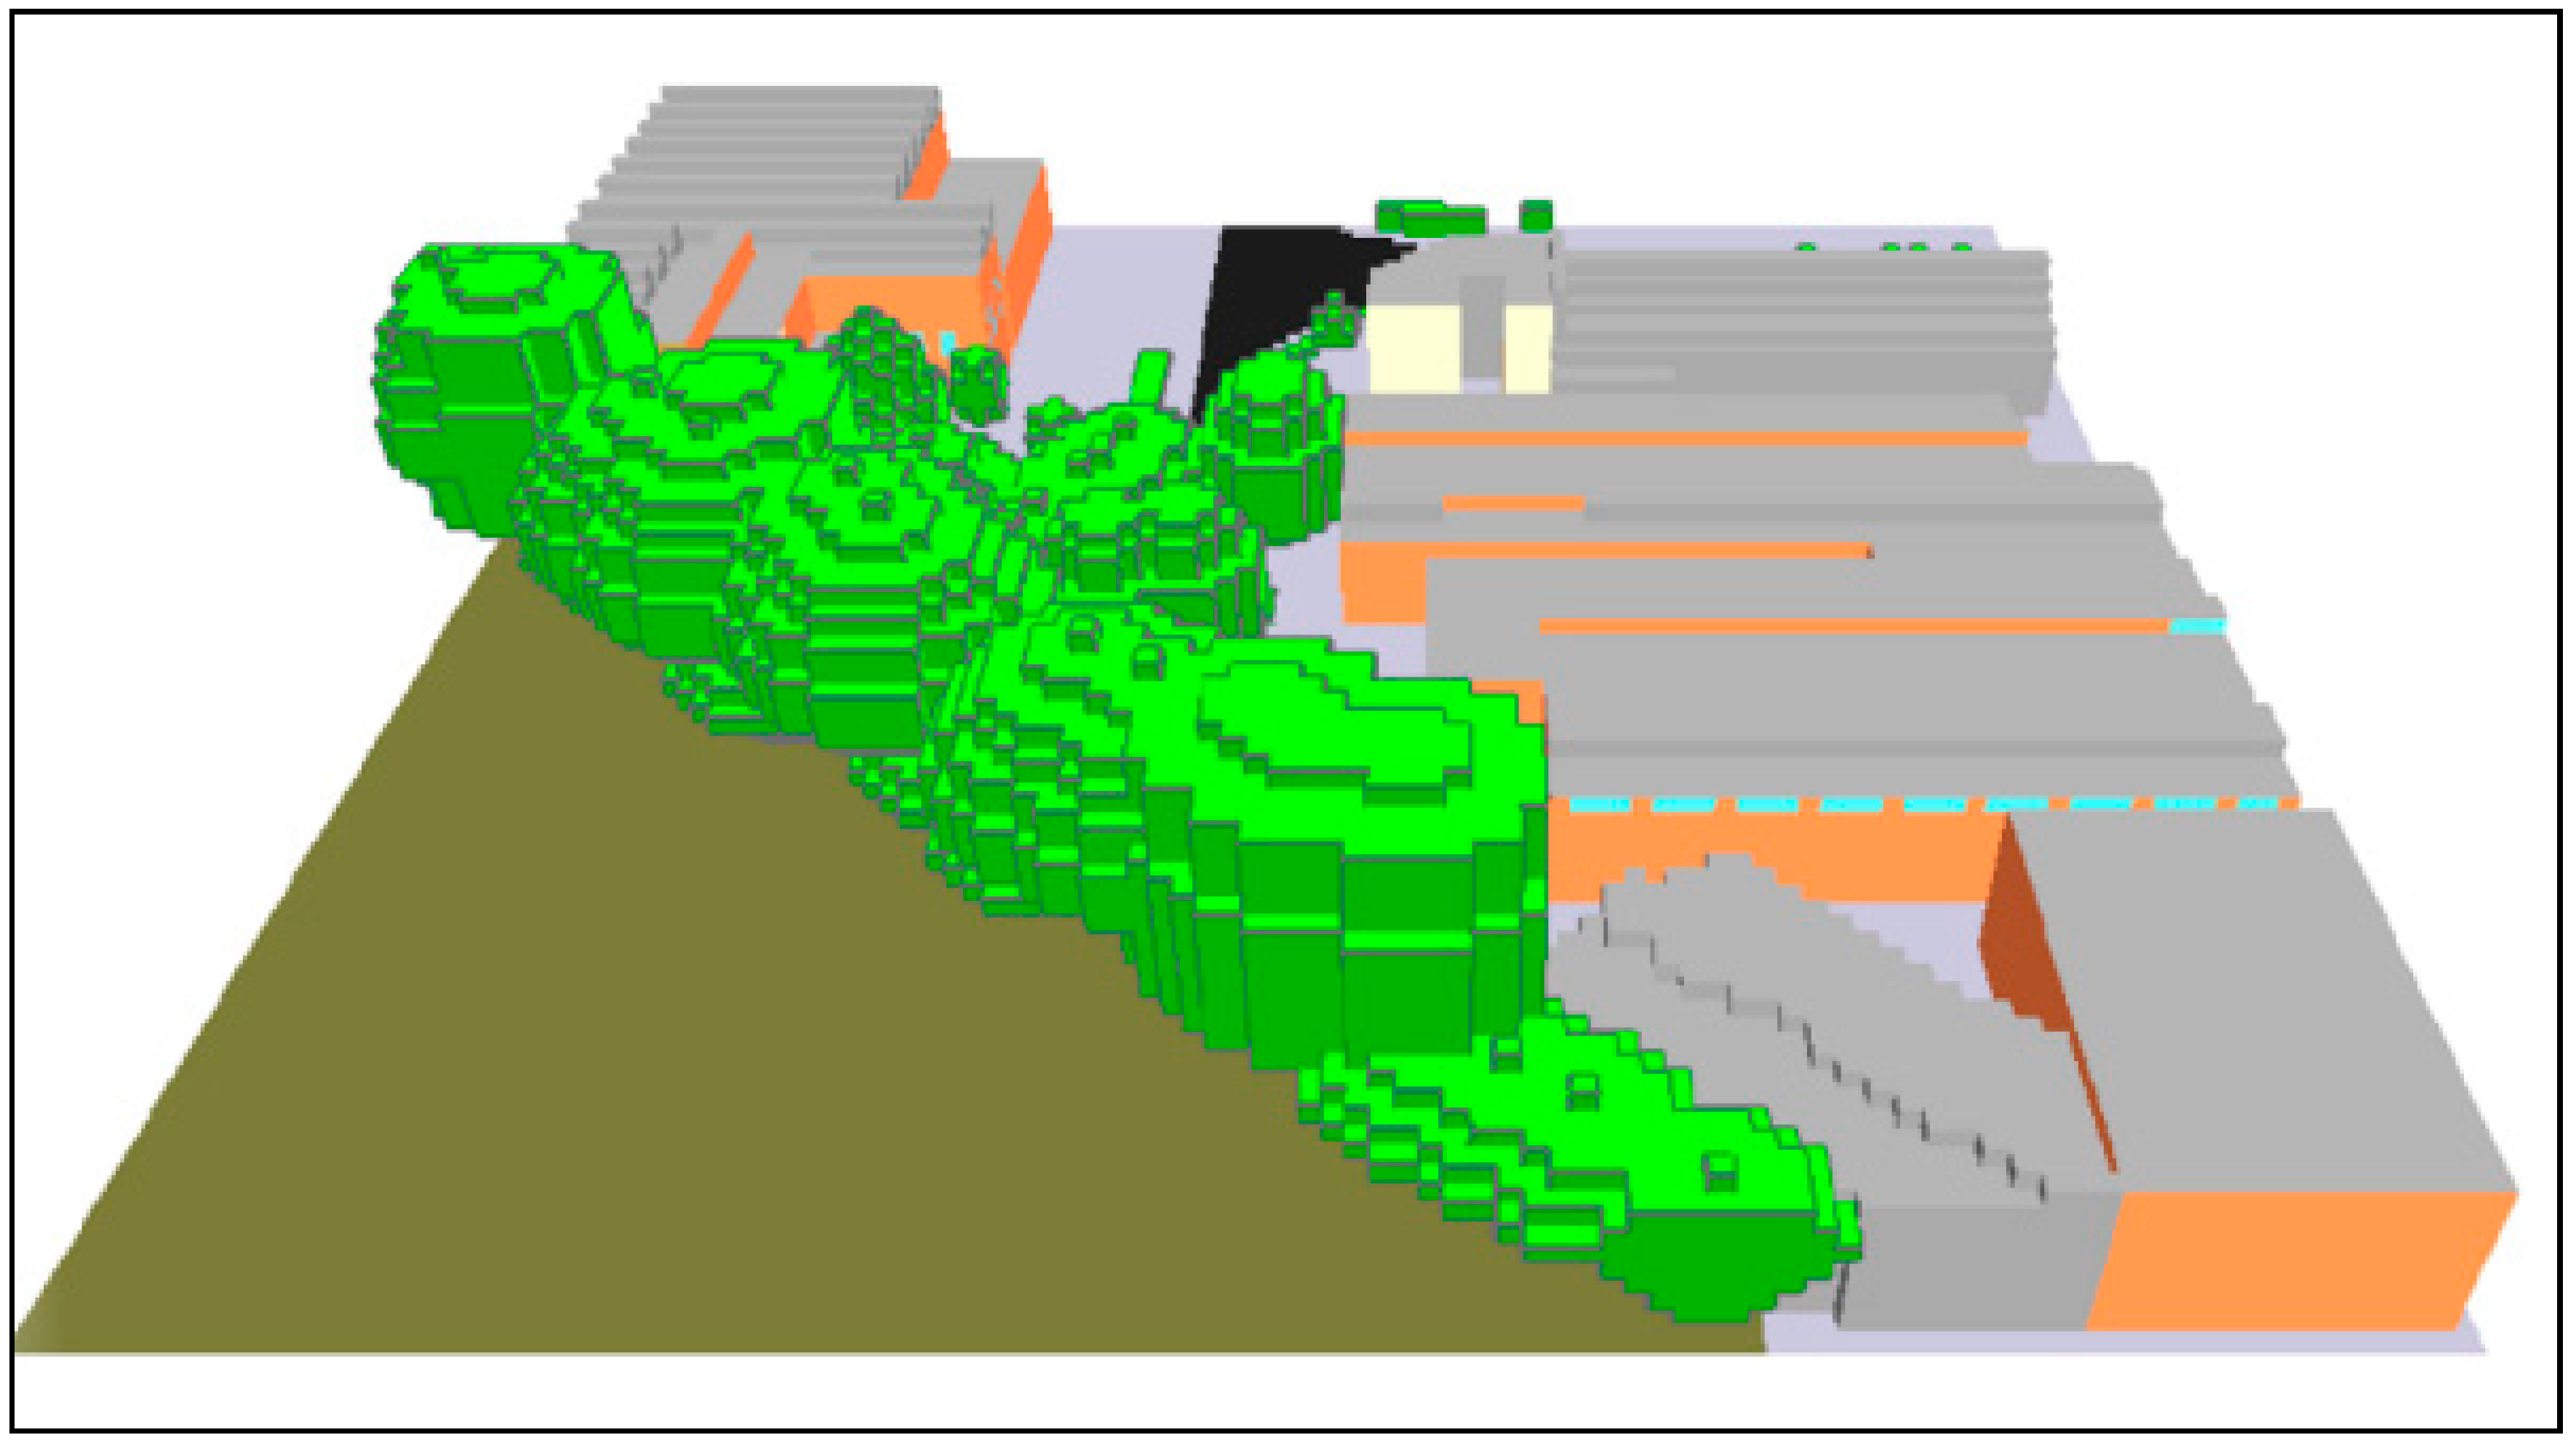
The size of the study area is one hectare (Figure 2) and is part of the urban redevelopment of the public road and sidewalk infrastructure by the European-funded INTERREG POCTEP INDNATUR project, including a comma-shaped roundabout, in a central area of the Argales Industrial Park near the Pilar Miró Roundabout. This area, until the fall of 2021, included a large open space with paved surfaces in streets and industrial building yards, including asphalt on roads and driveways, cement and stone on sidewalks and derelict land in the center of the roundabout. Buildings include commercial pavilions, with heights ranging from 1.8 m to 7.10 m. The southeast part of the simulation includes a fragment of a dry stream and large derelict land with railway tracks from a nearby train repair facility.

2.3. Modeling

For the modeling of the study area and simulation of microclimate conditions, the ENVI-Met Software was used. This software allows for investigating and quantifying the effects of architecture and urban planning on microclimate [37].
In the digitalization of the area to be modeled, a 1 m × 1 m × 1 m resolution was used, with a total of 100 × 100 × 30 grids. This resolution was chosen to provide a detailed representation of the area [49]. A grid was kept at the edge, avoiding instabilities in the modeling.
The model considers the interactions between three layers: the atmosphere, surface (including the various surface covers, buildings and vegetation) and soil [50]. Meteorological data for the model includes maximum and minimum values for air temperature and relative humidity as well as average wind speed and wind direction.
In this study, two scenarios were modeled. The first is a representation of the study area before any recent intervention, and the second incorporated Nature-Based Solutions, as part of the INDNATUR project. The scenarios are differentiated by the incorporation of vegetation in different strata while keeping the same characteristics of the urban geometry and artificial ground cover materials in other locations. The modeling materials used resemble those found in the study area, and they included: grass, asphalt, concrete pavement gray for sidewalks and clay and loam soil for exposed soil areas. For buildings, mostly concrete walls were used.
After integrating the 2D model inputs, ENVI-Met provides a 3D representation that allows the visual representation of the study area (Figure 3). With this 3D model validated, and considering the meteorological data input, ENVI-Met simulates the conditions for the given date and meteorological conditions.
Under the framework of the INDNATUR project, a new development was designed to contemplate a major NBS intervention in the study area, including the re-naturalization of the roundabout using vegetation and a water pond and changes in the sidewalks to incorporate porous surfaces and alignment trees. This new project should help to ameliorate the microclimate conditions.
For the NBS project, a new ENVI-Met scenario, designated the NBS scenario, was produced to contemplate the planned changes (Figure 4), considering that the elements were fully developed (adult trees). This new scenario was then modeled considering the same meteorological data and the same day of the year as the base scenario. Finally, these two scenarios were compared to assess the potential impact of the NBS on this case study location.
The location of the trees in the Pilar Miró street roundabout was limited by the existence of medium-voltage overhead powerlines, the traffic of heavy vehicles and the need for the proper operation of activities in the industrial area, as well as the existence of infrastructure incompatible with the roots of the trees (Appendix A) (Figure A1). For this location, a solution as natural as possible was designed, with a mixture of shrubby, perennia, and graminae species arranged in irregular groups of 5 to 7 units. In this location, the existence of the powerlines prevented the planting of very large trees. Acer campestre, deciduous trees, were planted on the outer edge of Pilar Miró street because they are close to the buildings.
Without facing limitations, the intervention on the dry bed of the Espanta stream included diverse varieties and sizes of evergreen and deciduous trees, which were planted to promote an increase in biodiversity while ensuring a high level of shadows on the nearby sidewalk.
The trees added in the model were consistent with the planted species, and they include Acer campestre, Cupressus stricta, Eleagnus angustifolia, Populus nigra, Prunus avium, Rhus typhina and Sorbus aucuparia. For grass species, the following were considered: Calamagrostis acutiflora, Centranthus ruber, Cistus albidus, Cistus salvifolius, Euphorbia characias, Gaura lindheimeri, Lippia nodiflora, Lygeum spartum, Nepeta faassenii, Perovskia atripcifolia, Pistacia lentiscus, Rubus Betty Ashburner, Salix purpurea Nana, Teucrium fruticans and Verbena banariensis. A choice was made for the NBS scenario by assuming that trees and grass have the maximum vegetative development.
All planted species were adapted to local climatic conditions and did not present any phytosanitary problems, as they are considered suitable for easy maintenance solutions with low maintenance costs.

2.4. Microclimatic Computer Simulation

The microclimatic computer simulation of the urban environment consists of a simplification of real scenarios that intends to represent the characteristics of the elements that constitute the space [29]; however, it is not a complete representation of the real world because it does not reproduce all its complexity.
This research studies the intra-urban layer by simulating building–urban environment interactions. For this purpose, the simple forcing method was used by considering on-site data collection, including wind speed and direction, air temperature and minimum and maximum relative humidity for the simulated day. With this information, the software simulates the behavior of the climatic parameters for a whole day [51].

2.5. Model Input Data

For an adequate representation of the local environment, it was necessary to collect data to be incorporated into the ENVI-Met simulation. Local spatial data were collected by QGIS 3.10.3 image interpretations of orthophotography and Google Earth, with the identification of land cover and building materials, along with measurements of the height of existing buildings and structures. These features were then validated by fieldwork using laser measurement equipment (STABILA LD 500, Annweiler, Germany). Vegetation data included tree species identification and 3D configuration. Variables such as canopy height and diameter were collected using a telescopic ruler. Surface materials were characterized by local interpretation with the identification of dominant colors and materials.
The computer simulation was performed according to the meteorological data collection period (23–24 June 2021) using two data collection systems: one was fixed (EF), used to collect the air temperature and relative humidity data; and one was mobile, used to collect the average radiant temperature and wind speed data.
The fixed station (FS) has compact data acquisition systems (“mini dataloggers”) with air temperature and relative humidity sensors (Gemini Data Loggers, model Tinytag TGP-4500, Chichester, West Sussex, UK). These systems were placed in shelters that protect them from radiation, at a height of 2.5 to 3 m from ground level, facing south so as not to suffer shading from the fixing pole. Their shelters are painted white to reduce the heating effects of the shelters. The mobile station, on the other hand, is a thermal microclimate data logging station—Delta Ohm 32.3, a multifunctional instrument that measures environmental conditions.
The simulated time is equivalent to a little more than a day, with a total of 29 h. Thus, the analyzed data start on 23 June 2021 at 6 h and end on 24 June 2021 at 18 h. Data collected locally were used to define the parameters for the ENVI-Met simulation (Table 1).

3. Results and Discussion

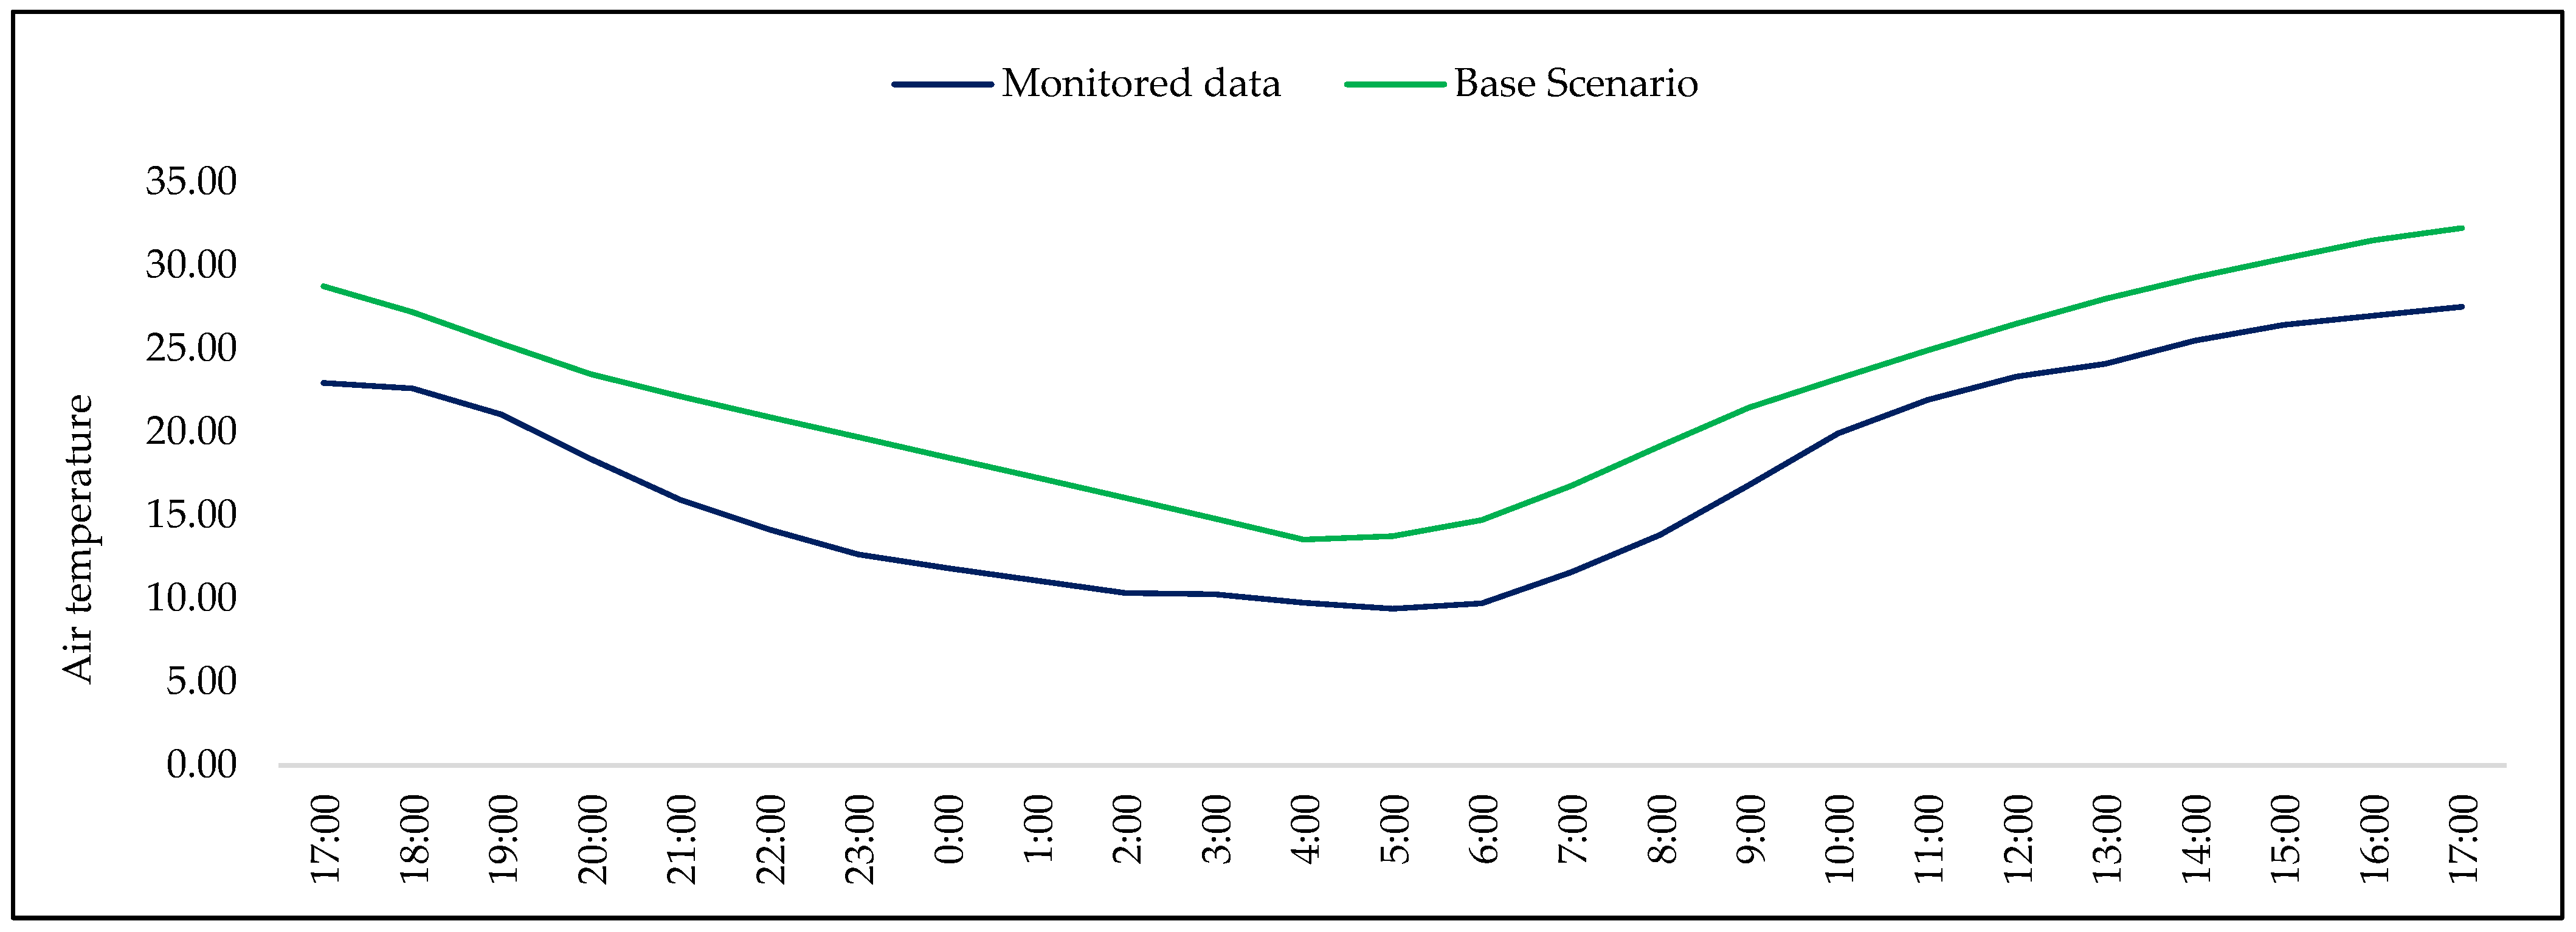
3.1. Microclimate Data Validation

3.1.1. Air Temperature

The microclimatic monitoring provided the air temperature profile over a 24 h campaign (Figure 5). These data were used as input to perform the simulations for both the base and the NBS scenario. The results show that data from the simulation overestimate the air temperature when compared to local measurements, and this difference can be justified by the use of the simple forcing method, in which the program forces the behavior of the climatic parameters during the day across the simulation area, not only including the data collection location, based on their maximum and minimum values used for the simulation input [52,53]. Nonetheless, the data follow a similar profile to the Pearson correlation between the two datasets, which is strong (0.777).

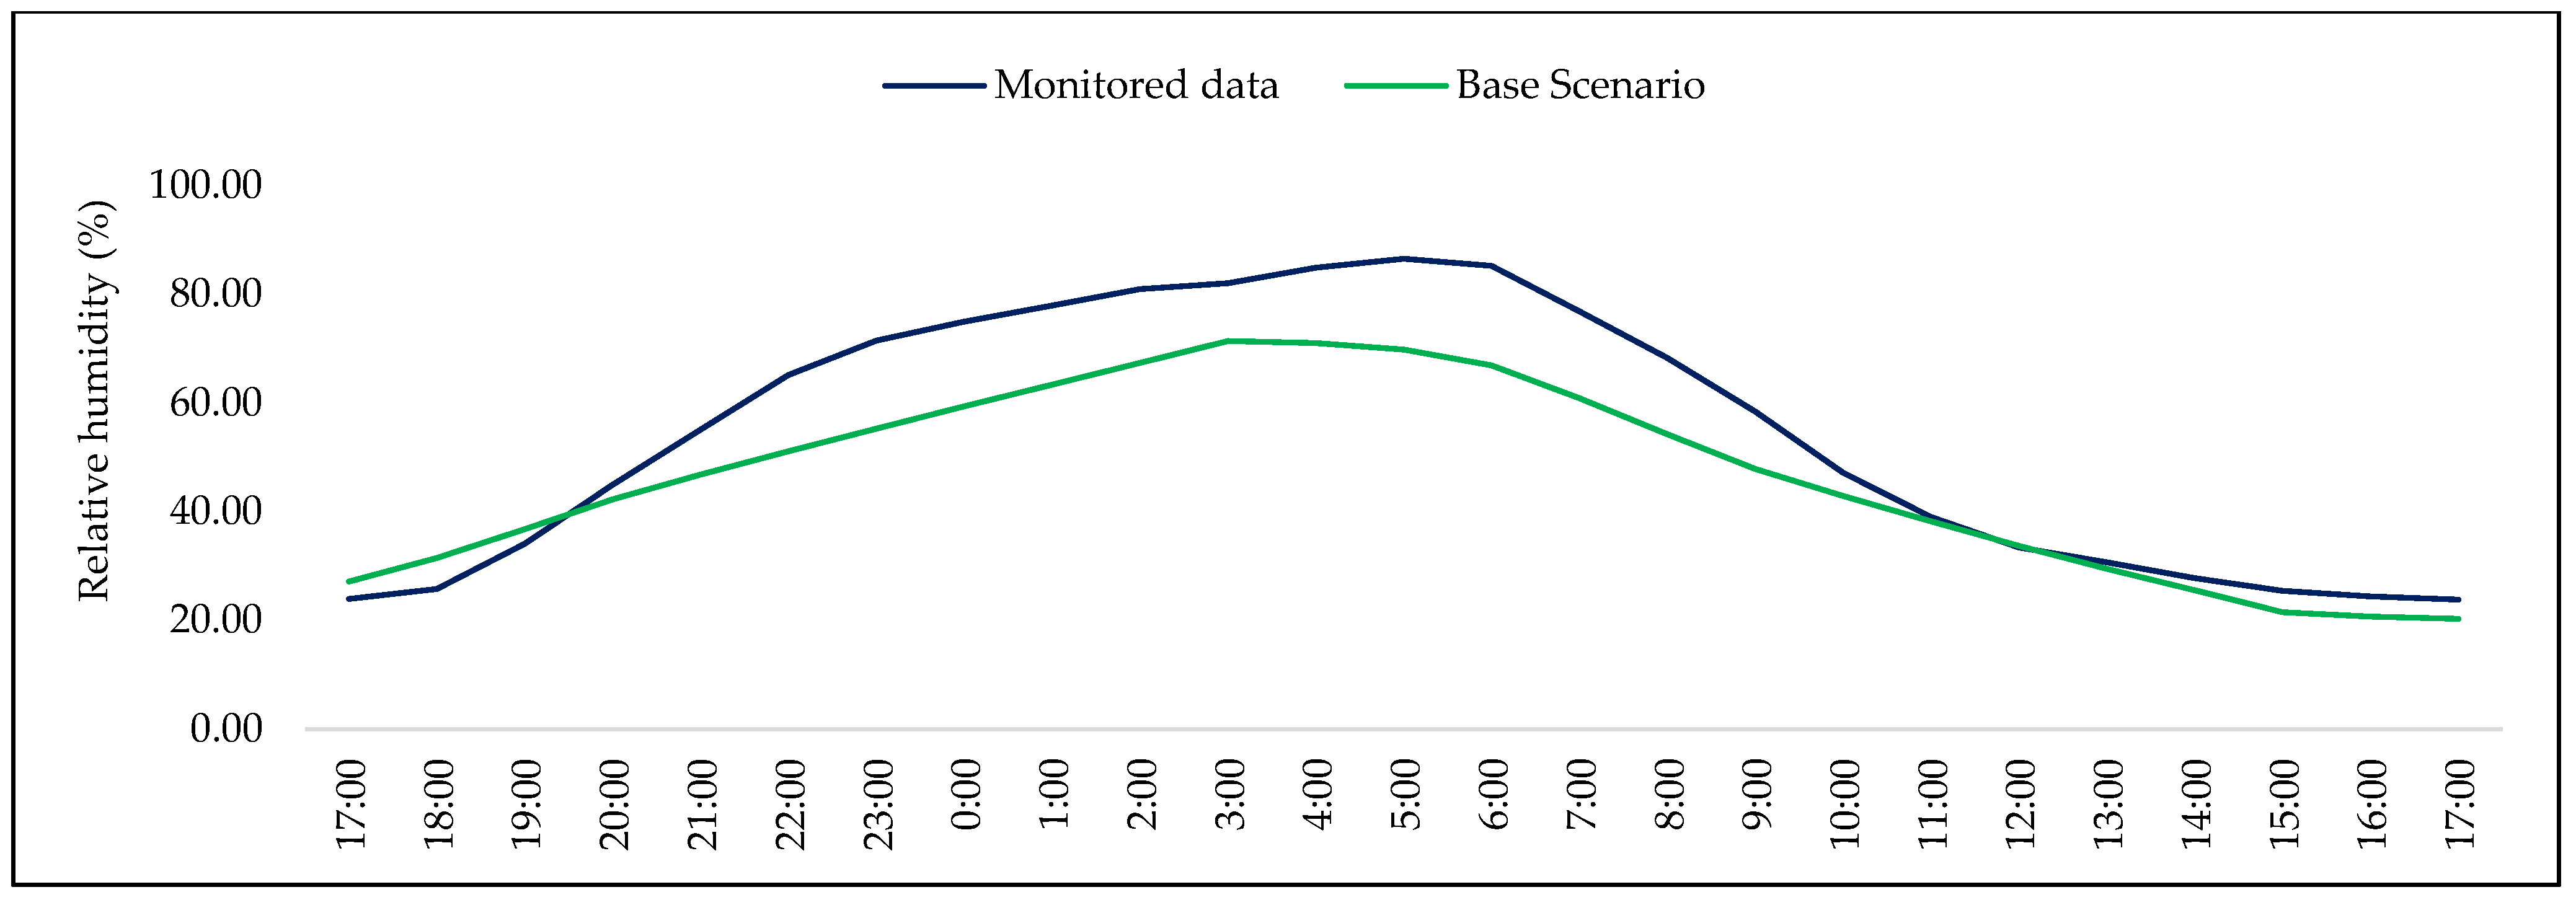
3.1.2. Relative Humidity
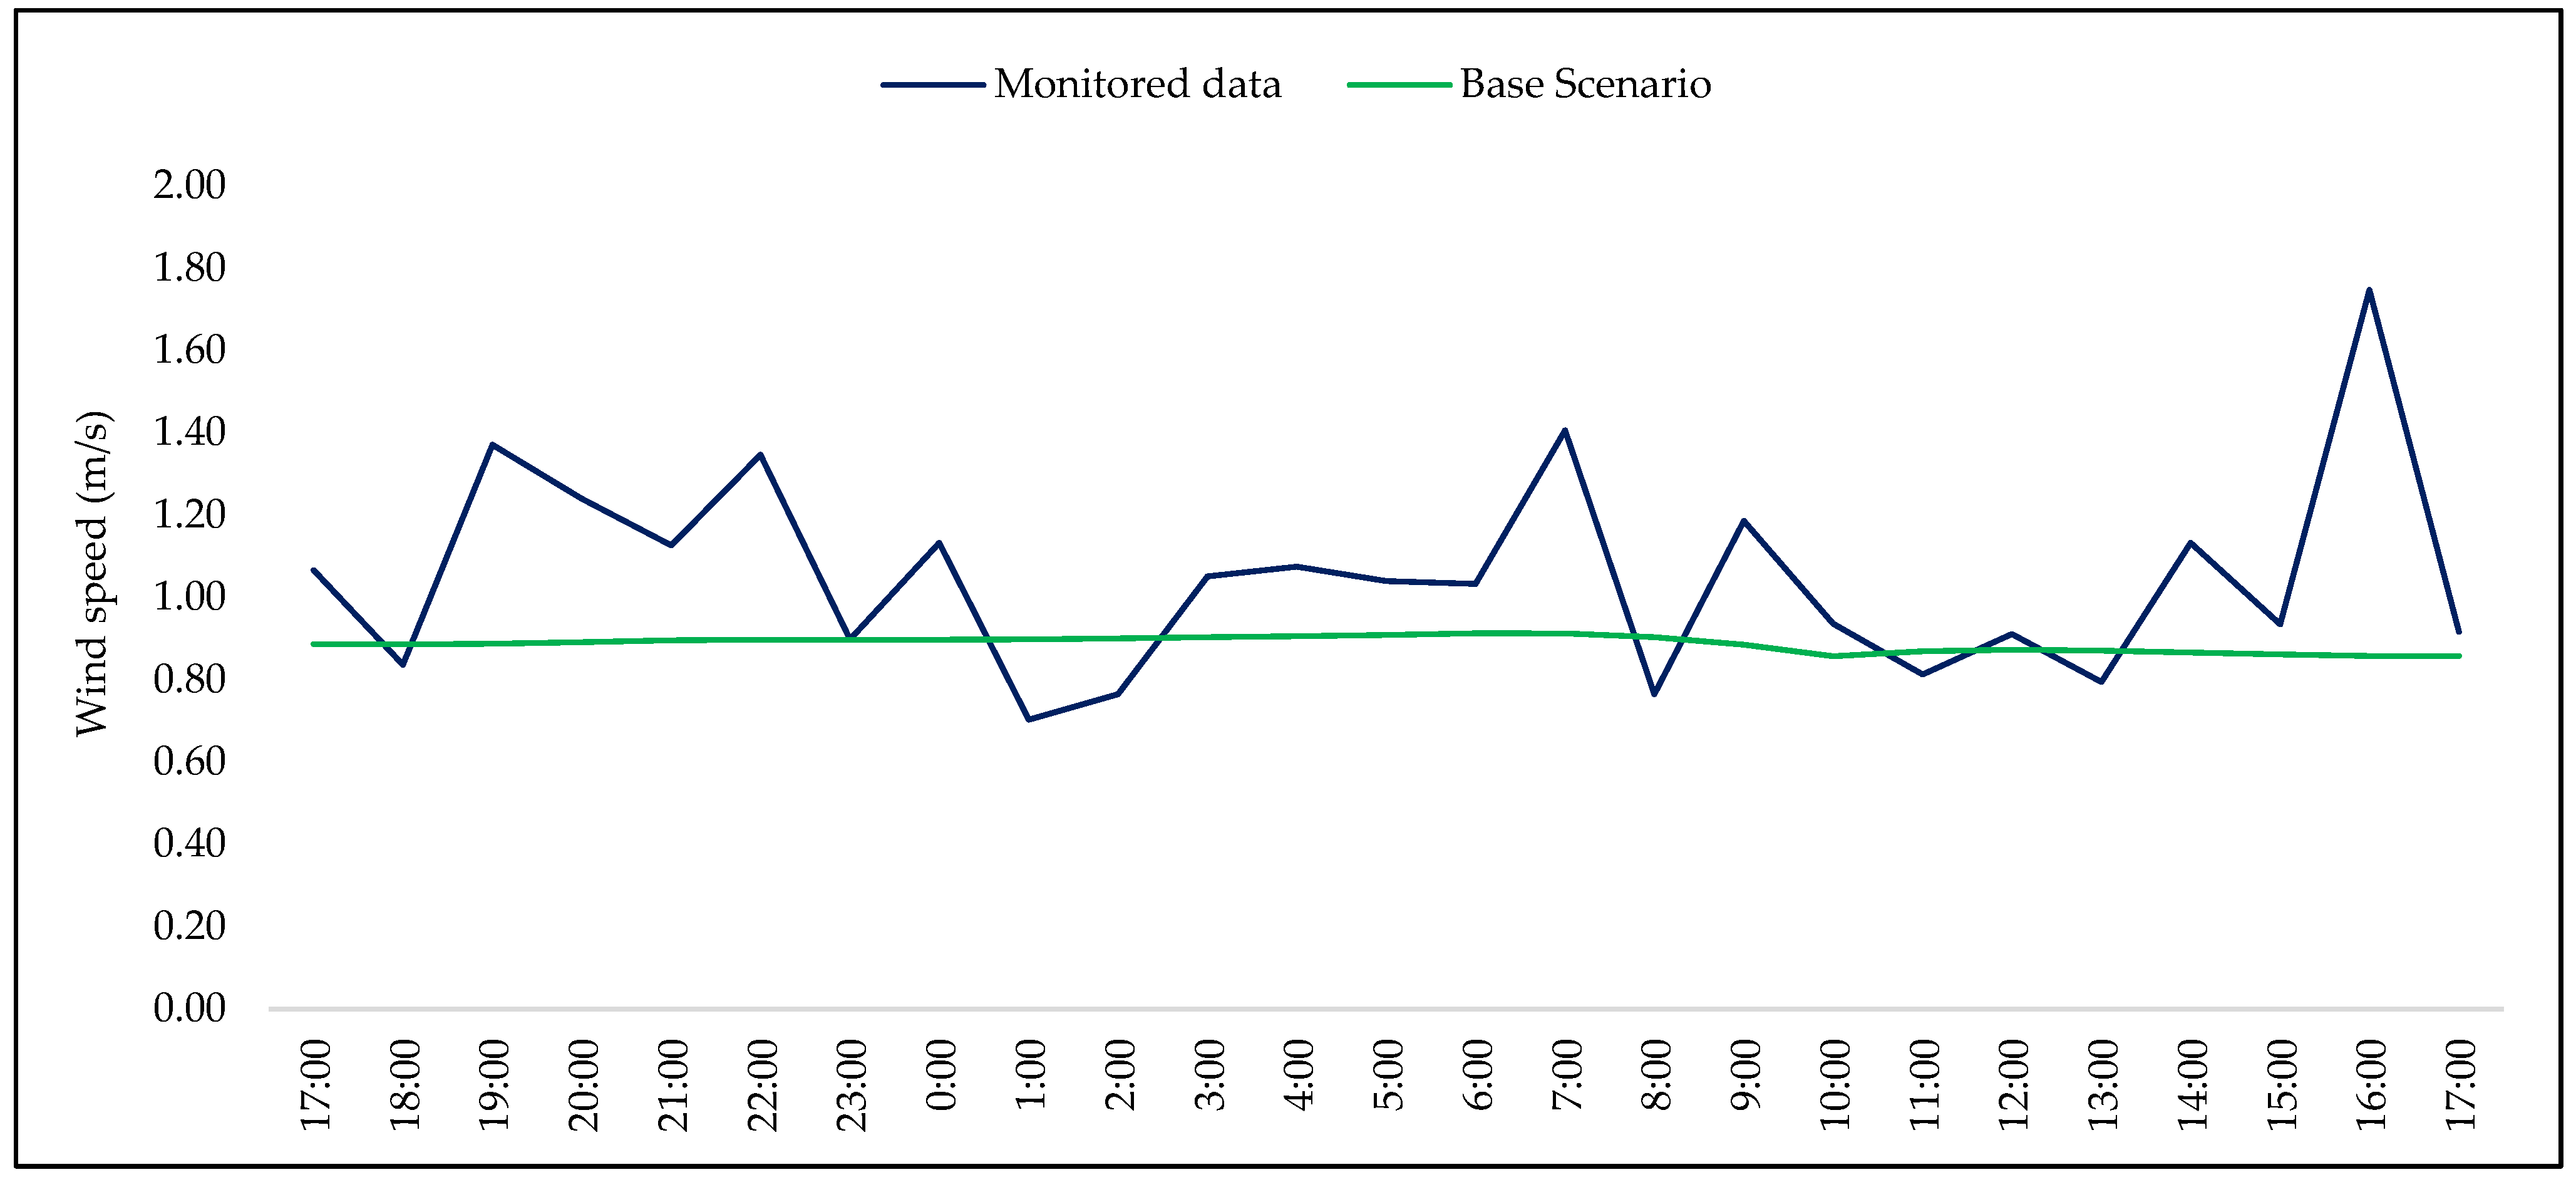
The relative humidity data from both fixed station and the base scenario simulation are presented in Figure 6. Values from the fixed stations were also used as input for the simulations, as well as for this study’s NBS scenario.
Relative humidity decreases during the day and rises at night, which can be mostly justified by the relation of this variable with the air temperature and pressure of the air; i.e., when the temperature decreases, the maximum amount of water vapor that can be present in the air decreases, and consequently, the relative humidity of the air mass increases. The changes in these two sets are similar, and the data correlation (Pearson) for these two datasets is very strong (0.960). Larger differences were found in the hours of higher relative humidity.

3.1.3. Wind Speed

Wind speed can have a major influence on the behavior of air temperature since it can affect dynamic processes such as convection. Figure 7 presents the variation of data from the two datasets: monitored and simulated (base scenario). The wind speed averages were used in the simulation of the base scenario and the scenario with the NBS.
Unlike the other variables, ENVI-Met generates stable values over the whole simulation, thus failing to grasp variations in wind speed across the day. Nonetheless, the data show that only light wind was present throughout the measurement campaign, thus limiting the potential effects of wind on local heat exchange processes.

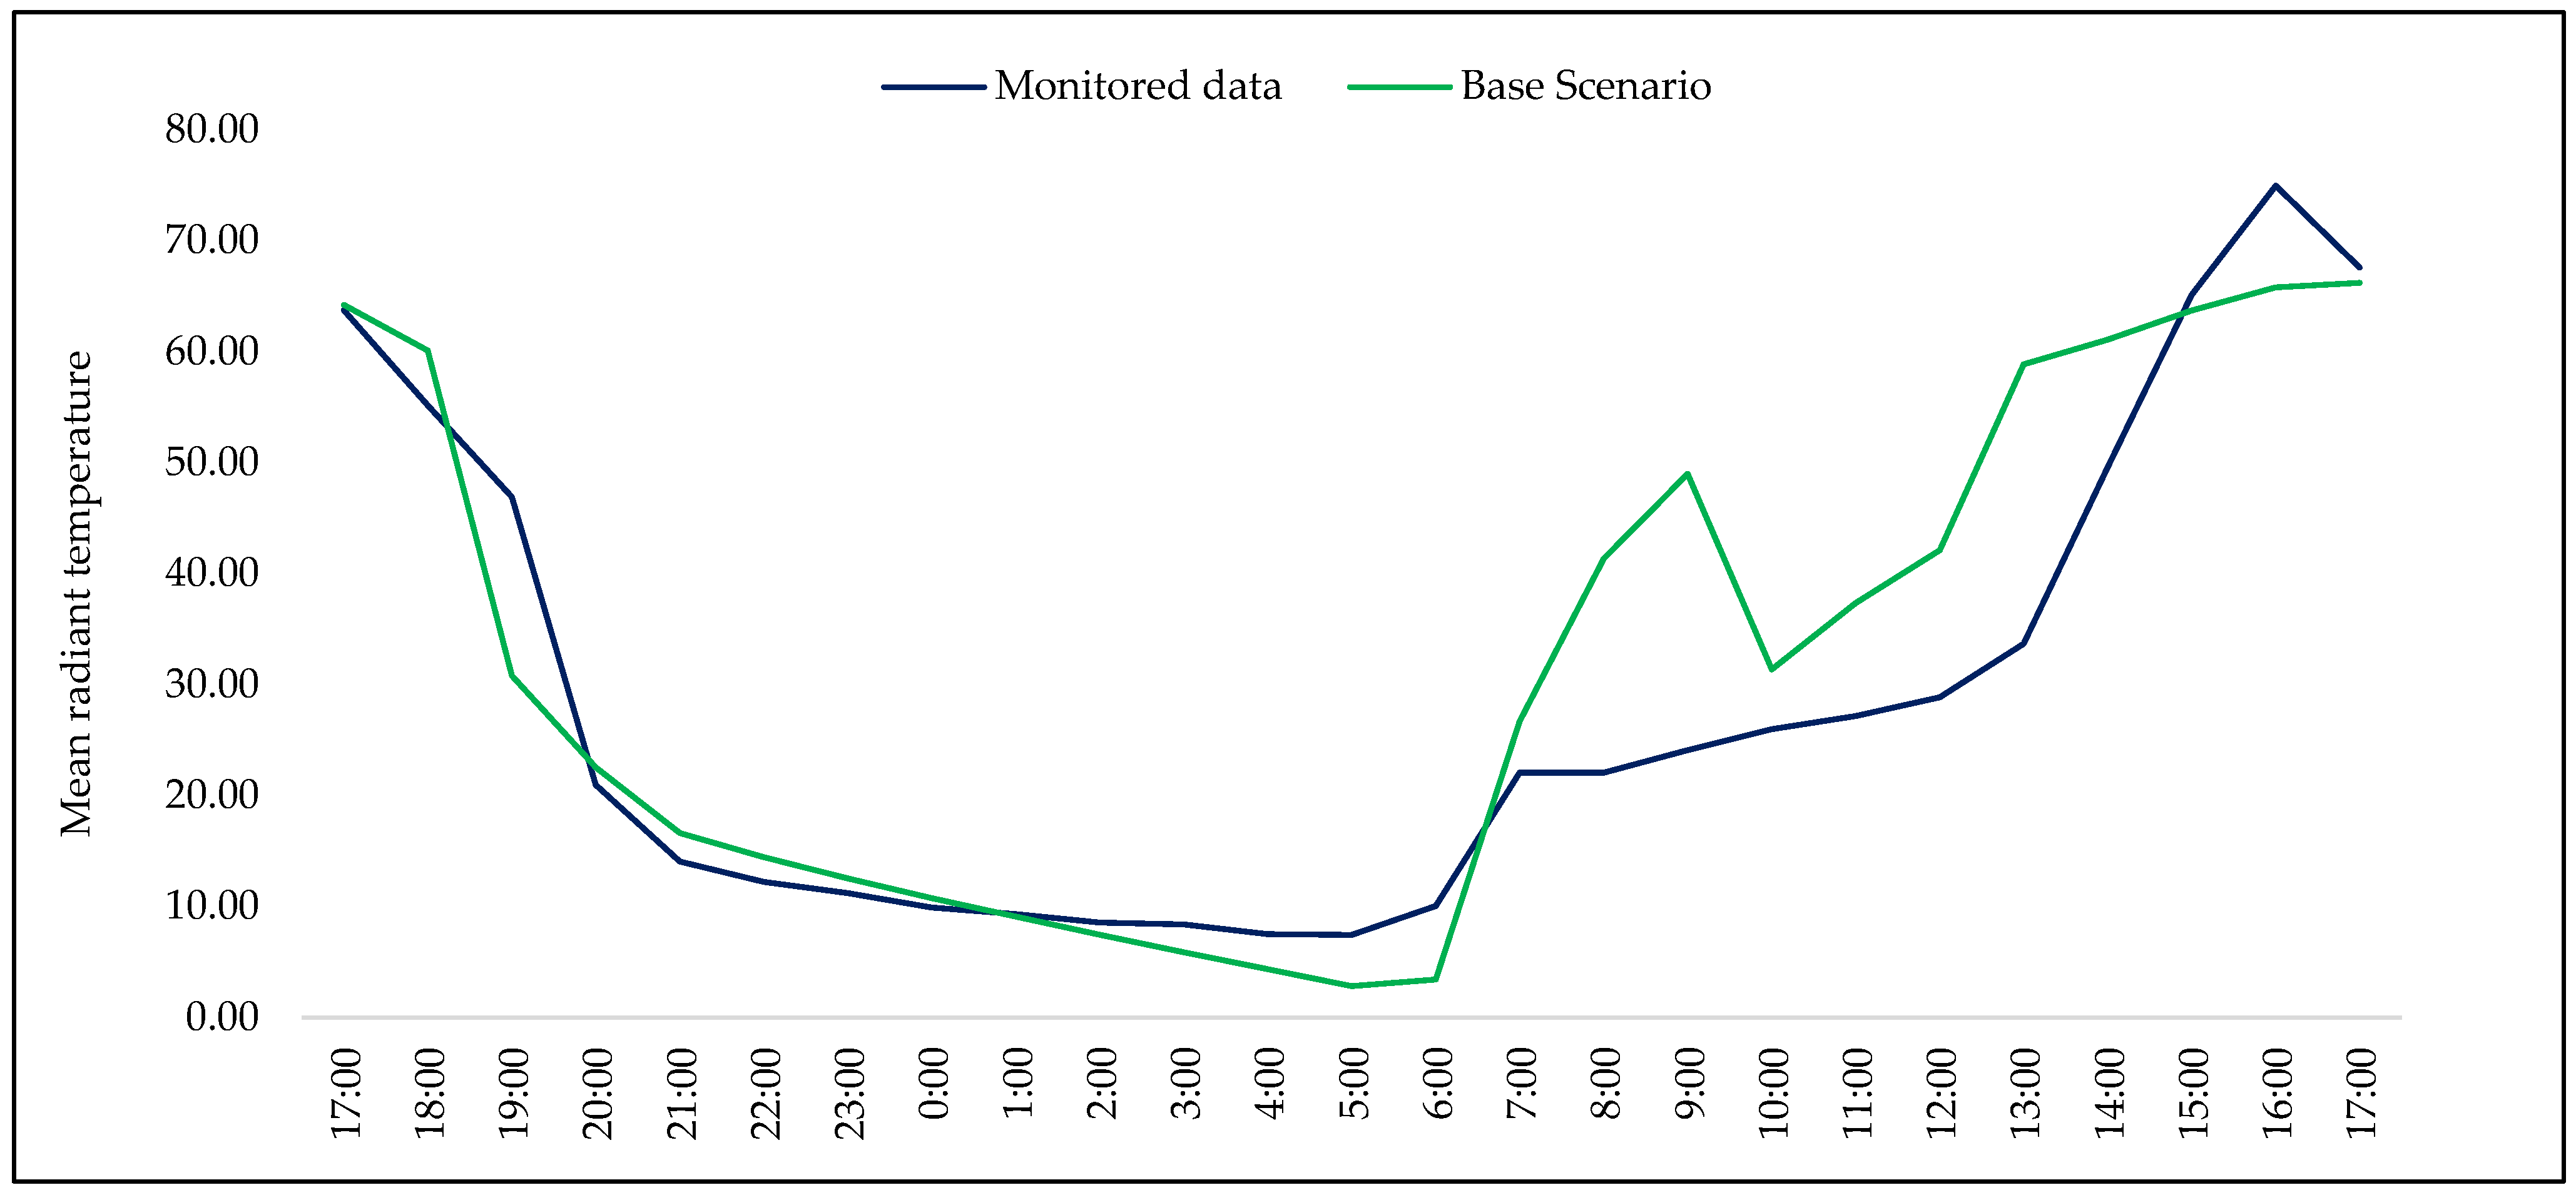
3.1.4. Mean Radiant Temperature

Mean radiant temperature is a parameter influenced by surfaces’ albedo and by the shading from both buildings and trees. Its behavior changes throughout the day as a consequence of the solar radiation load [31]. The analysis between the monitored data and the baseline scenario simulation demonstrates that there was a similar MRT behavior at the pedestrian level (1.5 m above ground) for the measurement period (Figure 8).
The results show an overestimation of the MRT during the morning and afternoon periods and show similarities during the night. These differences can be explained due to the model resolution not being accurate in differentiating the shading caused by certain urban elements, as well as changes in cloud cover. Moreover, ENVI-Met may fail to completely traduce the complexity of surface albedos and vegetation properties (e.g., leaf area index), which may also justify the differences between monitored and modeled results [54,55]. Despite the differences in results, the data correlation (Pearson) between the two datasets is strong (0.870).

3.2. Scenarios

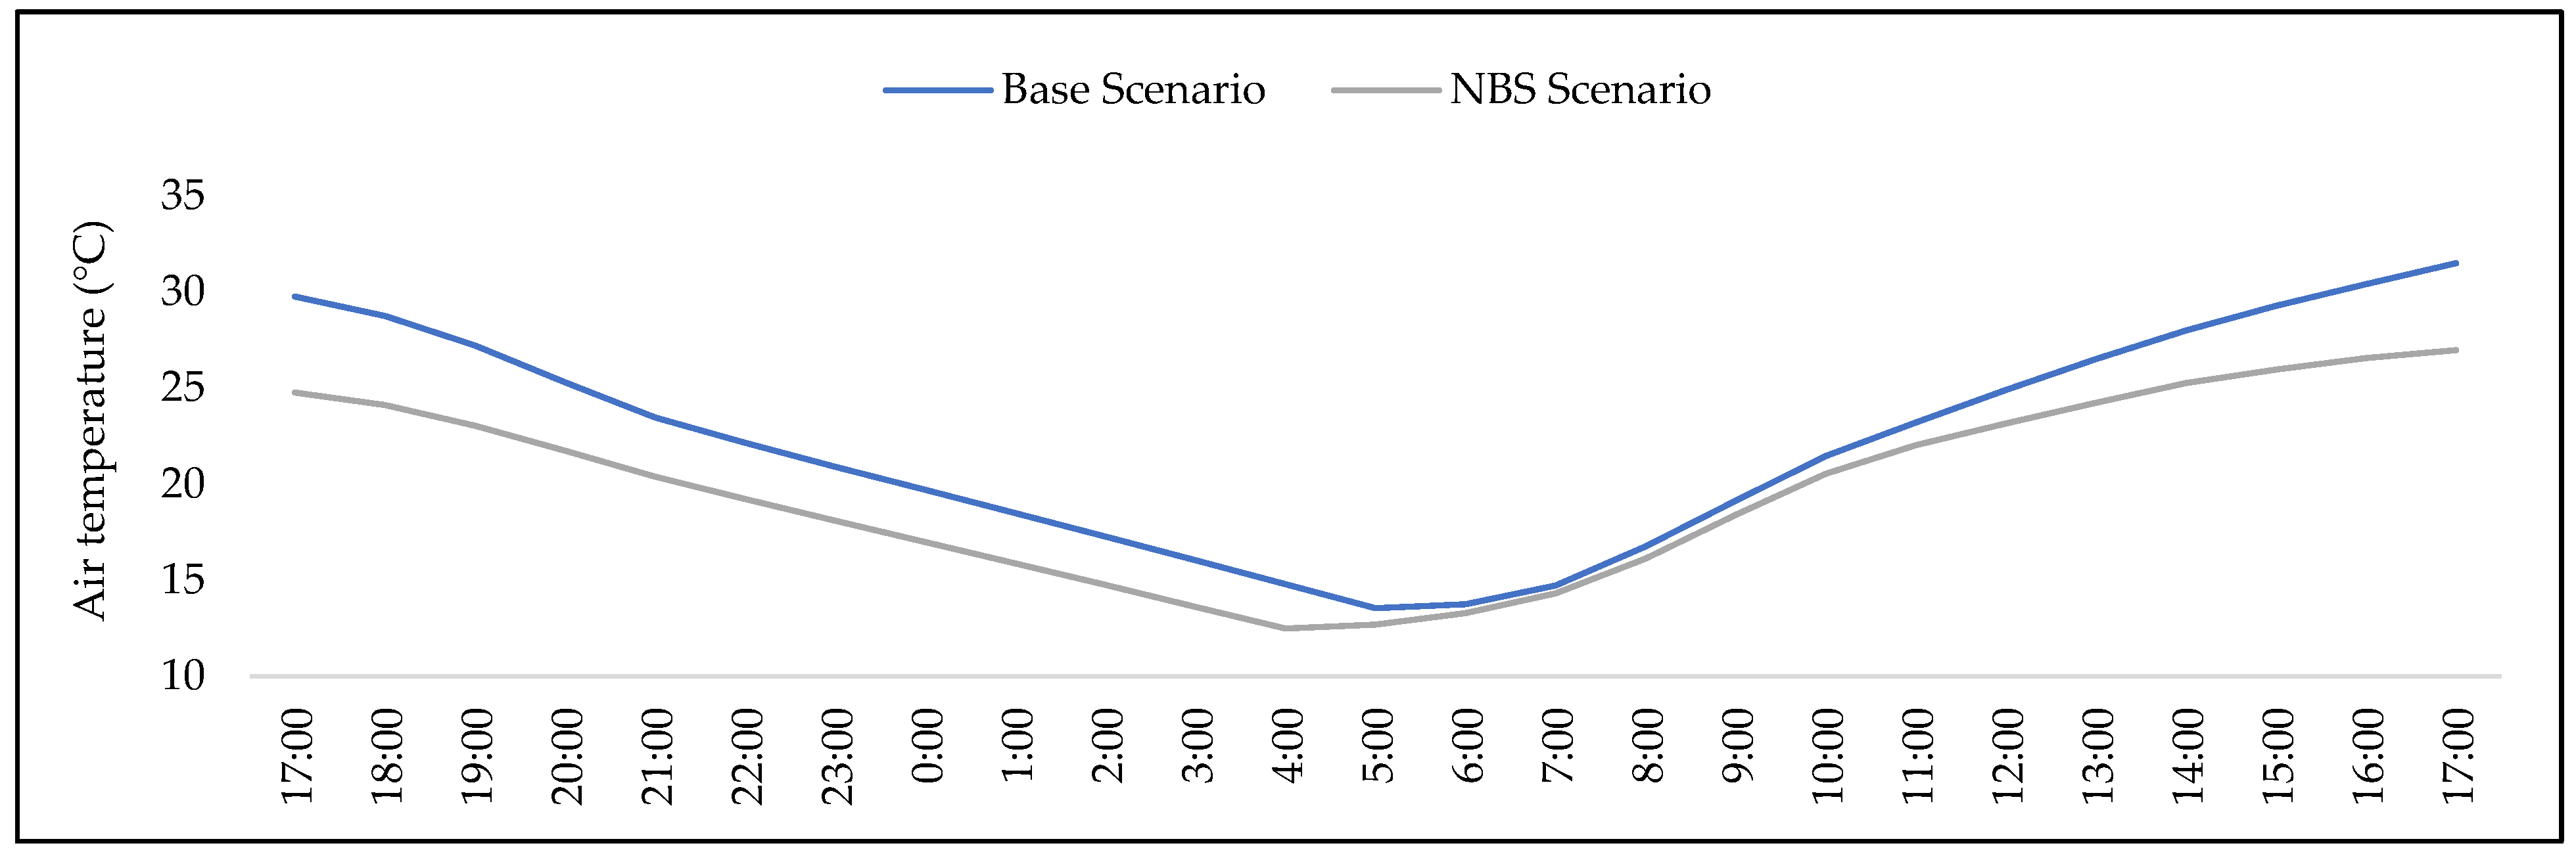
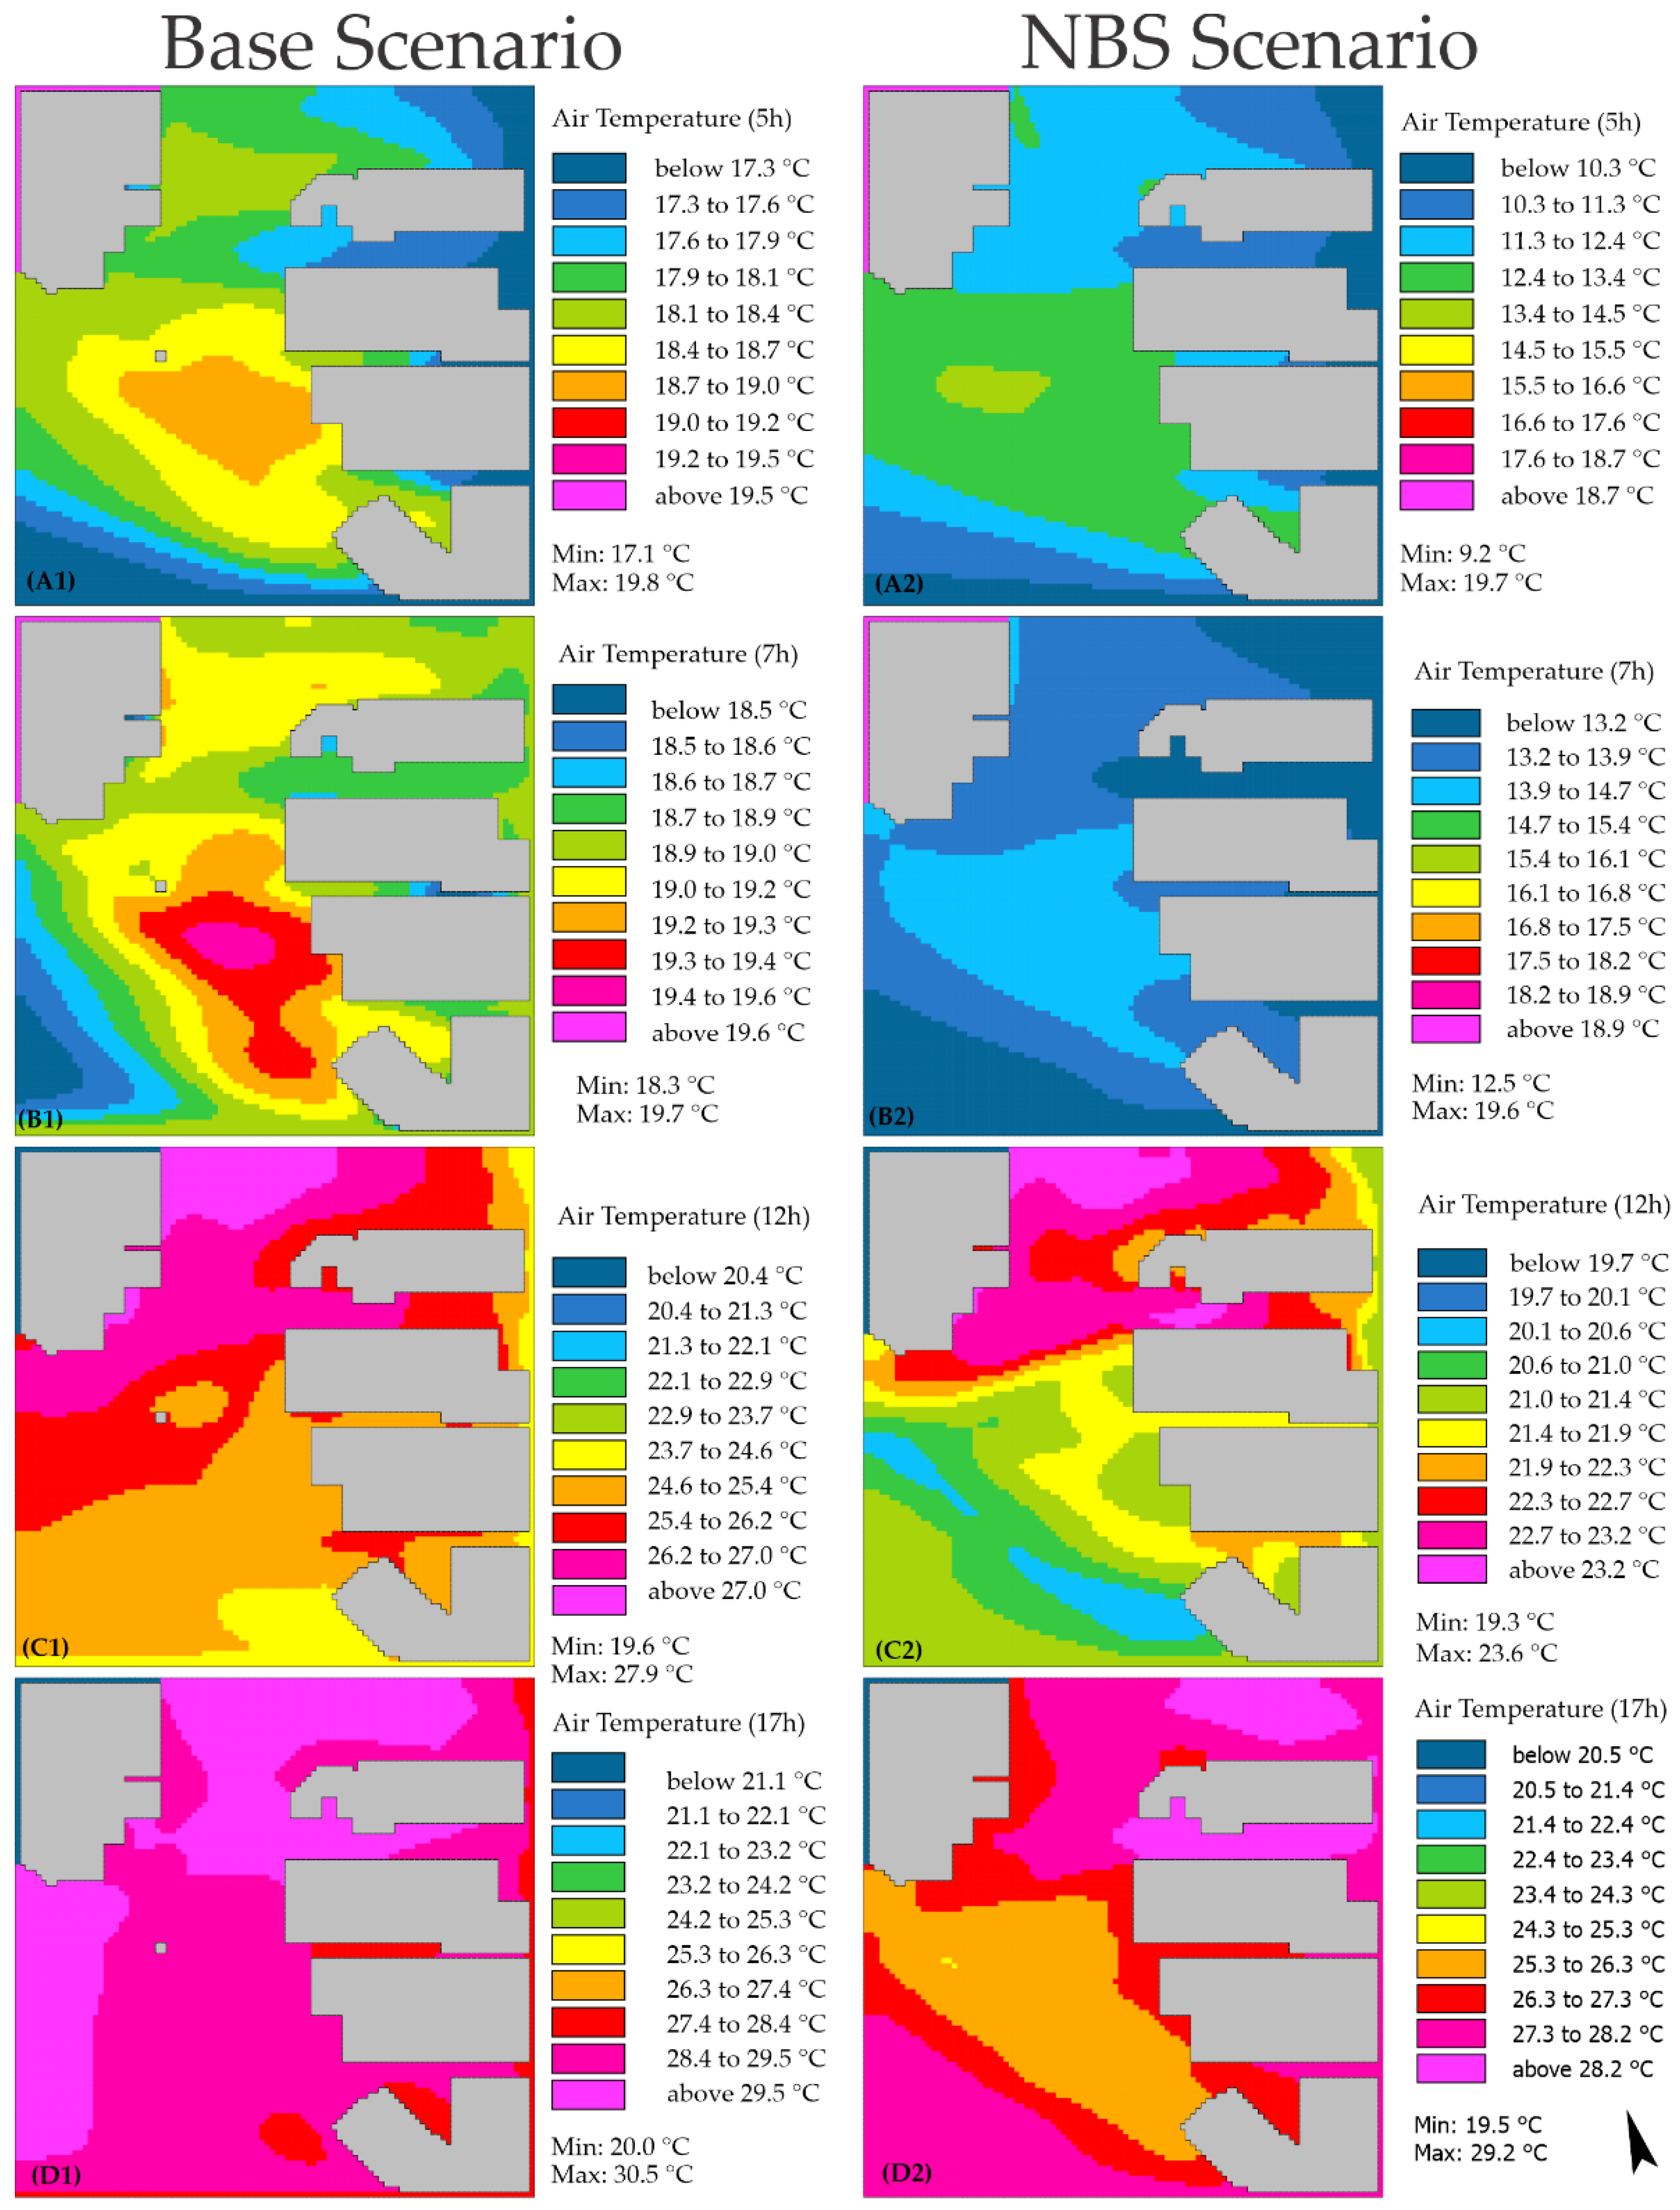
3.2.1. Air Temperature
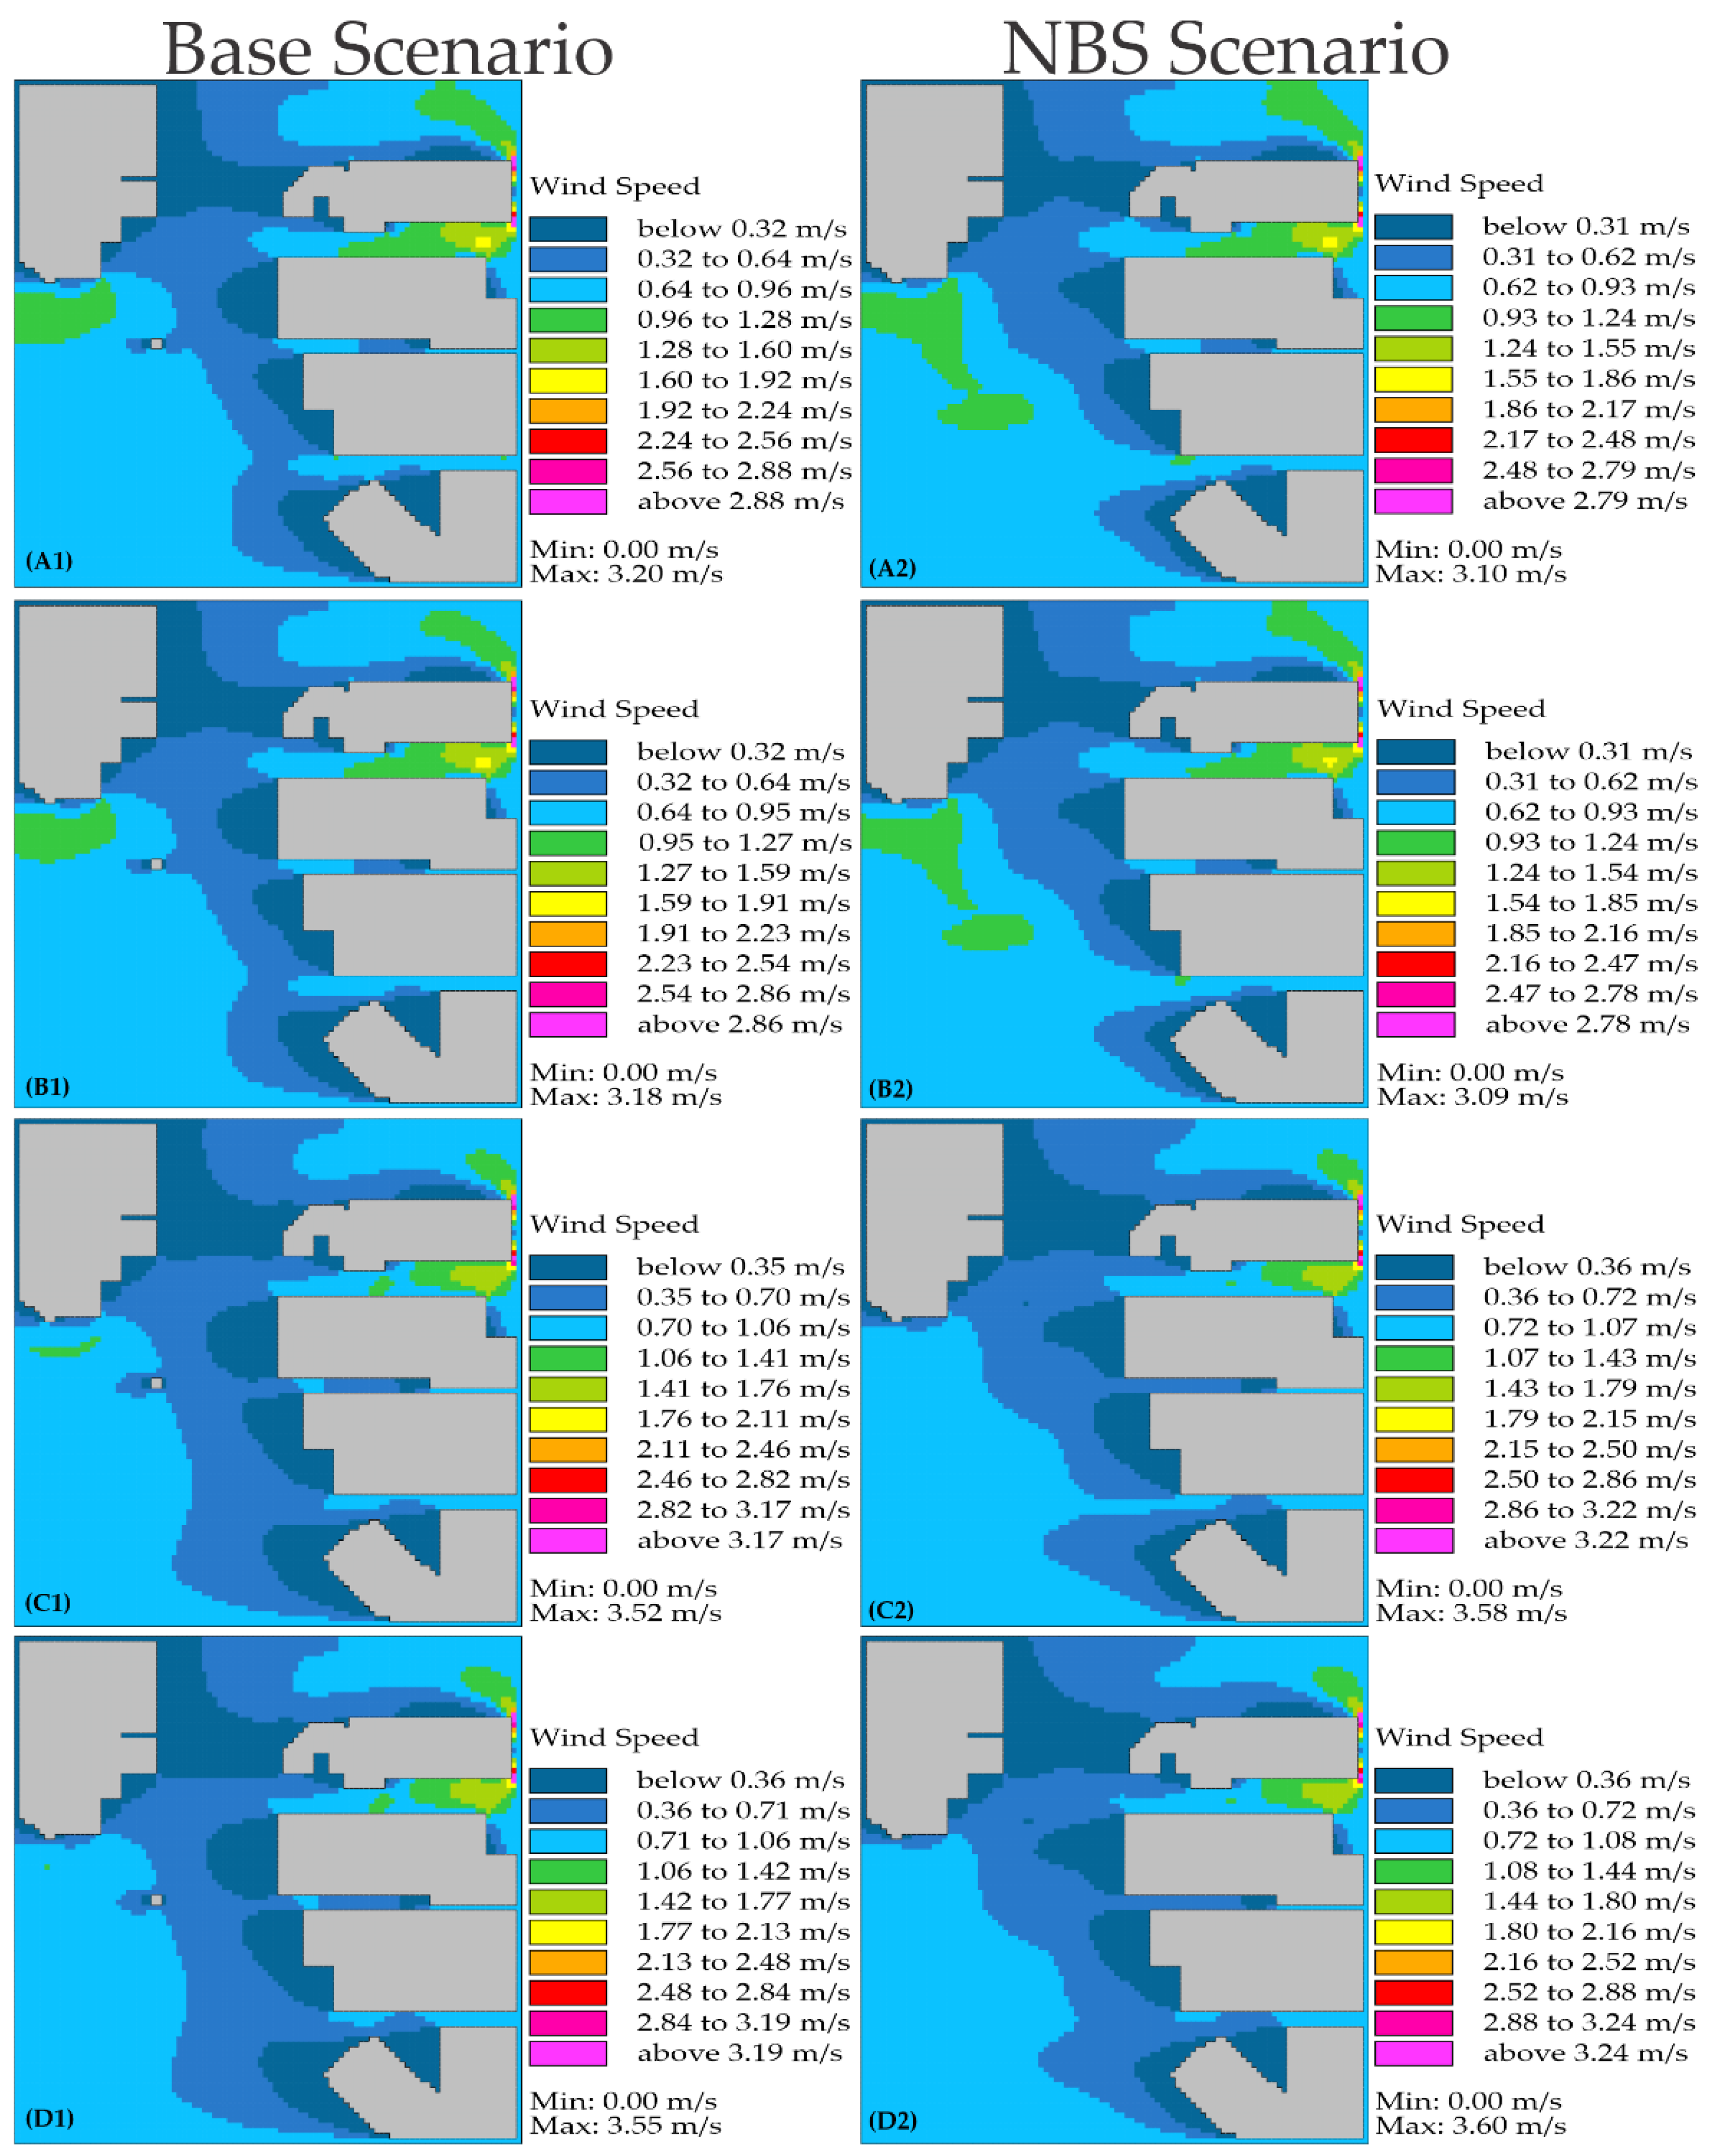
Simulations were performed in ENVI-Met for air temperature (Figure 9). For this parameter, hourly maps were generated for 5 h (just before sunrise, with the lowest air temperature value), 7 h (just after sunrise), 12 h (noon, with the highest solar angle) and 17 h (mid-afternoon). The height considered for reading the model data was 1.2 m.
The simulations (Figure 9) allow us to foresee the influence of urban design on air temperature [45]. The results allow us to identify the potential influence of NBSs as solutions to improve thermal comfort, providing a detailed estimation of the benefits of the introduction of vegetation in a public road infrastructure in an industrial zone.
Overall, the base scenario had ranges of 2.7 °C, 1.4 °C, 8.3 °C and 10.5 °C for the simulated times of 5 h, 7 h, 12 h and 16 h, respectively. For the same periods, the simulations for the NBS scenario foresaw amplitudes of 10.5 °C, 7.1 °C, 4.3 °C and 9.7 °C, respectively.
The maps suggest that the highest air temperatures were expected to be reached over asphalt and sidewalks, whereas the lowest air temperatures were simulated over grass surfaces, under trees, and in other shaded locations from both buildings and trees. Before sunrise (5 h), the highest simulated temperatures are between 18.7 °C and 19.8 °C, concentrated in the traffic circle and asphalted area. With a sunrise (7 h), there was an increase in temperature, especially close to low albedo surfaces. For the following hours (12 h and 17 h), air temperature increased considerably, reaching maximum temperatures of 27.9 °C and 30.5 °C for the base and NBS scenarios, respectively.
For the NBS scenario, when compared with the base scenario, lower temperatures extended to the areas where trees were added, thus expanding the original cool areas in the base simulation. The most expressive differences were found at sunrise (7 h) and noon (12 h). These differences can be explained by the fact that, starting from dawn, trees partially intercepted the sun’s rays, causing lower solar incidence. Additionally, trees provide water vapor through transpiration, which helped reduce the air temperature. Grass surfaces also provided additional temperature reductions, especially when irrigated, although this vegetation was less effective than trees in thermal regulation.
The addition of vegetated areas in the NBS scenario contributed to reductions in the heat island effects, as shown in Figure 9A2,B2, with reductions in air temperature over the afternoon periods. This phenomenon can be justified by increases in evapotranspiration, which contributed to increases in relative humidity.
The presence of vegetation in the urban fabric has proven to be efficient in regulating air temperature. The radiant energy received produces a high level of evapotranspiration when combined with good site irrigation, which can help maintain the vegetation’s capacity to contribute to local thermal comfort.
For the simulations performed for the base and NBS scenario (Figure 9), there was a smaller temperature reduction for the dawn period when compared with the afternoon period. A similar result can be found in a study by Silva and Shinzato et al. [51,56], which points out that the method used for simulation, simple forcing, which does not use many input parameters and forces the climatic behavior, may not generate fully realistic scenarios [28,57,58,59]. Ketterer and Matzarakis [55] as well as Middel et al. [30] report higher simulated values for daytime air temperature and lower values for nighttime. For this study, ENVI–Met generally tended to underestimate all Ta values. This lack of coincidence between the measured and predicted values was also identified by Tsoka et al. [39], analyzing several papers that used ENVI-Met for simulations for various purposes.
The simulated scenarios demonstrate that, in general, the addition of green areas and nature-based solutions can potentially decrease air temperature, especially in early afternoon hours, where solar incidence is stronger and where surfaces warm throughout the previous hours, and these results are consistent with those of Tsoka et al. and Tsilini et al. [39,43]. In simulations performed in tropical climates, Morakinyo and Lam [44] had similar results, highlighting the importance of tree selection as unique characterization parameters in conjunction with leaf area index (LAI) values, leaf density distribution (LAD) by height and the planting pattern or arrangement, which can affect trees’ potential benefits.

3.2.2. Wind Speed

Wind speed simulations (Figure 10) produced little variation throughout the day, as ENVI-Met does not consider relevant variations in wind speed and direction inputs throughout the simulation, offering similar results for each of the periods.
In all periods, lower wind speeds were found near the buildings, whereas open areas exposed to predominant wind had higher wind speeds.
The results suggest that the addition of vegetation in the NBS did not induce considerable changes; however, there was an increase in wind speed in the west direction. This result can be justified because the model was simulated by a single input value of wind speed and direction, southeast of the maps, without providing visible changes throughout the day. These circumstances are, according to Ketterer and Matzarakis [55], related to the modeled values of wind speed, which do not represent the measured data correctly, assuming a constant value.
The ENVI-Met model has been very rarely evaluated for its ability to accurately reproduce diurnal wind speed profiles. Some authors [39,54,60] have suggested that the model is unable to simulate relevant variations in wind speed and direction because of the static nature of the model, which provides little variation from the initial parameters’ definition, corresponding to the daily mean values.

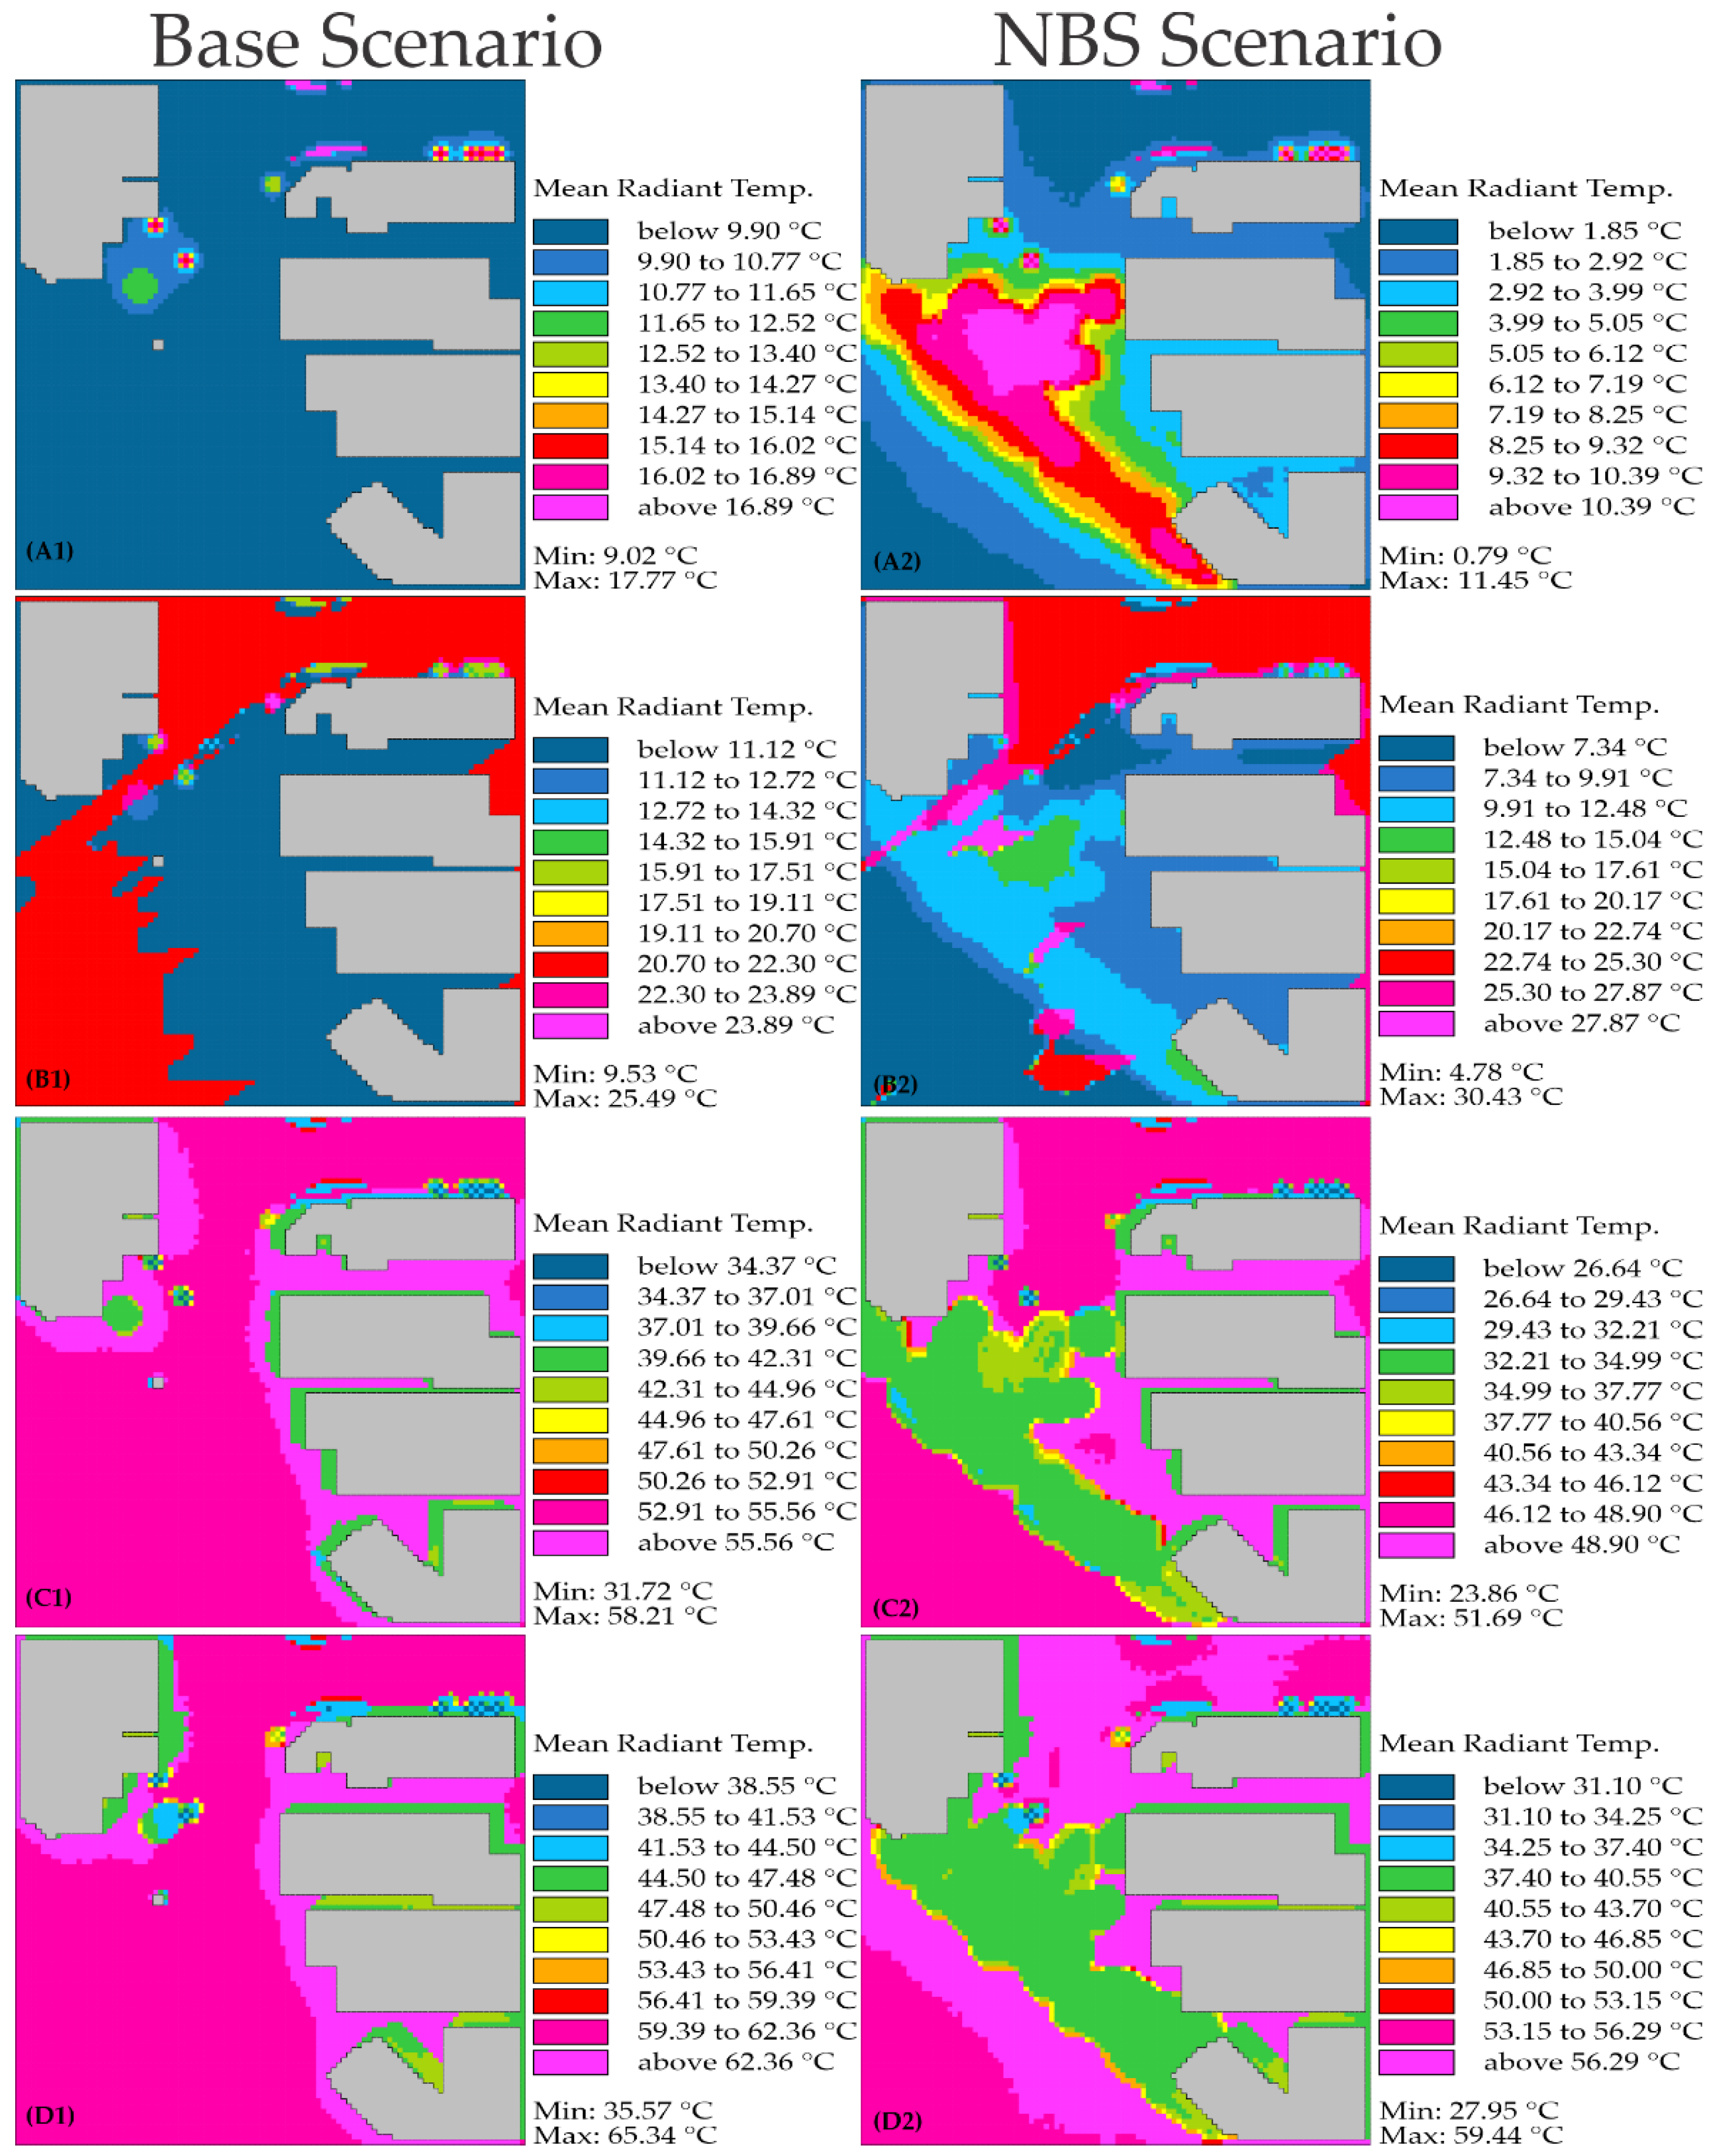
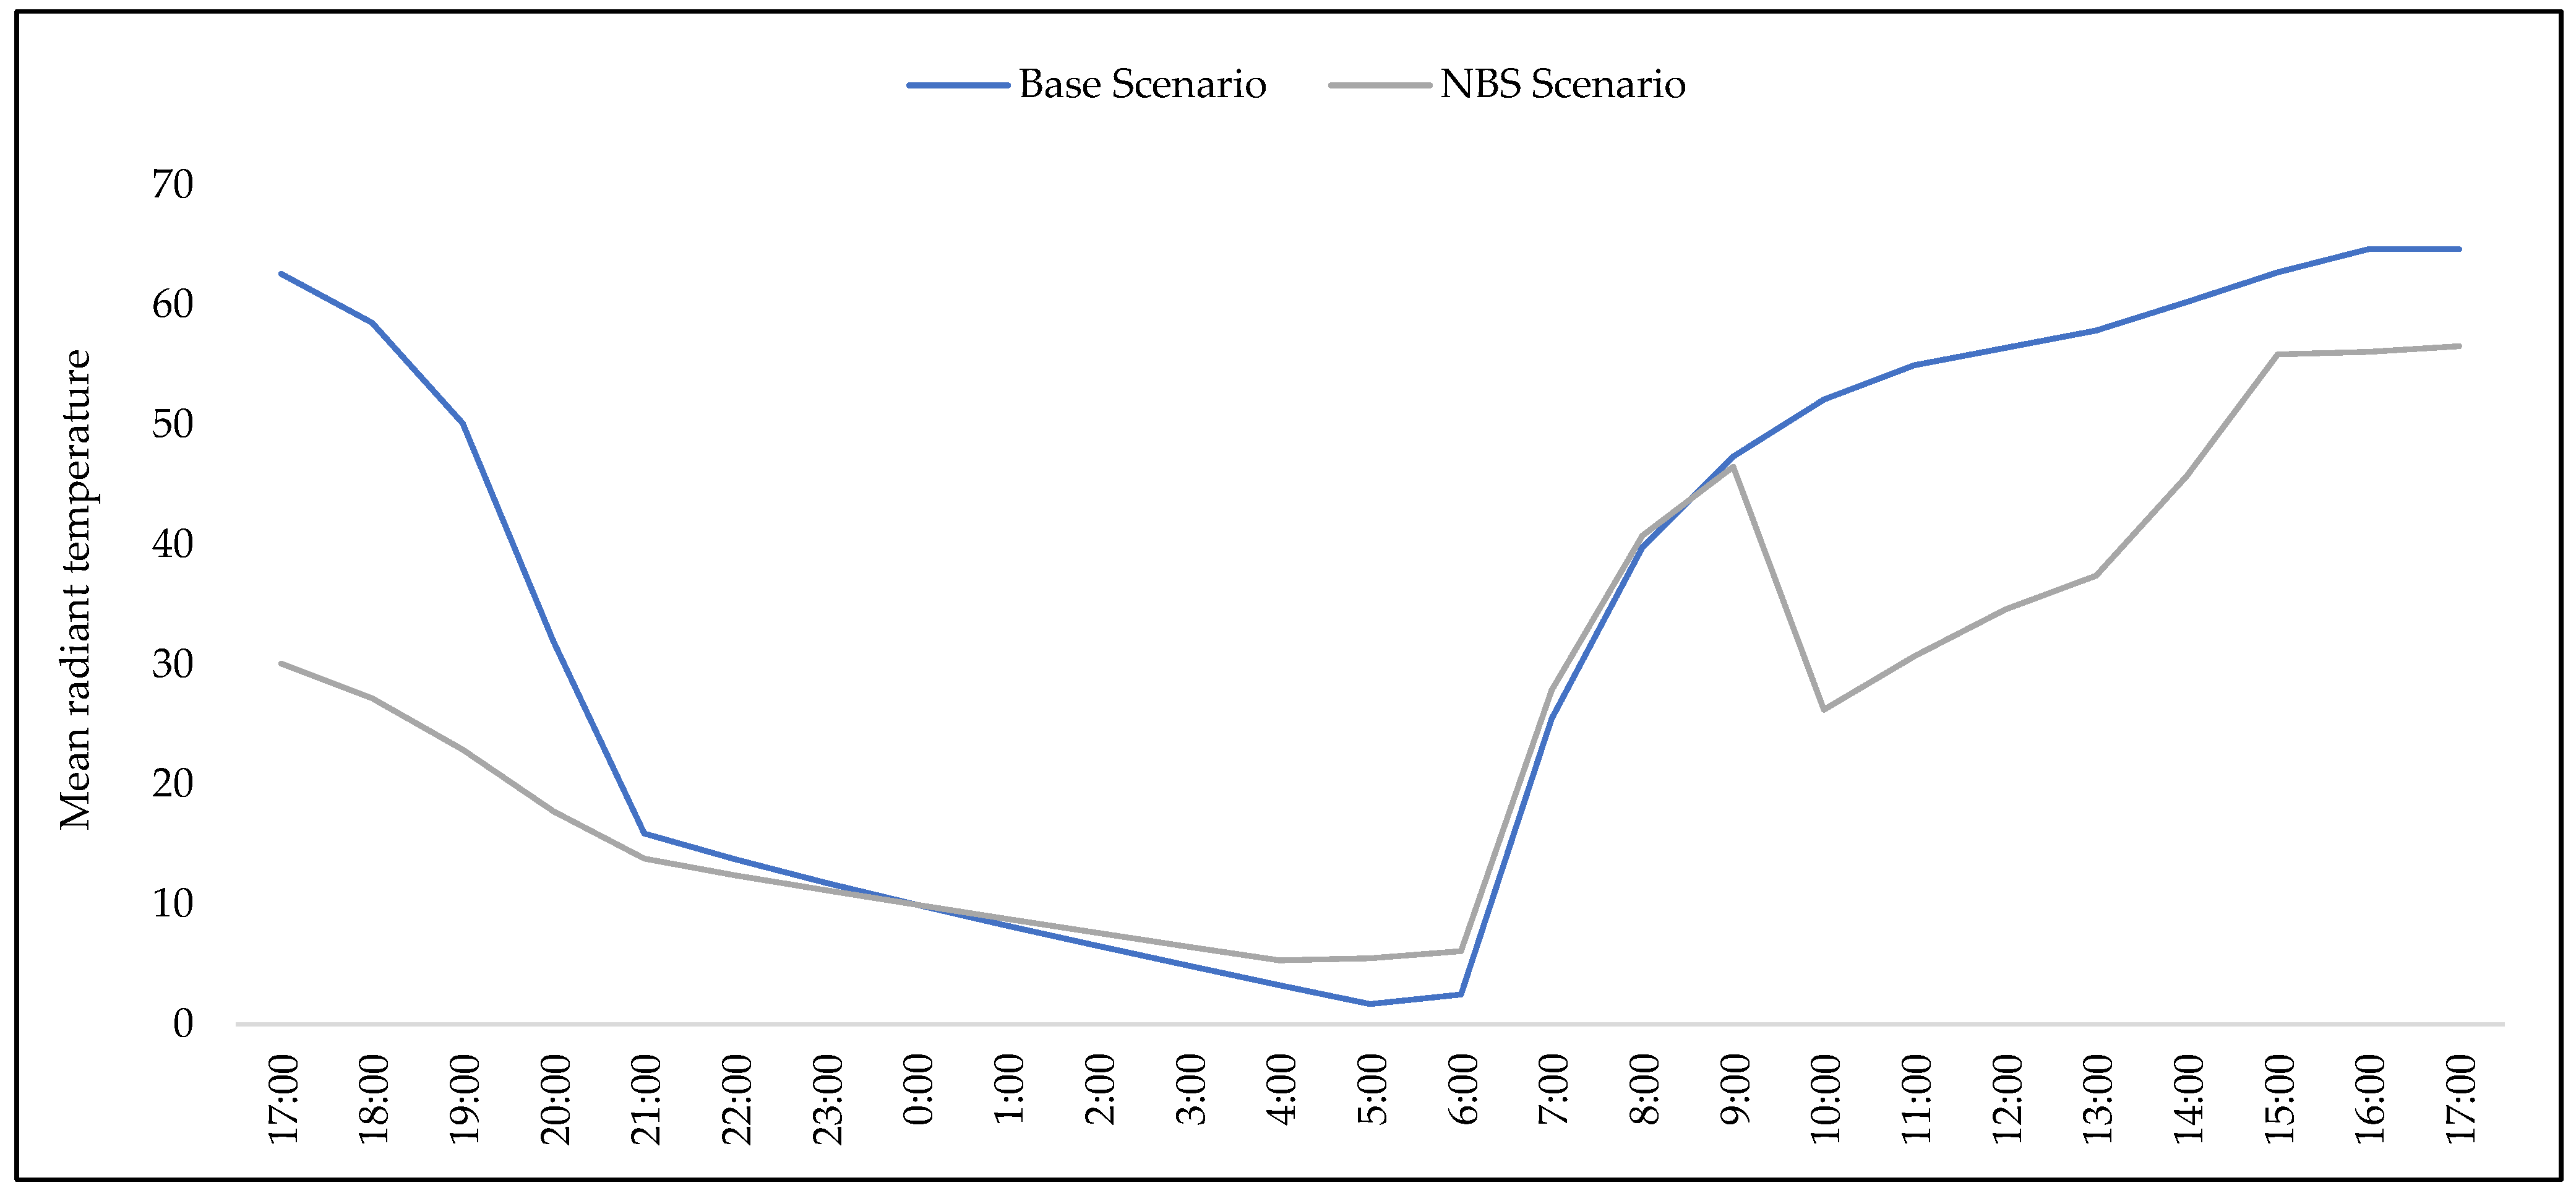
3.2.3. Mean Radiant Temperature

In this study, mean radiant temperature (MRT) is the parameter proportionately most affected by the shadows cast by trees and buildings [33]. The simulations (Figure 11) demonstrate how this variable changed at the pedestrian level (1.2 m) for the four simulation periods, for both the base and NBS scenarios.
MRT expresses the effects of direct and reflected shortwave and longwave radiation fluxes at a given location [61]. As expected, solar radiation played an important role in MRT, and higher values can be understood mostly as a consequence of both low albedo on the ground and wall surfaces and sun exposure on those surfaces. Consequently, higher differences were found between sunny and shaded areas, with maximum values on paved surfaces.
Nights are cooler (Figure 11A1,A2) because, during this period, there is no incoming shortwave radiation, i.e., there is an energy deficit, and the surface–atmosphere system cools down through the emission of longwave radiation into space. Both scenarios have low MRTs compared to the others before sunrise; however, in the NBS scenario, there was an increase in the MRT in the center of the area because, with the addition of vegetation, there was an increase in energy dissipated during the night due to its low albedo.
From dawn (Figure 11B1,B2), the sun incidence can be noticed from the northeast side through the red and pink colors. Note that the trees in the central region prevented radiation from direct incidence on most of the study area, reducing the MRT on the opposite side of the simulation.
For the NBS scenario, trees (Figure 11C2,D2) primarily provided solar radiation shielding, preventing direct shortwave radiation. The lawn in the roundabout also acted as an attenuator of reflected radiation, since plants intercept part of the shortwave radiation and integrate it into their physiological processes, such as photosynthesis. Thus, as can be seen in Figure 10, after sunrise, it was expected that the areas with added vegetation, in general, had a lower MRT.
In urban areas, heat transmission by radiation is the most important factor in the energy exchange processes between the human body and its environment. During the night, the simulations show the influence of trees (Figure 11), which can be explained by their energy balance, demonstrating the effectiveness of the software in designing tree models in detail [62].
ENVI-Met provides similar behaviors between air temperature and MRT, especially when considering the spatial variability in the selected spaces [63]. Therefore, the results (Figure 11) are consistent with the characteristics of the urban geometry at each site; however, as suggested by Acero and Herranz-Pascual [54], ENVImet still fails to grasp every aspect from the microscale energy radiation balance (e.g., diffuse/reflected radiation or longwave radiation), which can be explained by the limited options regarding surfaces’ albedos and vegetation properties.

3.3. Comparison between Scenarios

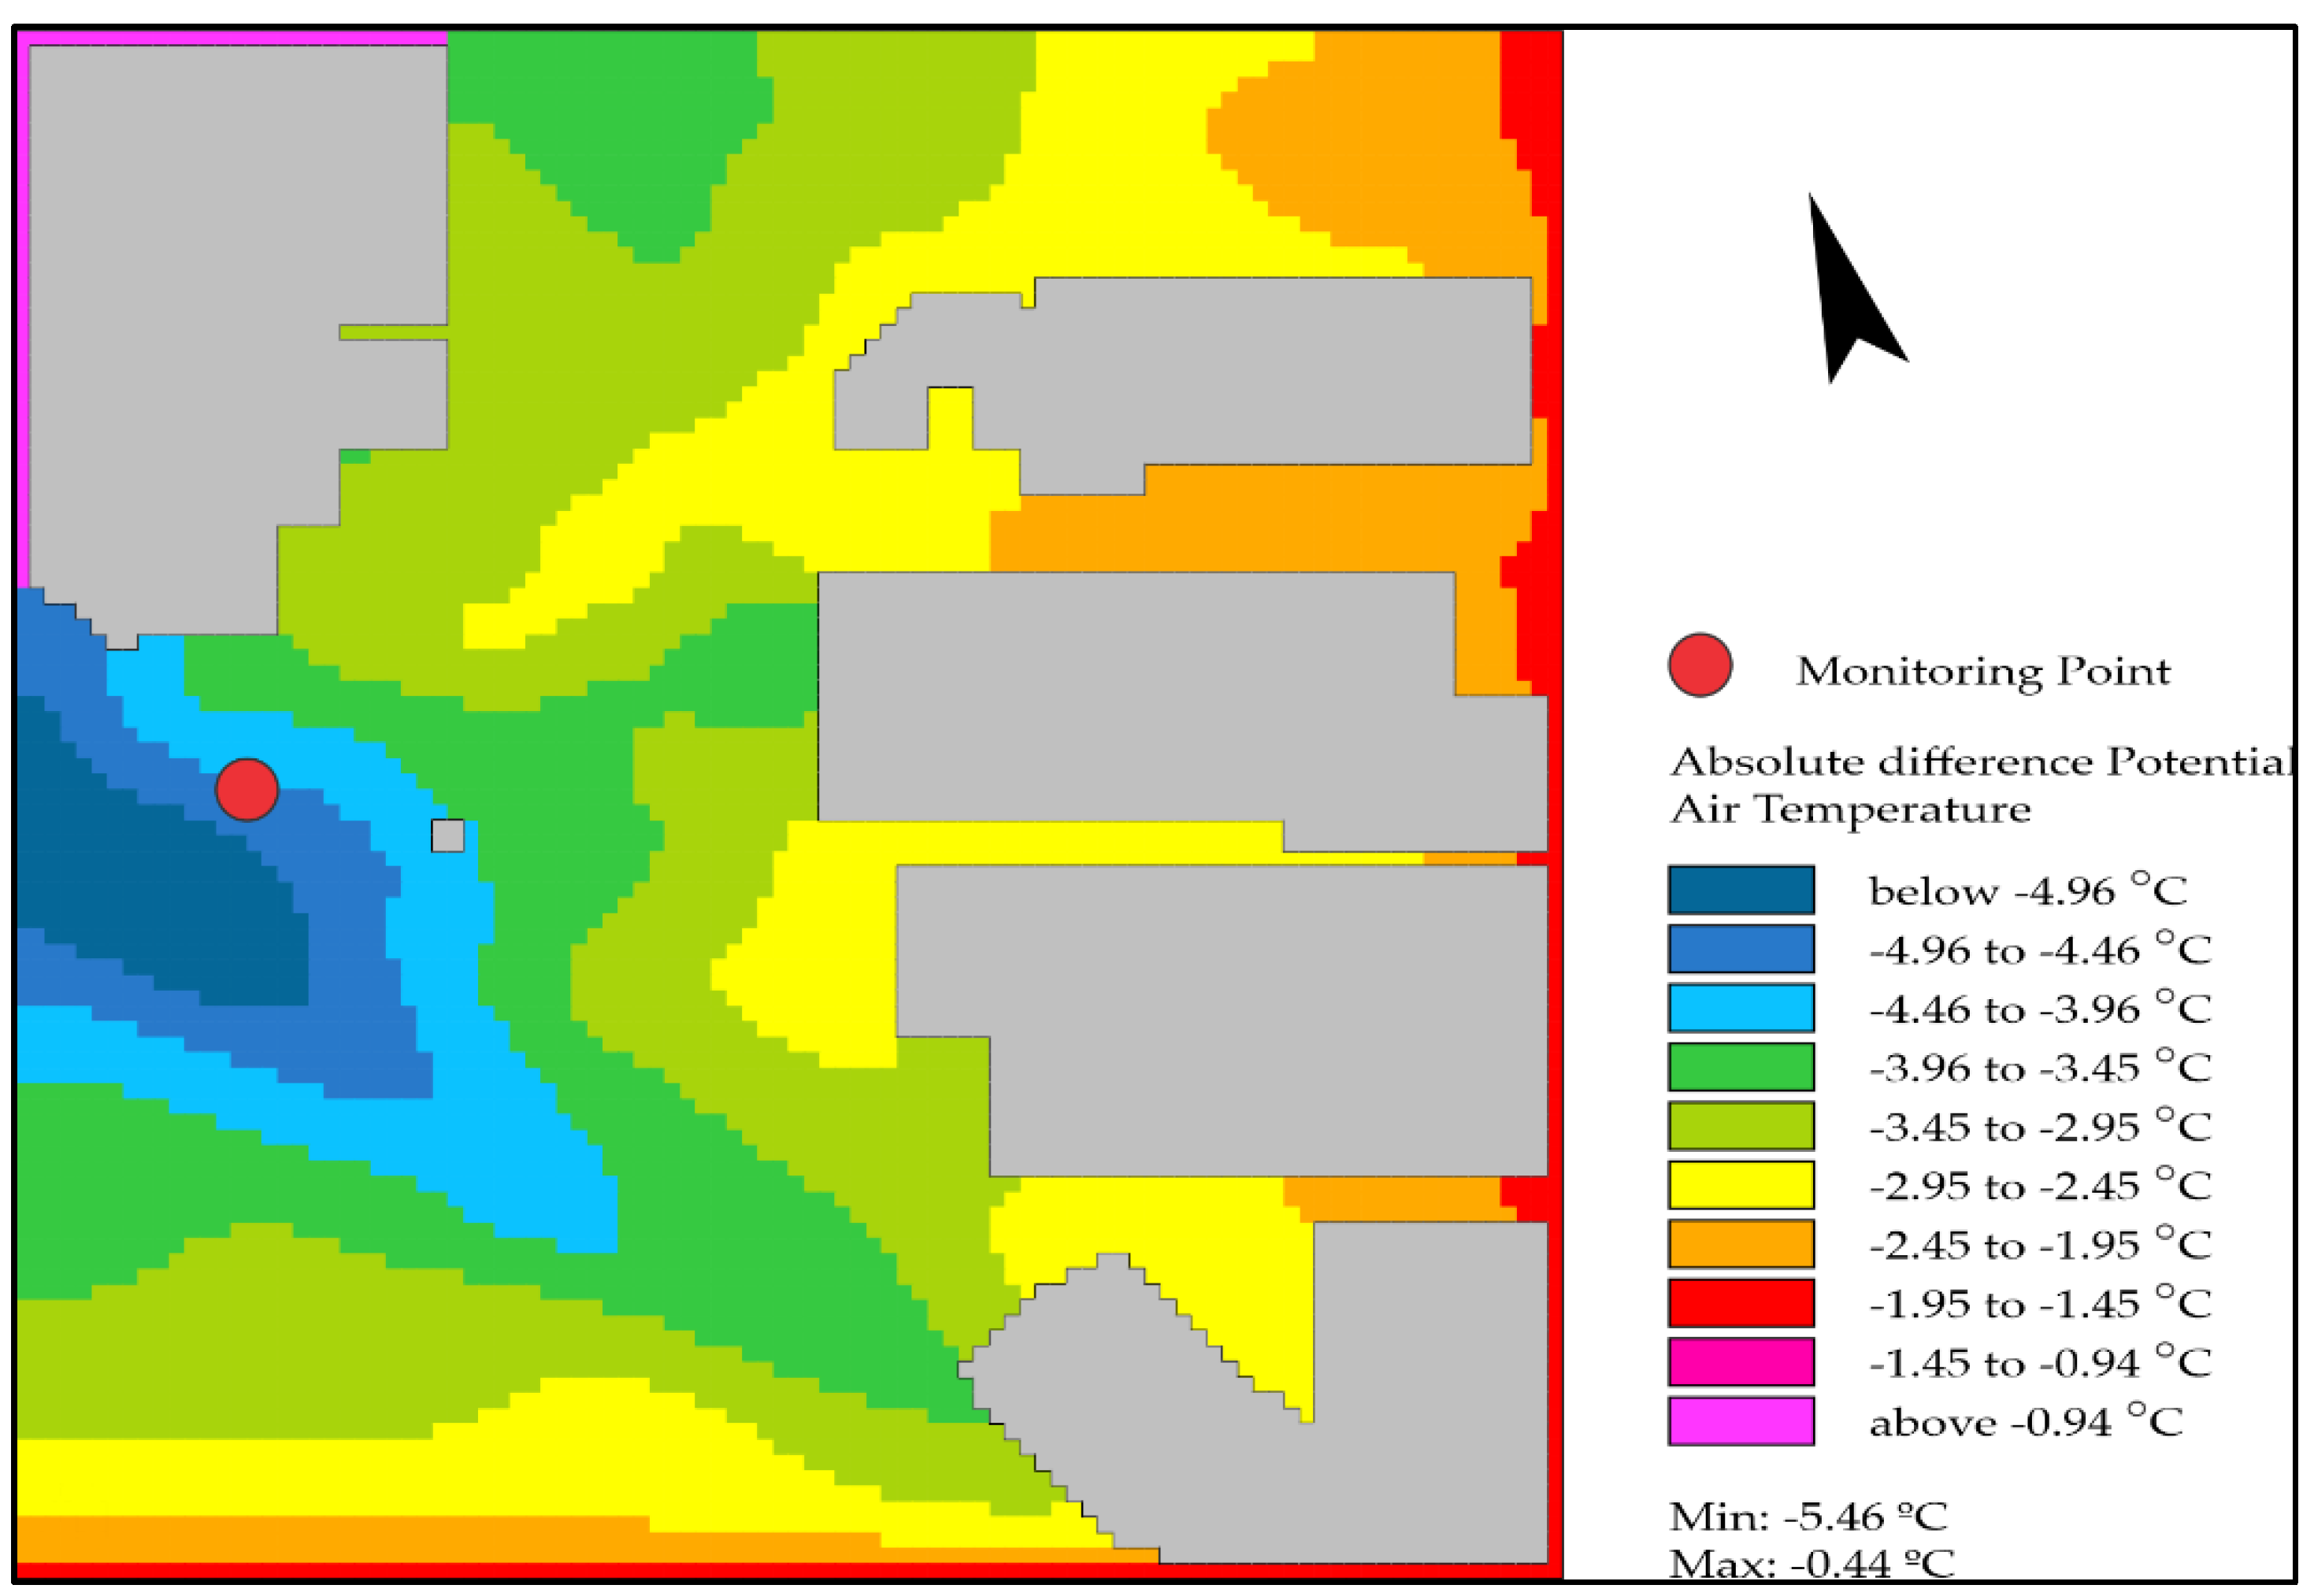
3.3.1. Air Temperature

The map (Figure 12) expresses the variation across the modeling space and presents a prediction of the behavior of the study area for the solar noon period, when the differences are most expressive, from the four periods in this study. This first representation compares the simulations between the base scenario and the NBS scenario.
It is important to note that the places with major temperature reductions were located where the NBS simulation included additional trees and grass, on the dry stream between the roundabout and the railway tracks. In these locations, ENVI-Met estimated reductions of up to 4.96 °C. Inside the traffic circle area, the expected air temperature decrease was smaller though significant, around 3.45 °C to 3.96 °C. The smallest reductions were simulated for shaded areas near the buildings, areas already cooler and those which had no addition of vegetation.
The projected differences in air temperature between scenarios suggest that NBSs, and particularly vegetation introduction, when fully developed, can promote decreases in air temperature, as there were general decreases in temperature in the simulated area. Tsoka et al. [39] report that, in their study, the simulation revealed that ENVI-Met can be considered a useful tool for the definition of heat mitigation strategies with the incorporation of urban vegetation, giving even better results when using combined strategies, such as green roofs.
The curves in Figure 13 represent the hourly variation of air for the two defined scenarios. The curves follow a similar daily variation pattern; however, the incorporation of the NBS in the scenario determined reductions in the simulated air temperature in all periods, although they were more expressive in periods of greater solar incidence.
The incorporation of vegetation in streets and sidewalks determines potential reductions in air temperature. In a period of higher relative humidity (Figure 6), a minimum reduction of 0.94 °C at 5 a.m. and 6 a.m. was identified, with a maximum reduction of 4.95 °C observed in the sunny periods.

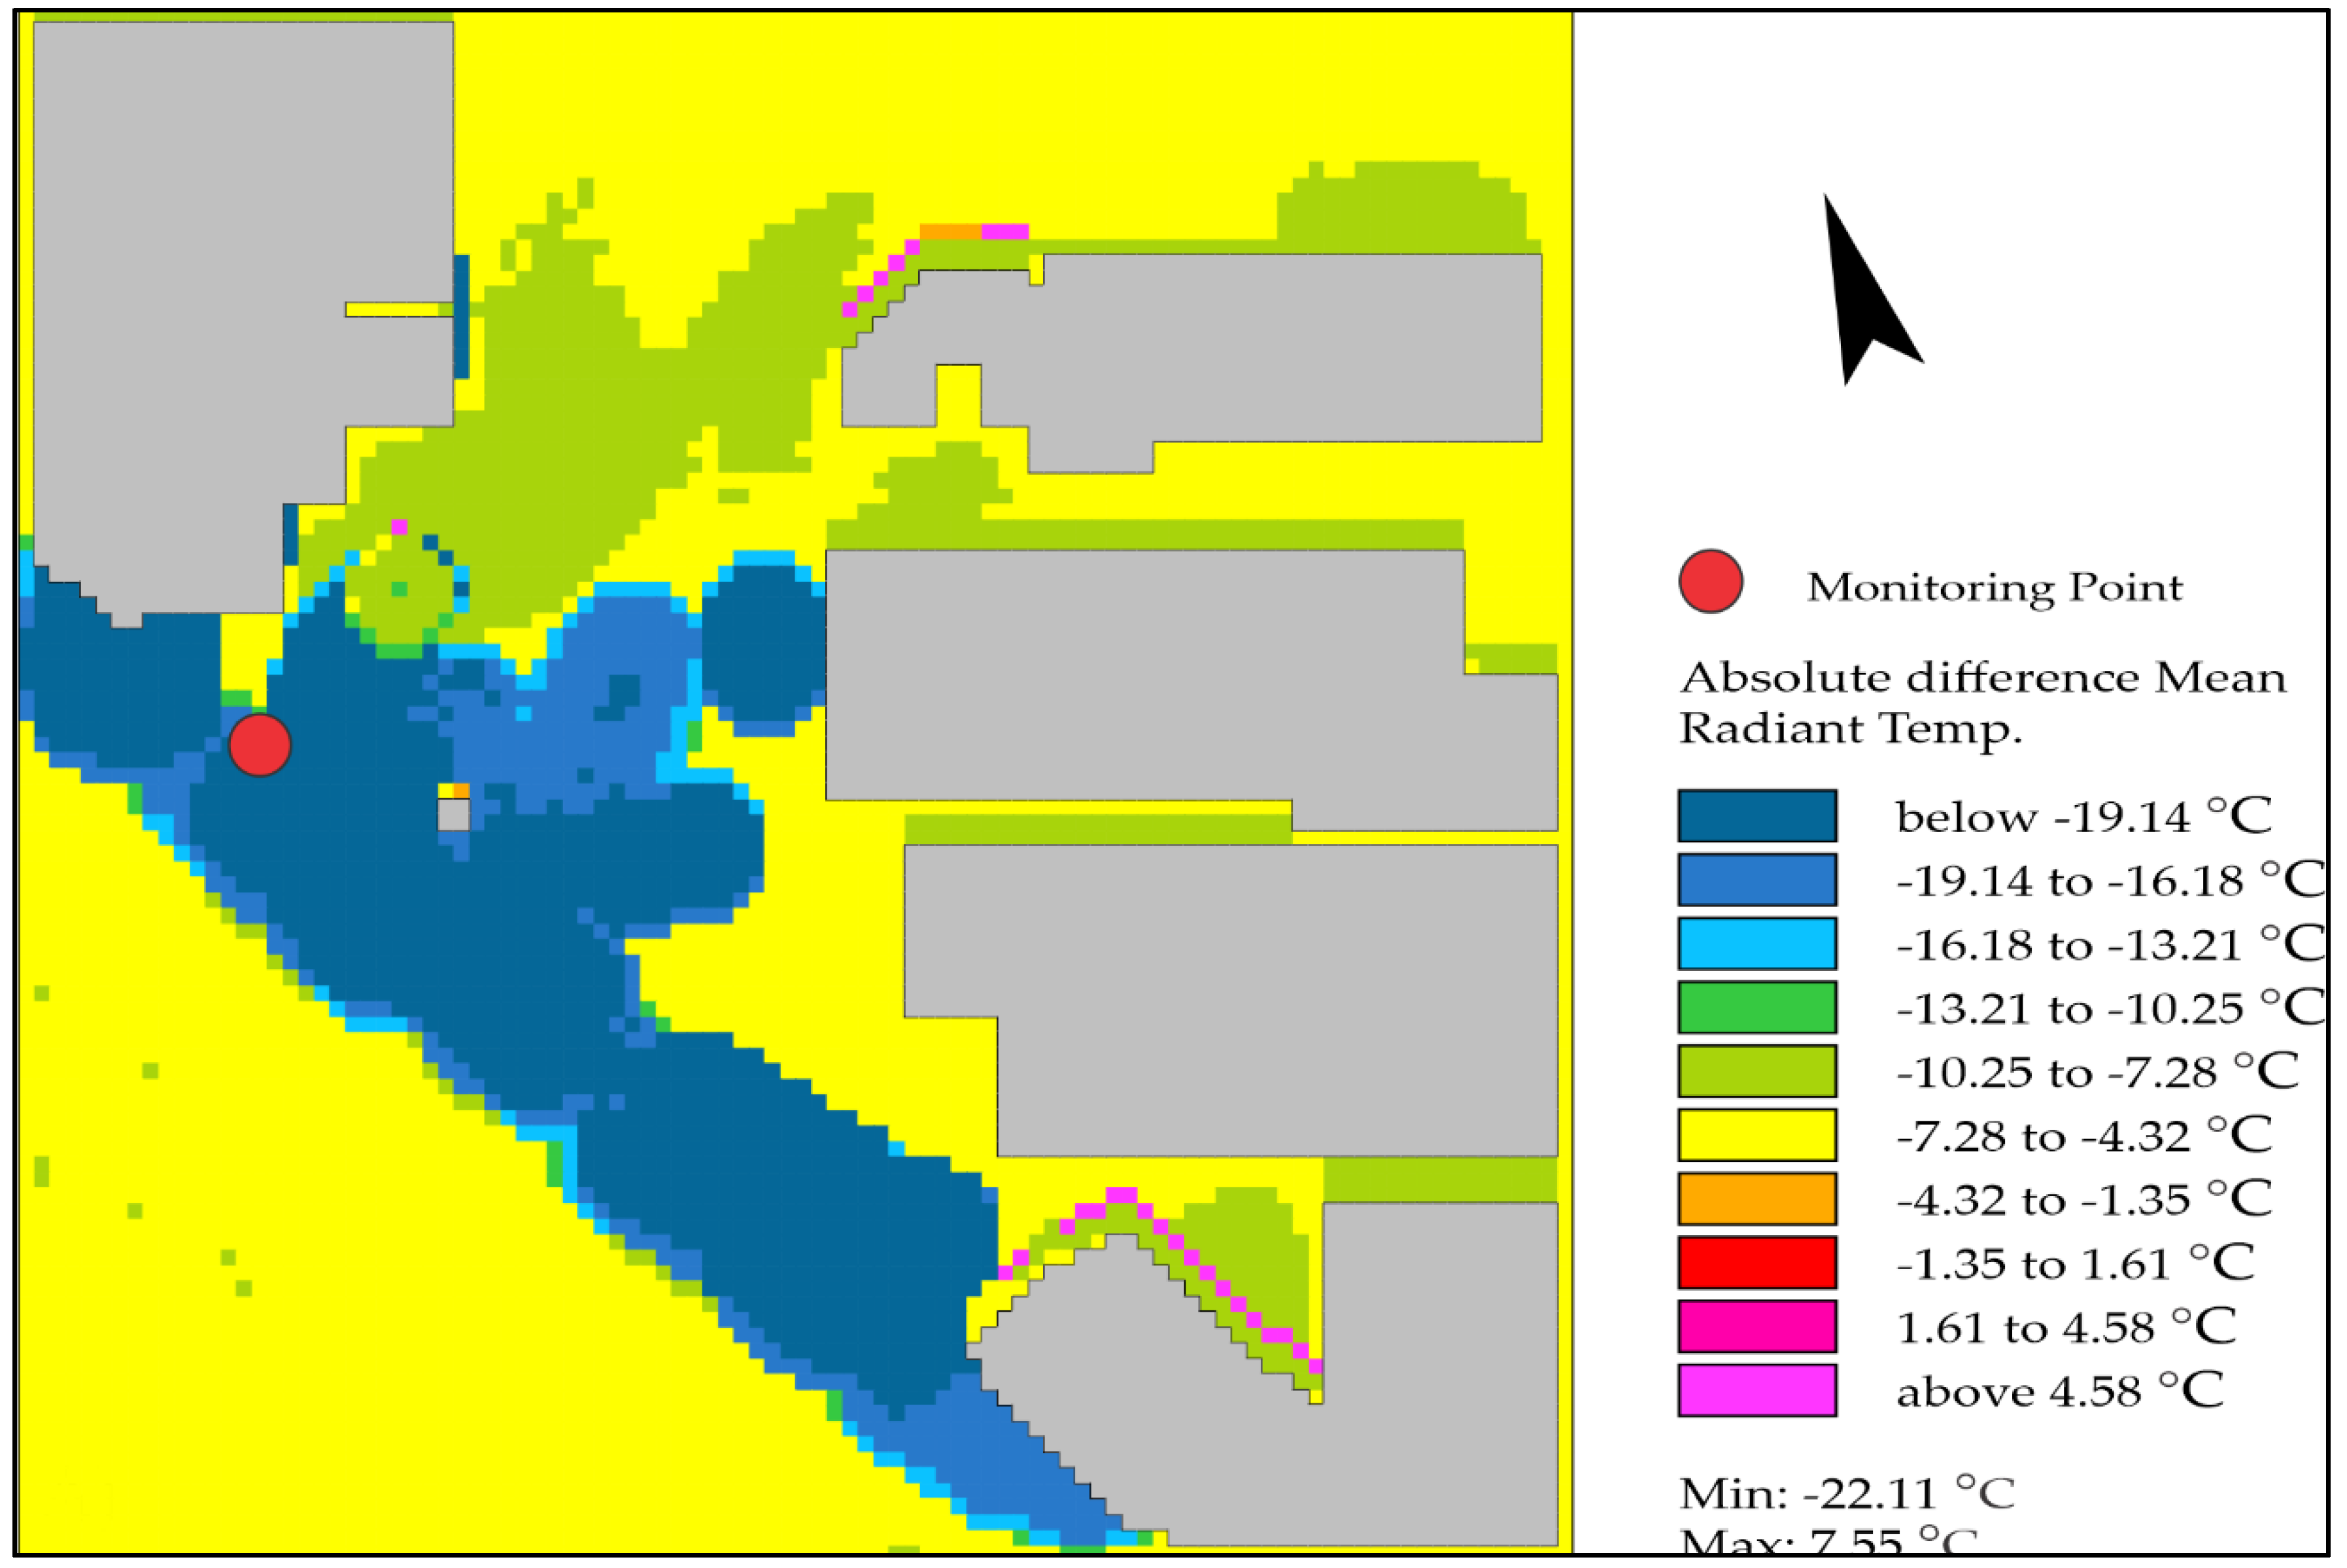
3.3.2. Mean Radiant Temperature

The results presented in Figure 14 express the differences between the base scenario and the effects of incorporating vegetation (NBS scenario) on the average radiant temperature, measured at the pedestrian level for the solar noon period.
In general, when observing the differences between the base scenario and the NBS scenario, there was an estimated reduction in MRT in the largest proportion of the map, between −7.28 °C and −4.32 °C, identified in yellow. The greatest reduction was estimated for the central region of the map, visible with the colors in blue tones, followed by colors close to the green, located mostly near the buildings. Only a few small points are shown by orange and pink colors, which identify smaller reductions in MRT.
Looking at the differences in the study area for the noon period, the greatest reductions in MRT were simulated for the areas where there was a major introduction of trees, assuming their full development, with reduction that reached over 19 °C. At these locations, solar radiation was partially absorbed by the leaves, avoiding some reflection to other surfaces [64]. In addition to receiving direct radiation, the vegetation intercepted the radiation coming from horizontal and vertical surfaces.
It is important to mention that, during this simulated period, the area was mostly affected by direct solar radiation, forming a distinctive low temperature in shadow areas near buildings, which is represented by green. In these areas, milder reductions occurred, ranging from 10.25 °C to 7.28 °C.
Figure 14 also shows that changes in the surroundings, such as the addition of trees and vegetation; different urban materials with different reflectivity and emissivity; and building configurations (orientations and inclinations), can favor radiative exchanges between building facades and surfaces, causing increases in absorption or reductions in radiation [36].
Differences between the base and the NBS scenario change throughout the study timeframe for the reference location (Figure 15). During the night, differences were small, with slightly higher temperatures in the NBS scenario. This difference can be explained by the lower sky view factor (SVF) near tree canopies, which can reduce the nighttime longwave radiation emissions [54].
For the afternoon period, the decreases in both air temperature and MRT were more expressive, suggesting that the changes incorporated for the new scenario provided decreases in air temperature. Successful incorporations of trees were also studied by Ferwati et al. [65].
For sunrise, the reference location in the base scenario was more exposed to solar radiation when compared with the projected NBS scenario, a factor that, combined with the thermal behavior of the vegetated surroundings, explains the lower MRT simulated for this second scenario.
The base scenario overestimated the MRT when compared to the monitored data (Figure 7), mainly in the afternoon period, and this overestimation was also reported by other authors using ENVI-Met [55,63,66,67]. Thus, the results suggest that the calculation of the radiation fluxes may not be entirely accurate and may explain differences in the modeled results.

4. Limitations

As previously suggested in this article, ENVI-Met still has some limitations, such as the ones regarding the thermal behavior of building walls, which can influence microclimate, as a single material is assumed by the model, differing from reality [15]. Additionally, the simulations of air temperature and relative humidity are adjusted by the model during the simulations, whereas wind conditions and cloudiness remain almost unchanged [68].
Another limitation is associated with MRT and the estimation of radiative fluxes, which seems to be slightly inaccurate, even though a strong correlation was found between the modeled and measured data [69]. Finally, anthropogenic heating, vehicles and mechanical cooling systems that can alter thermal conditions are not accounted for in the model [44].

5. Conclusions

This study used climate modeling to estimate the potential benefits of incorporating NBS in the public road infrastructure of an industrial park through ENVI-Met simulation. With the use of this modeling software, it was possible to estimate differentiated patterns in the behavior of air temperature, relative humidity, mean radiant temperature and wind speed for two scenarios: a base and an NBS scenario. When comparing these two scenarios, for a summer day, the results show potential reductions in air temperature as a potential effect of the implementation of an NBS project, including new vegetation elements, changes in land cover and the incorporation of water bodies.
NBS proved to be effective for the particular study, demonstrating that it is possible to transverse cities into greener and more innovative models. This concept has significant potential in climate change mitigation and adaptation in urban areas, and it contributes to the resilience and livability of cities.
The results show a good correlation between the values that were measured and the base scenario in all climatic parameters, with strong to very strong correlations. In a more detailed data comparison, coherent behavior was observed, although with overestimations in the air temperature and MRT. However, for MRT, the values were overestimated by ENVI-Met, mostly in the period from sunrise to noon.
Finally, when comparing the simulation of the current scenario with the new NBS scenario, positive results were obtained for all periods, suggesting that the proposed Nature-Based Solutions may potentially decrease air temperature for the simulation context. Overall, the software was able to estimate air temperature and other variables. Nonetheless, the simulation maps still showed inconsistent results, which can be partially attributed to the limitations of the simulation process.
A possible method for future modeling design is to measure multiple points within a domain and to study other ways to simulate the data using the full forcing method to draw the best conclusions and to confirm the quality of ENVI-Met simulations.
Under the INDNATUR Project framework, additional studies and actions will be carried out, including: ENVI-Met simulations for all seasons, with special emphasis on extreme climate circumstances (cold and heat); and validation campaigns, with on-site data collection to validate the simulated results. In addition, as INDNATUR interventions already took place, data will be continuously collected with the help of on-site sensors (air temperature and relative humidity), complemented by monitoring campaigns. This newly acquired data, along with additional modeling (e.g., different times of day), will provide further understanding on the potential benefits of NBS in industrial parks.

Author Contributions

Conceptualization, A.G. and F.M.A.; methodology, A.G. and F.M.A.; software, F.M.A.; validation, A.G. and M.R.d.C.-E.; formal analysis, F.M.A.; investigation, F.M.A.; resources, A.G.; writing—original draft preparation, F.M.A.; writing—review and editing, A.G.; visualization, F.M.A.; supervision, A.G.; project administration, M.R.d.C.-E.; funding acquisition, M.R.d.C.-E. All authors have read and agreed to the published version of the manuscript.

Funding

Interreg V-A Spain-Portugal POCTEP 2014–2020, European Commission, under ERDF (European Regional Development Fund). Project code: 0599_INDNATUR_2_E.

Institutional Review Board Statement

Not applicable.

Informed Consent Statement

Not applicable.

Data Availability Statement

Not applicable.

Acknowledgments

The authors are grateful to the Foundation for Science and Technology (FCT, Portugal) for financial support by national funds FCT/MCTES to CIMO (UIDB/00690/2020). Appreciation must also go to the other INTERREG POCTEP INDNATUR Project partners for the help and support during this study with the provision of means that helped a lot in the research. To the Polytechnic Institute of Bragança and the University of Valladolid that supported the collaboration in the project.

Conflicts of Interest

The authors declare no conflict of interest. The funders had no role in the design of the study; in the collection, analyses or interpretation of data; in the writing of the manuscript; or in the decision to publish the results.

Appendix A

Figure A1. Graphic of the area in which the different plant species are indicated.
Infrastructures 07 00085 g0a1

References

  1. Tourinho, L.; Prevedello, J.A.; Carvalho, B.M.; Rocha, D.S.B.; Vale, M.M. Macroscale Climate Change Predictions Have Little Influence on Landscape-Scale Habitat Suitability. Perspect. Ecol. Conserv. 2022, 20, 29–37. [Google Scholar] [CrossRef]
  2. Mehryar, S.; Sasson, I.; Surminski, S. Supporting Urban Adaptation to Climate Change: What Role Can Resilience Measurement Tools Play? Urban Clim. 2022, 41, 101047. [Google Scholar] [CrossRef]
  3. Shi, C.; Guo, N.; Zeng, L.; Wu, F. How Climate Change Is Going to Affect Urban Livability in China. Clim. Serv. 2022, 26, 100284. [Google Scholar] [CrossRef]
  4. Ray Biswas, R.; Sharma, R.; Gyasi-Agyei, Y. Urban Water Crises: Making Sense of Climate Change Adaptation Barriers and Success Parameters. Clim. Serv. 2022, 27, 100302. [Google Scholar] [CrossRef]
  5. Ribeiro, H.; Pesquero, C.R.; De Sousa Zanotti Stagliorio Coelho, M. Clima Urbano e Saúde: Uma Revisão Sistematizada Da Literatura Recente. Estud. Av. 2016, 30, 67–82. [Google Scholar] [CrossRef] [Green Version]
  6. Oke, T.R.; Mills, G.; Christen, A.; Voogt, J.A. Urban Climates, 1st ed.; Sheridan Books, Inc.: Cambridge, UK, 2017; ISBN 9781139016476. [Google Scholar]
  7. Stewart, I.D.; Oke, T.R. Local Climate Zones for Urban Temperature Studies. Bull. Am. Meteorol. Soc. 2012, 93, 1879–1900. [Google Scholar] [CrossRef]
  8. Landsberg, H. The Urban Climate; Academic Press: Cambridge, MA, USA, 1981; Volume 53, ISBN 9788578110796. [Google Scholar]
  9. Iain Stewart, G.M. The Urban Heat Island, 1st ed.; Elsevier: Amsterdam, The Netherlands, 2021; ISBN 9780128150177. [Google Scholar]
  10. Oke, T.R. Boundary Layer Climates, 2nd ed.; Routledge: London, UK, 2002. [Google Scholar]
  11. Gonçalves, A.; Ornellas, G.; Ribeiro, A.C.; Maia, F.; Rocha, A.; Feliciano, M. Urban Cold and Heat Island in the City of Bragança (Portugal). Climate 2018, 6, 70. [Google Scholar] [CrossRef] [Green Version]
  12. Vahmani, P.; Luo, X.; Jones, A.; Hong, T. Anthropogenic Heating of the Urban Environment: An Investigation of Feedback Dynamics between Urban Micro-Climate and Decomposed Anthropogenic Heating from Buildings. Build. Environ. 2022, 213, 108841. [Google Scholar] [CrossRef]
  13. Gettelman, A.; Rood, R.B. Demystifying Climate Models: A Users Guide to Earth System Models; Springer: Berlin/Heidelberg, Germany, 2016; Volume 2, ISBN 9783662489574. [Google Scholar]
  14. Liu, M.; Lo, K. A Comparative Review of Urban Climate Governance in Chinese and Western Contexts. Urban Gov. 2021; in press. [Google Scholar] [CrossRef]
  15. Crank, P.J.; Sailor, D.J.; Ban-Weiss, G.; Taleghani, M. Evaluating the ENVI-Met Microscale Model for Suitability in Analysis of Targeted Urban Heat Mitigation Strategies. Urban Clim. 2018, 26, 188–197. [Google Scholar] [CrossRef]
  16. Raymond, C.M.; Frantzeskaki, N.; Kabisch, N.; Berry, P.; Breil, M.; Nita, M.R.; Geneletti, D.; Calfapietra, C. A Framework for Assessing and Implementing the Co-Benefits of Nature-Based Solutions in Urban Areas. Environ. Sci. Policy 2017, 77, 15–24. [Google Scholar] [CrossRef]
  17. European Commission. Towards an EU Research and Innovation Policy Agenda for Nature-Based Solutions & Re-Naturing Cities: Final Report of the Horizon 2020 Expert Group on “Nature-Based Solutions and Re-Naturing Cities”; European Commission: Brussels, Belgium, 2015; ISBN 9789279460517. [Google Scholar]
  18. Toxopeus, H.; Kotsila, P.; Conde, M.; Katona, A.; van der Jagt, A.P.N.; Polzin, F. How ‘Just’ Is Hybrid Governance of Urban Nature-Based Solutions? Cities 2020, 105, 102839. [Google Scholar] [CrossRef]
  19. Faivre, N.; Fritz, M.; Freitas, T.; de Boissezon, B.; Vandewoestijne, S. Nature-Based Solutions in the EU: Innovating with Nature to Address Social, Economic and Environmental Challenges. Environ. Res. 2017, 159, 509–518. [Google Scholar] [CrossRef]
  20. Devecchi, A.M.; Chirmici, A.C.; Simonetti, C.; Thiago, B.C. Desenhando Cidades Com Soluções Baseadas Na Natureza. In Parcerias Estratégicas; CGEE: Brasilia, Brasil, 2020; pp. 217–233. ISBN 1413-9375. [Google Scholar]
  21. Kabisch, N.; Frantzeskaki, N.; Pauleit, S.; Naumann, S.; Davis, M.; Artmann, M.; Haase, D.; Knapp, S.; Korn, H.; Stadler, J.; et al. Nature-Based Solutions to Climate Change Mitigation and Adaptation in Urban Areas: Perspectives on Indicators, Knowledge Gaps, Barriers, and Opportunities for Action. Ecol. Soc. 2016, 21, 39. [Google Scholar] [CrossRef] [Green Version]
  22. European Commission. Evaluating the Impact of Nature-Based Solutions: A Handbook for Practitioners; Dumitru, A., Wendling, L., Eds.; European Commission: Brussels, Belgium, 2021; ISBN 9789276229612. [Google Scholar]
  23. Frantzeskaki, N. Seven Lessons for Planning Nature-Based Solutions in Cities. Environ. Sci. Policy 2019, 93, 101–111. [Google Scholar] [CrossRef]
  24. Ávila, L.B. Instrumento Multicritério de Análise Para a Implantação de Zonas Industriais: Variáveis Legais, Antrópicas e Naturais. 2018. Available online: http://www.repositorio.jesuita.org.br/handle/UNISINOS/7088 (accessed on 15 April 2022).
  25. Presumido, P.H.; Gonçalves, A.; Feliciano, M.; Igrejas, G.; Romero, F. Projeto Rehabind-Qualidade Ambiental Em Áreas Industriais Transfronteiriças-Mirandela e Zamora (Espanha). In Livro de Atas da Conferência Internacional de Ambiente em Língua Portuguesa, Avaito, Poretugal, 8–10 May 2018; Universidade de Aveiro: Aveiro, Portugal, 2018; pp. 21–24. ISBN 978-972-789-540-3. [Google Scholar]
  26. González, J.E.; Ramamurthy, P.; Bornstein, R.D.; Chen, F.; Bou-Zeid, E.R.; Ghandehari, M.; Luvall, J.; Mitra, C.; Niyogi, D. Urban Climate and Resiliency: A Synthesis Report of State of the Art and Future Research Directions. Urban Clim. 2021, 38, 100858. [Google Scholar] [CrossRef]
  27. Geophysical Fluid Dynamics Laboratory. Climate Modeling.
  28. Gusson, C.S.; Duarte, D.H.S. Effects of Built Density and Urban Morphology on Urban Microclimate—Calibration of the Model ENVI-Met V4 for the Subtropical Sao Paulo, Brazil. Procedia Eng. 2016, 169, 2–10. [Google Scholar] [CrossRef]
  29. Daniela Bruse, Michael Bruse, Helge Simon ENVI_MET GmbH 2020.
  30. Middel, A.; Häb, K.; Brazel, A.J.; Martin, C.A.; Guhathakurta, S. Impact of Urban Form and Design on Mid-Afternoon Microclimate in Phoenix Local Climate Zones. Landsc. Urban Plan. 2014, 122, 16–28. [Google Scholar] [CrossRef]
  31. Bruse, M.; Fleer, H. Simulating Surface-Plant-Air Interactions inside Urban Environments with a Three Dimensional Numerical Model. Environ. Model. Softw. 1998, 13, 373–384. [Google Scholar] [CrossRef]
  32. Bruse, M. ENVI-Met 3.0: Updated Model Overview; University of Bochum: Bochum, Germany, 2004; pp. 1–12. [Google Scholar]
  33. Duarte, D.H.S.; Shinzato, P.; dos Santos Gusson, C.; Alves, C.A. The Impact of Vegetation on Urban Microclimate to Counterbalance Built Density in a Subtropical Changing Climate. Urban Clim. 2015, 14, 224–239. [Google Scholar] [CrossRef]
  34. McRae, I.; Freedman, F.; Rivera, A.; Li, X.; Dou, J.; Cruz, I.; Ren, C.; Dronova, I.; Fraker, H.; Bornstein, R. Integration of the WUDAPT, WRF, and ENVI-Met Models to Simulate Extreme Daytime Temperature Mitigation Strategies in San Jose, California. Build. Environ. 2020, 184, 107180. [Google Scholar] [CrossRef]
  35. Cárdenas Celis, A.M.; Silva, C.F. Protocolo de Elaboração de Arquivo Climático de Cidades Brasileiras Para o Software ENVI-Met 4.0. Paranoá Cad. Arquitetura Urban. 2018, 22, 32–50. [Google Scholar] [CrossRef]
  36. Ali-Toudert, F. Exploration of the Thermal Behaviour and Energy Balance of Urban Canyons in Relation to Their Geometrical and Constructive Properties. Build. Environ. 2021, 188, 107466. [Google Scholar] [CrossRef]
  37. Ali-Toudert, F.; Mayer, H. Numerical Study on the Effects of Aspect Ratio and Orientation of an Urban Street Canyon on Outdoor Thermal Comfort in Hot and Dry Climate. Build. Environ. 2006, 41, 94–108. [Google Scholar] [CrossRef]
  38. Aslam, A.; Rana, I.A. The Use of Local Climate Zones in the Urban Environment: A Systematic Review of Data Sources, Methods, and Themes. Urban Clim. 2022, 42, 101120. [Google Scholar] [CrossRef]
  39. Tsoka, S.; Tsikaloudaki, A.; Theodosiou, T. Analyzing the ENVI-Met Microclimate Model’s Performance and Assessing Cool Materials and Urban Vegetation Applications–A Review. Sustain. Cities Soc. 2018, 43, 55–76. [Google Scholar] [CrossRef]
  40. Salata, F.; Golasi, I.; Petitti, D.; de Lieto Vollaro, E.; Coppi, M.; de Lieto Vollaro, A. Relating Microclimate, Human Thermal Comfort and Health during Heat Waves: An Analysis of Heat Island Mitigation Strategies through a Case Study in an Urban Outdoor Environment. Sustain. Cities Soc. 2017, 30, 79–96. [Google Scholar] [CrossRef]
  41. Maleki, A.; Mahdavi, A.; Design, U. Evaluation of Urban Heat Islands Mitigation Strategies using 3dimentional Urban Micro-climate Model Envi-Met. Asian J. Civ. Eng. 2016, 17, 357–371. [Google Scholar]
  42. Evola, G.; Gagliano, A.; Fichera, A.; Marletta, L.; Martinico, F.; Nocera, F.; Pagano, A. UHI Effects and Strategies to Improve Outdoor Thermal Comfort in Dense and Old Neighbourhoods. Energy Procedia 2017, 134, 692–701. [Google Scholar] [CrossRef]
  43. Tsilini, V.; Papantoniou, S.; Kolokotsa, D.D.; Maria, E.A. Urban Gardens as a Solution to Energy Poverty and Urban Heat Island. Sustain. Cities Soc. 2015, 14, 323–333. [Google Scholar] [CrossRef]
  44. Morakinyo, T.E.; Lam, Y.F. Simulation Study on the Impact of Tree-Configuration, Planting Pattern and Wind Condition on Street-Canyon’s Micro-Climate and Thermal Comfort. Build. Environ. 2016, 103, 262–275. [Google Scholar] [CrossRef]
  45. Lobaccaro, G.; Acero, J.A. Comparative Analysis of Green Actions to Improve Outdoor Thermal Comfort inside Typical Urban Street Canyons. Urban Clim. 2015, 14, 251–267. [Google Scholar] [CrossRef]
  46. CENIE Centro Internacional Sobre o Envelhecimento (CENIE)—Instituto Nacional de Estadística. Available online: https://cenie.eu/pt/observatorio/demografia/valladolid (accessed on 10 May 2022).
  47. Instituto Nacional de Estadística (INE) Cifras de Población. Available online: https://www.valladolid.es/es/ciudad/estadisticas/utilidad/servicios/observatorio-urbano-datos-estadisticos-ciudad/datos-estadisticos-temas/informacion-estadistica-ciudad/poblacion/cifras-poblacion (accessed on 13 May 2021).
  48. Propuesta de Orden de la Consejería de Empleo e Industria por la Que Se Aprueba el Programa Territorial de Fomento para Medina del Campo y Su Entorno 2021–2024. Available online: https://transparencia.jcyl.es/participacion/Participaci%C3%B3n%20Empleo%20e%20Industria/2021-10-21%20Propuesta%20Orden%20PTF%20MEDINA%20DEL%20CAMPO%20v4.pdf (accessed on 15 February 2022).
  49. De Souza, V.S. Mapa Climático Urbano Da Cidade De João Pessoa-Pb. In Encontro Latino-Americano de Conforto no Ambiente Construído; Federal University of Paraíba: João Pessoa, Brazil, 2019. [Google Scholar]
  50. Simon, H.; Kissel, L.; Bruse, M. Evaluation of ENVI-Met’s Multiple-Node Model and Estimation of Indoor Climate. In Proceedings of the PLEA, Edinburgh, UK, 2–5 July 2017; Volume 2, pp. 2173–2180. [Google Scholar]
  51. E Silva, C.F.; Romero, M.A.B. Simulação do Clima Urbano do Distrito Federal: Experimentando o ENVI-Met; Editora da Universidade de Brasília: Brasília, Brasil, 2020. [Google Scholar]
  52. Oke, T.R. The Energetic Basis of the Urban Heat Island. Q. J. R. Meteorol. Soc. 1982, 108, 1–24. [Google Scholar] [CrossRef]
  53. Mohammad, P.; Aghlmand, S.; Fadaei, A.; Gachkar, S.; Gachkar, D.; Karimi, A. Evaluating the Role of the Albedo of Material and Vegetation Scenarios along the Urban Street Canyon for Improving Pedestrian Thermal Comfort Outdoors. Urban Clim. 2021, 40, 100993. [Google Scholar] [CrossRef]
  54. Acero, J.A.; Herranz-Puaascl, K. A Comparison of Thermal Comfort Conditions in Four Urban Spaces by Means of Measurements and Modelling Techniques. Build. Environ. 2015, 93, 245–257. [Google Scholar] [CrossRef]
  55. Ketterer, C.; Matzarakis, A. Human-Biometeorological Assessment of Heat Stress Reduction by Replanning Measures in Stuttgart, Germany. Landsc. Urban Plan. 2014, 122, 78–88. [Google Scholar] [CrossRef]
  56. Shinzato, P.; Simon, H.; Silva Duarte, D.H.; Bruse, M. Calibration Process and Parametrization of Tropical Plants Using ENVI-Met V4–Sao Paulo Case Study. Archit. Sci. Rev. 2019, 62, 112–125. [Google Scholar] [CrossRef]
  57. Ouyang, W.; Sinsel, T.; Simon, H.; Morakinyo, T.E.; Liu, H.; Ng, E. Evaluating the Thermal-Radiative Performance of ENVI-Met Model for Green Infrastructure Typologies: Experience from a Subtropical Climate. Build. Environ. 2022, 207, 108427. [Google Scholar] [CrossRef]
  58. Forouzandeh, A. Prediction of Surface Temperature of Building Surrounding Envelopes Using Holistic Microclimate ENVI-Met Model. Sustain. Cities Soc. 2021, 70, 102878. [Google Scholar] [CrossRef]
  59. Nasrollahi, N.; Hatami, Z.; Taleghani, M. Development of Outdoor Thermal Comfort Model for Tourists in Urban Historical Areas; A Case Study in Isfahan. Build. Environ. 2017, 125, 356–372. [Google Scholar] [CrossRef]
  60. Acero, J.A.; Arrizabalaga, J. Evaluating the Performance of ENVI-Met Model in Diurnal Cycles for Different Meteorological Conditions. Theor. Appl. Climatol. 2018, 131, 455–469. [Google Scholar] [CrossRef]
  61. Salata, F.; Golasi, I.; de Lieto Vollaro, R.; de Lieto Vollaro, A. Urban Microclimate and Outdoor Thermal Comfort. A Proper Procedure to Fit ENVI-Met Simulation Outputs to Experimental Data. Sustain. Cities Soc. 2016, 26, 318–343. [Google Scholar] [CrossRef]
  62. Perini, K.; Chokhachian, A.; Dong, S.; Auer, T. Modeling and Simulating Urban Outdoor Comfort: Coupling ENVI-Met and TRNSYS by Grasshopper. Energy Build. 2017, 152, 373–384. [Google Scholar] [CrossRef]
  63. Ali-Toudert, F.; Mayer, H. Thermal Comfort in an East-West Oriented Street Canyon in Freiburg (Germany) under Hot Summer Conditions. Theor. Appl. Climatol. 2007, 87, 223–237. [Google Scholar] [CrossRef]
  64. Lopez-Cabeza, V.P.; Alzate-Gaviria, S.; Diz-Mellado, E.; Rivera-Gomez, C.; Galan-Marin, C. Albedo Influence on the Microclimate and Thermal Comfort of Courtyards under Mediterranean Hot Summer Climate Conditions. Sustain. Cities Soc. 2022, 81, 103872. [Google Scholar] [CrossRef]
  65. Ferwati, S.; Skelhorn, C.; Ferwati, S.; Shandas, V.; Makido, Y. Urban Form and Variation in Temperatures. In Urban Adaptation to Climate Change; Springer: Berlin/Heidelberg, Germany, 2020. [Google Scholar]
  66. Ali-Toudert, F.; Mayer, H. Effects of Asymmetry, Galleries, Overhanging Façades and Vegetation on Thermal Comfort in Urban Street Canyons. Sol. Energy 2007, 81, 742–754. [Google Scholar] [CrossRef]
  67. Müller, N.; Kuttler, W.; Barlag, A.B. Counteracting Urban Climate Change: Adaptation Measures and Their Effect on Thermal Comfort. Theor. Appl. Climatol. 2014, 115, 243–257. [Google Scholar] [CrossRef] [Green Version]
  68. Huttner, S.; Bruse, M. Numerical Modeling of the Urban Climate—a Preview on ENVI-MET 4.0. In Proceedings of the 7th International Conference on Urban Climate ICUC-7, Yokohama, Japan, 29 June–3 July 2009; 2009; pp. 1–4. [Google Scholar]
  69. Lee, H.; Mayer, H.; Chen, L. Contribution of Trees and Grasslands to the Mitigation of Human Heat Stress in a Residential District of Freiburg, Southwest Germany. Landsc. Urban Plan. 2016, 148, 37–50. [Google Scholar] [CrossRef]
Figure 1. Location map for the Argales region in Valladolid/Spain.
Infrastructures 07 00085 g001
Figure 2. Location of the study area.
Infrastructures 07 00085 g002
Figure 3. A 3D model of the study area before the INDNATUR Project intervention.
Infrastructures 07 00085 g003
Figure 4. A 3D model of the study area after the INDNATUR Project intervention.
Infrastructures 07 00085 g004
Figure 5. Monitored and simulation air temperature (Base Scenario) at the monitoring location.
Infrastructures 07 00085 g005
Figure 6. Monitored and simulation relative humidity (Base Scenario) at the monitoring location.
Infrastructures 07 00085 g006
Figure 7. Monitored wind speed between actual and modeled scenarios.
Infrastructures 07 00085 g007
Figure 8. Monitored mean radiant temperature between actual and modeled scenarios.
Infrastructures 07 00085 g008
Figure 9. Simulated air temperature for the base and NBS scenarios. Hours: (A1,A2), 5 h; (B1,B2), 7 h; (C1,C2), 12 h; (D1,D2), 17 h.
Infrastructures 07 00085 g009
Figure 10. Simulated wind speed for the base scenarios and scenarios with NBS interventions. Hours: (A1,A2), 5 h; (B1,B2), 7 h; (C1,C2), 12 h; (D1,D2), 17 h.
Infrastructures 07 00085 g010
Figure 11. Simulated mean radiant temperature for the base scenarios and scenarios with NBS interventions. Hours: (A1,A2), 5 h; (B1,B2), 7 h; (C1,C2),12 h; (D1,D2), 17 h.
Infrastructures 07 00085 g011
Figure 12. The air temperature difference between the base scenario and NBS scenario at noon.
Infrastructures 07 00085 g012
Figure 13. Air temperature profile for the base scenario and NBS scenario for the measurement location.
Infrastructures 07 00085 g013
Figure 14. Differences in mean radiant temperature between the base scenario and NBS scenario at noon.
Infrastructures 07 00085 g014
Figure 15. Mean radiant temperature profile for the base scenario and NBS scenario, considering the initial monitoring location.
Infrastructures 07 00085 g015
Table 1. Setting up climate data for microclimate simulation in ENVI_met®.
Ta (°C)RH (%)WS (m/s)WindDir (deg)
Input Data
Maximum27.6088.531.4121.5
Minimum9.1922.60
Ta: Air Temperature; RH: Relative Humidity; WS: Wind Speed; WindDir: Wind Direction.
Publisher’s Note: MDPI stays neutral with regard to jurisdictional claims in published maps and institutional affiliations.

