Article

The Structural Reliability of the Usumacinta Bridge Using InSAR Time Series of Semi-Static Displacements

by
German Michel Guzman-Acevedo
1,
Juan A. Quintana-Rodriguez
2,
Jose Ramon Gaxiola-Camacho
3,
Guadalupe Esteban Vazquez-Becerra
1,
Vanessa Torres-Moreno
4 and
Jesus Guadalupe Monjardin-Quevedo
1,*
1
Department of Earth and Space Sciences, Autonomous University of Sinaloa, Culiacan 80040, Mexico
2
Department of Vehicle Engineering and Structural Integrity, Mexican Institute of Transportation, San Fandila 76703, Mexico
3
Department of Civil Engineering, Autonomous University of Sinaloa, Culiacan 80040, Mexico
4
Department of Civil Engineering, Uruapan Institute of Technology, Michoacan 60015, Mexico
*
Author to whom correspondence should be addressed.
Infrastructures 2023, 8(12), 173; https://doi.org/10.3390/infrastructures8120173
Submission received: 27 October 2023 / Revised: 21 November 2023 / Accepted: 27 November 2023 / Published: 4 December 2023

Abstract

:
In recent years, Interferometric Synthetic Aperture Radar (InSAR) technology has been able to determine the semi-static behavior of bridges. However, most of the research about the use of InSAR in the monitoring of bridges has been applied only in deterministic assessments of their performance. Therefore, in the current manuscript, the Usumacinta Bridge, located in Mexico, was evaluated based on a probabilistic methodology to define structural reliability using images from Sentinel-1. In addition, a controlled experiment was developed using a corner reflector (CR) to evaluate the capabilities of InSAR for determining vertical displacements. In the trial, the CR was designed, oriented, and implemented, finding discrepancies concerning leveling of less than 2 mm. On the other hand, the case of the alternative probabilistic approach integrates the reliability of structures theory and probability density functions (PDFs) of displacements obtained via InSAR technology. In summary, the proposed study focused on the analysis of two years of vertical displacements and monthly velocities; then, implementing the alternative probabilistic approach, the reliability index (β) and probability of risk (PR) of the bridge were extracted, respectively. Based on the results of the experimental part of the paper, the displacements indicated maximum and minimum values of reliability index of 8.1 and 3.4, respectively. Within this context, the mean and standard deviation obtained were 5.9 and 1.4, respectively. On the other hand, the monthly velocities showed a maximum probability of risk of 2.61%, minimum value of 1.5 × 10⁻⁵%, mean of 0.4%, and standard deviation of 0.8%. Hence, the above-documented results indicate that the Usumacinta Bridge did not suffer any damage during its overloading condition period.

1. Introduction

The main aim of people who work within the field of bridge engineering is to develop an optical methodology to reduce failures in these structures [1]. Therefore, different perspectives have been studied; for example, there are works focused on assessing materials [2,3,4,5], detecting damage [6], or proposing alternative measurement methodologies [7]. In this sense, the Interferometric Synthetic Aperture Radar (InSAR) technology is taking a relevant position in the field of Structural Health Monitoring (SHM). That last fact is justified by InSAR’s capability to determine displacements with high accuracy (millimeter/centimeter level) and remotely [8]. Thus, the evaluation of bridges can be easily complemented via the frequent acquisition of satellite images. This is solid progress considering that one of the most frequently used methodologies to evaluate the structural condition of bridges is based on visual inspections, which are carried out once per year at best, or at worst, such inspections are not performed during long time periods, creating a risk for the integrity of the bridges as well as the safety of users.
Due to the sampling frequency of images, InSAR can be used to analyze the semi-static performance of structures. This kind of structural performance is determined by displacements produced by slow loadings such as scour, loss of stiffness, and changes in temperature. In the scientific literature, there are examples of investigations where InSAR technology has been implemented in the SHM of bridges. For example, for the case of scour issues in bridges, Selvakumaran et al. (2018) [9] assessed displacements provoking the partial failure of the Tadcaster Bridge; Sosa and Bastos (2013) [10] extracted 5.5 years of displacements in the Hintze Ribeiro centennial bridge, where a velocity of −19.7 mm/year was found. On the other hand, the loss of stiffness in bridges using InSAR was studied by Jung et al. (2019) [11], where the long-term deflections on Kimdaejung and Muyoung Bridges were estimated. Vadivel et al. (2020) [12] analyzed the Deokyang and Kimdaejung Bridges, finding mean displacement velocities of −1.34 and −8.8 mm/year, respectively. In the case of displacements produced by changes in temperature, Cusson et al. (2018) [13] evaluated the thermal influence involved in InSAR time series with respect to a mathematical model. Some research, such as Milillo et al. (2019), Lanari et al. (2019), and Milillo et al. (2020) [14,15,16], has studied bridges after a collapse, like the case of the Morandi Bridge in Italy. In addition, there are scientific works that analyze the post-processing of InSAR displacements; within this frame of reference, Schlogl et al. (2020) [17] developed a sequence of steps to improve the InSAR time series for identifying random noise, tendency, and seasonal behavior. Ma et al. (2019) [18] proposed applying Gaussian filters to enhance InSAR time series. Xiong et al. (2021) [19] applied an Empirical Mode Decomposition (EMD) and the Augmented Dickey–Fuller (ADF) test to estimate changes in displacements. Huang et al. (2017) [20] estimated a regression model utilizing InSAR displacements. Moreover, some other investigations developed methodologies to evaluate InSAR time series with respect to state limits; Qin et al. (2021) [21] compared InSAR displacements against the limits planted by a transportation norm (Highway Bridge Technical Condition Evaluation Standard JTGT H21-2011 [22]) in a deterministic manner. The University of Virginia and the US Department of Transportation (2016) [23] proposed general monthly and annual limits for evaluating the vertical displacements of bridges using InSAR. Cusson D. et al. (2020) [24] proposed defining threshold values using thermal behaviors extracted from time series displacements. Giordano et al. (2022) [25] established the Satellite Analysis for Novelty Detection (SAND) methodology for defining abnormal displacements utilizing a statistical approach, which considers a period of displacements when the structure presents optimal operational conditions as an initial reference behavior.
From the current state of the art of the SHM of bridges implementing InSAR technology, one finds that most evaluations are deterministic in nature, comparing only certain performance thresholds. Therefore, the main objective of the proposed investigation is to move from deterministic to probabilistic analysis by applying a stochastic evaluation to extract the structural reliability of the Usumacinta Bridge, evaluating its semi-static displacements of the vertical component. It is important to mention that the Usumacinta Bridge was selected as a case study because it was affected by an overloading condition provoked by vehicles from November 2022 to March 2023. Moreover, it is noteworthy to state that the reliability evaluation was calculated based on the structure’s probability of risk, which was estimated using statistics, two thresholds, and a set of InSAR time series estimated with Sentinel-1 images. In addition, a controlled experiment was developed to evaluate the competencies of InSAR in the field of SHM. In the trial, a corner reflector (CR) was designed, oriented, and implemented.
In summary, this paper is divided into seven sections: the description of the Usumacinta Bridge is defined in Section 2; the proposed methodology to define the structural reliability is presented in Section 3; the controlled test and the one applied to the real case are covered in Section 4 and Section 5, respectively; Section 6 shows the discussions and Section 7 reports the main conclusions of the investigation presented in this manuscript.

2. Case Study

Currently, one of the most important projects in railway infrastructure to be completed in Mexico is the well-known Tren Maya (https://www.gob.mx/trenmaya (accessed on 26 November 2023). This infrastructure project represents the construction of 1525 km of railways over the states of Yucatan, Quintana Roo, Campeche, Chiapas, and Tabasco. The main objective of such a project is to reduce the cost and time to transport tourists, passengers, and goods. Since the Tren Maya is a construction project of great magnitude, its development required a large workforce because of the various structural elements to be built in different regions of the country. Consequently, since those structural elements may be very heavy, the problem of transporting them from one federal entity to another arises, leading to possible structural damage to the road infrastructure through which they must travel. Therefore, the objective of this work is to monitor the structural safety of the Usumacinta Bridge, since a large amount of heavy structural elements for the Tren Maya construction were transported using such a bridge. To achieve this, the InSAR methodology is implemented. In addition, its structural reliability is extracted with an alternative probabilistic approach. Based on federal records, it is known that the Usumacinta Bridge was constantly affected during a period of 5 months (from November 2022 to March 2023) by the set of vehicles that transported extraordinary loads for the construction of the railway of the Tren Maya. Figure 1 illustrates the vehicles that circulated on the Usumacinta Bridge. Figure 1a describes a vehicle characterized by 65 tons and 30 m of weight and length, respectively. On the other hand, Figure 1b presents a structural element with an approximate weight of 132 tons and a total length of 68 m.
The Usumacinta Bridge is on the border of Tabasco and Chiapas states in Mexico, and is part of the Villahermosa–Chetumal highway (see Figure 2). This is a structure mainly composed of beams on two structural bodies with a length of 350 m, 25 m wide, and with spans of 50 m (see Figure 3). A great effort was made to search for historical information about the structure to obtain the architectonic and structural plans, but no information was available, perhaps because of the age of the structure.

3. Methodology

In this section, the methodology for extracting the structural reliability using InSAR time series is described. In this case, the well-known Persistent Scatterers (PS) InSAR approach [26,27] was implemented to determine the semi-static displacements in the vertical component of the Usumacinta Bridge. The images implemented in the InSAR processing were provided by Sentinel-1 with the attributes of a resolution equal to 5 × 20 m, VV polarization, Interferometric Wide (IW) as beam mode, and type L1 Single Look Complex (SLC). Furthermore, it must be stated that only the vertical component was analyzed because it is probable that most of the damage produced by the overloading condition of the Usumacinta Bridge could be present in such a direction. Along these lines, if the elastic limit of the beams is exceeded, cracks and deformations will occur, producing permanent deflections in the deck. Afterward, the InSAR time series of vertical displacements were improved by eliminating outliers’ values. Then, the monthly velocities were calculated, and finally, the reliability index and probability of risk for the structure were estimated with the help of an alternative probabilistic approach.

3.1. PS InSAR

The methodology implemented to process the satellite images was PS InSAR, which is a multi-temporal approach. It is based on considering only elements that reflect stability in the signal emitted by the satellite. Additionally, the set of resulting phases from the different interferograms is employed to reduce sources of errors and isolate the displacements suffered during the cover period. Because of the sake of space, in this paper, a comprehensive explanation of the PS InSAR methodology is not defined in detail. For more information about the approach, please refer to other scientific works [26,27].
Once the InSAR time series from some elements on the bridge had been obtained, the information had to be post-processed to improve the results. Therefore, since potential damages, produced by the overloading vehicles, were related to the vertical response of the structure, the InSAR time series were transformed into vertical coordinates using Equation (1), as follows [28]:
d v = d L O S C o s ( θ ) ,
where dv are the semi-static displacements in the vertical component, dLOS are the displacements in the line-of-sight direction, and θ is the incidence angle of the satellite.
Subsequently, the isolated displacements larger than μ ± , where μ is the mean value of the displacements and σ is the standard deviation, must be eliminated and replaced using a linear interpolation. In addition, the monthly velocities were calculated based on the resulting displacement time series. Finally, the reliability evaluation was calculated considering two circumstances: (1) displacements from April 2021 to April 2023, and (2) monthly velocities from the same two years as in point (1). In the second evaluation, the reliability index was not calculated because the analysis represented a different approach, indicating the chance to present values beyond the established limits.

3.2. Reliability Index

In the research presented in this manuscript, the structural risk of the Usumacinta Bridge is extracted in terms of the reliability index (β) and probability of risk (PR). The β value represents a factor indicating the level of structural safety, and the PR considers the proportion of the calculated discrepancies of the mean resistance and the influence of force, with respect to the combination of their standard deviation [29]. Based on the theory of probability, one way to compute the β value is by considering its corresponding PR, which expresses the likelihood that the bridge under consideration presents displacements larger than the threshold limits. Within this frame of reference, the PR can be calculated using the following equation, considering the threshold limits a and b, respectively [30]:
P R = 1 P a < X b ,
where X represents the displacements registered in the bridge; a is the lower threshold limit; and b is the upper threshold limit.
Figure 4 illustrates an example of the representation of the PDF of displacements where the a and b threshold limits are presented. In Figure 4, the shaded area represents the PR. Conversely, PS, generally known as the probability of security, represents the probability of obtaining displacements within the thresholds; in other words, PS is the complement of PR.
Considering the right-hand side of Equation (2) and what is illustrated in Figure 4, the value of P(a < Xb) can also be calculated as follows [31]:
P a < X b = a b f x x d x ,
where fx(x)dx is the best-fitted PDF of displacements, and which is selected based on the Chi-squared test of several analyzed distributions [30]. Considering this context, in this paper, the best-fitted PDF was selected between the following eleven PDFs: (1) t-student, (2) logistics, (3) log-logistics, (4) stable, (5) Weibull, (6) generalized extreme value, (7) extreme value, (8) gamma, (9) log-normal, (10) normal, and (11) t-location scale. These PDFs have been validated in other investigations for similar purposes [32].
As mentioned before, one of the most common factors representing the safety of structures is β [33]. The value of β is related to PR and can be solved by the next equation [30]:
β = Φ 1 1 P R ,
where Φ−1 is the inverse Cumulative Distribution Function (CDF), related to the PDF of the data (displacements) under consideration.
Another important part of the calculation of the β value is the correct selection of the threshold limits a and b, respectively. Such limits are chosen based on the recommendations of the American Association of State Highway and Transportation Officials (AASHTO). In this sense, AASHTO provides limit states for deflections (displacements) with respect to the type of bridge under consideration. For example, the span length divided by 1000 is recommended as a limit for structures with vehicular and pedestrian loads [29]. Thus, for the Usumacinta Bridge, the limits are ±50 mm because its span length is approximately 50 m. Based on this threshold limit and the displacement time series extracted via InSAR, the β values for the Usumacinta Bridge are calculated considering two years of data processing. Up to this point, it is still necessary to determine whether a certain magnitude of β is related to tolerable structural performance. Therefore, according to AASTHO guidelines [29], bridges such as the Usumacinta are designed to accomplish an ideal value of β equal to 3.5. On the other hand, considering the monthly velocity limit of 13 mm/month established by the University of Virginia and the US Department of Transportation [23], the probability of overpassing such a threshold limit is estimated as well. It is important to state that for this last case, the reliability index is not extracted since monthly velocity is not related to the behavior of resistance and the influence of force, respectively. However, it may be an indicator of the performance for the structure under consideration.

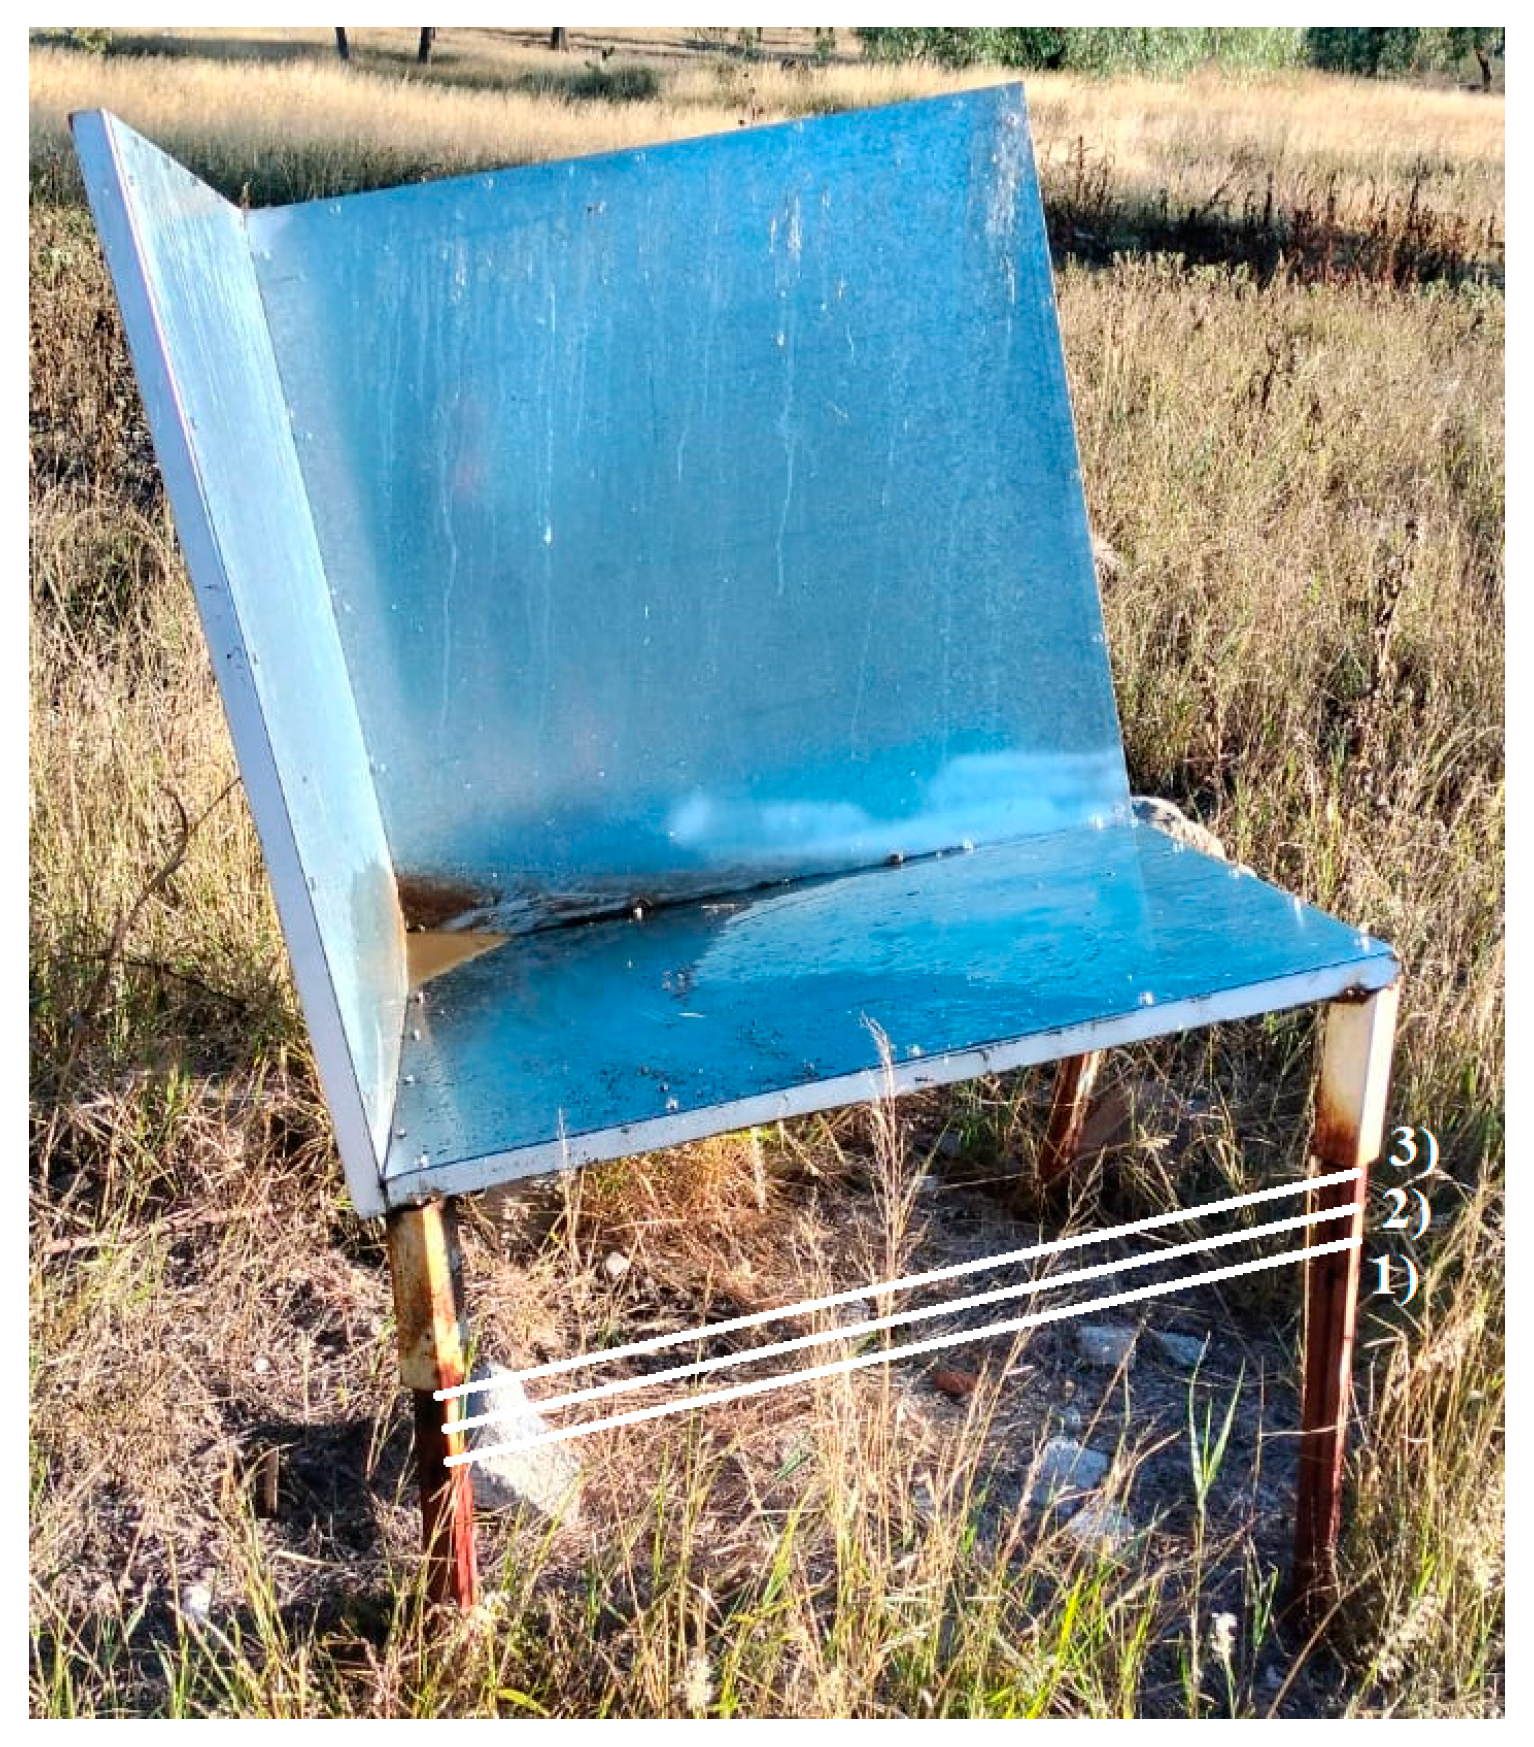
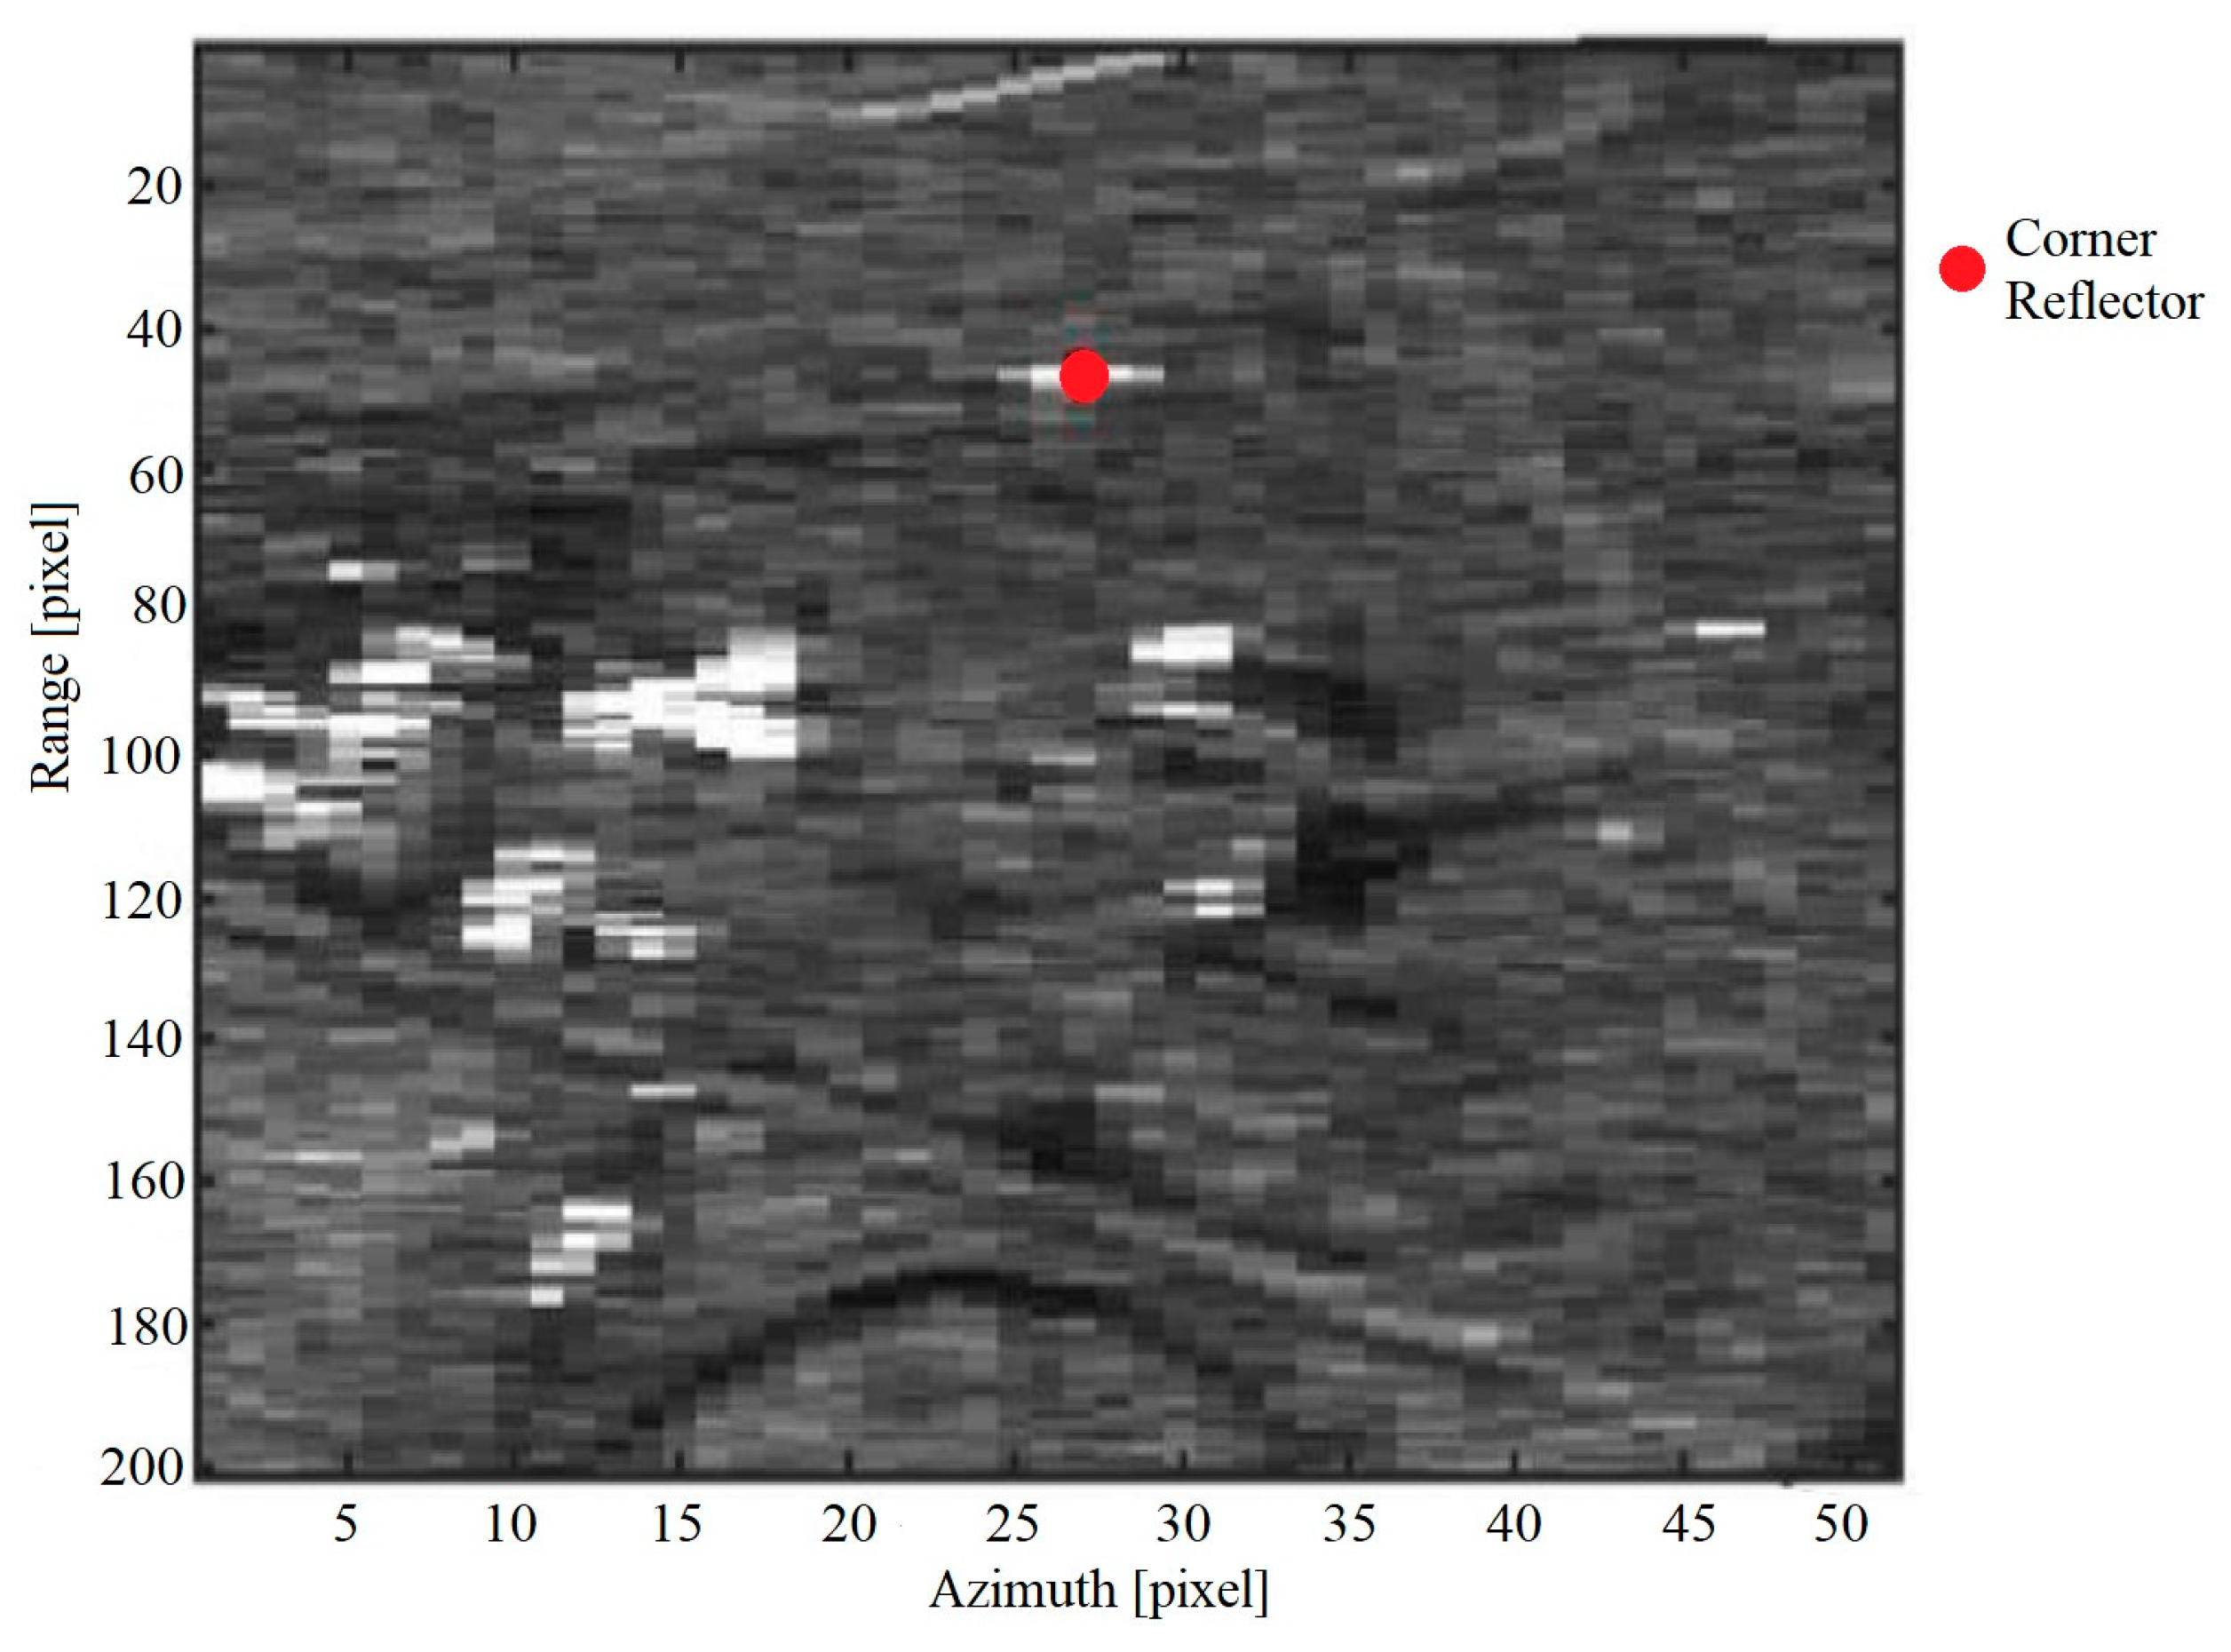
4. Controlled Testing Using CR

With the aim of testing the capabilities of PS InSAR in the monitoring of the vertical displacements of a bridge, a controlled experiment was developed using a CR. Therefore, it was necessary to design the CR for transforming a point of interest into the predominant reflector within the desired pixel. Since the employed images were from the mission Sentinel-1, their characteristics must be considered in the computation of the size and shape of the CR. These characteristics are summarized in Table 1 [34].
For the determination of the CR’s dimensions, it is necessary to consider the effective error of the phase ( φ e r r ), which can be estimated using Equation (5) [35]:
φ e r r = 1 2 S C R ,
where SCR is the Signal to Clutter Ratio.
The phase error can be converted to line-of-sight offset errors (derr) utilizing Equation (6) [34]:
d e r r = φ e r r λ 4 π ,
where λ is the signal wavelength.
Considering derr equal to 0.1 mm, the SCR value can be determined using Equation (7), which relates Equations (5) and (6):
S C R = λ 0.0001 x 4 π 2 2 ,
The result indicates that the value of SCR must be approximately equal to 30 dB. However, the RCS (Radar Cross Section) value of the CR was calculated based on the following Equation (8) [36]:
S C R = R C S 10 log A + C l u t t e r ,
where A is the pixel area (174.3 m2); Clutter is the background noise (−12); and SCR is equal to 30 dB. The result indicates that the CR must generate an RCS equal to or greater than 40.4 dBm2. The value of the RCS of the CR depends on its geometry and size; in this case, a square tetrahedron was used due to its high value of RCS and easy construction. The maximum value of RCS for such a figure is given by Equation (9) [37], where d is the length of the sides.
M a x R C S = 12 π d 4 λ 2 ,
If it is necessary to obtain a value of RCS equal to 40.4 dBm2, a CR with sides of approximately 1 m is required. The CR built can be seen in Figure 5, before it was installed and oriented.
Once the CR was created, it was anchored to the ground within a forest zone. Four holes of 15 × 30 cm were generated in the CR supports to embed a section of rectangular steel tube in each one. The steel tube had horizontal perforations at certain distances at the level of several millimeter to change the vertical position of the CR and compare the actual displacements concerning new InSAR processing. Figure 6 illustrates the CR, the sections of steel, and three white lines as examples of how the CR supports were changed to accomplish a new position.
The following step was to orientate the CR for reflecting the signals emitted by Sentinel-1. In this case, the selected images to develop the experiment were acquired in ascending orbit by both satellites (A and B), with an azimuth of 349° and an angle of incidence of 39.5811°. Therefore, the orientation of the CR must be with an azimuth of 259°; this value was obtained by adding 90° to the orientation of the satellite, since the radar travels on the right side of the satellite, which indicates that the radar was oriented with an azimuth of 79°. In addition, the CR must be installed in the opposite direction to receive the satellite signal, which means 180° more than the orientation of the radar. On the other hand, the inclination of the CR was 15°, because the incident angle of the signal was approximately 39° and the optimal area of the CR in terms of the maximum RCS was at approximately 54° [38]. To ensure that the CR was correctly installed and oriented, a reflectivity map was implemented utilizing 18 SAR images, where the CR appeared and reflected the signal in a stable manner for each of them. The average of the reflectivity maps is illustrated in Figure 7, and the position of the CR is marked with a red circle.
Considering the above-mentioned criteria, the validation experiment was carried out. Within this frame of reference, for one month, every time the satellite collected an image, the position of the CR was changed. Based on the results, the maximum and minimum displacements were +7.9, and 0 mm, respectively. The InSAR processing implemented six images for the changing period, corresponding to 24 images in total. This consideration meets the requirement to use at least 15 or 20 images [39,40]. Hence, the validation testing consisted of comparing the controlled displacements measured by leveling and InSAR, respectively. The ground truth was determined during each acquisition of the satellites. Meanwhile, the InSAR processing took into consideration a small area, temperature deformation, nonlinear displacements, and images collected by both satellites (A and B). Two processes were developed using the same configuration parameters, except for the reference point. The first comparison is summarized in Table 2. It is observed that the average of the differences was 0.8 mm. The maximum and minimum values were 2.1 mm and −1.4 mm, respectively. Additionally, the standard deviation was equal to 1.21 mm. In this case, the Root Mean Square (RMS) error was 1.37 mm.
Conversely, the second comparison provides an average difference of 0.31 mm, maximum and minimum values of 1.2 and −1.2 mm, respectively, a standard deviation of 0.88 mm, and an RMS error of 0.86 mm. In this case, the differences were smaller than in the first processing (see Table 3).
Due to some values of the ground truth being equal to 0, the percentage error was not calculated for analyzing the capabilities of InSAR for determining vertical displacements in bridges; however, the RMS error and the standard deviation showed in the above short testing values under 1.37 mm and 1.2 mm, respectively. These results agree well with the resulting precision in [41], where the standard deviation was used to assess the experiment.

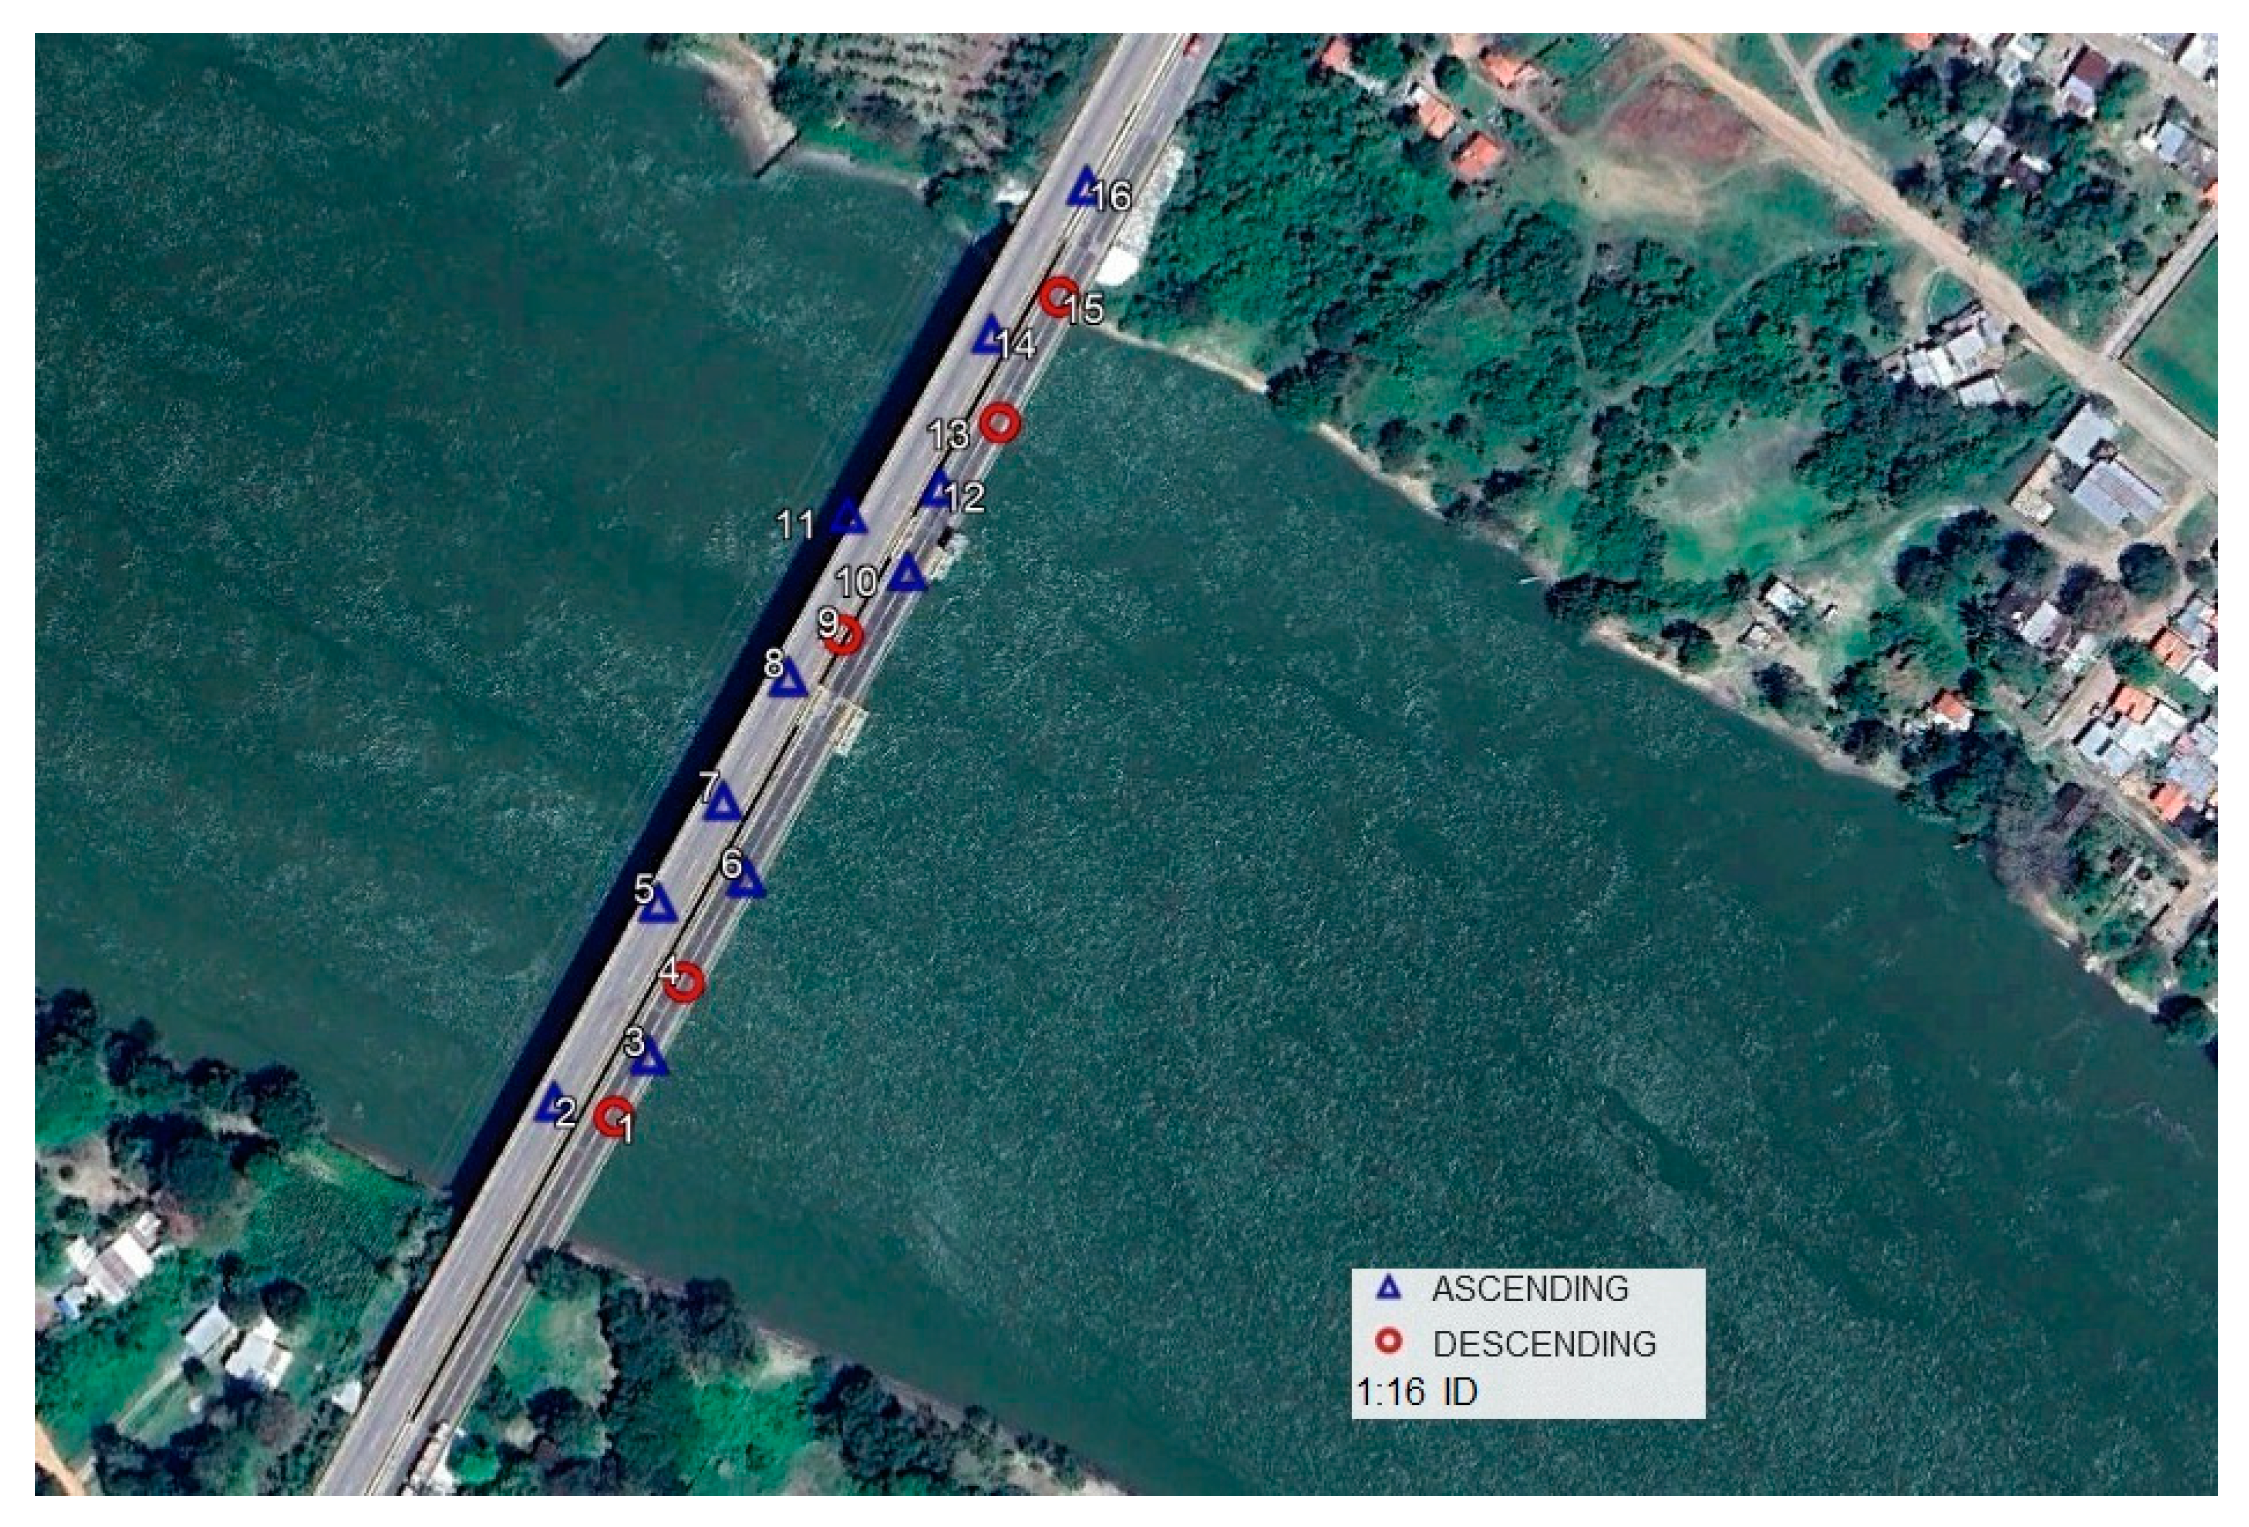
5. Field Testing on the Usumacinta Bridge

To calculate the semi-static displacements of the Usumacinta Bridge, two InSAR processing procedures were implemented, each of them considering images acquired in ascending and descending directions, respectively. Every process covered the period from April 2021 to April 2023, using information provided only by satellite A with a temporal resolution of 12 days. The software implemented was SARPROZ [42], considering an index of amplitude dispersion of 0.7, a small area, temperature deformation, and nonlinear displacements, with a reference point out of the bridge, and the resulting PS points presented a temporal coherence higher than 0.8. On the Usumacinta Bridge, a total of 16 points were found to be candidates to be monitored, and such points can be seen in Figure 8. The resulting displacements are presented in Figure 9. It is important to mention that due to the lack of information about the bridge, the threshold limits for all the points are equal to ±50 mm. In summary, the mean velocity of the bridge was found to be −0.19 mm/year, presenting maximum and minimum values of 1.68 and −3.5 mm/year, respectively, with a standard deviation of 1.12 mm/year. The mean estimated cumulative displacement in the structure was −0.4 mm, with a maximum value of 3.4 mm, a minimum of −7 mm, and a standard deviation of 2.3 mm. All the points presented cumulative displacements within±10 mm; the maximum range of displacements was in point number 12, and the minimum was found in point number 1. Table 4 shows the velocity and the associated cumulative displacements for all the resulting PS points.
On the other hand, the monthly velocity was calculated for each point, resulting in 24 values. Figure 10 presents the vertical velocity of the 16 points, where all are within the threshold limits of ±13 mm/month.
In Table 5, the mean value and standard deviations of the new time series were calculated. The most stable point was the number 8, with a mean of 0.14 mm/month and standard deviation of 1.44 mm/month; meanwhile, point number 10 was less stable because of a mean value of 0.77 mm/month with a standard deviation of 5.03 mm/month.
Based on the displacements and monthly velocities obtained in this section of the paper, it can be established that the Usumacinta Bridge did not present important anomalies during the transit of the above-mentioned heavy vehicles. However, it is still necessary to define an indicator of safety describing the structural reliability of the bridge. This is addressed in the following section.

Structural Reliability of the Usumacinta Bridge

In this part of the manuscript, the reliability index was calculated using the alternative probabilistic approach presented earlier in Section 3.2. Within this frame of reference, displacements of each point obtained with the help of the InSAR technology were used to extract the corresponding risk of the bridge. For example, displacements of point number 4 presenting values from −7 to 5 mm, a standard deviation of 2.6 mm, and a mean value of −0.005 mm are illustrated in Figure 11. Using the resulting displacement presented in Figure 11, a Chi-squared test was implemented to determine the best-fitted PDF, which turned out to be the Generalized Extreme Value, as illustrated in Figure 12. As observed in Figure 11, the range of displacements was far from the limit states (±50 mm) recommended in transportation guidelines. Therefore, the resulting reliability index (β) was 6.7 for this case, which is a high value considering that the target reliability would be β = 3.5.
For the sake of brevity, the β values for the other points of the Usumacinta Bridge are summarized in Table 6. Maximum and minimum β values of 8.1 and 3.4 were observed, respectively, and a mean value of 5.9 and a standard deviation of 1.4. The results indicate that the structural performance of the bridge during this period was within the safety limits established by AASHTO guidelines.
As a complement to the safety of the Usumacinta Bridge, the monthly velocity values of displacements were calculated for the points under consideration in the structure, and the probability of risk was extracted considering the limits of ±13 mm/month. To illustrate this process, one of the cases is analyzed as follows. The monthly velocities and best-fitted PDF of point number 3 are illustrated in Figure 13 and Figure 14, respectively. Figure 14 demonstrates that the t-student PDF is the one representing in the best way the stochastic behavior of monthly velocities. In the case of the safety of the structure, it was determined that a PR value of 1.64% is one of the highest values of all points in the structure.
The rest of the information in terms of PR is presented in Table 7, where the minimum value was 1.5 × 10⁻⁵% at point number 8, the maximum value was 2.61% at point number 4, the mean probability of risk was 0.4%, and the standard deviation was 0.8%. In general, the resulting probabilities of overpassing the threshold limits are very small. Thus, the safety of the Usumacinta Bridge can be declared to be adequate.

6. Discussion

Based on the results in terms of β and PR, the Usumacinta Bridge did not suffer considerable damages from the demands of the heavy vehicles that were overloading it for 5 months. In addition, no changes were found concerning the tendency of the InSAR time series during the period analyzed. In this manner, the capabilities of the proposed approach for defining the structural reliability using semi-static displacements from InSAR were demonstrated in a real case study. Considering the competencies of InSAR for determining accurate displacement in the vertical component with the acquisition of information once per two weeks, the proposed probabilistic approach, which can extract structural risk associated with the bridge performance, and using specific limit states according to the main characteristics of bridge structures, it is possible to improve the administration of the structures during the maintenance and rehabilitation process.
Compared to most of the investigations that employed InSAR technology [9,21,23], this investigation implemented a probabilistic analysis to determine whether the bridge presented normal behavior or not, based on the AASHTO state limits. Along these lines, the structural reliability of bridges can be accurately estimated for events such as scour, loss of stiffness, long-term deflections, and changes produced by temperature. However, to define whether the Usumacinta Bridge is completely within optimal operational conditions, it must be analyzed using a comprehensive dynamic evaluation.
On the other hand, it is important to mention that the state limits implemented in this work are related to serviceability verification; however, they can be improved by using a Finite Element Model or statistical approaches for calculating more accurate values. The specific threshold can cover problems produced by fatigue or even instability, which might produce lower values of the reliability index. Unfortunately, this is beyond the main objective of this paper, but if this is properly determined, it would make it possible to detect potential damages in the bridges during an optimal moment.

7. Conclusions

In the present manuscript, an alternative methodology was introduced and applied to estimate the structural reliability of the Usumacinta Bridge, which was affected by vehicles overloading its main structure for a period of 5 months. The fundamental input required for the investigation was the InSAR time series, which represented the semi-static behavior of the structure in the vertical component. In summary, the main conclusions of this scientific work are listed as follows.
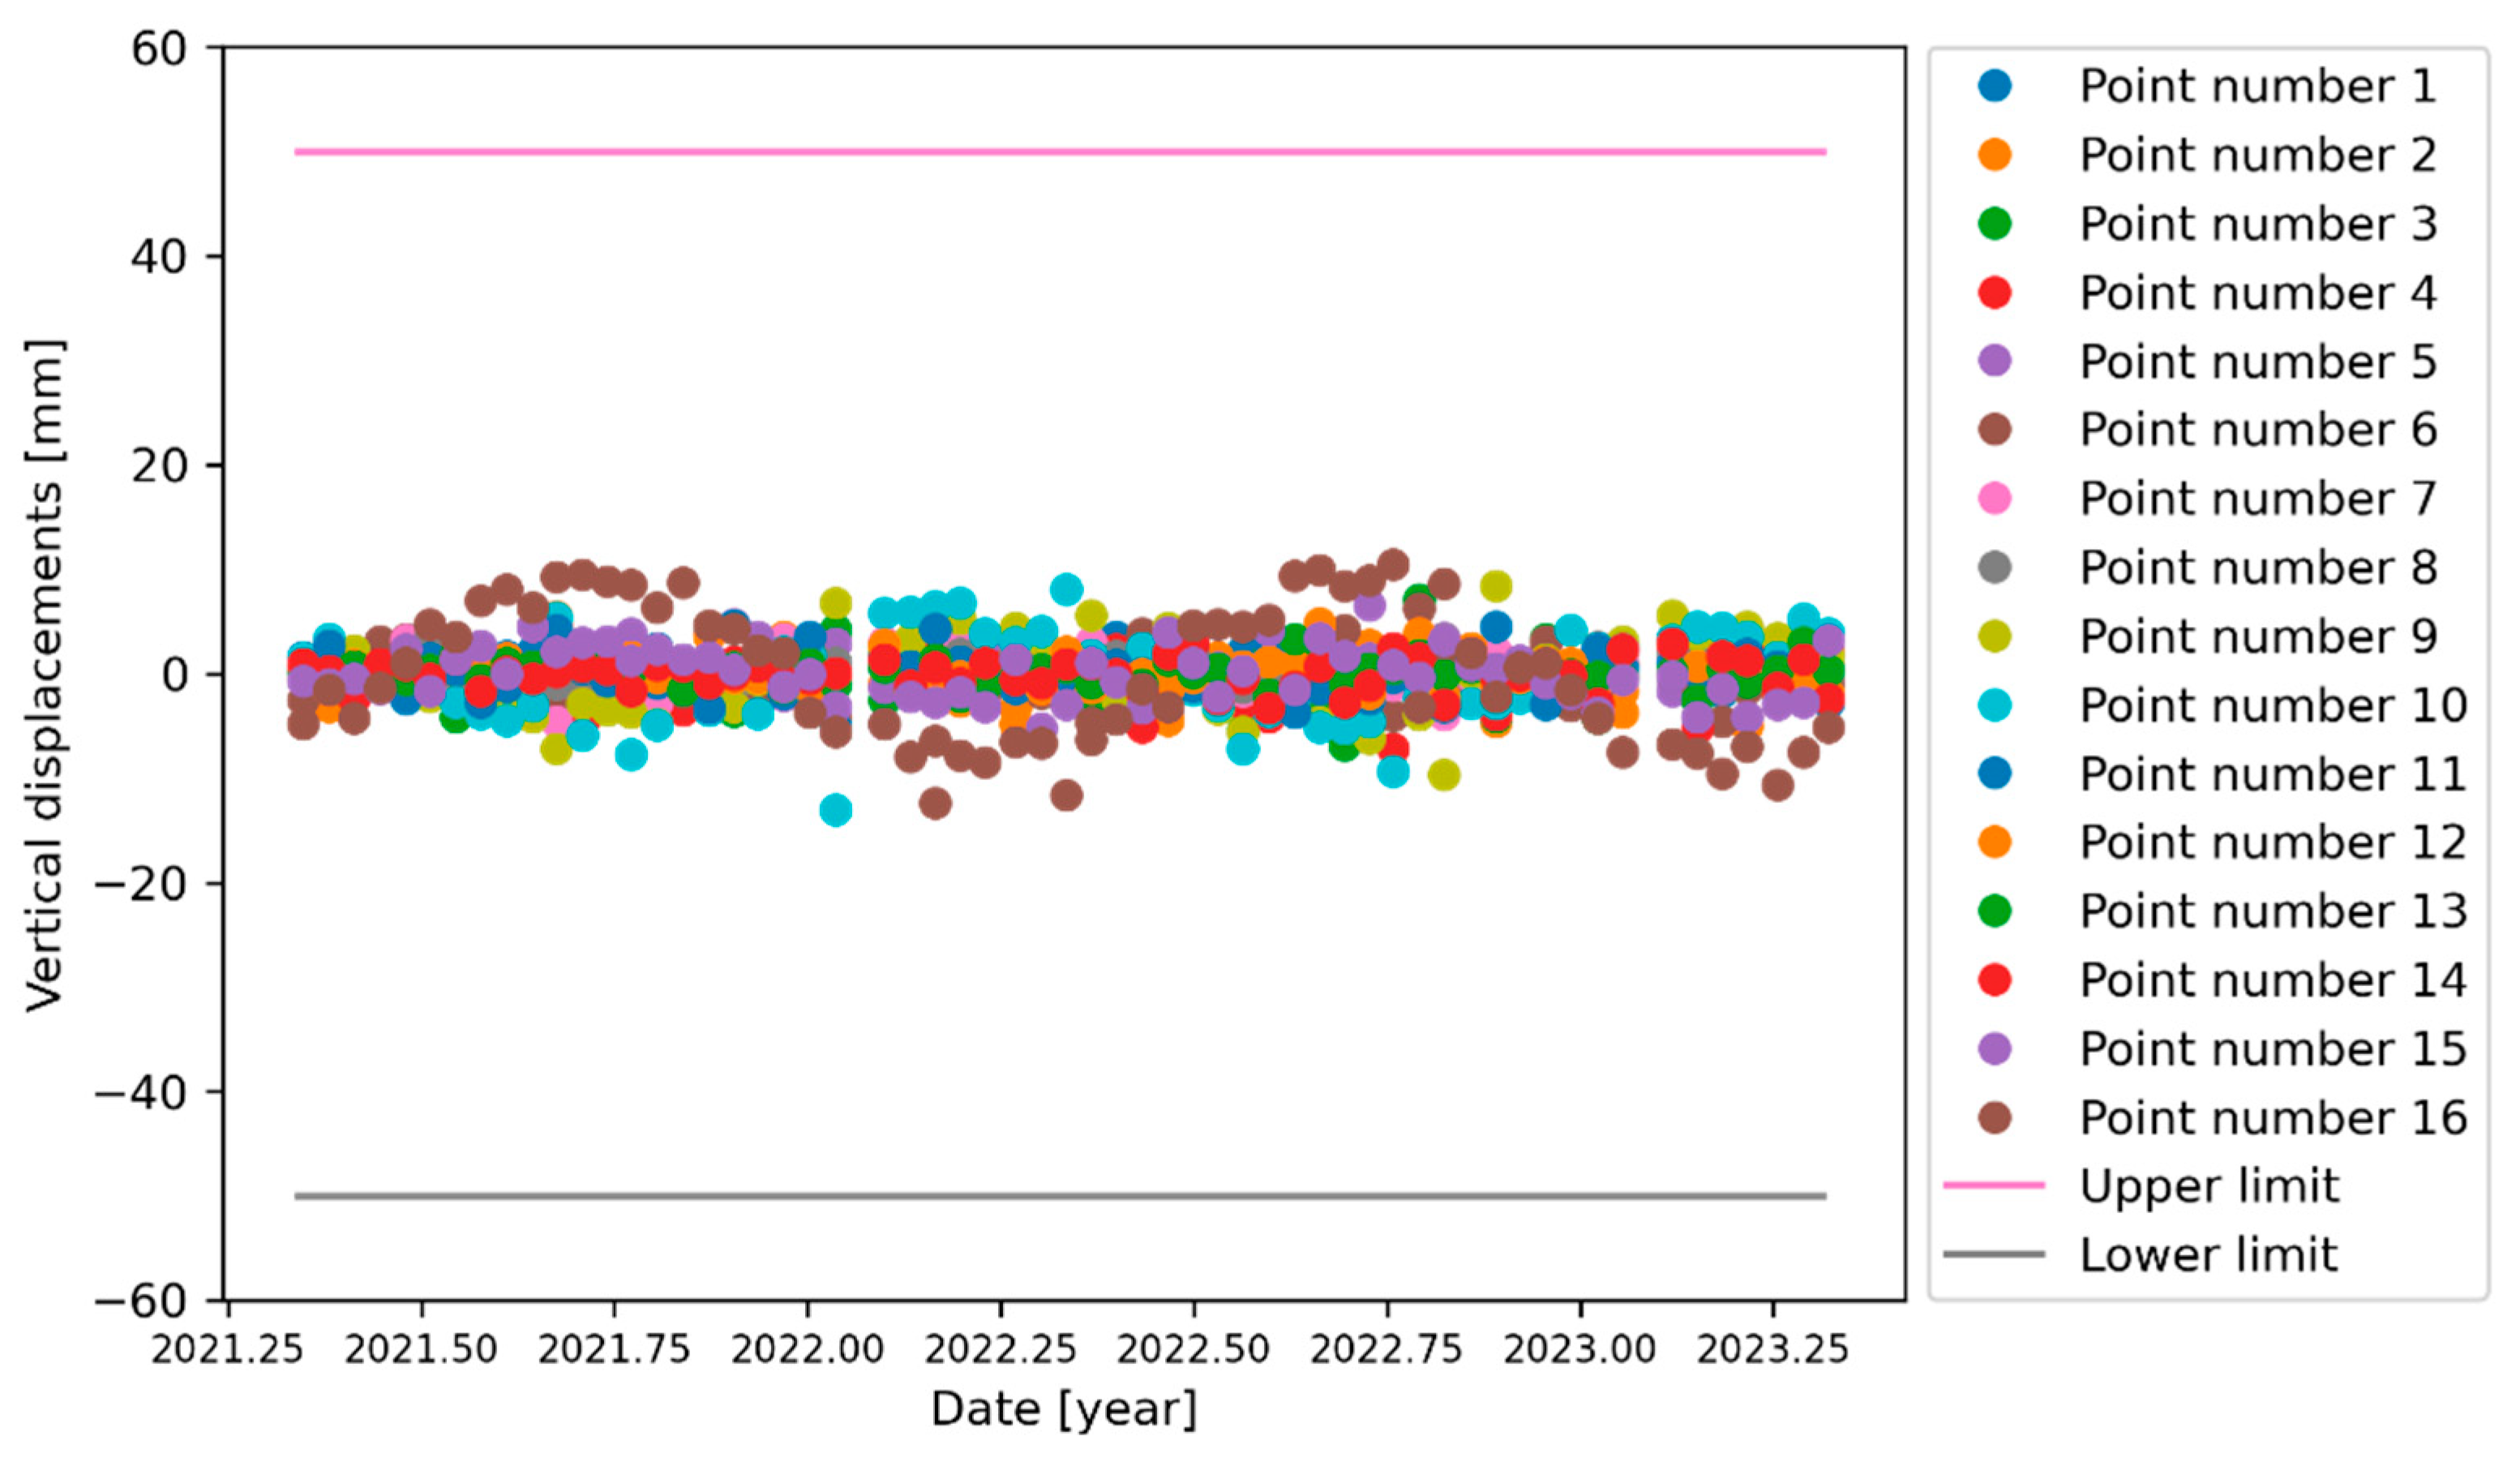
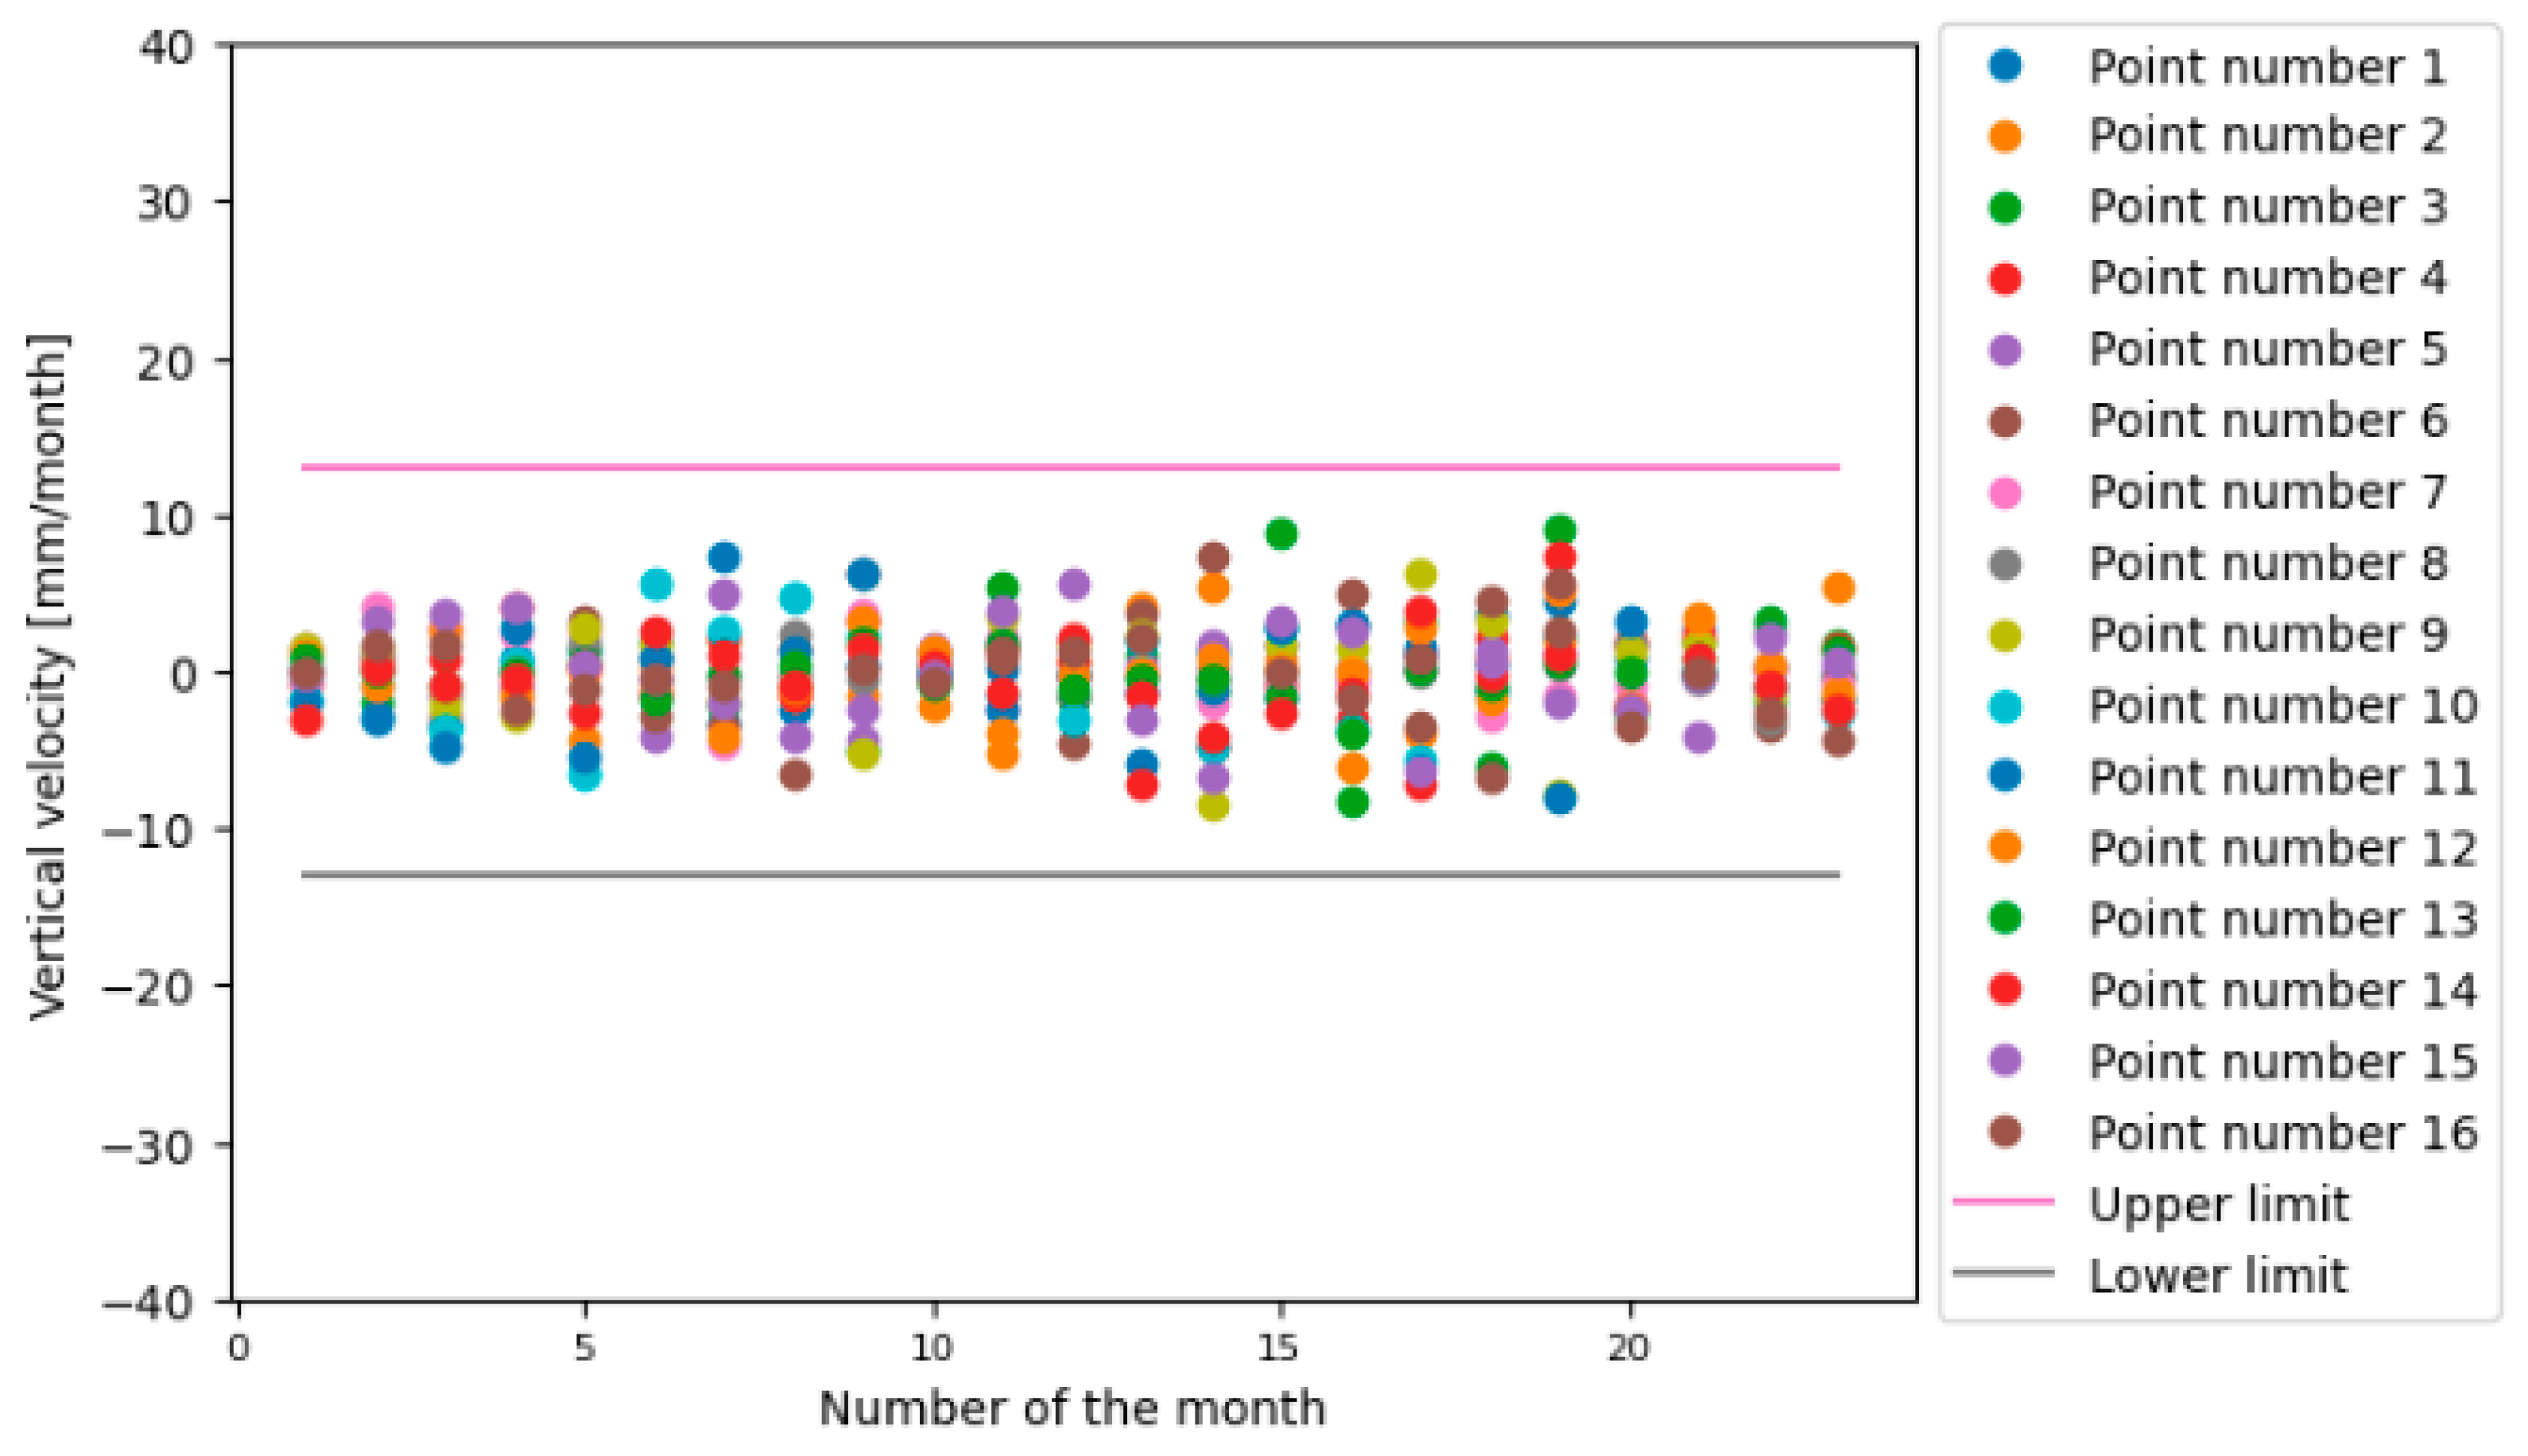
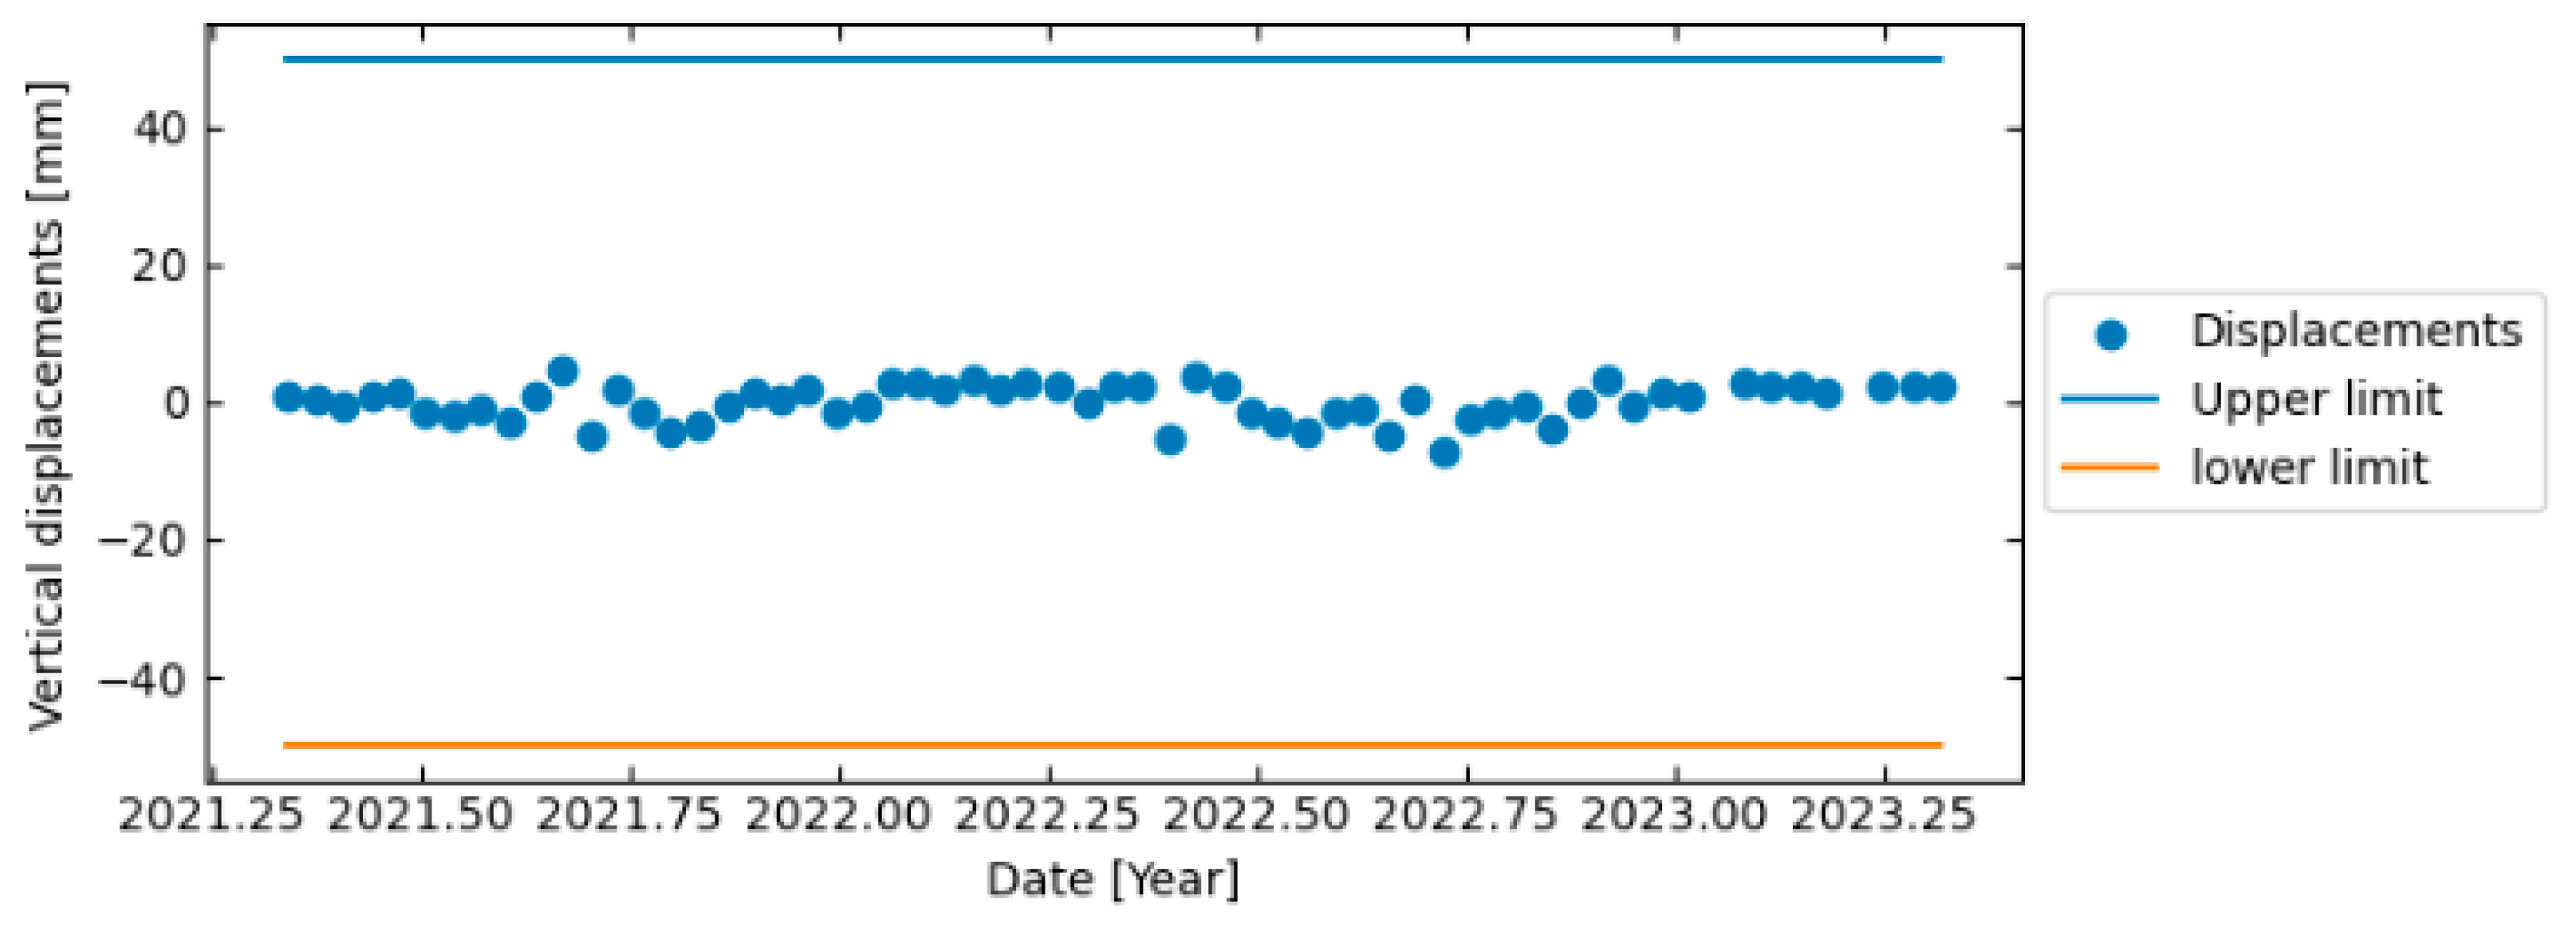
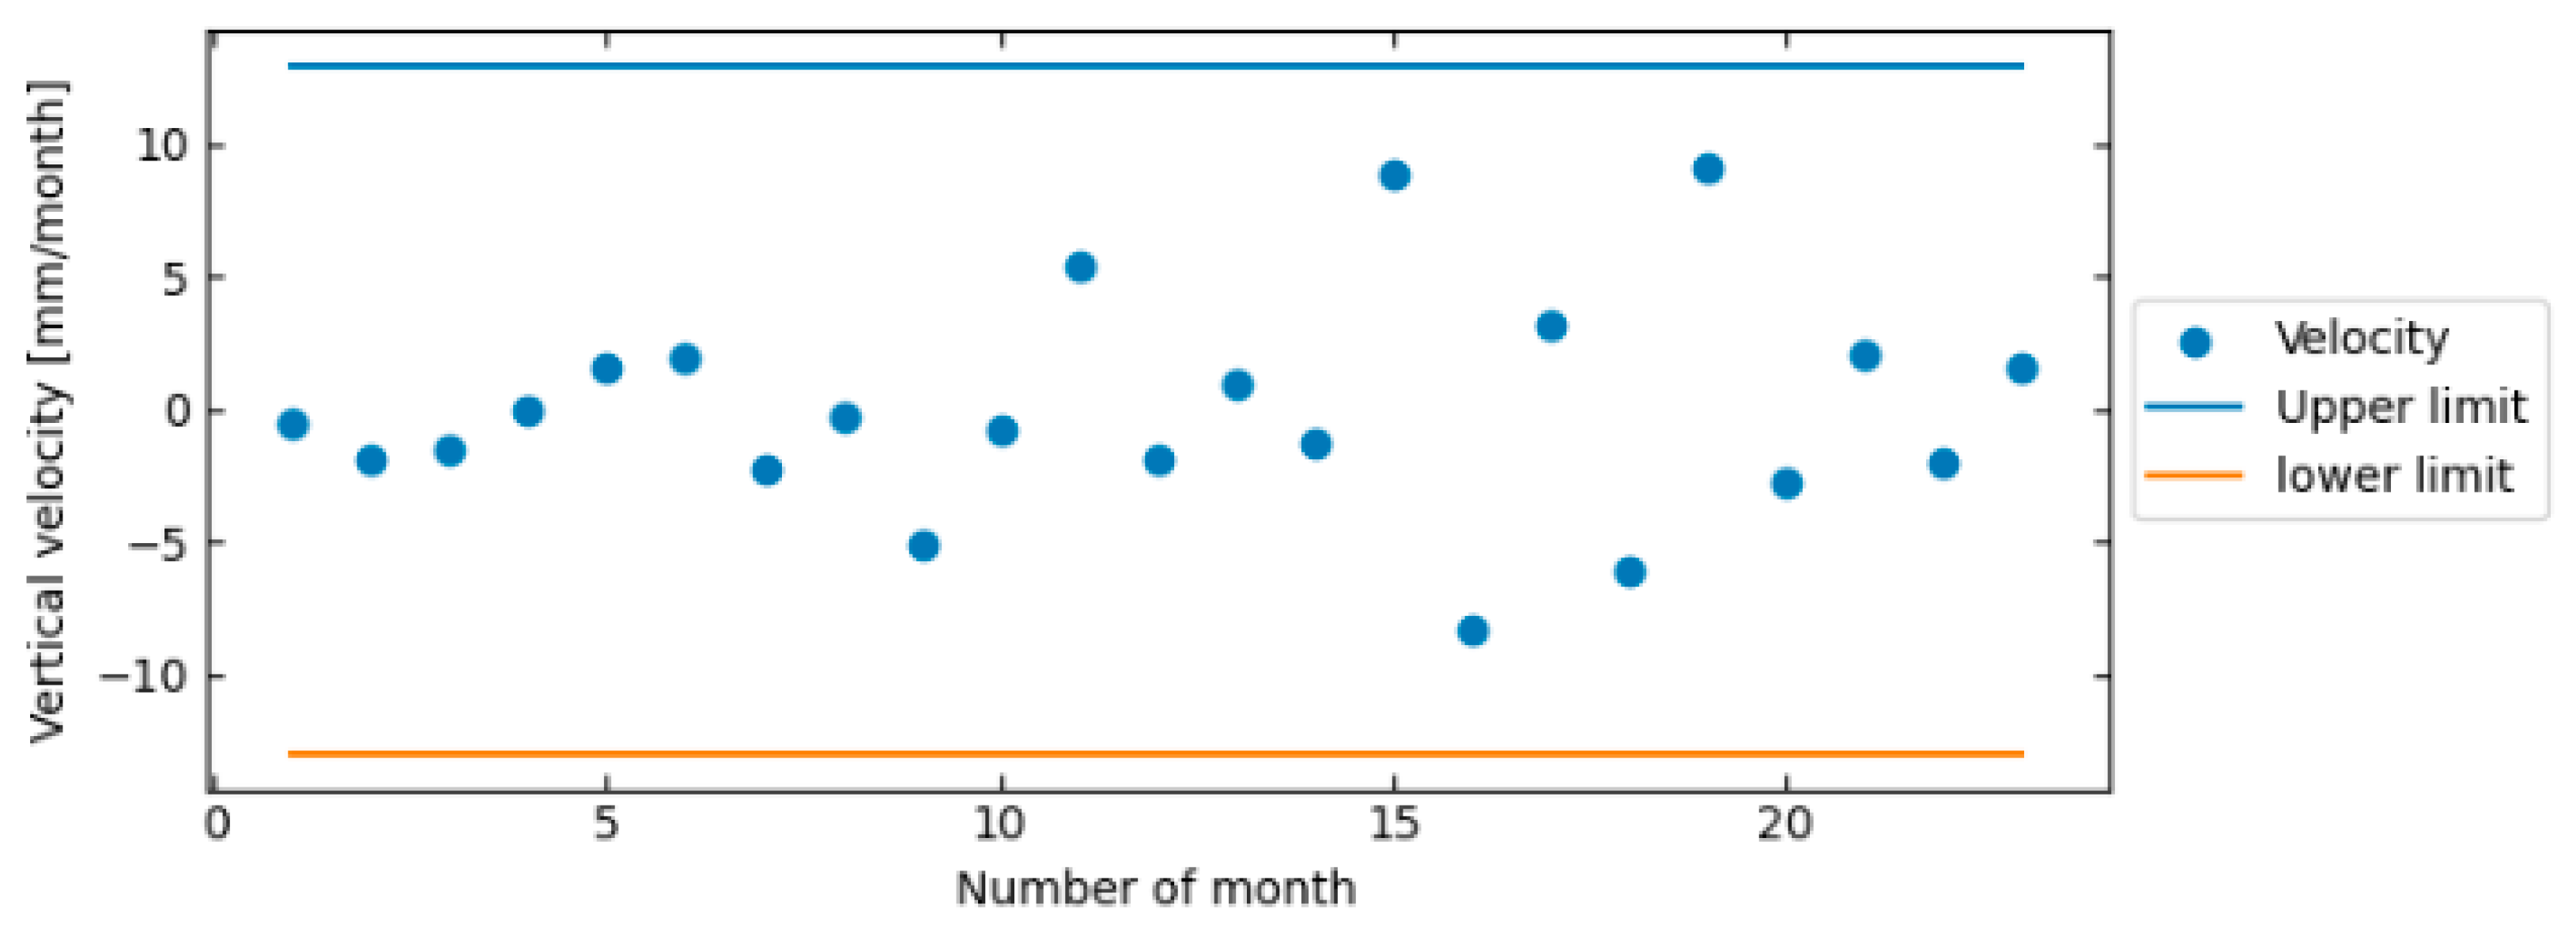
  • The displacements of the Usumacinta Bridge achieved a maximum reliability index value (β) of 8.1 and a minimum one of 3.4. The mean value of β was 5.9, and the standard deviation was 1.4. On the other hand, the calculated monthly velocities presented a maximum probability of risk (PR) of 2.61%. The minimum value was 1.5 × 10⁻⁵%, the mean 0.4%, and the standard deviation 0.8%. Based on the results, it can be established that the areas of the bridge analyzed did not present damages produced by the heavy vehicles overloading the main structure.
  • InSAR is a useful technology to determine the semi-static displacements of bridges and estimate their structural reliability. Therefore, a support decision system can be developed to improve the quality of the road infrastructure with the methodology presented in this manuscript.
  • Due to the Sentinel-1 image resolution, a few zones of the bridge were analyzed, which represents a general idea of the actual reliability of the Usumacinta Bridge. An ideal assessment would be a study in detail of the bridge considering the relevant structural elements. This can be accomplished using commercial images and corner reflectors.
  • The proposed probabilistic assessment can be improved by using specific limit states for each structure instead of employing a general one. In addition, more PDFs can be integrated into the methodology to obtain the structural risk.

Author Contributions

Conceptualization, G.M.G.-A.; methodology, G.M.G.-A. and J.G.M.-Q.; software, V.T.-M.; validation, G.M.G.-A., J.R.G.-C., and J.A.Q.-R.; formal analysis, G.M.G.-A.; investigation, G.M.G.-A.; resources, J.A.Q.-R.; data curation, V.T.-M.; writing—original draft preparation, G.M.G.-A. and J.G.M.-Q.; writing—review and editing, J.R.G.-C. and G.E.V.-B.; visualization, J.G.M.-Q.; supervision, J.A.Q.-R., J.R.G.-C., and G.E.V.-B.; project administration, J.A.Q.-R., J.R.G.-C., and G.E.V.-B. All authors have read and agreed to the published version of the manuscript.

Funding

The study presented in this paper is supported by CONAHCYT (scholarship No. CVU: 709603).

Data Availability Statement

Publicly available datasets were analyzed in this study. Sentinel-1 data can be downloaded from the Alaska Satellite Facility (https://search.asf.alaska.edu/ (accessed on 26 November 2023)).

Acknowledgments

This work was possible thanks to the Collaboration between the Autonomous University of Sinaloa and the Mexican Institute of Transportation. In addition, the authors would like to acknowledge CONAHCYT for supporting the work. Finally, the authors would like to thank CAPUFE for their help, the SARPROZ software team for providing an evaluation license to process the data, and the European Space Agency for supplying Sentinel-1 images.

Conflicts of Interest

The authors declare no conflict of interest.

References

  1. Vazquez-Ontiveros, J.R.; Vazquez-Becerra, G.E.; Quintana, J.A.; Carrion, F.J.; Guzman-Acevedo, G.M.; Gaxiola-Camacho, J.R. Implementation of PPP-GNSS measurement technology in the probabilistic SHM of bridge structures. Measurement 2021, 173, 108677. [Google Scholar] [CrossRef]
  2. Korolkov, I.V.; Zhumanazar, N.; Gorin, Y.G.; Yeszhanov, A.B.; Zdorovets, M.V. Enhancement of electrochemical detection of Pb 2+ by sensor based on track-etched membranes modified with interpolyelectrolyte complexes. J. Mater. Sci. Mater. Electron. 2020, 31, 20368–20377. [Google Scholar] [CrossRef]
  3. Shlimas, D.I.; Kozlovskiy, A.L.; Zdorovets, M.V. Study of the formation effect of the cubic phase of LiTiO2 on the structural, optical, and mechanical properties of Li2±xTi1±xO3 ceramics with different contents of the X component. J. Mater. Sci. Mater. Electron. 2021, 32, 7410–7422. [Google Scholar] [CrossRef]
  4. Almessiere, M.A.; Algarou, N.A.; Slimani, Y.; Sadaqat, A.; Baykal, A.; Manikandan, A.; Trukhanov, S.V.; Trukhanov, A.V.; Ercan, I. Investigation of exchange coupling and microwave properties of hard/soft (SrNi0.02Zr0.01Fe11.96O19)/(CoFe2O4)x nanocomposites. Mater. Today Nano 2022, 18, 100186. [Google Scholar] [CrossRef]
  5. Zhumatayeva, I.Z.; Kenzhina, I.E.; Kozlovskiy, A.L.; Zdorovets, M.V. The study of the prospects for the use of Li0.15Sr0.85TiO3 ceramics. J. Mater. Sci. Mater. Electron. 2020, 31, 6764–6772. [Google Scholar] [CrossRef]
  6. Valtierra-Rodriguez, M.; Machorro-Lopez, J.M.; Amezquita-Sanchez, J.P.; Dominguez-Gonzalez, A.; Alvarez-Junco, S.; Gasca-Zamora, H.M. A new damage indicator based on homogeneity and wireless accelerometers for evaluating the structural condition of a cable-stayed bridge. Dev. Built Environ. 2023, 14, 100166. [Google Scholar] [CrossRef]
  7. Dong, C.Z.; Catbas, F.N. A review of computer vision–based structural health monitoring at local and global levels. Struct. Health Monit. 2021, 20, 692–743. [Google Scholar] [CrossRef]
  8. Perissin, D. Interferometric SAR multitemporal processing: Techniques and applications. In Multitemporal Remote Sensing: Methods and Applications; Springer: Berlin/Heidelberg, Germany, 2016; pp. 145–176. [Google Scholar]
  9. Selvakumaran, S.; Plank, S.; Geiß, C.; Rossi, C.; Middleton, C. Remote monitoring to predict bridge scour failure using Interferometric Synthetic Aperture Radar (InSAR) stacking techniques. Int. J. Appl. Earth Obs. Geoinf. 2018, 73, 463–470. [Google Scholar] [CrossRef]
  10. Sousa, J.J.; Bastos, L. Multi-temporal SAR interferometry reveals acceleration of bridge sinking before collapse. Nat. Hazards Earth Syst. Sci. 2013, 13, 659–667. [Google Scholar] [CrossRef]
  11. Jung, J.; Kim, D.J.; Palanisamy Vadivel, S.K.; Yun, S.H. Long-term deflection monitoring for bridges using X and C-band time-series SAR interferometry. Remote Sens. 2019, 11, 1258. [Google Scholar] [CrossRef]
  12. Vadivel, S.K.P.; Kim, D.J.; Kim, Y.C. Time-series InSAR Analysis and Post-processing Using ISCE-StaMPS Package for Measuring Bridge Displacements. Korean J. Remote Sens. 2020, 36, 527–534. [Google Scholar] [CrossRef]
  13. Cusson, D.; Trischuk, K.; Hébert, D.; Hewus, G.; Gara, M.; Ghuman, P. Satellite-based InSAR monitoring of highway bridges: Validation case study on the North Channel Bridge in Ontario, Canada. Transp. Res. Rec. 2018, 2672, 76–86. [Google Scholar] [CrossRef]
  14. Milillo, P.; Giardina, G.; Perissin, D.; Milillo, G.; Coletta, A.; Terranova, C. Pre-collapse space geodetic observations of critical infrastructure: The Morandi Bridge, Genoa, Italy. Remote Sens. 2019, 11, 1403. [Google Scholar] [CrossRef]
  15. Lanari, R.; Reale, D.; Bonano, M.; Verde, S.; Muhammad, Y.; Fornaro, G.; Casu, F.; Manunta, M. Comment on “pre-collapse space geodetic observations of critical infrastructure: The morandi bridge, Genoa, Italy” by Milillo et al. (2019). Remote Sens. 2020, 12, 4011. [Google Scholar] [CrossRef]
  16. Milillo, P.; Giardina, G.; Perissin, D.; Milillo, G.; Coletta, A.; Terranova, C. Reply to Lanari, R. et al. comment on “pre-collapse space geodetic observations of critical infrastructure: The morandi bridge, Genoa, Italy” by Milillo et al. (2019). Remote Sens. 2020, 12, 4016. [Google Scholar] [CrossRef]
  17. Schlögl, M.; Widhalm, B.; Avian, M. Comprehensive time-series analysis of bridge deformation using differential satellite radar interferometry based on Sentinel-1. ISPRS J. Photogramm. Remote Sens. 2021, 172, 132–146. [Google Scholar] [CrossRef]
  18. Ma, P.; Li, T.; Fang, C.; Lin, H. A tentative test for measuring the sub-millimeter settlement and uplift of a high-speed railway bridge using COSMO-SkyMed images. ISPRS J. Photogramm. Remote Sens. 2019, 155, 1–12. [Google Scholar] [CrossRef]
  19. Xiong, S.; Wang, C.; Qin, X.; Zhang, B.; Li, Q. Time-series analysis on persistent scatter-interferometric synthetic aperture radar (PS-InSAR) derived displacements of the Hong Kong–Zhuhai–Macao Bridge (HZMB) from Sentinel-1A observations. Remote Sens. 2021, 13, 546. [Google Scholar] [CrossRef]
  20. Huang, Q.; Crosetto, M.; Monserrat, O.; Crippa, B. Displacement monitoring and modelling of a high-speed railway bridge using C-band Sentinel-1 data. ISPRS J. Photogramm. Remote Sens. 2017, 128, 204–211. [Google Scholar] [CrossRef]
  21. Qin, X.; Li, Q.; Ding, X.; Xie, L.; Wang, C.; Liao, M.; Zhang, L.; Zhang, B.; Xiong, S. A structure knowledge-synthetic aperture radar interferometry integration method for high-precision deformation monitoring and risk identification of sea-crossing bridges. Int. J. Appl. Earth Obs. Geoinf. 2021, 103, 102476. [Google Scholar] [CrossRef]
  22. JTGT H21-2011; Evaluation Standard for Technical Conditions of Highway Bridges. Highway Research Institute, Ministry of Transport: Beijing, China, 2011.
  23. Acton, S. InSAR Remote Sensing for Performance Monitoring of Transportation Infrastructure at the Network Level; Final Report No. RITARS-14-H-UVA; University of Virginia: Charlottesville, VA, USA, 2016. [Google Scholar]
  24. Cusson, D.; Rossi, C.; Ozkan, I.F. Early warning system for the detection of unexpected bridge displacements from radar satellite data. J. Civ. Struct. Health Monit. 2021, 11, 189–204. [Google Scholar] [CrossRef]
  25. Giordano, P.F.; Turksezer, Z.I.; Previtali, M.; Limongelli, M.P. Damage detection on a historic iron bridge using satellite DInSAR data. Struct. Health Monit. 2022, 21, 2291–2311. [Google Scholar] [CrossRef]
  26. Ferretti, A.; Prati, C.; Rocca, F. Nonlinear subsidence rate estimation using permanent scatterers in differential SAR interferometry. IEEE Trans. Geosci. Remote Sens. 2000, 38, 2202–2212. [Google Scholar] [CrossRef]
  27. Ferretti, A.; Prati, C.; Rocca, F. Permanent scatterers in SAR interferometry. IEEE Trans. Geosci. Remote Sens. 2001, 39, 8–20. [Google Scholar] [CrossRef]
  28. Farneti, E.; Cavalagli, N.; Costantini, M.; Trillo, F.; Minati, F.; Venanzi, I.; Ubertini, F. A method for structural monitoring of multispan bridges using satellite InSAR data with uncertainty quantification and its pre-collapse application to the Albiano-Magra Bridge in Italy. Struct. Health Monit. 2023, 22, 353–371. [Google Scholar] [CrossRef]
  29. AASHTO. Highway Safety Manual; American Association of State and Highway Transportation Officials: Washington, DC, USA, 2010. [Google Scholar]
  30. Nowak, A.S.; Collins, K.R. Reliability of Structures; CRC Press: Boca Raton, FL, USA, 2012. [Google Scholar]
  31. Haldar, A.; Azizsoltani, H.; Gaxiola-Camacho, J.R.; Vazirizade, S.M.; Huh, J. Reliability Evaluation of Dynamic Systems Excited in Time Domain-Redset: Alternative to Random Vibration and Simulation; John Wiley Sons: Hoboken, NJ, USA, 2023. [Google Scholar]
  32. Monjardin-Quevedo, J.G.; Valenzuela-Beltran, F.; Reyes-Salazar, A.; Leal-Graciano, J.M.; Torres-Carrillo, X.G.; Gaxiola-Camacho, J.R. Probabilistic assessment of buildings subjected to multi-level earthquake loading based on the PBSD concept. Buildings 2022, 12, 1942. [Google Scholar] [CrossRef]
  33. Lemaire, M. Structural Reliability; Wiley-ISTE: New York, NY, USA, 2009. [Google Scholar]
  34. Garthwaite, M.C. On the design of radar corner reflectors for deformation monitoring in multi-frequency InSAR. Remote Sens. 2017, 9, 648. [Google Scholar] [CrossRef]
  35. Adam, N.; Kampes, B.; Eineder, M. Development of a scientific permanent scatterer system: Modifications for mixed ERS/ENVISAT time series. In Proceedings of the 2004 Envisat ERS Symposium (ESA SP-572), Salzburg, Austria, 6–10 September 2004. [Google Scholar]
  36. Nahli, A.; Simonetto, E.; Tatin, M.; Durand, S.; Morel, L.; Lamour, V. On the combination of PsInsar and GNSS techniques for long-term bridge monitoring. Int. Arch. Photogramm. Remote Sens. Spat. Inf. Sci. 2020, 43, 325–332. [Google Scholar] [CrossRef]
  37. Qin, Y.; Perissin, D.; Lei, L. The design and experiments on corner reflectors for urban ground deformation monitoring in Hong Kong. Int. J. Antennas Propag. 2013, 2013, 191685. [Google Scholar] [CrossRef]
  38. Algafsh, A.; Inggs, M.; Mishra, A.K. The effect of perforating the corner reflector on maximum radar cross section. In Proceedings of the 2016 16th Mediterranean Microwave Symposium (MMS), Abu Dhabi, United Arab Emirates, 14–16 November 2016; pp. 1–4. [Google Scholar] [CrossRef]
  39. Hoppe, E.J.; Novali, F.; Rucci, A.; Fumagalli, A.; Del Conte, S.; Falorni, G.; Toro, N. Deformation monitoring of posttensioned bridges using high-resolution satellite remote sensing. J. Bridge Eng. 2019, 24, 04019115. [Google Scholar] [CrossRef]
  40. Perissin, D.; Wang, T. Repeat-pass SAR interferometry with partially coherent targets. IEEE Trans. Geosci. Remote Sens. 2011, 50, 271–280. [Google Scholar] [CrossRef]
  41. Ferretti, A.; Savio, G.; Barzaghi, R.; Borghi, A.; Musazzi, S.; Novali, F.; Prati, C.; Rocca, F. Submillimeter accuracy of InSAR time series: Experimental validation. IEEE Trans. Geosci. Remote Sens. 2007, 45, 1142–1153. [Google Scholar] [CrossRef]
  42. SARPROZ Office Webpage. 2023. Available online: https://www.sarproz.com/ (accessed on 26 November 2023).
Figure 1. Vehicles that affected the Usumacinta Bridge: (a) eighteen-wheeler vehicle of total length of 30 m; (b) eighteen-wheeler vehicle of a total length of 68 m.
Infrastructures 08 00173 g001
Figure 2. Geographic location of the Usumacinta Bridge.
Infrastructures 08 00173 g002
Figure 3. Usumacinta Bridge: (a) panoramic view; (b) side view.
Infrastructures 08 00173 g003
Figure 4. PDF with threshold limits a and b for displacements.
Infrastructures 08 00173 g004
Figure 5. CR prior to being installed.
Infrastructures 08 00173 g005
Figure 6. Positioning and movement of CR.
Infrastructures 08 00173 g006
Figure 7. Location of the CR in the reflectivity map.
Infrastructures 08 00173 g007
Figure 8. Resulting points on the Usumacinta Bridge.
Infrastructures 08 00173 g008
Figure 9. Resulting displacements on the Usumacinta Bridge.
Infrastructures 08 00173 g009
Figure 10. Resulting monthly velocities on the Usumacinta Bridge.
Infrastructures 08 00173 g010
Figure 11. Displacements of the point number 4.
Infrastructures 08 00173 g011
Figure 12. Statistical distribution of the resulting displacements in point number 4.
Infrastructures 08 00173 g012
Figure 13. Monthly velocities in point number 3.
Infrastructures 08 00173 g013
Figure 14. Statistical distribution of the resulting monthly velocities in point number 3.
Infrastructures 08 00173 g014
Table 1. Characteristics of the Sentinel-1 IWS image.
Image ModeAzimuthal Resolution (m)Slant Range Resolution (m)Ground Range Resolution (m)Ground Range Resolution Area (m2)Clutter (dB)
Interferometric wide swath20.05.08.7174.3−12
Table 2. Results of the first validation testing.
Number of the TestGround Truth (mm)InSAR Displacements (mm)Differences (mm)
1011
201.61.6
3011
47.9102.1
57.98.40.5
615.814.4−1.4
Table 3. Results of the second validation testing.
Number of the TestGround Truth (mm)InSAR Displacements (mm)Differences (mm)
100.20.2
200.20.2
301.21.2
47.99.11.2
57.98.20.3
615.814.6−1.2
Table 4. Resulting velocities on the Usumacinta Bridge.
Number of the PointVelocity (mm/year)Cumulative Displacements (mm)
1−3.5 ± 1.4−7
2−0.5 ± 0.35−1
3−0.66 ± 0.45−1.3
4−0.8 ± 0.59−1.6
50.37 ± 0.590.8
60.45 ± 0.590.9
7−0.2 ± 0.34−0.4
8−0.45 ± 0.57−0.9
9−0.19 ± 0.37−0.4
100.51 ± 0.41
110.37 ± 0.280.8
121.68 ± 0.83.4
13−0.83 ± 0.56−1.6
141.22 ± 0.92.4
15−0.29 ± 0.39−0.6
16−0.23 ± 0.49−0.4
Table 5. Statistics of the monthly velocities.
Number of the PointMean Velocity (mm/month)Standard Deviation (mm)
1−0.372.45
20.713.23
3−1.594.13
4−0.383.39
50.12.29
6−0.0033.34
70.062.12
80.141.44
90.73.56
100.775.03
110.573.53
120.262.06
13−0.231.45
14−0.252.47
150.593.31
160.642.92
Table 6. Resulting β values on the Usumacinta Bridge.
PointBest-Fitted PDFβ
1Extreme Value8.1
2Extreme Value6.6
3Weibull6.1
4Generalized Extreme Value6.7
5Extreme Value7.5
6Extreme Value6.0
7Weibull7.6
8Stable5.2
9Extreme Value4.9
10Stable3.4
11Extreme Value6.5
12Weibull7.2
13T Location Scale5.9
14Stable3.6
15Extreme Value5.9
16Weibull3.7
Table 7. Resulting PR values on the Usumacinta Bridge.
PointBest-Fitted PDFPR
1Logistic0.013
2Logistic0.17
3t student1.64
4Stable2.61
5Logistic0.006
6Fatigue life0.012
7Fisk0.036
8Logistic1.5 × 10−5
9Stable1.78
10Generalized Extreme Value8.4 × 10−5
11Logistic0.22
12Logistic0.002
13Stable0.001
14Logistic0.001
15Generalized Extreme Value0.03
16t student0.35
Disclaimer/Publisher’s Note: The statements, opinions and data contained in all publications are solely those of the individual author(s) and contributor(s) and not of MDPI and/or the editor(s). MDPI and/or the editor(s) disclaim responsibility for any injury to people or property resulting from any ideas, methods, instructions or products referred to in the content.

