1. Introduction
Transportation systems for the mobility of people and goods are considered essential to a country’s economic growth and wellbeing. In addition, such systems can also affect a community’s quality of life, especially in urban areas.
More generally, it is possible to say that people move for different reasons: work, study, entertainment, etc. From this perspective, mobility systems are part of the social cohesion and demographic development of an area (both urban and rural).
However, transportation systems also have an environmental impact; it is estimated that CO2 emissions from road, air and sea transport account for 74%, 12% and 12%, respectively.
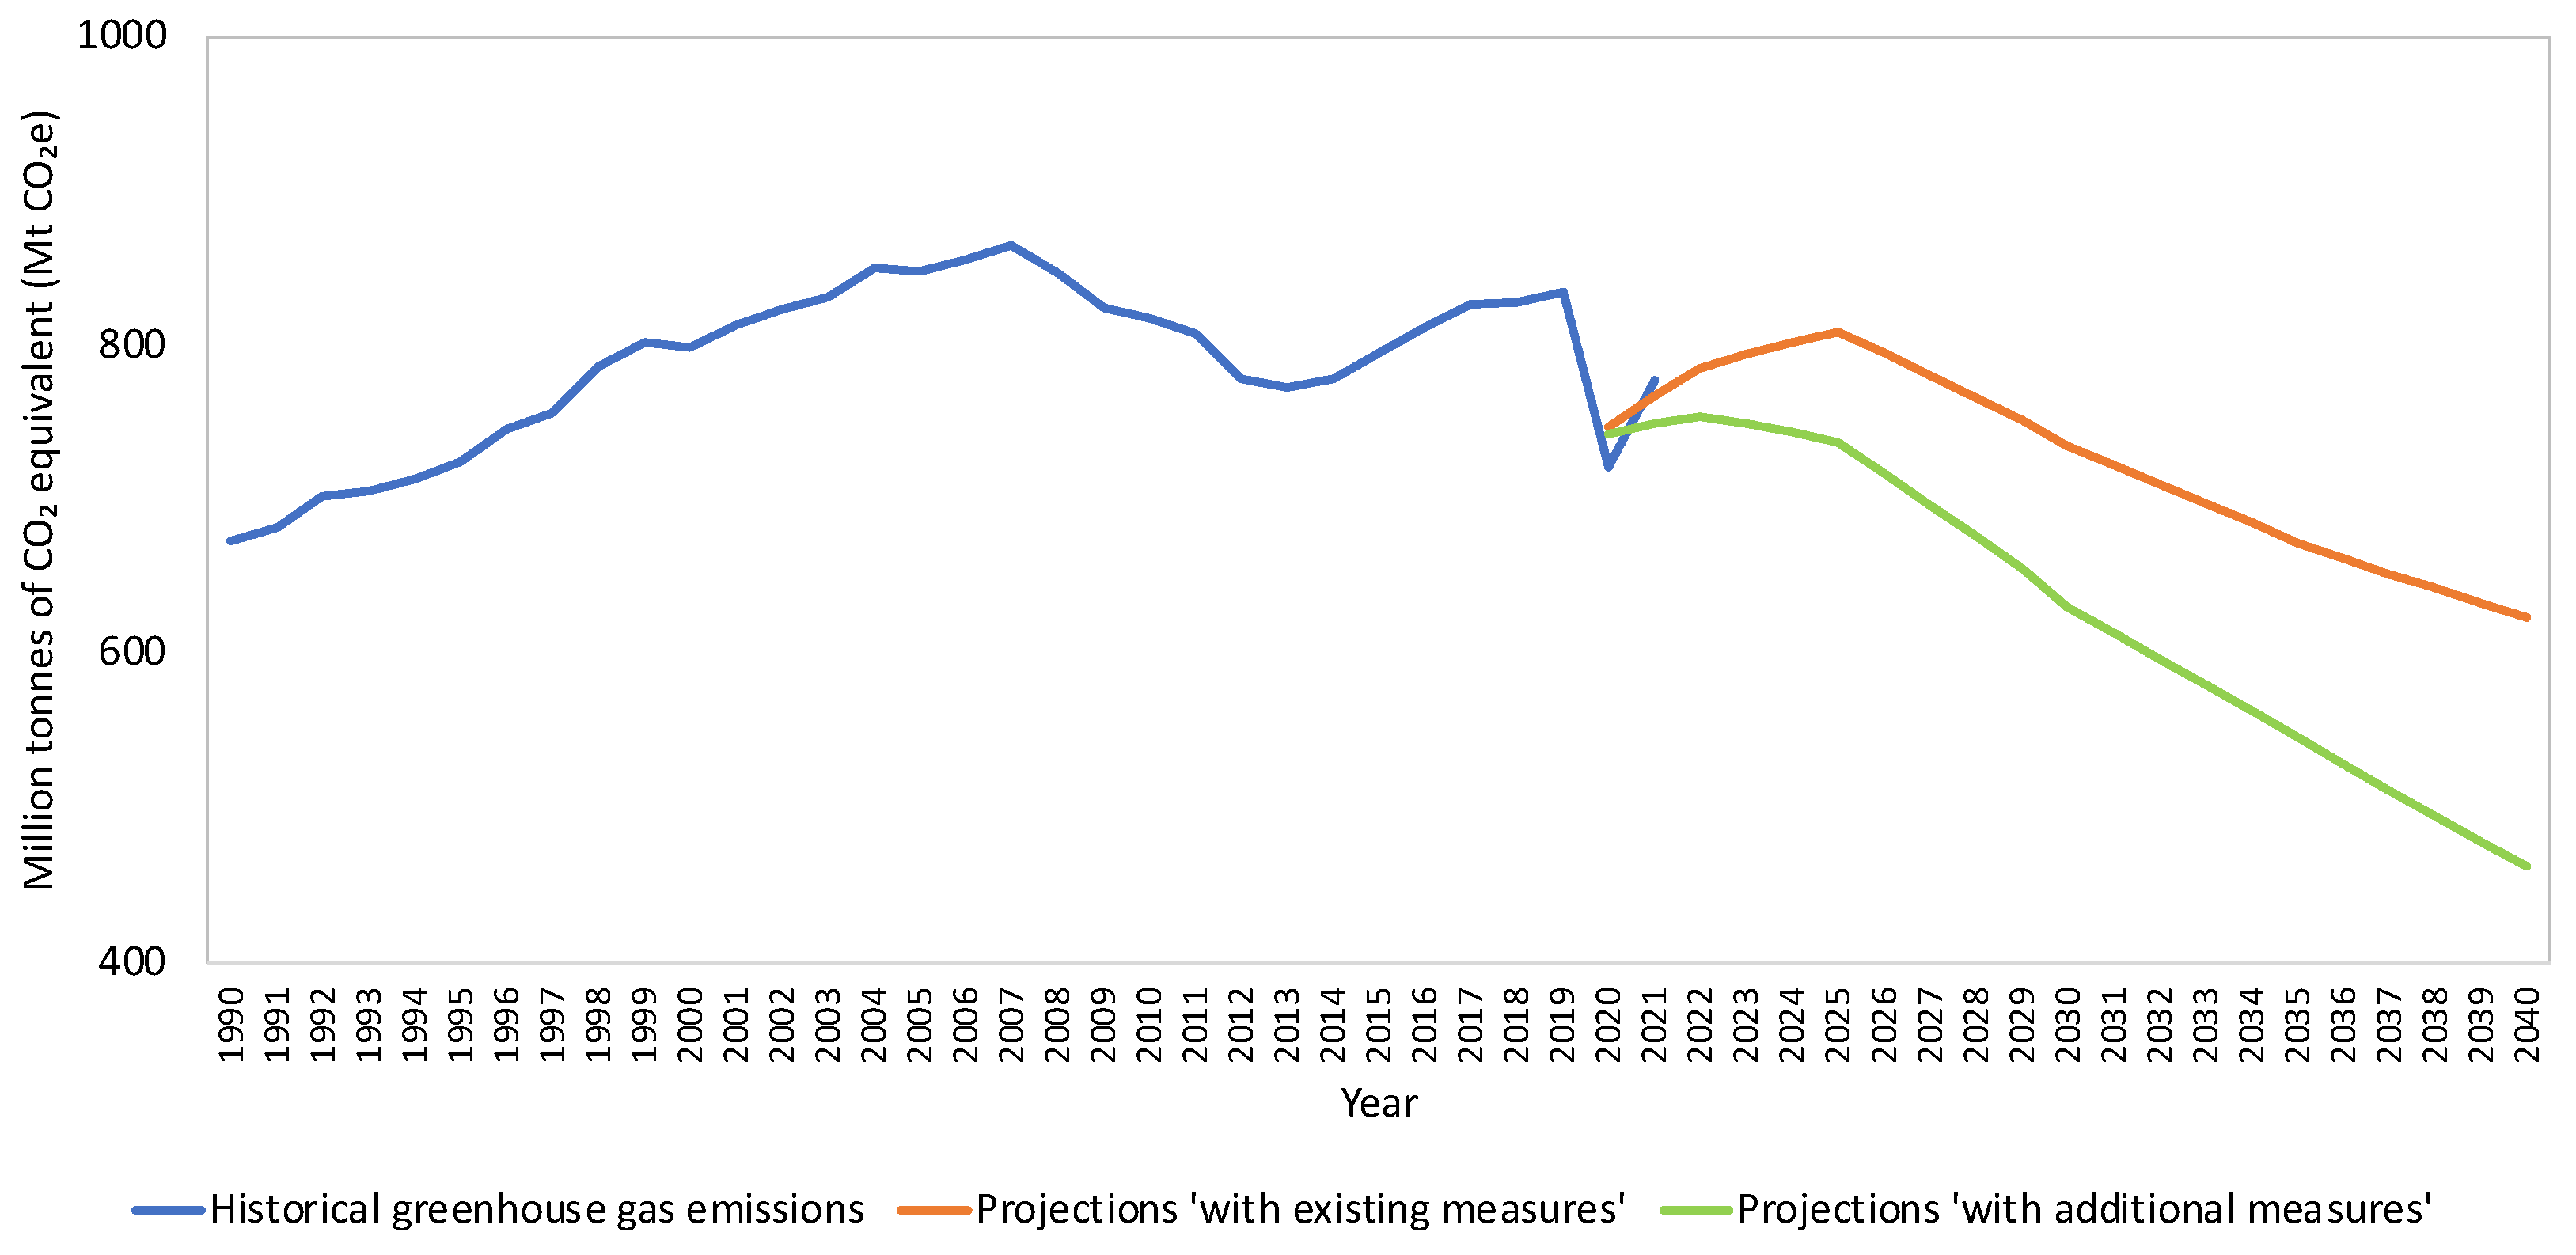
Figure 1 shows that EU domestic transport emissions increased steadily between 2013 and 2019 due to growth in passenger transport and domestic freight transport volumes. Emissions then decreased by about 13.6% between 2019 and 2020 due to a decrease in transport activity during the COVID-19 pandemic.
National projections indicate that member states expect transport-related emissions to increase in the coming years.
Figure 1 shows that without the implementation of additional measures (orange line), there could be an increase until the year 2025; subsequent projected reductions would still leave transport emissions in 2030 about 9% above 1990 levels.
If member states implement additional measures to reduce transport emissions (green line), a decrease is observed, and emissions would reach a level 6% below 1990 levels by the year 2030.
From a demographic point of view, EU citizens living in urban areas are expected to increase by more than 80% by 2050 [
2,
3]; therefore, it is extremely important to ensure efficient and low-impact transportation systems for cities.
With this in mind, current policies to decarbonize the transportation sector aim to protect the climate and environment while ensuring the economic and social balance of different countries [
4,
5,
6].
Planning, designing and adopting sustainable transportation and mobility systems has now become a global goal that can no longer be postponed. The European Council has approved the important goal of becoming climate neutral by 2050 on the one hand and reducing greenhouse gas emissions by at least 55% by 2030 on the other [
7,
8].
Indeed, local public transport (LPT) plays a key role against climate change by mitigating environmental impacts by (i) providing a more sustainable transportation alternative to individual use of private motor vehicles and (ii) complying with specific environmental and energy requirements, according to the latest European and national directives [
9,
10].
In addition, the European Commission is developing strategic plans and programs under Climate Neutral and Smart Cities to achieve decarbonization goals by 2030. These programs aim to promote public transport and the use of mass transit, walking and cycling, as well as automated, connected and multimodal mobility [
11,
12].
Several European cities are now stepping up efforts to address problems arising from growing traffic congestion and environmental and noise pollution, including using funds and financial resources that have been allocated.
For instance, the use of electric buses is among these measures.
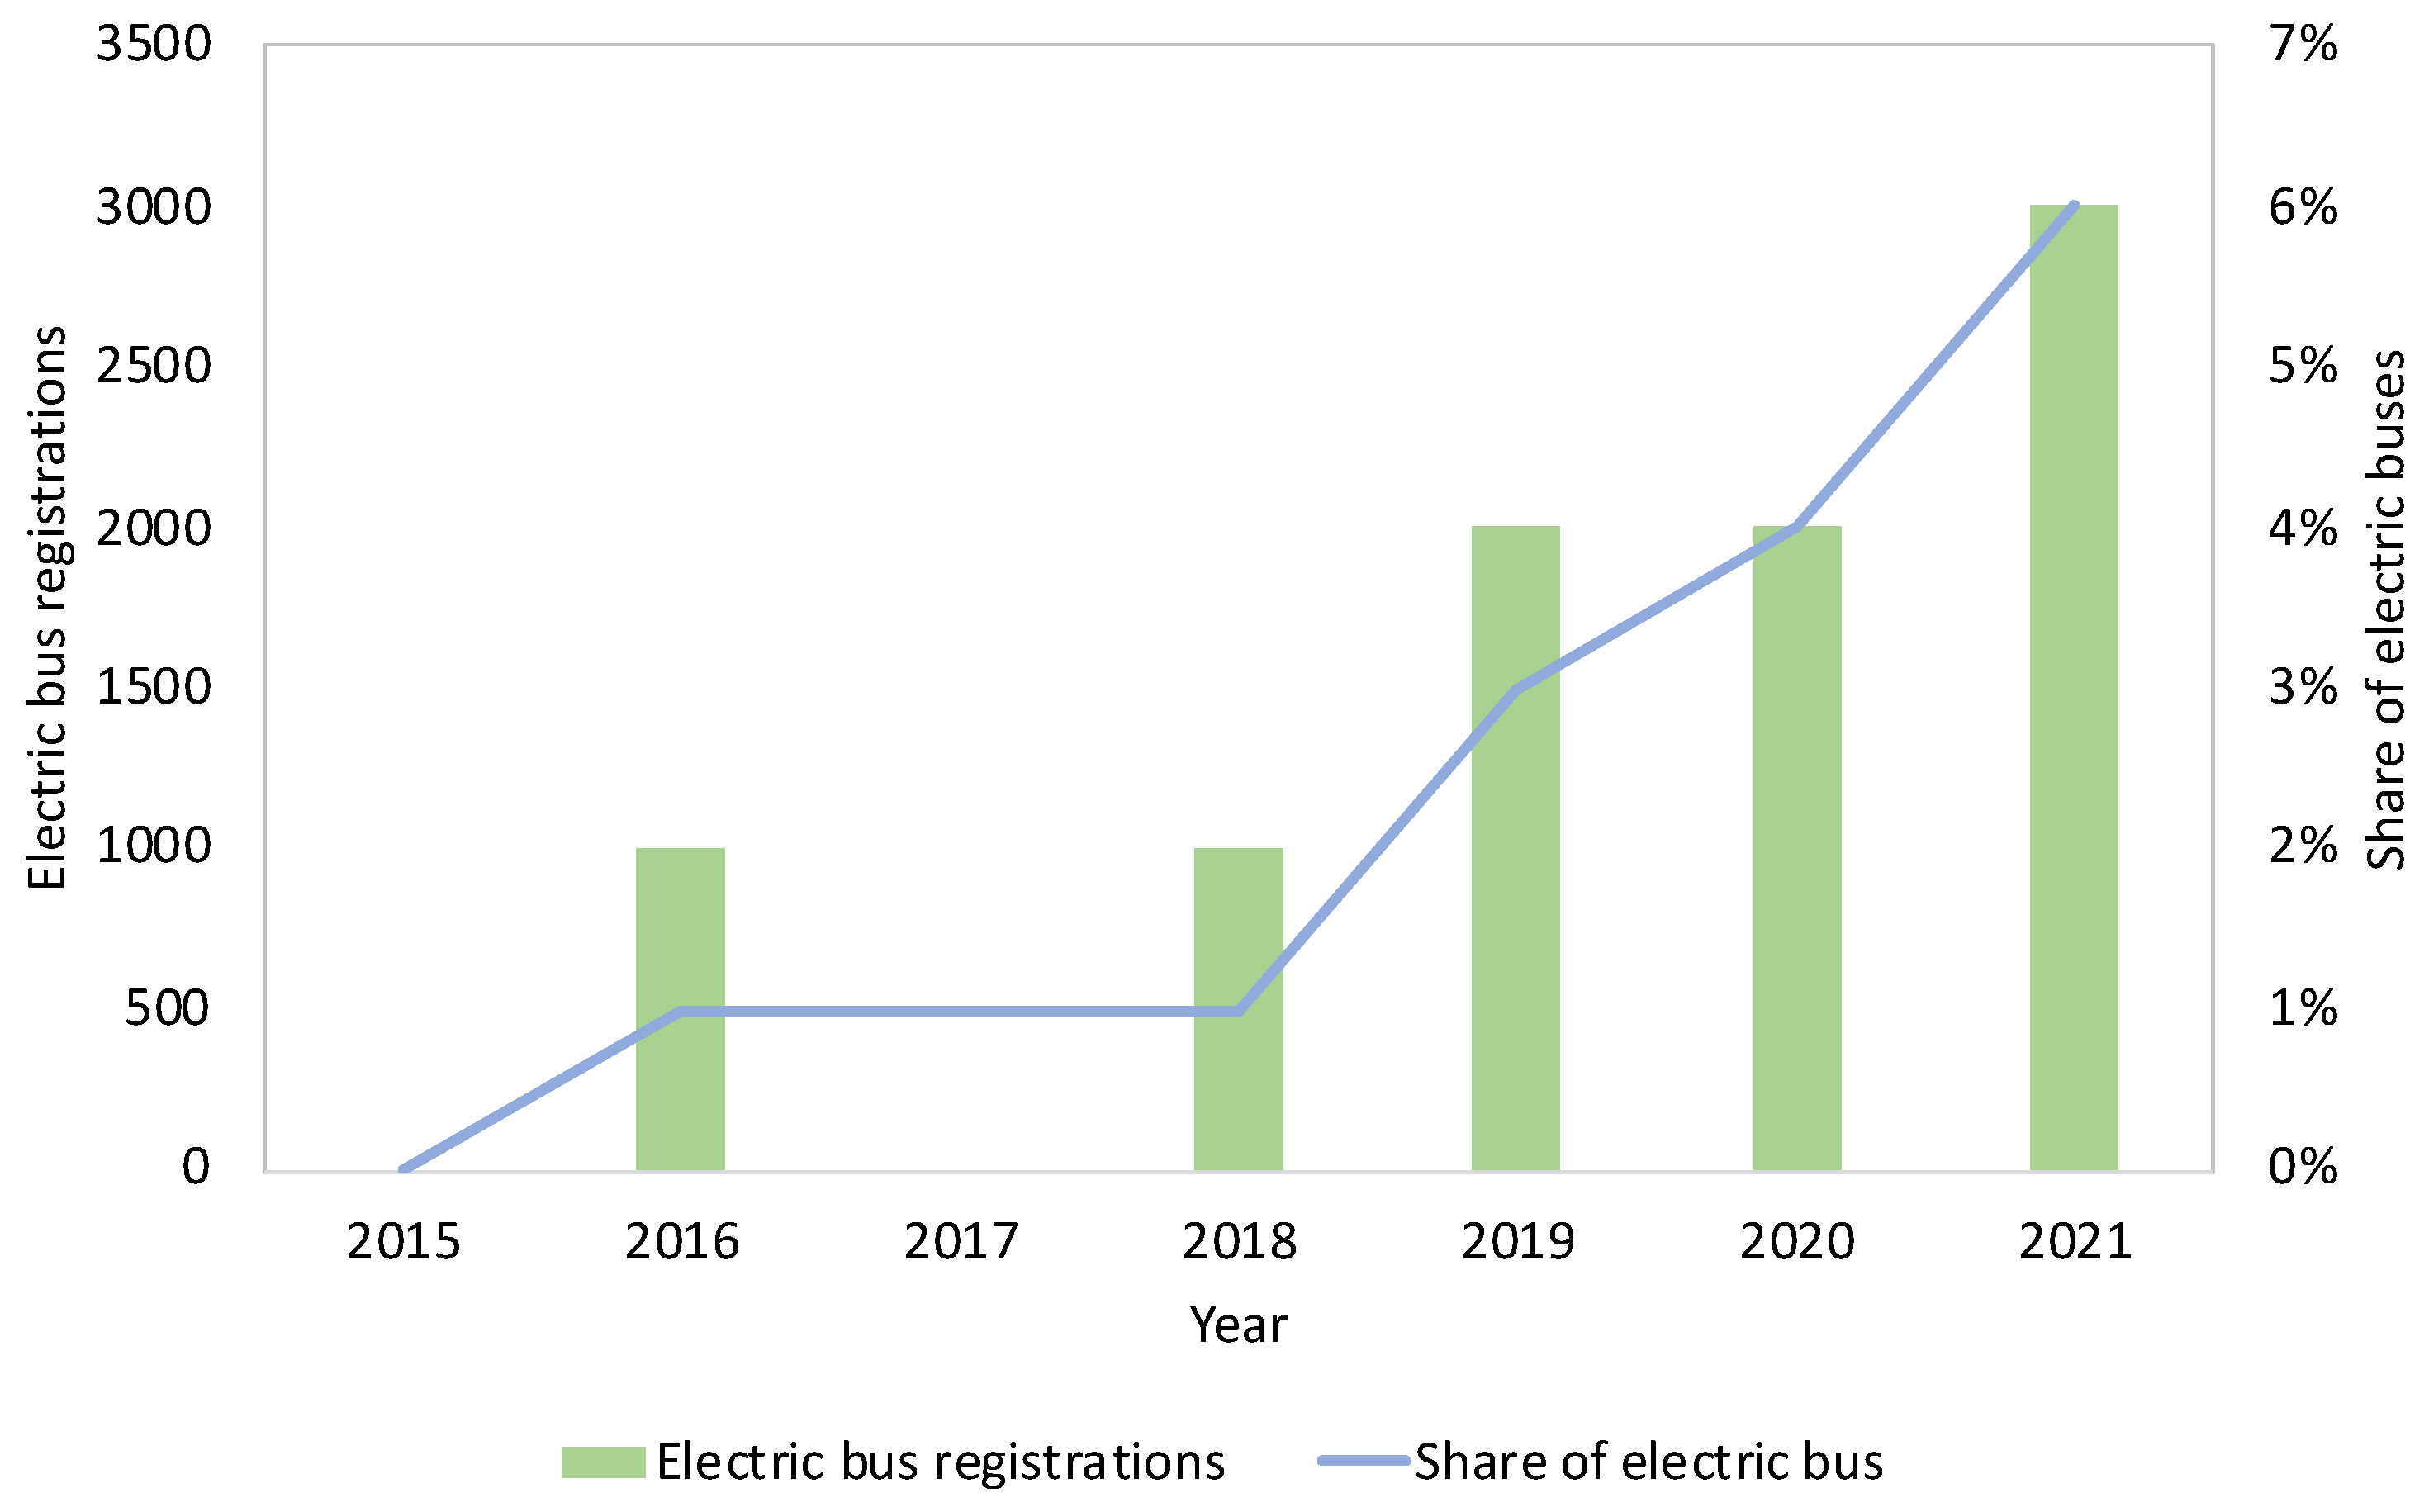
Figure 2 shows that registrations of new electric buses in the 27 European countries increased in 2021 compared with previous years, reaching about 6 percent of the total.
The increase in electric bus sales in countries such as France, Germany and Spain can be attributed to national and/or local goals to transition to public procurement of zero-emission buses only.
The Municipality of Brescia and its LPT company, Brescia Mobilità S.p.A., have embraced the environmental stance since the late 1980s, gradually shifting to greener vehicles. The company’s diesel bus fleet was converted into a full compressed natural gas (CNG) fleet, reaching 100% coverage in 2018. Thanks to additional funding opportunities provided by the National Recovery and Resilience Plan (PNRR), Brescia Mobilità’s green strategy is now moving forward: the Municipality of Brescia has been awarded more than EUR 8.6 million for the purchase of a minimum of 13 zero-emission (ZE) buses and the construction of the related power support infrastructures. Brescia Mobilità has therefore decided to investigate how and to which extent such new and greener vehicles could be rolled out, considering both financial and operational aspects. The aim of this work is therefore to present the findings of a first feasibility study about the conversion of a bus line from CNG considering two alternatives: (i) BEB and (ii) FCEB. A comparison of the three alternatives is then presented.
The first step of the investigation process considered the technical and operational constraints linked to ZE buses and their limited range of choice: rather than operating such buses randomly over the entire network, the optimal choice was the conversion of a single bus line.
The second step consisted of a feasibility study aimed at identifying the better among the two alternative tractions: battery electric (BEB) vs. fuel cell electric (FCEB). Moreover, the CNGB solution was also considered. To such purpose, several KPIs were identified: the capital expenditure (CAPEX), the operational expenditure (OPEX), the total cost of ownership (TCO) and the total cost and revenues of ownership (TCRO). Each of these parameters was computed over different time horizons (2022, 2025 and 2030) to assess to which extent time and the specific technology maturity curve could prove decisive to optimize investments over time. The analysis also allowed the development of decision support tools for the evaluation of green transport projects, both present and future.
This paper is organized as follows:
Section 2 provides the scientific background of this research,
Section 3 outlines the methodological approach adopted in this work,
Section 4 presents the case study in the city of Brescia,
Section 5 discusses the obtained results, and
Section 6 provides the conclusions and possible developments of this work.
2. Background
In the technical/scientific literature, several authors are studying the diffusion and application of electric vehicles. For instance, regarding the spread of light vehicles, it emerges that price is the determining factor in purchase choice [
14].
At least four approaches for evaluating the best alternative exist in the scientific/technical literature. The first one involves multi-criteria decision-making methodologies (MCDM) or their integrated fuzzy extensions [
15,
16]. In [
17], AHP (analytical hierarchy process) integrated with TOPSIS (technique for order of preference by similarity to ideal solution) is applied to evaluate six alternatives related to sustainable and environmentally friendly urban transportation in the city of Ankara, Turkey. AHP is a well-established technique to measure the weights of the different criteria identified, and TOPSIS finds the ranking among the different alternatives [
18]. The second approach focuses on choosing alternatives based on the environmental consequences of one bus alternative over another.
The assessments involve an environmental and economic life cycle assessment (LCA), incorporating various components of fuel consumption [
19,
20,
21]. The third approach is based on cost–benefit analysis (CBA). Lajunen analyzed the energy consumption and cost-effectiveness (in terms of operational operation) of different city bus configurations [
22]. Gerbec et al. improved the CBA for the public bus fleet in Ljubljana, Slovenia, to identify the most attractive alternative and support decision making in future choices. Finally, the last approach addressed the issue of selecting bus types through methods based on road tests [
23]. Gong et al. developed the method of selecting a BEV bus in China and provided standardized training for drivers involved in the process [
24]. Keramydas et al. tested different bus fuel alternatives in the city of Hong Kong [
25].
All these approaches provided valuable and effective evaluation processes, although they require complex procedures and detailed data that may be resource and time-consuming. Moreover, these models have a comprehensive approach that blends and reduces the weight of a key aspect in business decision making: economic and financial feasibility.
In the work of El Hafdaoui et al., a comparison is made between different bus solutions (hybrid, electric and fuel cell) vs. conventional diesel buses in Morocco. Although the results of this study are based on Morocco’s energy profile, it emerges that electric buses are the best alternative in terms of energy consumption, while fuel cell buses are better in terms of the environmental impact [
26].
Other studies are addressing the durability of vehicle batteries by considering charge and discharge cycles. In the work of Xing et al., a specific path is analyzed, and it emerges that the optimal charge and discharge threshold is between 25% and 85%. This range allows for a reduction in the average annual battery loss [
27].
Regarding the analysis of TCO and TCRO related to different bus solutions, several studies aimed at making comparisons are observed in the literature. For instance, in the study by Nurhadi et al., an economic comparison is made between two electric buses with different ranges and different types of chargers. The results show that the percentage change in line distance (km/year), years of operation and investment costs are the most significant influential factors on TCO. In Sheth and Sarkar’s study, a comparison is made between the electric and diesel solution considering a 25-year life cycle; the TCO of an electric bus is 5–10% lower than a diesel bus [
28,
29].
In other studies, a comparison has been made between different electric bus charging modes: Depot Charging (DC) and Opportunity Charging at terminal stops (OC). In many cases, it emerges that opportunity charging is the most suitable solution; in the work of Jefferies and Göhlich, in which 39 bus lines are analyzed, the TCO calculation for the DC solution turns out to be 1–6% higher than the OC solution [
30,
31].
Other studies have been concerned with analyzing and proposing a methodology to evaluate the techno-economic performance of BEB fleets for different battery sizes, infrastructure and charging strategies [
32].
More generally, battery and fuel cell buses are considered to have the features to meet operational requirements for operation. Fuel cell technology could be considered as an alternative, especially in contexts where longer driving range is required. However, slow market penetration of fuel cell technology is observed; this slowness can be attributed to the fact that the research and development activities of major manufacturers are currently focused on electric battery technology [
33].
This work aims at proposing a quantitative process for economic and technical-feasibility assessment, using renowned and established KPIs. The analyses performed can be validated in the future with analytical models proposed in the literature to verify their consistency.
3. Methodological Approach
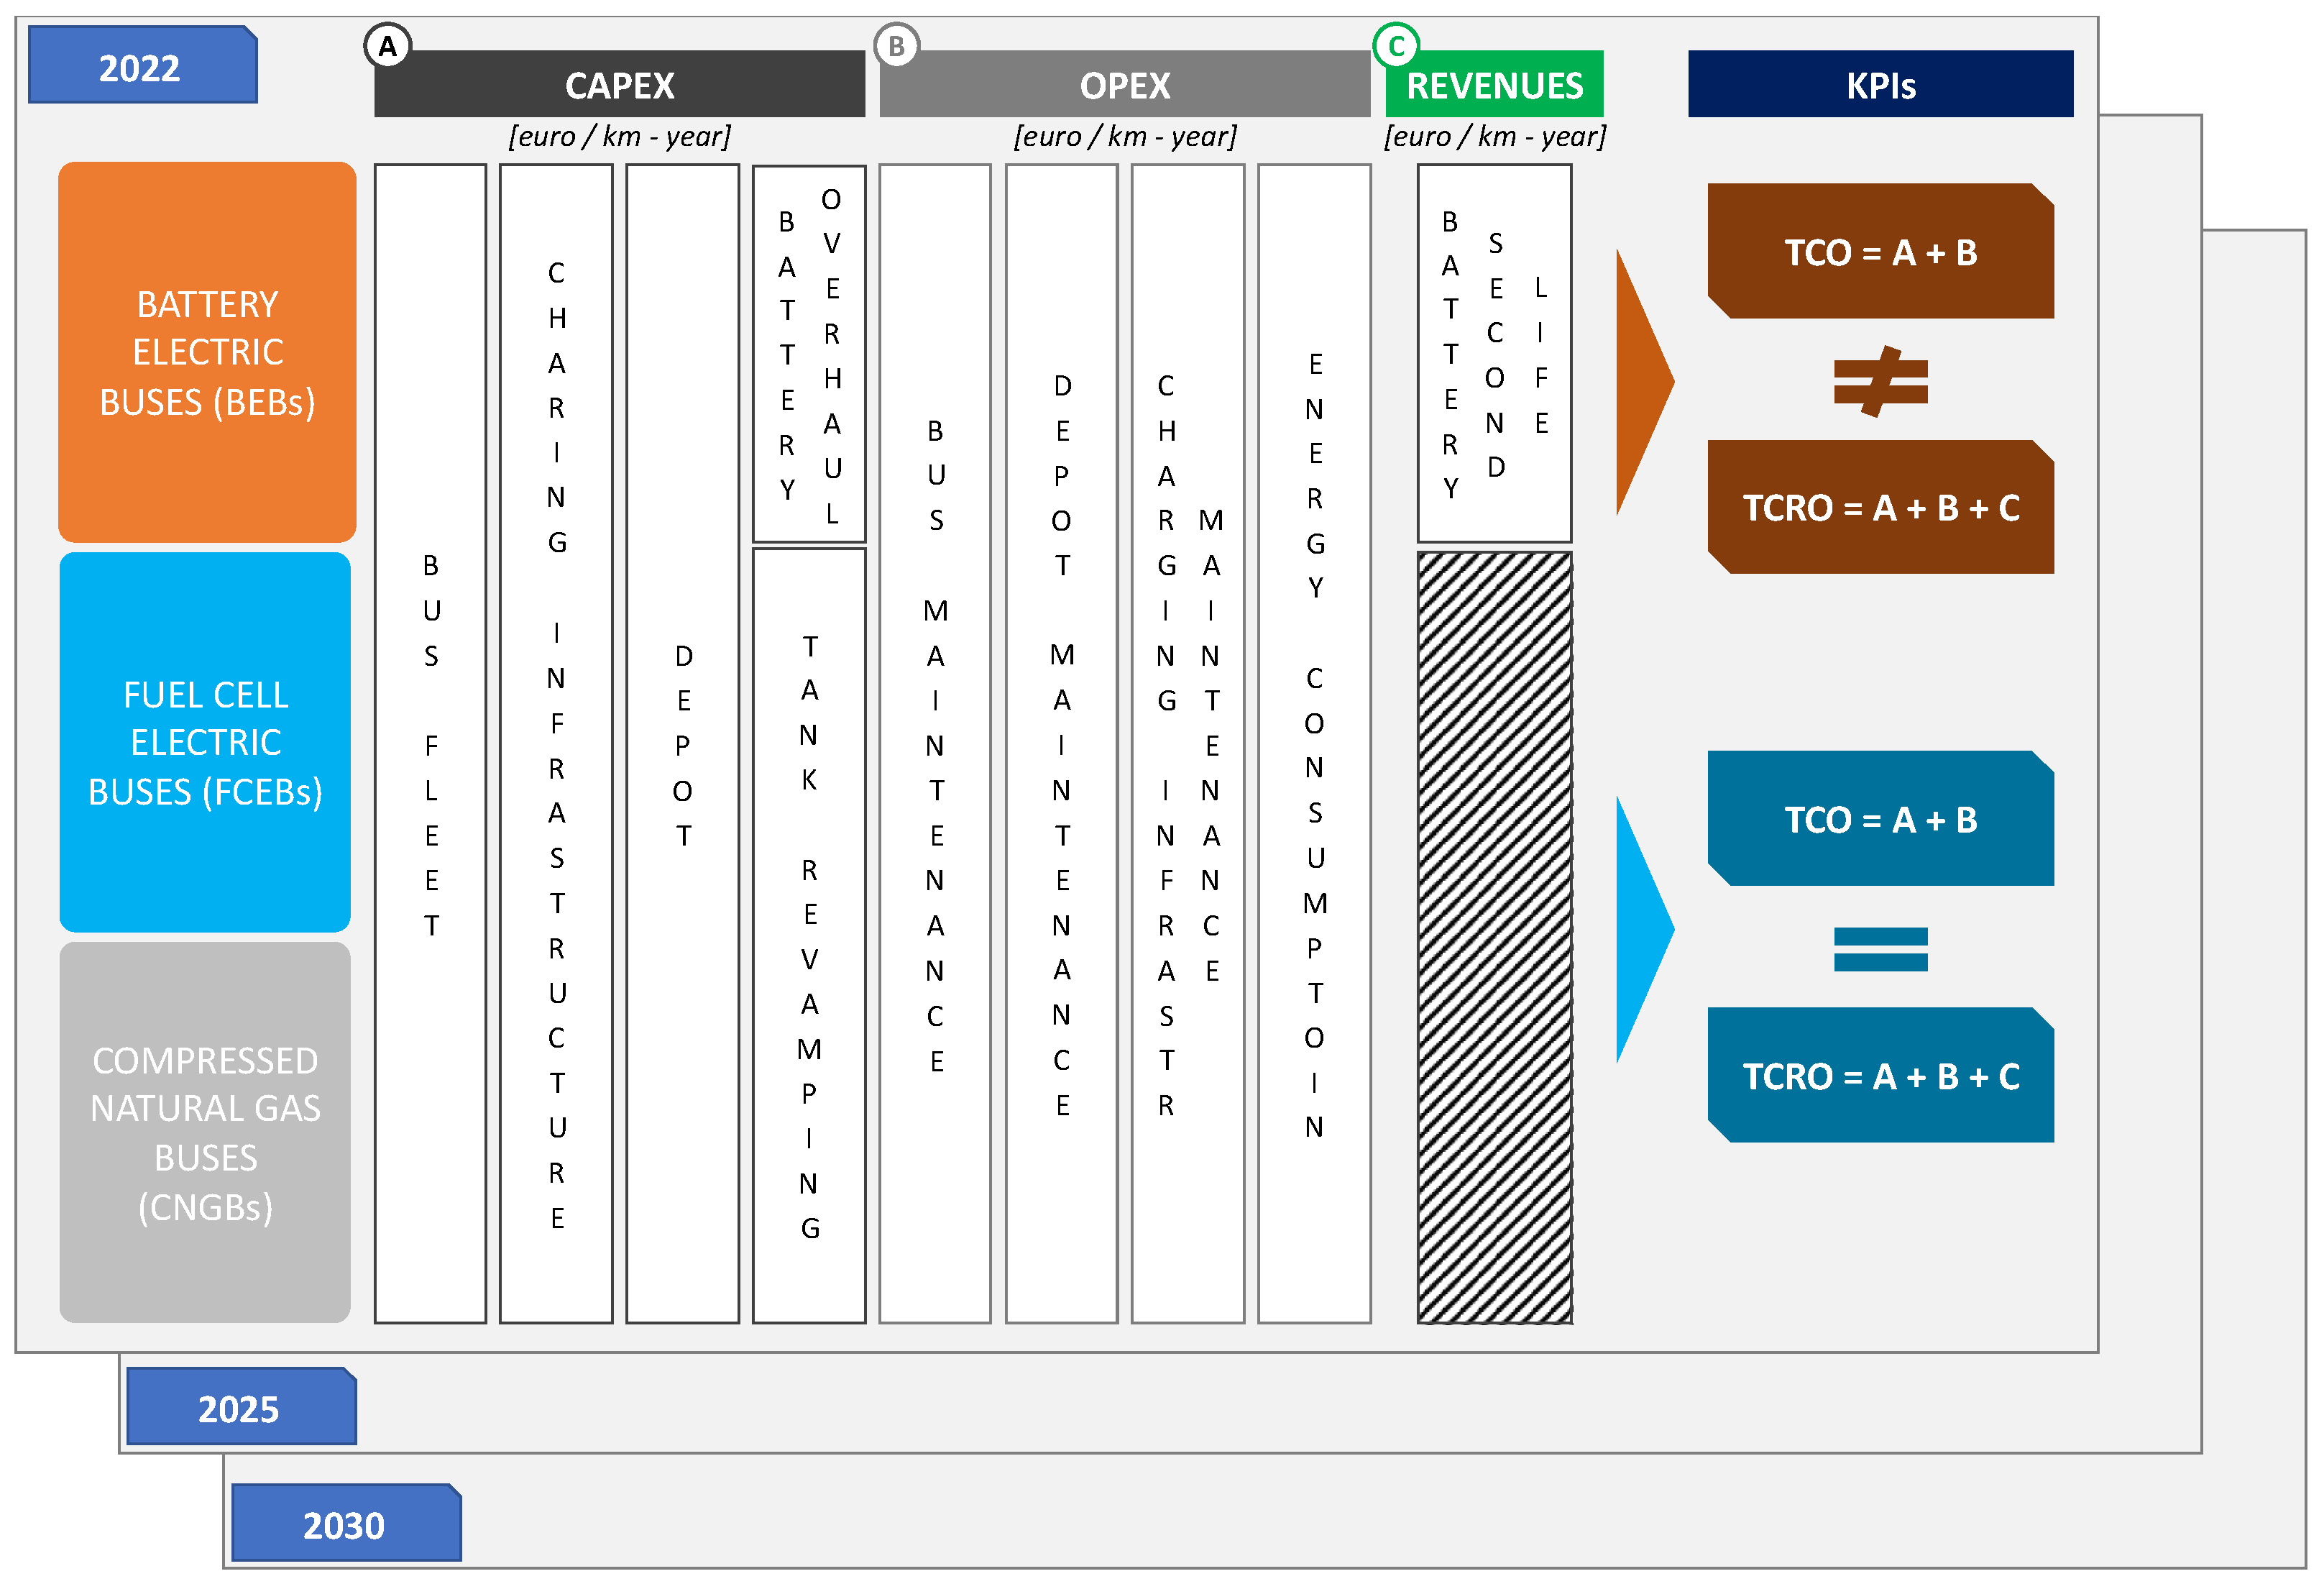
The analysis started by identifying the key parameters related to the CAPEX and OPEX of the three alternatives (BEB, FCEB and CNGB). This allowed us to determine the TCO and TCRO along three annuities (2022, 2025 and 2030). The methodological framework adopted in this research is shown in
Figure 3.
CAPEX considers the investments made to acquire multi-year physical assets, such as new buses, charging infrastructures and bus depots. The current bus fleet’s depot has reached its limit capacity; moreover, due to the technical and safety requirements, BEB/FCEB must have a separate depot; hence, a new depot should be built. Capital expenditure also considers mandatory expenditure for battery replacement (for BEBs) and tank revamping (for FCEBs and CNGBs) to ensure fleet operations until the expected (and designed) lifecycle end. On the other hand, OPEX consists of costs to run the service, such as maintenance, recharging and/or refueling, etc.
Once CAPEX and OPEX are clearly defined, it is important to define an undisputable metric, to compare the three alternatives and understand in which one it is better to invest. Total cost of ownership (TCO) is, both in academia and in practice, the parameter to compute in the case of lack of revenues (i.e., components’ second life). Whenever revenues are expected, they should be considered in the computation by using the metric total cost and revenues of ownership (TCRO). It is worth mentioning that the latter applies to BEBs as batteries’ second lives are implied.
The performed analysis does not currently consider the calculation of environmental externalities, such as CO2 emissions, and more generally the life cycle assessment of the considered solutions.
Indicators Definition
In what follows, the parameters included in the computation of the main economic indicators and the related analytical formulas are presented. To compute the CAPEX, the following parameters should be considered.
The capital expenditure (CAPEX) is computed as the sum of the costs related to the purchase of buses (
), the building of depot (
), the construction of the charging infrastructure (
) and the cost associated with battery overhaul or tank revamping (
, as follows:
To define the correct size of the investment (i.e., the number of buses), operational parameters should be considered, particularly the total annual mileage (
TAM) of the chosen line. Such an indicator is defined as the sum of the working days
, Saturdays
and non-working days
multiplied by their related mileage
,
and
, as follows:
The number of buses
is computed as the ratio between
and the annual mileage limit of each bus,
(which was set according to specific topic literature [
34]). To consider reserve capacity (e.g., accidents, failures), a 10% vehicles stock is considered. Therefore, the number of buses is computed as follows:
The cost of the bus fleet
is computed by multiplying the cost of a single bus
by the
and the company’s co-financing rate
, given the existence public funding.
The cost of the bus fleet depot construction
is computed by multiplying the area required for parking a single bus
,
and the cost of building a square meter of depot
.
The cost of the bus fleet charging infrastructure construction
(charging stations) is computed as the installation cost of the single charging station
multiplied by the number of charging stations required
.
The cost of revamping
is computed as the unitary cost for tank revamping (in case of FCEBs) or battery overhaul (in case of BEBs)
multiplied by the number of buses
.
The operational expenditure (OPEX) is computed as the sum of the costs related to annual fleet maintenance (
), the annual depot maintenance (
), the annual charging infrastructure maintenance (
) and annual energy consumption (
), as follows:
The annual fleet maintenance cost
is computed as the product among the maintenance cost per kilometer for each bus
, the number of buses
and
.
The annual depot maintenance cost
is computed as a fraction of the cost of depot construction; it is the product of the depot amortization (considering the depot lifecycle
) by a 0.15 factor (depot maintenance is about 15% of the depot implementation cost).
The annual charging infrastructure maintenance cost
is computed as a fraction of the cost of charging infrastructure construction; it is the product of the depot amortization (considering the depot lifecycle
) by a 0.05 factor (depot maintenance is about 5% of the charging infrastructure construction cost).
The annual energy consumption
of the bus fleet is computed as the product of the yearly consumption of a bus
(expressed in kWh/year), the energy price
and the number of buses
.
The annual revenue from battery packs
defines the income deriving from selling used batteries for other purposed.
is the value of 1 kWh battery at the end of its life;
is the maximum threshold, beyond which is mandatory to replace the battery;
is the capacity of the battery;
is the number of buses needed to provide the transportation service; and
is the life cycle of the battery.
Finally, the reference parameters for the assessment are computed. In order to annualize CAPEX, specific and different life cycles are defined for buses (), depot construction () and charging infrastructure (), allowing to compute the yearly cost for buses’ purchase (), depot construction () and charging infrastructure construction ().
The total costs of ownership (TCO) is computed as follows:
The total costs and revenues of ownership (TCRO) is calculated as follows:
4. Case Study: Urban Bus Fleet of Brescia
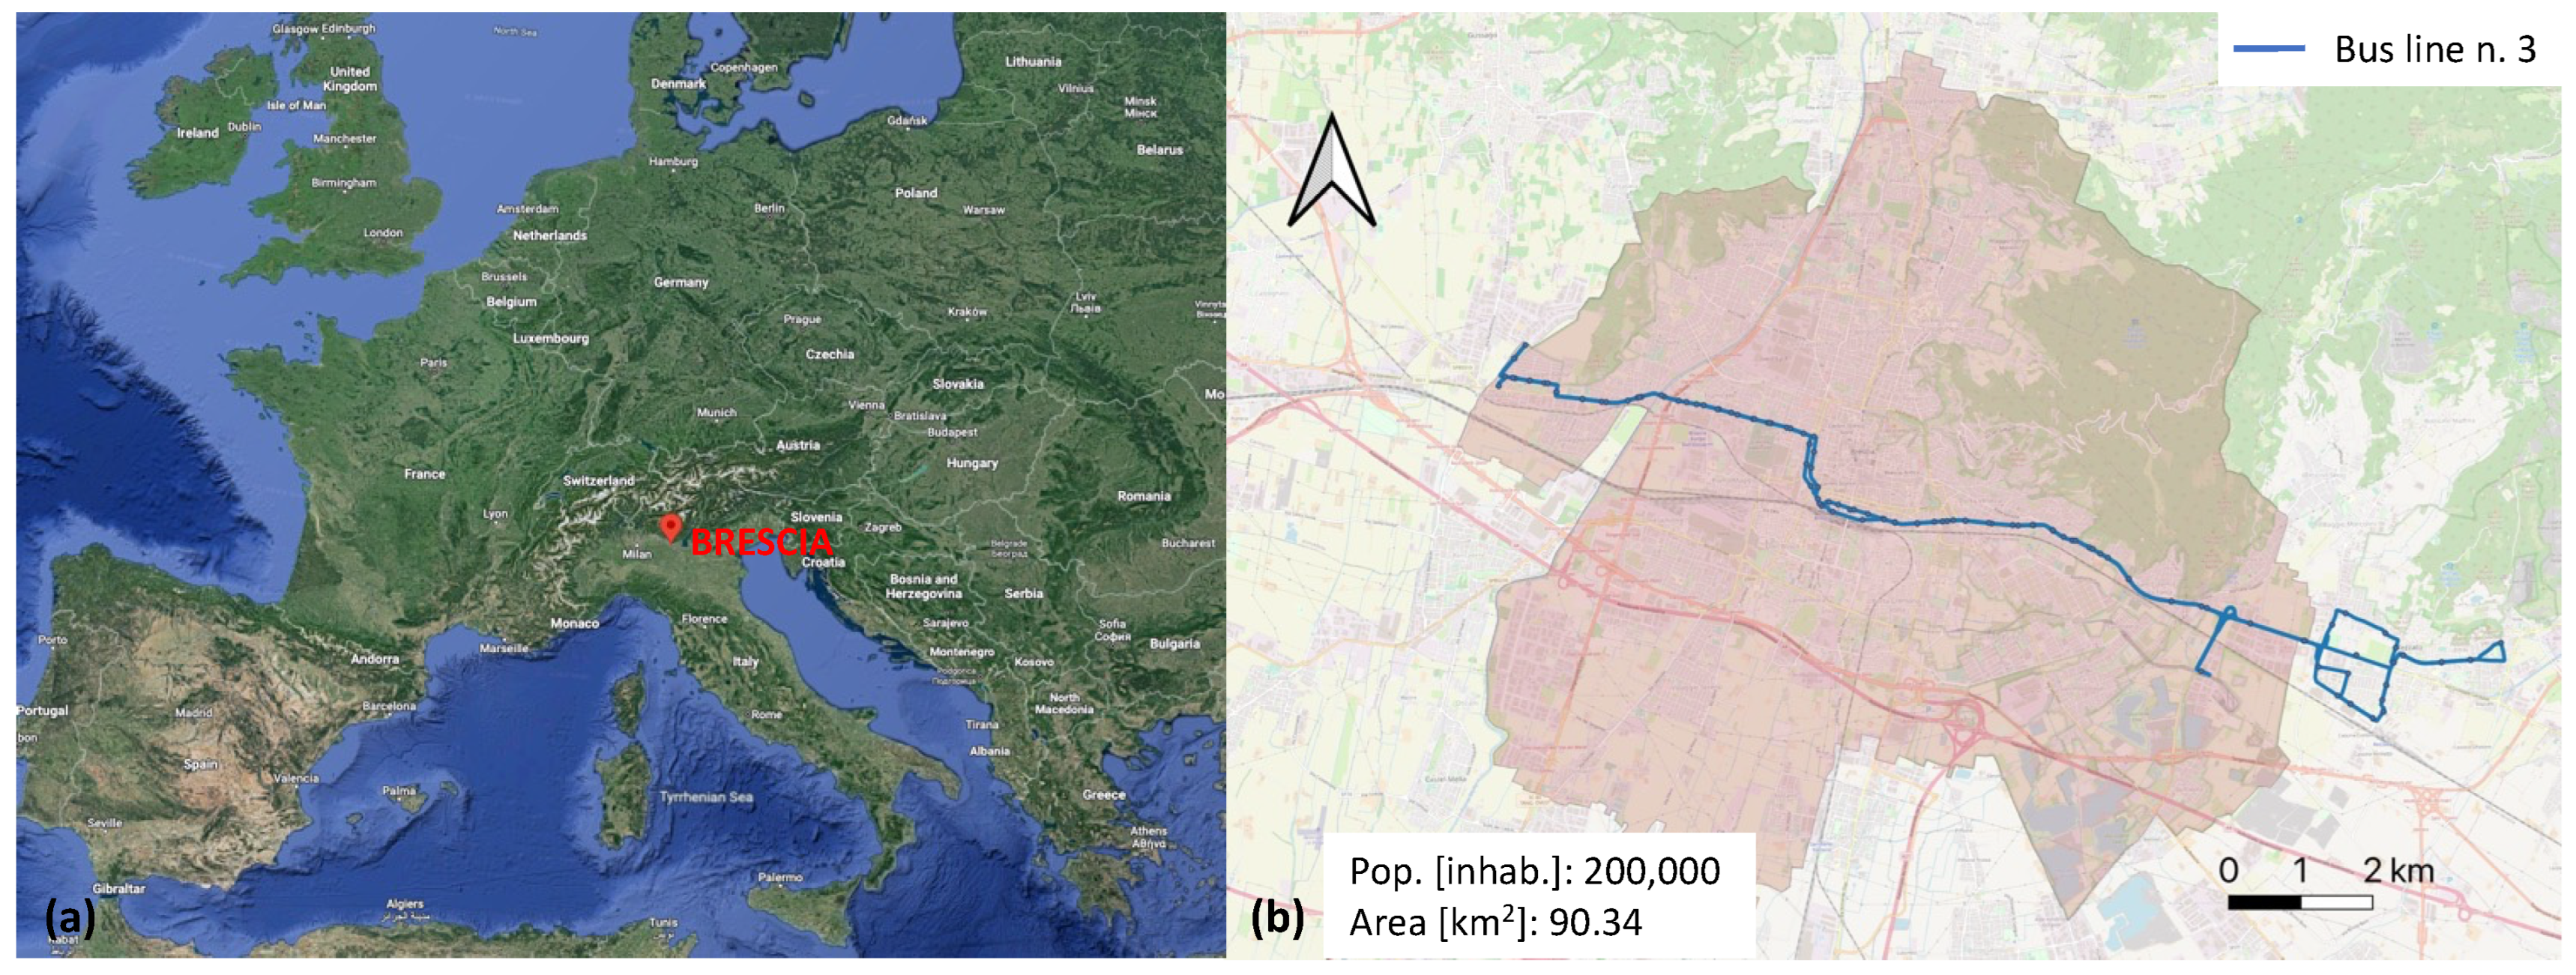
The urban bus network of Brescia, operated by Brescia Trasporti S.p.A. (subsidiary of Brescia Mobilità) consists of 17 lines, covering the city of Brescia and 14 surrounding municipalities. The bus line no. 3 is considered here as case study for its characteristics. Specifically, it represents the third major PT line of the network, carrying about 12% of total passengers of the city, as shown in
Figure 4. The line runs about 43 km, of which 28 km are operated in the urban area (Brescia) and 15 km in the suburban area (municipality of Rezzato), crossing the city from west to east and connecting main neighborhoods and services (i.e., city center, railway station, high schools, etc.). For such reasons, it was considered as the more appropriate choice for moving the green strategy of the city forward.
Table 1 shows the main operational and service features related to line no. 3 for the year 2022 and BEB and FCEB service performance.
It is important to note that Brescia is extremely committed into the e-transition of the transport services (and mobility sector in general) and is moving forward to provide citizens with more sustainable and environmentally friendly services. Indeed, in 2013, the city placed an automated light railway into service, which is completely electrically powered. Moreover, in the next years (i.e., 2029), the city will also have a new electric tramway line that will mostly replace the bus line no. 2, the second most important PT route, which is now operated by CNG buses. In addition, the city has a full electric car sharing service, with a fleet of 20 e-cars. The city is also providing services for private e-vehicles by implementing the charging infrastructures over the entire area: by the end of 2023, more than 150 new e-vehicle recharging stations will be installed over the city. According to this strategy, it is expected that the environmental impact of the urban transport sector will decrease over time, thanks to many more sustainable mobility solutions for private cars.
No changes in the line setting nor other service implementations are planned; therefore, new buses with novel technology must guarantee the same transport performances as the current CNG fleet in terms of the transport demand and route. In what follows, all the input data are presented, for both the BEB and the FCEB solutions; data sources are both internal (e.g., construction cost) and external, and are mainly used to address figures on the buses’ technical data [
34]. Starting with the methodological approach presented in
Section 3, the parameters needed to define CAPEX and OPEX were calculated. These parameters were calculated for both the battery solution and the hydrogen solution.
Specifically, in relation to the depot construction, the following requirements were considered in the analysis for both technologies: a single bus area of 260 m2/bus, with a depot dimension of 4940 m2 and cost of EUR 250/m2 for a total of EUR 1,235,000. Regarding the life cycle of vehicles and infrastructures, the following were considered: 10 years for buses, battery packs (in case of BEB) and recharging/refilling infrastructures, while 30 years were considered for the depot. It is important to specify that all the considered prices reflect the best up-to-date knowledge of the specific commodity market. In this regard, several possible estimates were considered, and the selected values are associated with the most likely scenario.
4.1. Battery Electric Buses (BEBs)
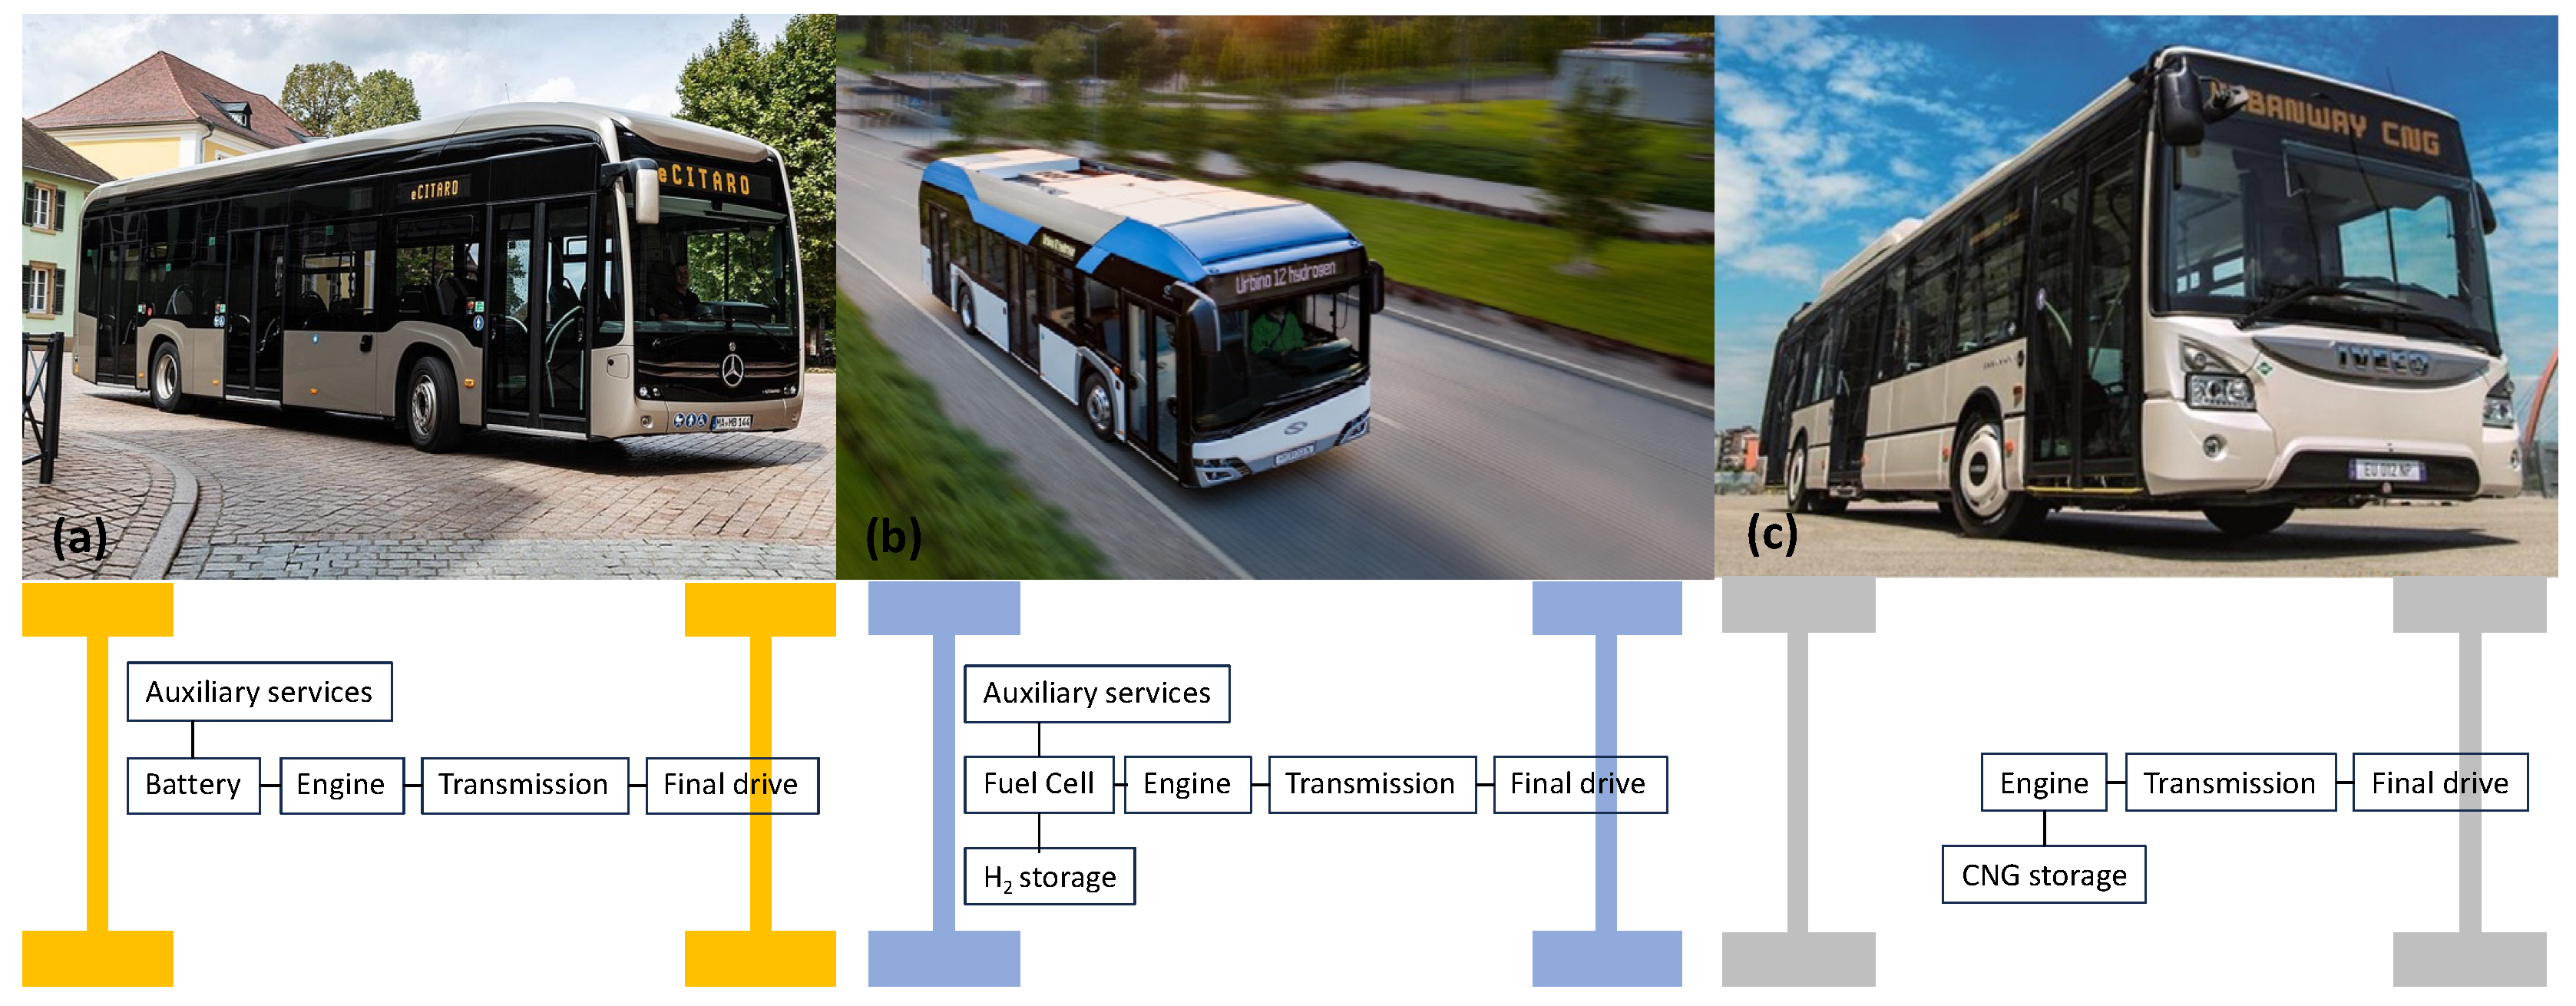
The battery electric bus is powered by electricity stored in a battery pack located on board the vehicle; this technology does not include any mechanical parts apart from transmission apparatus.
The battery electric bus can be used in two different modes: opportunity and overnight. Basically, the main differences between the two modes are based on range and charging time. The opportunity electric bus has a smaller (and lighter) battery pack that offers a limited range (about 30–50 km), and full charge (80–100%) can be achieved in about 5–10 min. In contrast, the overnight electric bus contains a relatively larger (and heavier) battery pack, with a range of over 300 km and a much longer charging time (2–4 h) [
33].
The BEB here refers to a 12 m e-Citaro Mercedes bus type, with a battery pack of 330 kWh (10 lithium-ion NMC batteries with 80% of useful capacity), an average range of 50,000 km/year [
34] and a transport capacity of 70 pax/bus. We identified the e-Citaro as the reference e-bus as it is broadly used in some of the main European cities (e.g., Berlin). In this case, 16 recharging units (70 kW) were estimated in the depot, with a cost of EUR 28,000 each (total of EUR 448,000). Moreover, thanks to the expected second life capacity of batteries, revenues are expected from the nominal battery capacity of EUR 60/kWh [
34].
Table 2 shows the data for BEB technology, with the expected variation over three time periods.
4.2. Fuel Cell Electric Buses (FCEBs)
In fuel cell buses, H2 is stored under high pressure in a gaseous form in cylindrical tanks; currently, the storage capacity can range from 35 to 50 kg. There is a fuel cell system, a battery, an electric motor and a power control system. The fuel cell is supplied with hydrogen, and the chemical energy is converted into electrical energy that provides the traction force to the vehicle.
The FCEB here refers to a 12 m Solaris Urbino bus type, with a tank capacity of 37.5 kgH
2 and a transport capacity of 70 pax/bus. We identified the Solaris Urbino as a reference because, according to the authors’ knowledge, it is currently the only operational H-bus in Italy (Province of Bolzano).
Table 3 shows the data for FCEB technology, with the expected variation over three time periods.
4.3. Compressed Natural Gas Buses (CNGBs)
The compressed natural gas bus is the solution currently in use in the city of Brescia. These are vehicles with internal combustion engines powered by CNG. The fuel is contained in cylinders at a pressure of about 200 bar.
The CNBG here refers to a 12 m Iveco URBANWAY bus type, with a total capacity of 1280 kg CNG and a transport capacity of 80 pax/bus. This vehicle is equipped with an 8.7 L Euro VI engine and is capable of delivering a maximum power output of 228 kW.
Table 4 shows the data for CNGB technology, with the expected variation over three time periods.
Figure 5 shows the three bus models considered in this study.
5. Discussion
The preliminary analysis was performed considering the values reported in
Section 4.1,
Section 4.2 and
Section 4.3 in the three time periods of 2022, 2025 and 2030.
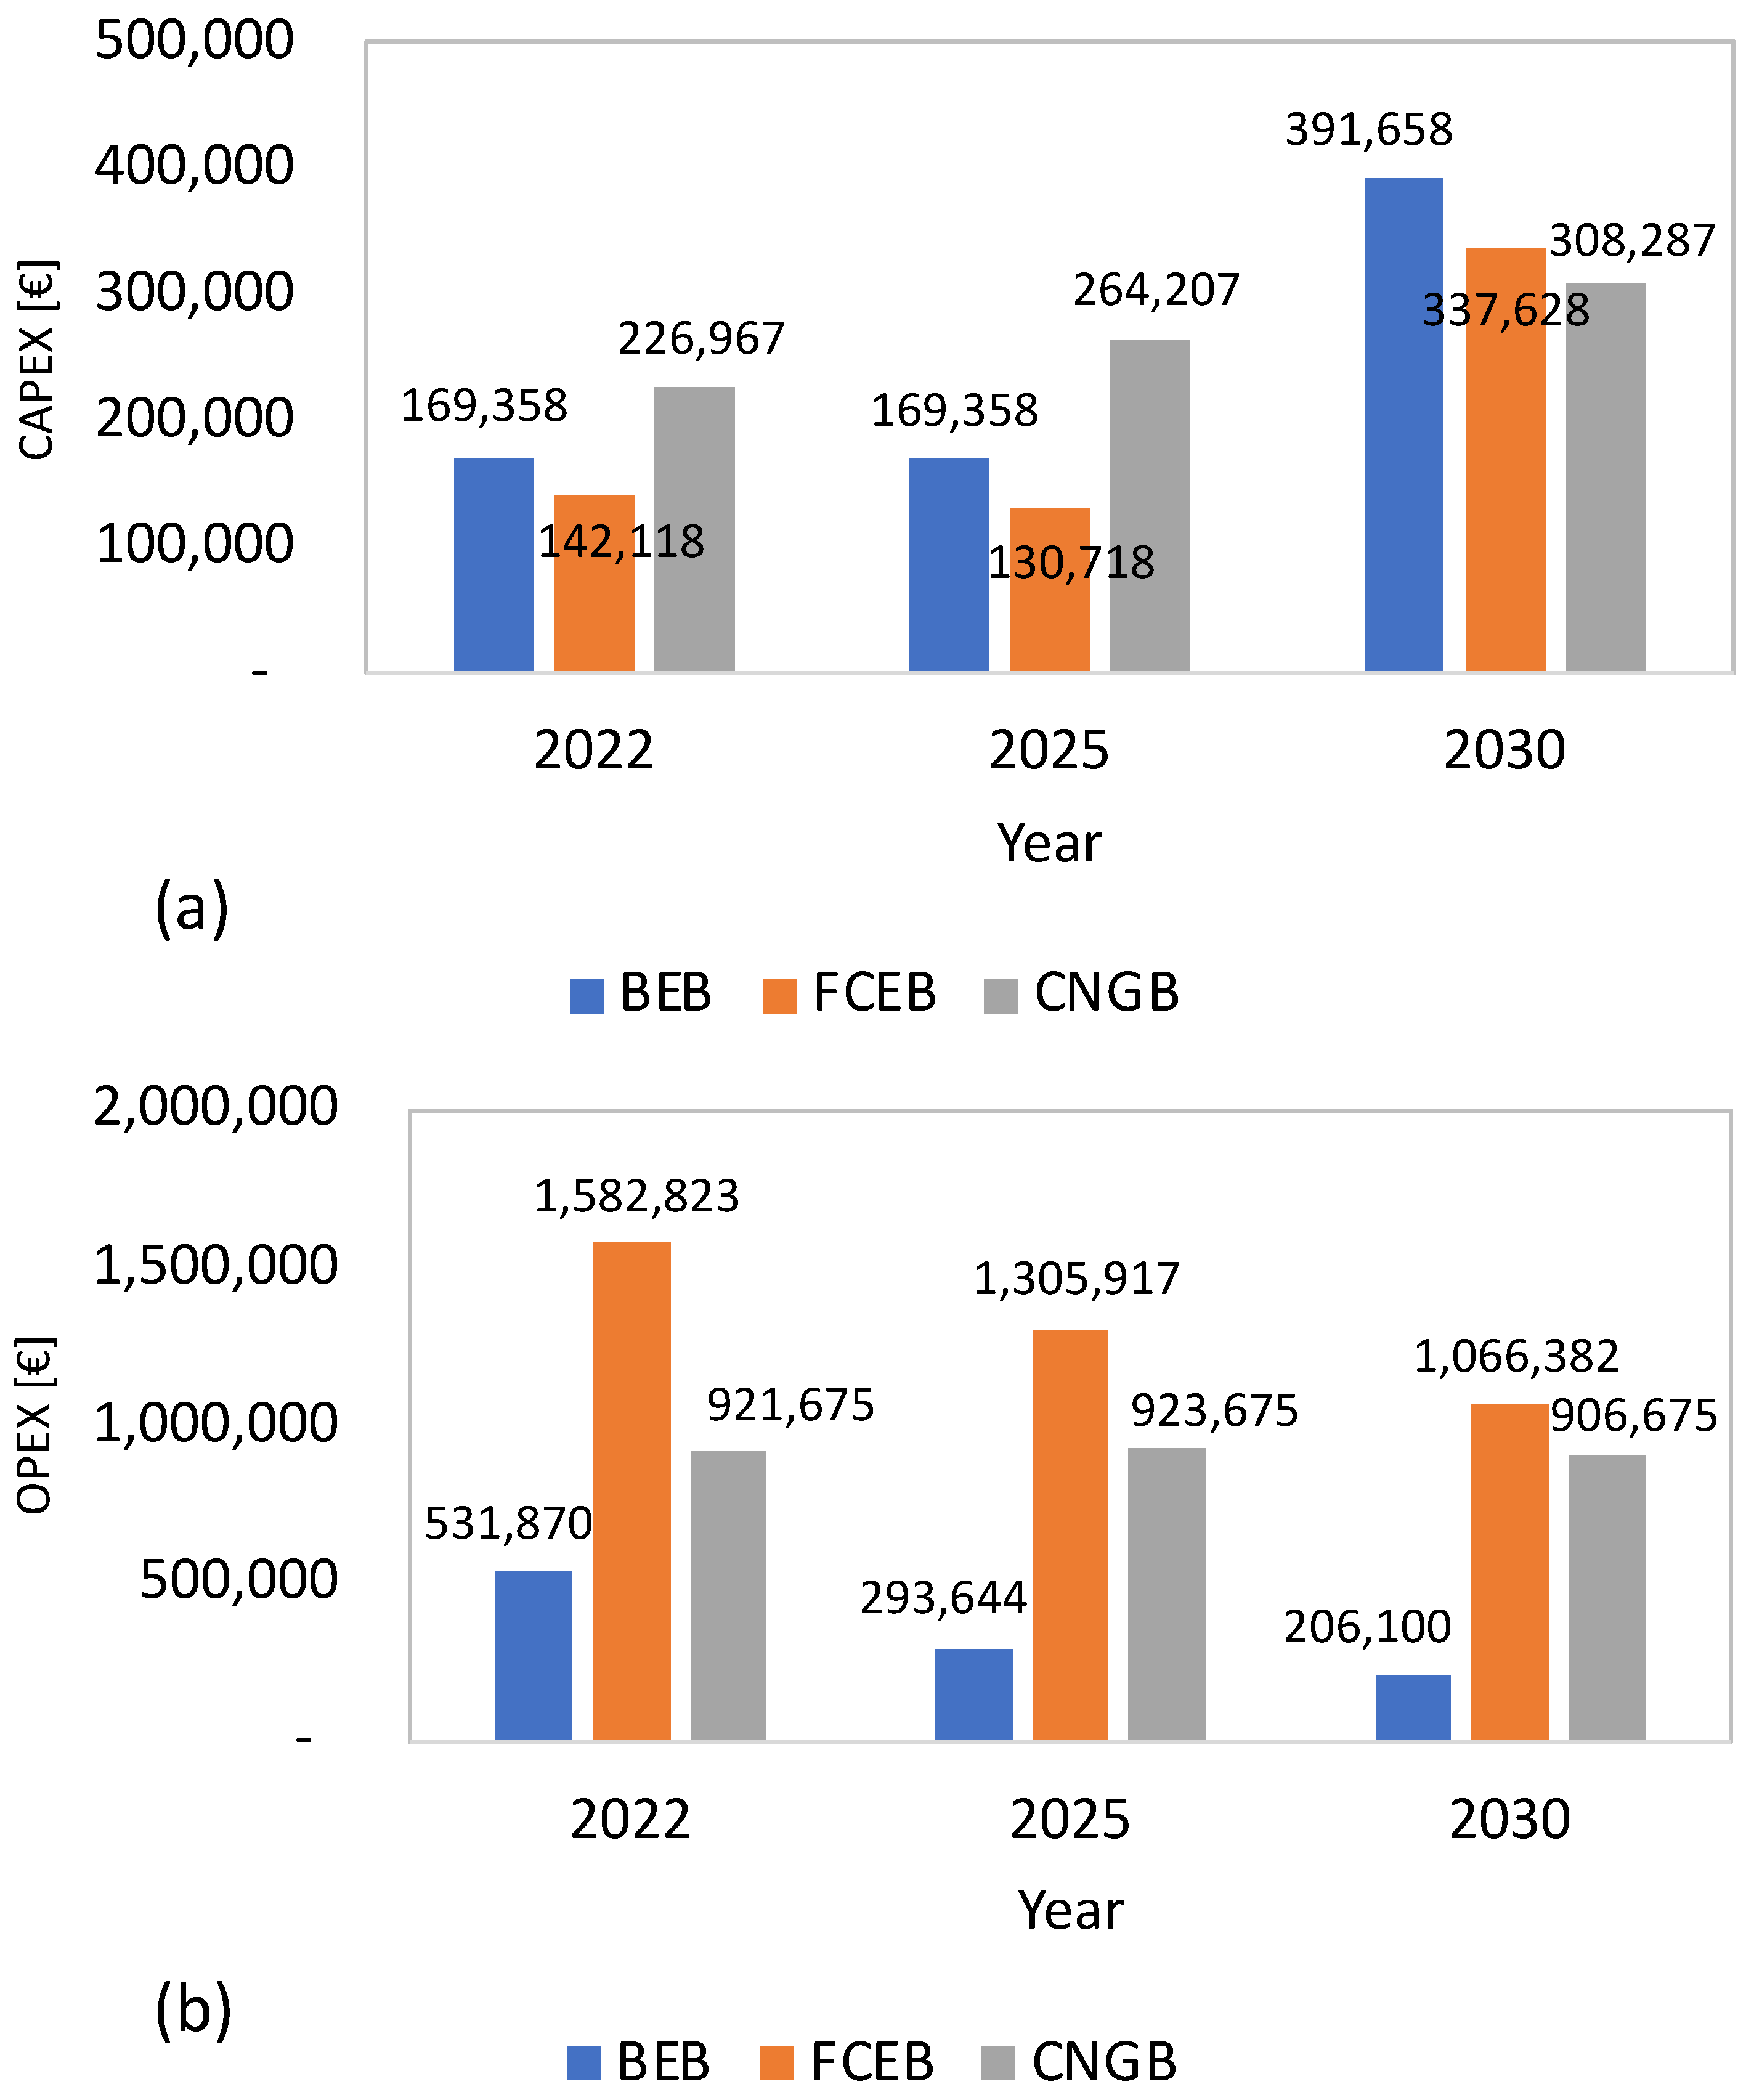
Table 5 and
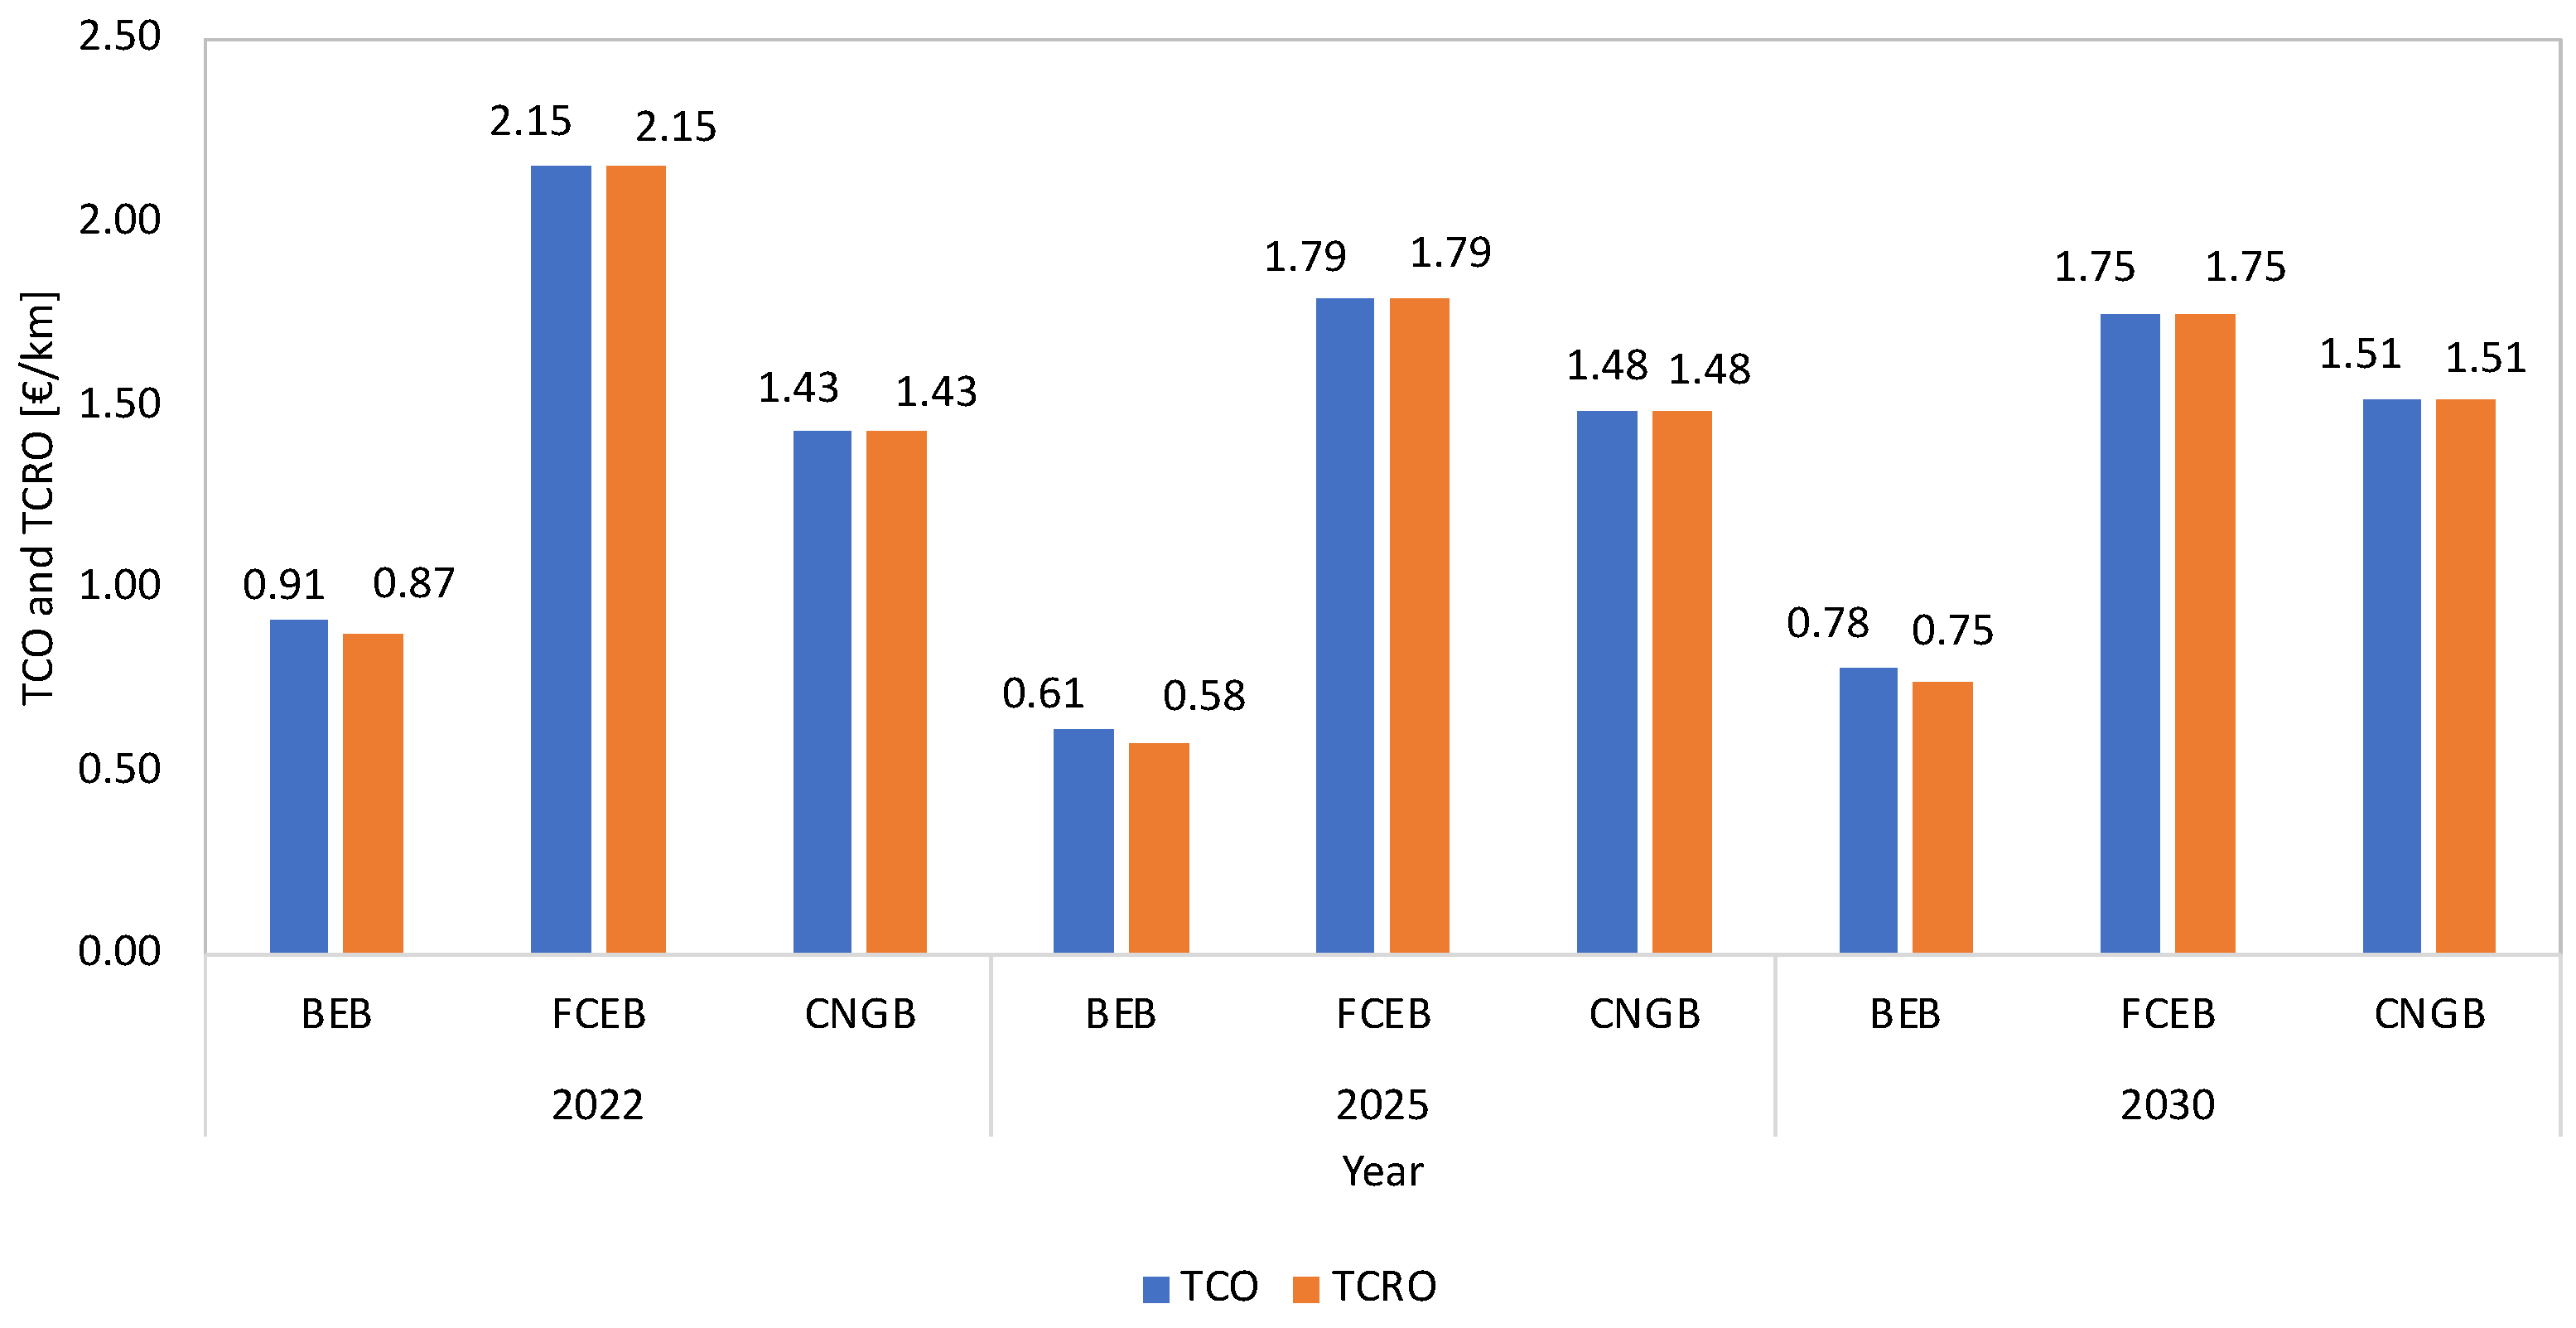
Figure 6 show the results for the calculation of CAPEX and OPEX considering different costs. Next, TCO and TRCO for the three solutions were computed, as shown in
Figure 7.
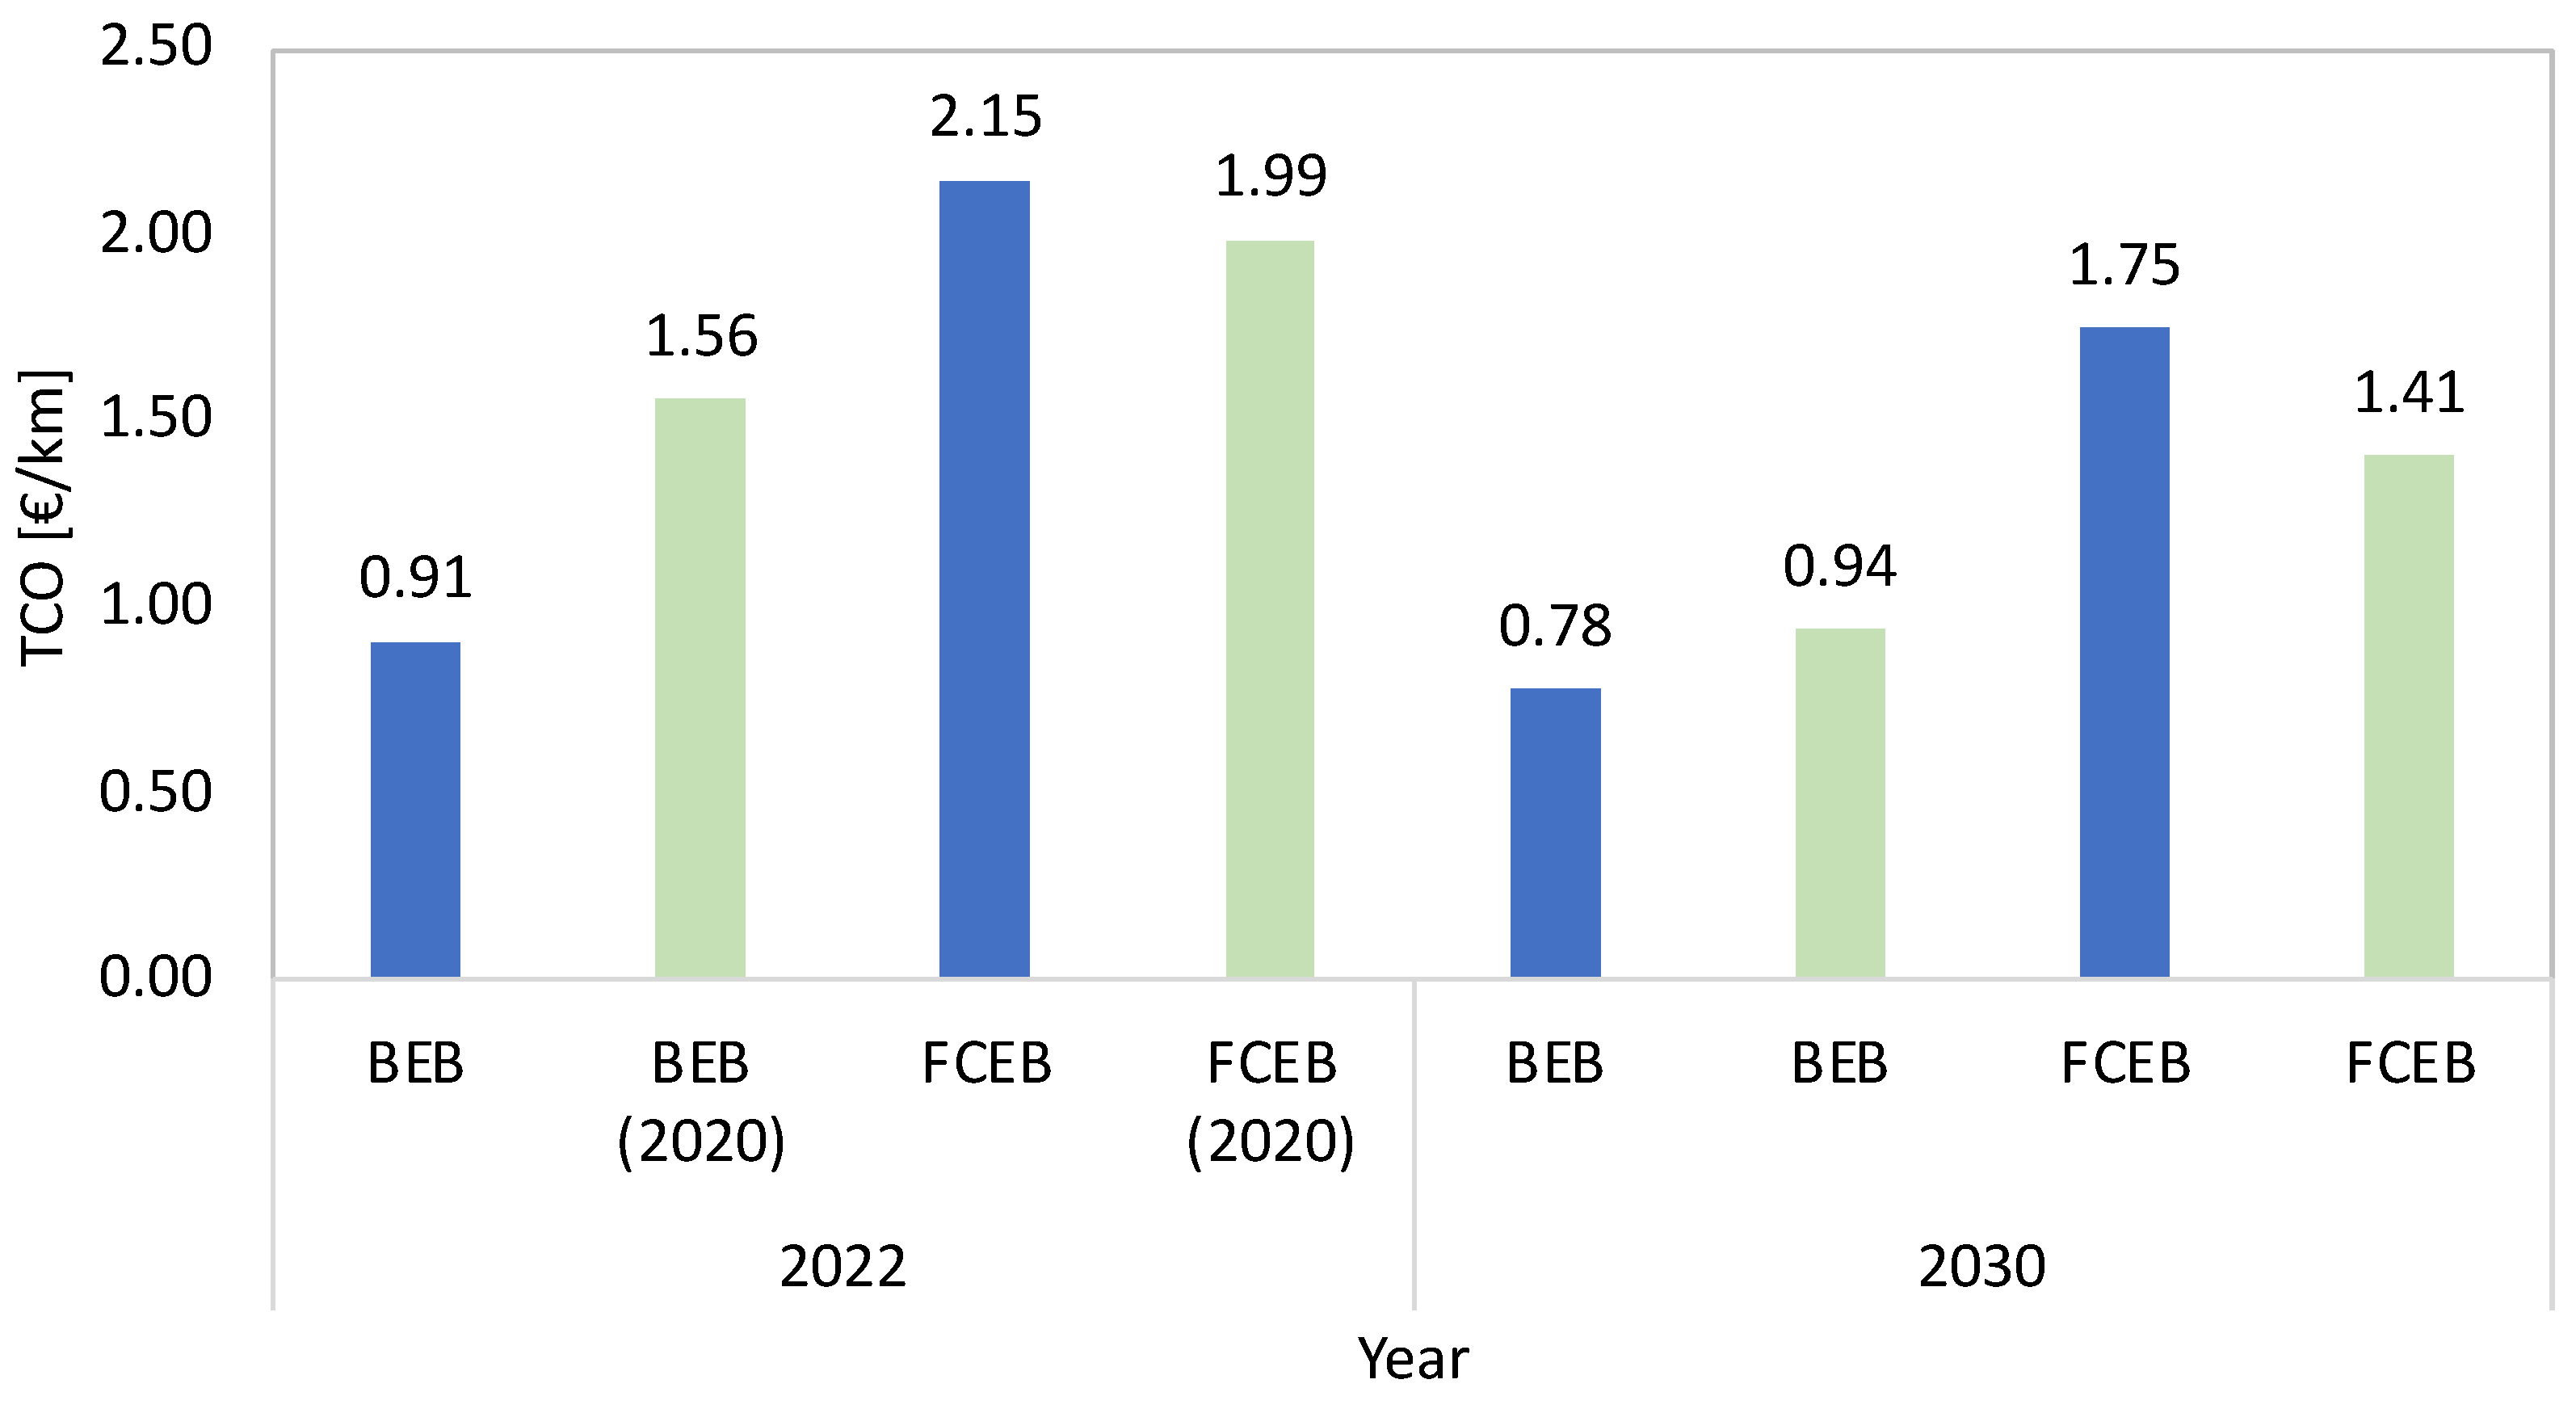
To verify the obtained results, a comparison was made with a study regarding the TCO analysis between battery buses and hydrogen fuel cell buses. This study was performed for the year 2020 and 2030. While it is not easy to make a comparison as the calculation assumptions are different, it is still considered useful to perform an approximate comparison. First, it should be pointed out that our work refers to the following three time periods: 2022, 2025 and 2030. Therefore, it is possible to make a comparison to the year 2030, and it was necessary to make the comparison between the year 2022 of our study and the year 2020 of the literature study (difference of 2 years). Also, in our work, the purchase cost of vehicles for both solutions (BEB and FCEB) is not considered in the year 2022 because national incentives of 100% are assumed on the purchase price.
Figure 8 shows the results of our study in blue and the results of a paper presented by Kim et al. [
35] marked in green. For the BEB solution, it is observed that in both year 2022 and year 2030, the TCO value of our study is lower than that of Kim et al.; in 2022, the difference is 42%, while it is 17% in 2030. The situation is opposite for the FCEB solution; for both years, the TCO values calculated in this study are greater than those of Kim et al.; in year 2022, the difference is 8%, while it is 24% in 2030.
6. Conclusions
This paper presents the method and results of a preliminary technical–economic analysis to evaluate the replacement of the entire compressed natural gas (CNG) bus fleet of a line considering two alternatives: battery electric buses (BEBs) and fuel cell electric buses (FCEBs). For the comparison and evaluation of the three alternatives, specific economic parameters of the three alternatives (BEB, FCEB and CNGB) were considered: CAPEX (CAPital EXpenditure) and OPEX (OPera-tional EXpenditure). Subsequently, it was possible to determine the TCO (total cost of ownership) and TCRO (total cost and revenues of ownership) over three reference years (2022, 2025 and 2030).
In practice, the method is a decision support tool that can support the decision-making process of a public transportation company. In this way, it is possible to make informed choices based on representative scenarios.
This paper addresses the case study of the city of Brescia, a city of about 200,000 inhabitants located in northern Italy. In particular, line number 3 is analyzed. For the BEB alternative, the TCO and TCRO values are between EUR 0.58/km and EUR 0.91/km. In the case of the FCEB solution, the TCO and TCRO values are between EUR 1.75/km and EUR 2.15/km. Considering the current CNGB solution, the TCO and TCRO values range between EUR 1.43/km and EUR 1.51/km.
Regarding the main limitations of the proposed method, the energy issue is highlighted. The energy costs of both solutions were estimated at both the year 2025 and the year 2030. It is evident that the energy strategies of different countries are continuously developing, while also considering the new socio-political frameworks at the global level. This implies that the assumptions made about energy costs today have a strong impact on the economic and social viability of the three alternatives. Specifically, the production of electricity from renewable sources at lower prices and the production of green hydrogen at reduced prices will play a key role in the strategic choices of transportation companies.
The best option for the conversion of bus line no. 3 is provided by the electric alternative, due to a lower TCO and TCRO in all considered scenarios. Hydrogen buses present a higher entry cost due to a current lower technological maturity level for both the rolling stock and refueling infrastructure. Technology maturity (i.e., time) plays an important role for the reduction of both TCO and TCRO; although, the real key factor leading to the overall convenience of ZEBs is public funding: higher financing rates (for both BEBs and FCEBs) lead to a significant reduction (and almost closure) in the gap existing with CNG buses, making the investment choice more convenient.
Given the approach presented in this study, several future developments could be undertaken: (i) refine data analysis according to quarter or monthly data, in order to factor in cyclical/seasonal peculiarities influencing both buses performance as well as bus performances (e.g., consumption); (ii) further investigate the performance of BEBs and FCEBs with in relation to the overall line characterization (e.g., difference in level, stop distance, traffic levels, traffic lights, junctions, etc.), in order to optimize fleet sizing; and (iii) provide for a sensitivity analysis with respect to the factor-assumed constant in the context of this study (e.g., transport demand, PT offer).
An additional issue that will need to be investigated is the reuse and recycling of end-of-life (EOL) electric vehicle batteries. Currently, the best scenario seems to be the secondary application of decommissioned lithium-ion batteries (LIBs) at the end of their primary life in electric vehicles (e.g., in stationary storage). In the future, the end-of-life (EOL) business will adopt better environmental and economic strategies by enabling the recovery of critical materials. Careful and effective management of the resources used for recycling electric vehicle batteries is a key element in the sustainability of the future automotive industry [
36,
37]. More generally, after consolidating economic assessments, such as those performed in this research, a broader life cycle analysis (LCA) of all system components could be completed. In this way, more precise estimates could be made regarding climate change impacts, the reduction in local air pollution and the decrease in oil dependence [
20].


 ,
, 


