Article

Indexing the Maintenance Priority of Road Safety Barriers in Urban and Peri-Urban Contexts: Application of a Ranking Methodology in Bologna, Italy

1
DICAM Department, School of Engineering, University of Bologna, Viale del Risorgimento, 2–40136 Bologna, Italy
2
ALE Consulting, 40133 Casalecchio di Reno, BO, Italy
*
Author to whom correspondence should be addressed.
Infrastructures 2023, 8(12), 181; https://doi.org/10.3390/infrastructures8120181
Submission received: 27 October 2023 / Revised: 11 December 2023 / Accepted: 14 December 2023 / Published: 16 December 2023

Abstract

:
The need for clear and updated information is pivotal when authorities plan and perform routinary, periodic and emergency maintenance of both road network and their roadside assets, e.g., curbs, signals, and barriers. With particular regard to road barriers, the development of remote sensing technologies, such as Laser Imaging Detection and Ranging (LiDAR), has played a disruptive role in acquiring information, so the surveys today are predominantly automatic, faster, and less biased than the traditional (i.e., visual and manual) inventorying methodologies. However, even though they are accurate, these emerging procedures usually focus only on the surveyed elements and do not provide any other information about the surrounding environment or about the qualitative degradation of the elements. The primary objective of this research effort was to present a ranking methodology for enhancing road safety in urban contexts. Due to an innovative synthetic index which takes into account both the deterioration and the location of the surveyed elements, maintenance priority of road barriers was outlined in Bologna, Italy. All the collected information was georeferenced in a Geographic Information System (GIS) environment and hence plotted in thematic maps for an easier analysis. In addition, compliance to the norm was verified. The research was tested to provide public authorities with an effective tool in the evaluation of maintenance activities and road safety policies.

1. Introduction

In recent decades, attention to road safety has been growing as a pivotal target in international and national agendas [1,2,3,4]. Due to the vast heterogeneity of road safety concerns [5,6,7,8,9,10,11,12,13,14,15,16], to improve it and to achieve the ambitious goal of ‘zero deaths’ along roads, policies and models should be properly updated at occurrence [17,18]. With regard to roadside infrastructures and assets, a key safety component is related to road barriers whose first applications date back to early 1930s. Road barriers are installed along roadsides to prevent vehicles from hitting rigid obstacles [19]. They are used when the roadside hazard is more dangerous than the barrier itself [20], and, if involved in accidents, they are less injurious than other roadside elements [21]. The main purpose of a road barriers, i.e., being a safety device [22], is widely agreed upon, and they should not be dangerous for non-involved road users or objects [23,24,25]. With regard to European normative framework, UNI-EN 1317 [26,27,28,29,30] is considered as the standard in field of testing, categorization and installation of road barriers, while in the US barriers are standardized by National Cooperative Highway Research Program (NCHRP) and American Association of State Highway and Transportation Officials (AASHTO). Other countries gained inspiration from both the previous standards [31].
In general, updated knowledge of road assets status is a crucial factor for safety matters and a major duty in the charge of road conservation stakeholders is the collection of data for routine and periodic maintenance works [32,33,34,35,36]. Furthermore, with regard to European countries, the need for periodic inspection and audits is established from a normative point of view [37,38,39]. In contrast, costs associated to collecting data are a main drawback [24,40], so awareness of asset conditions is essential when allocating funds [36], and agencies should find an adequate and reasonable balance between level of safety and costs [41,42]. Despite the lack of common standards [43], there is a wide variety of approaches in surveying road assets and applicable technologies [44], and the latter are often integrated [45]. Surveying aim can include the collection of spatial information or the production of a detailed cadaster. Regarding the operational implementation of surveys, methodologies range from visual inspections to sensor-based automatic investigations, allowing faster collection of information. In order to optimize the survey, a combination of the previously mentioned methods could be applied [19]. With regard to the first category, visual inspections are defined in [33] as manual measurements operated by personnel walking or slowly driving along roadways. While in [46,47,48], it was argued that visual methods are slow, cumbersome, labor-intensive and time-consuming, in [33,49] it was highlighted that they are quite easy to learn, require simple equipment, and provide data of sufficient quality for most decisions and applications. Automatic surveys evolved in parallel to the development of solutions, such as remote sensing technologies [50] as well as artificial intelligence [51] and deep learning techniques [52] that allow an easier and quicker data collection, with growing efficiency in terms of effectiveness [53]; today, they are preferred to manual surveys [54].
Developing and updating methodologies involves both transportation agencies and researchers. Among others, the authors of [55] performed image-based road inventory where road images were automatically recorded by a photo logger. In [47], the authors proposed a method for automatic detection of road assets along major roads based on the classification of videos taken by instrumented vehicles. In [46] and [56], the authors described a model based on Laser Imaging Detection and Ranging (LiDAR) data, able to automatically extract road barrier characteristics. Another radar-based research was proofed in [57], where the authors described a simplified road barrier detection method both in rural and highway environments. The update of highway inventory data was described also in [58], where the authors investigated the applicability of airborne LiDAR in comparison to mobile LiDAR. The three-dimensional model of the surveyed scene of road environment was the principal topic in [54], even though the road barriers’ cadaster was not the main task of research. In general, and as demonstrated in [32] and [54], mobile laser scanning has become a steady, affordable technology in mapping road elements, and road safety assets represent a crucial component.
At this point, some considerations can be argued. They are related to data quality, data reliability and costs of equipment (i.e., instruments and training of surveyors), and are pivotal shortcomings that agencies should take into account when in charge of choosing between manual or automatic survey [49,59,60]. Even if predominantly on-field methodologies could expose surveyors to dangerous road traffic and usually require considerable time [53], they guarantee consistent and reliable reports and datasets, while technologies such as LiDAR need an in-depth training and collect high amounts of data, with subsequent massive efforts in terms of reduction in redundant information. In other words, the time saved in the survey campaign is used during the analytical phase, with massive impacts on overall costs [45]. In addition, despite the improvements in technological fields, all the reviewed works were focused only on barriers themselves, without taking into account the interactions with nearby objects and the ‘combined’ effects in barrier deterioration of surroundings, i.e., the rest of infrastructures, nor the road characteristics or the terrain layout. They are instead worthy of attention, as roadside safety devices are not mere assets but constituent elements of a complex system, i.e., the road environment, where all the elements are interrelated [3,61,62,63]. Hence, when dealing with road safety matters and maintenance planning, due to the vast heterogeneity of due-to-be repaired elements and budget shortages, authorities should operate in accordance with a clear priority rank [62,64,65,66,67].
With regard to the latter, the literature review highlighted the lack of an effective and clear method to index and rank the priority of road asset maintenance, in particular the road barriers, although some efforts have been made to identify the best assessment methods in road safety concerns [3,61,65,68,69]. This research aims to fill this gap by presenting a comprehensive and synthetic index, which takes into account both barrier deterioration and the role of location in affecting the residual functionality of road safety devices. In fact, the despite efforts in improving effectiveness of road barriers in preventing injuries, the combination of concurrent factors such as barrier maintenance status and environmental conditions are still a matter of research [24]. In addition, and as argued in [70], risk assessment helps determine the priority of safety issues identified by safety reviews. “Asset deterioration depends on factors such as environmental conditions, design characteristics and utilization level, with immediate impacts on operating costs, as argued by [71]”. With regard to the surveying procedure, a manual inspection was preferred to an automatic survey in order to add prominence to the celerity, economy and simplicity of the procedure, both in learning and execution [33,
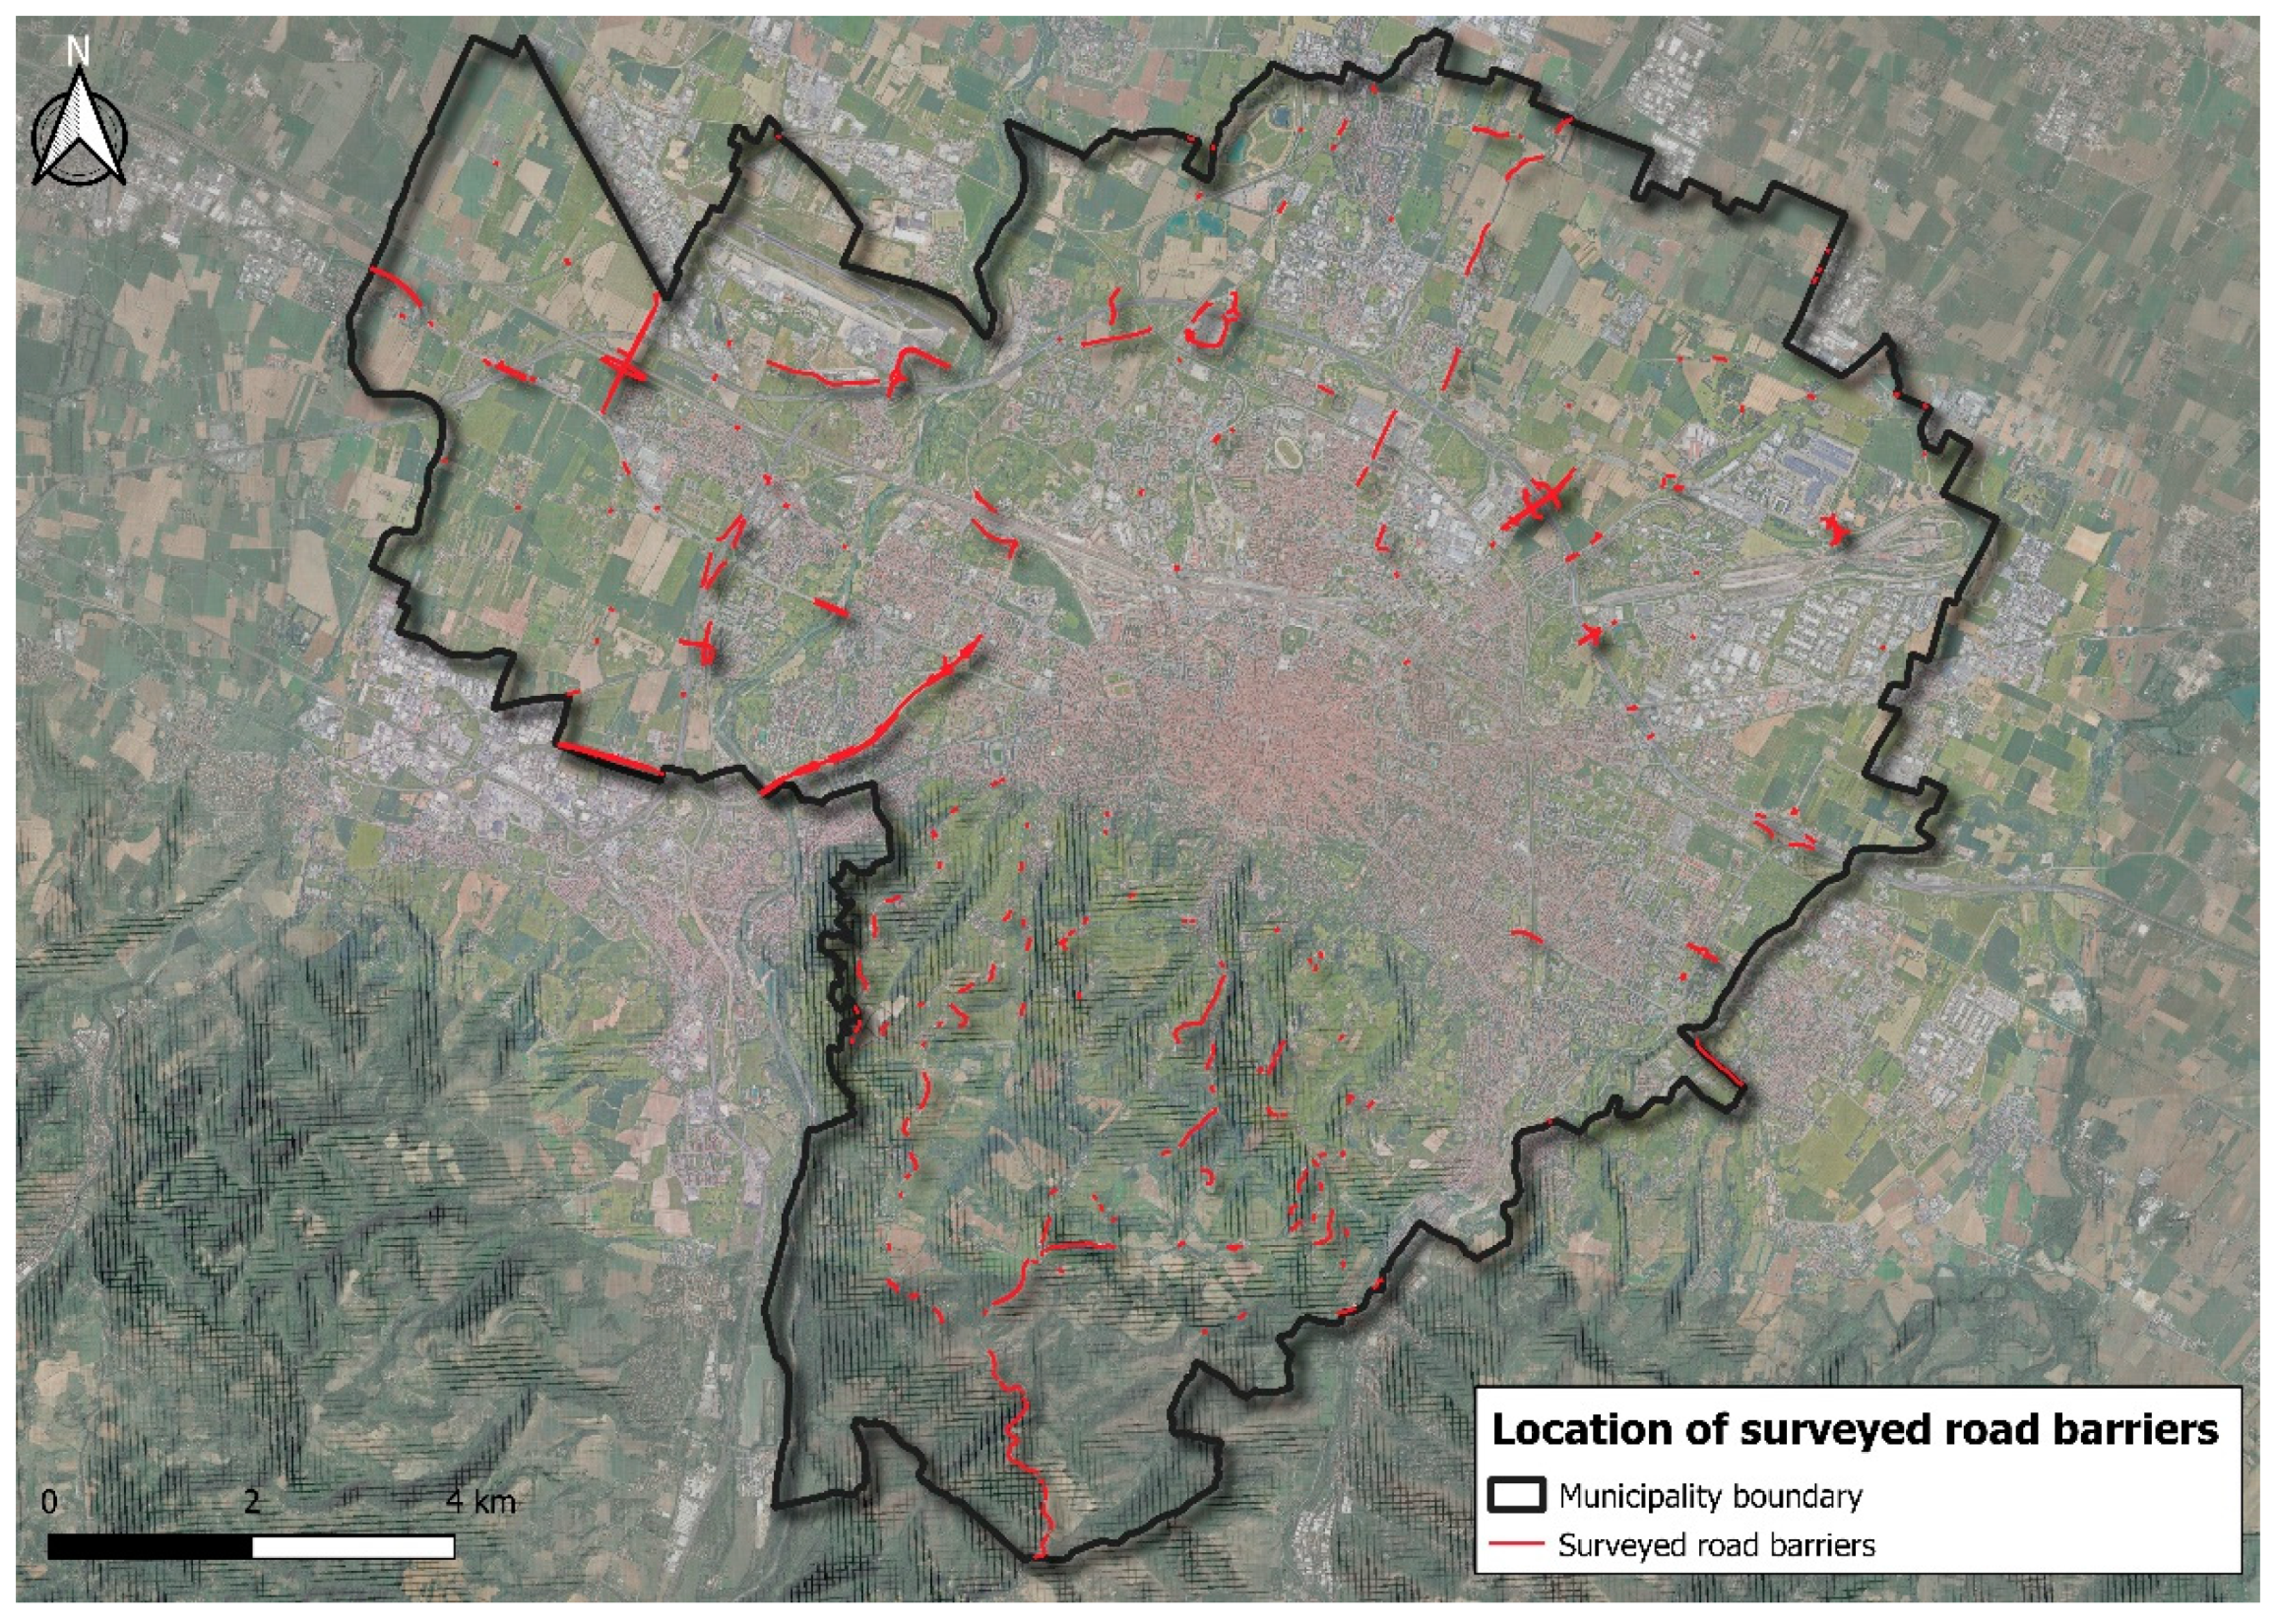
49]. A test was conducted in Bologna, Italy during 10 non-consecutive days in 2022, and widely available instruments, such as devices obtainable from the market and open source software, were used so as to demonstrate the replicability of both the methodology and the ranking assignment. The rationale and the objectives underlying the proposed procedure are comparable to what has been successfully experimented elsewhere [39]. In addition, as the writing authors argue, the proposed indexing procedure can be applied in other contexts, in both urban and extraurban areas, such as wide road networks. The paper is structured as follows: in Section 2, methodology such as index formulation (
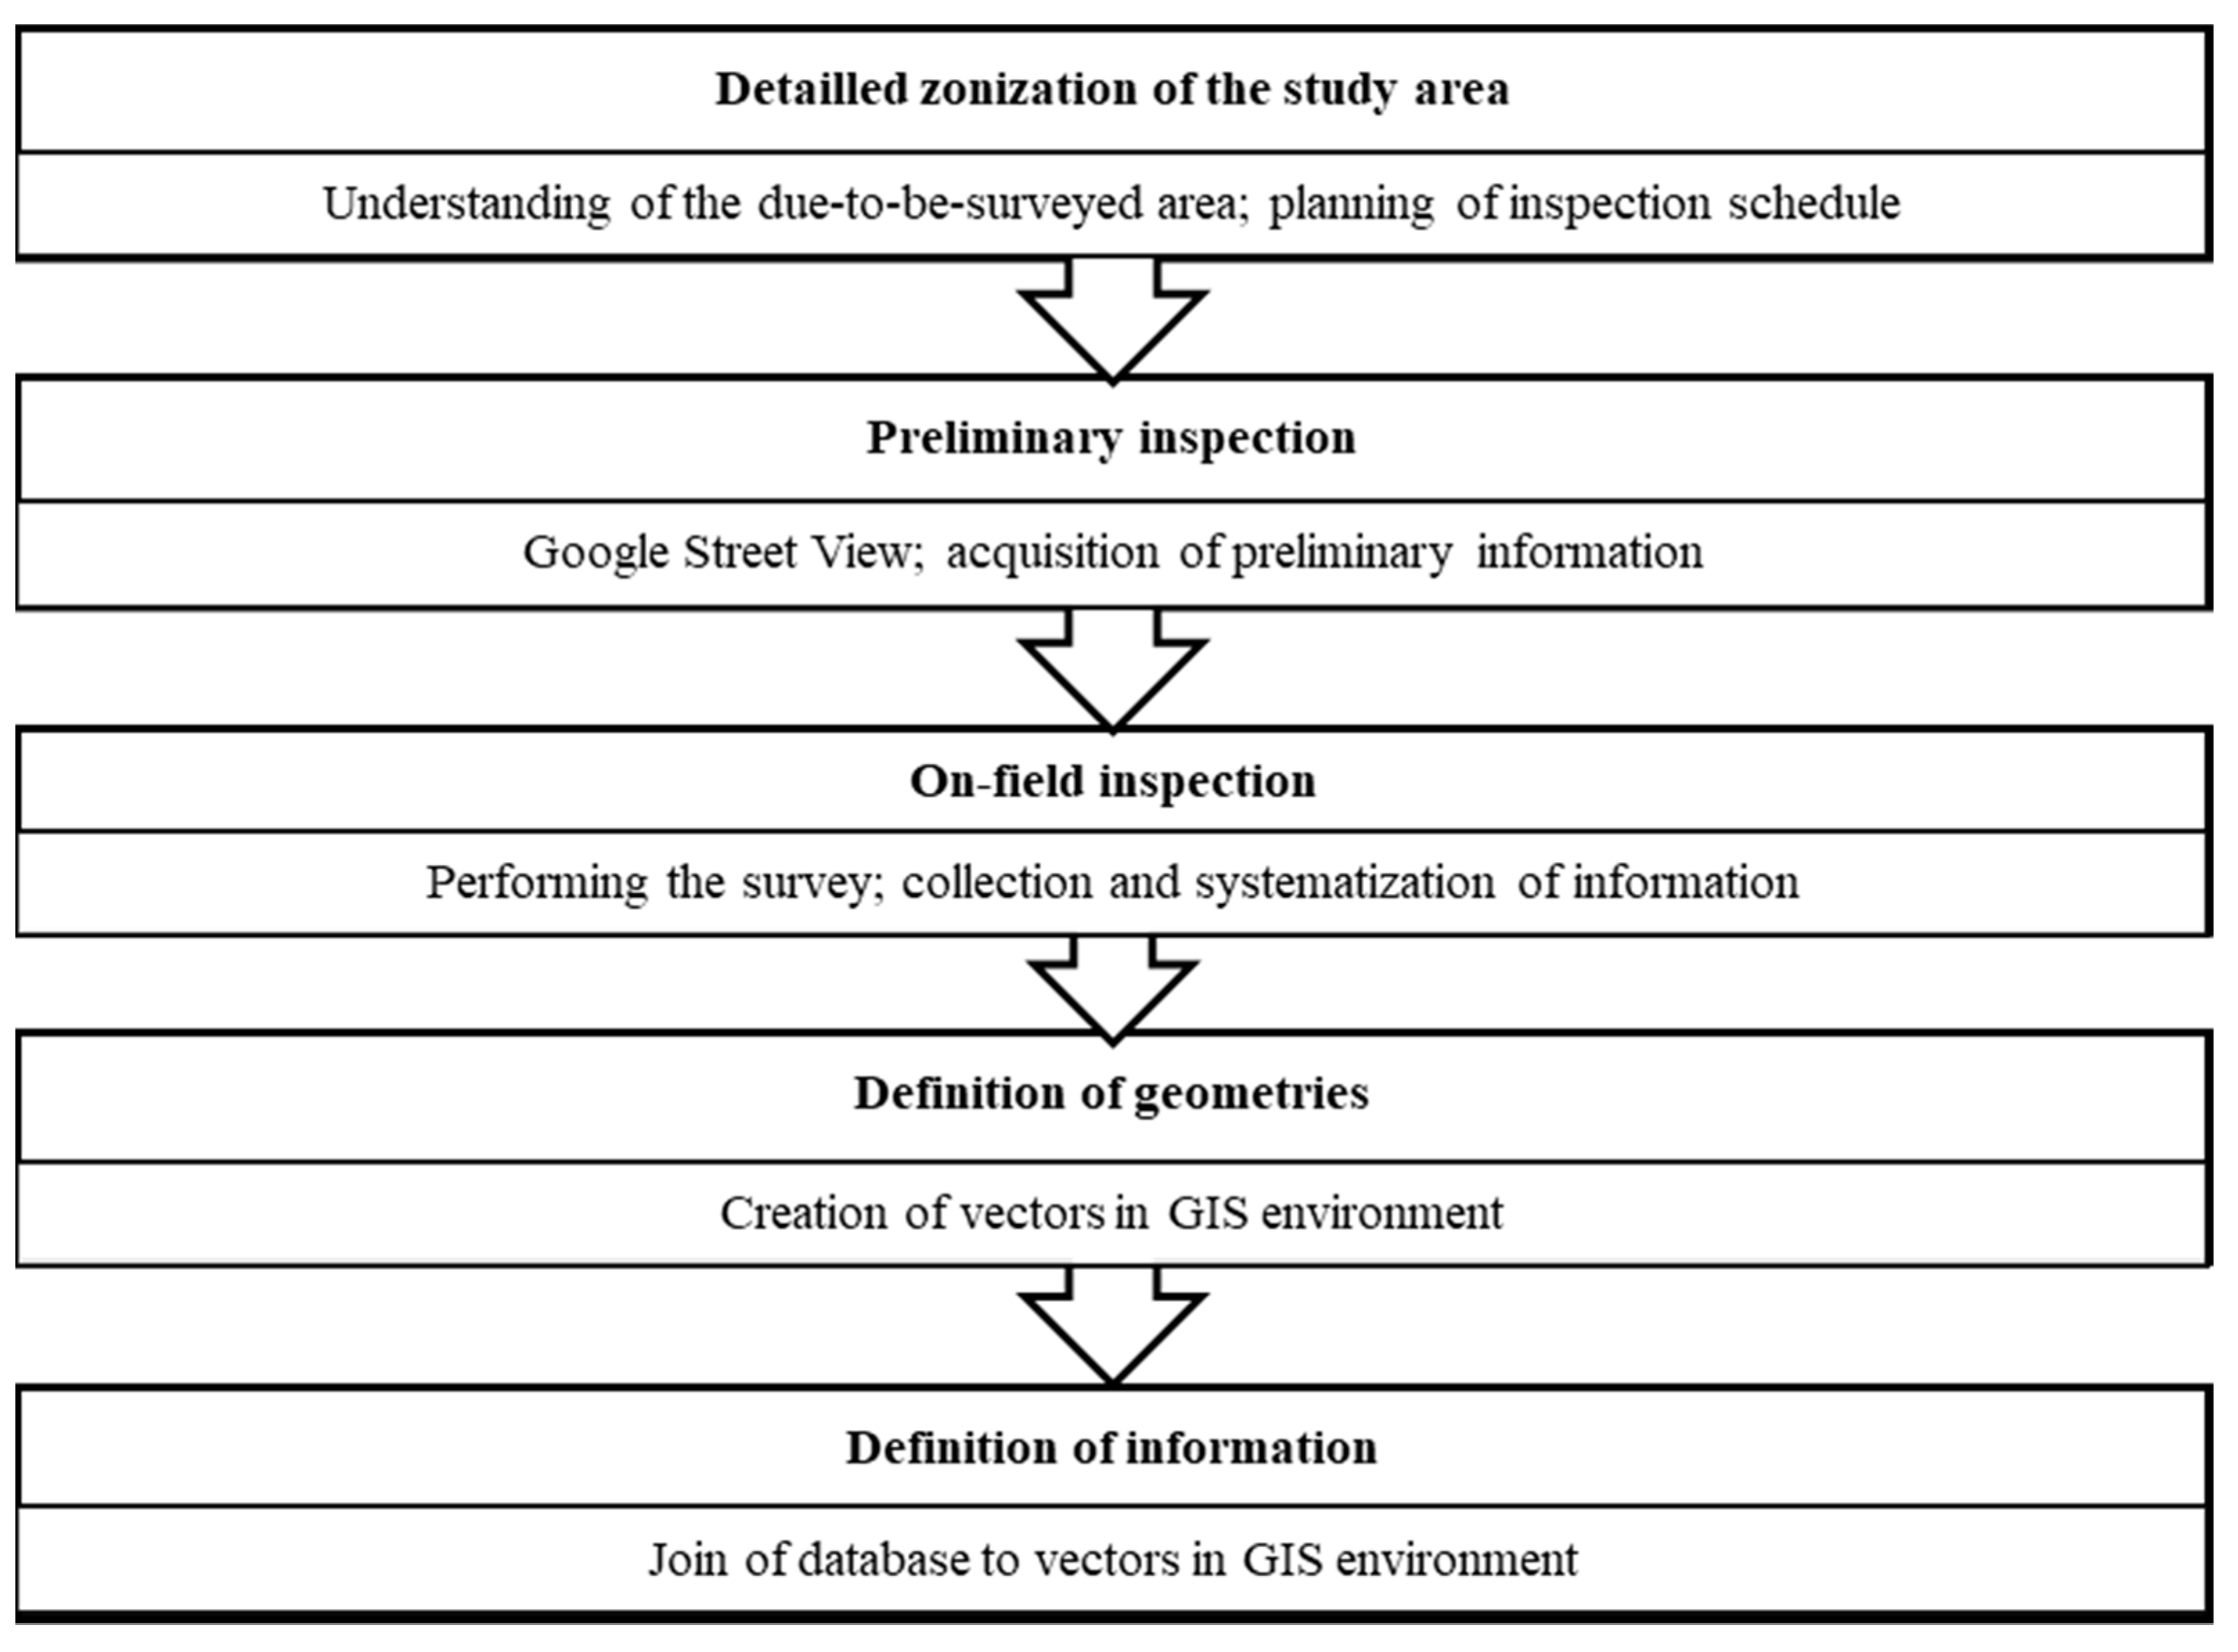
Section 2.1) and survey procedure (Section 2.2) is described; in Section 3, survey results are presented and discussed; in Section 4, some insights of research are pointed out.

2. Materials and Methods

Despite the differences between the two abovementioned approaches, i.e., manual and automatic surveys, all the procedures analyzed in Section 1 faced the need of precise map matching of surveyed information. In fact, when datasets are correctly formatted, they can constitute databases, and can be afterwards georeferenced, joined to a set of spatial objects and plotted in choropleth or thematic maps. As already argued [17,72,73,74,75,76], Geographic Information Systems (GIS) are the appropriate tools for these applications, as they offer special features able to enhance the approach to road management. In that case, objects could represent road assets, namely safety barriers, while the set of associated information is the collected characteristics. With regard to taxonomy in [77], and as usual when inventorying road safety assets, the applied methodology can be considered as a combination of different methods based on the on-field survey and integrated with video logs, Global Positioning System (GPS) and GIS mapping and satellite photography usage. In addition, it is worth noting that even if this is a visual methodology which is not aimed to offer indications on barrier performance and on barrier compliance with current legislation, this indexing procedure was designed to constitute support in planning maintenance programs.

2.1. Index Formulation

As previously mentioned, the main assumption of this ranking procedure is the concurrent action of degradation and environment in defining the status of the different road assets and hence the maintenance priority. In order to obtain a rank that is as synthetic and clear as possible, the proposed index was formulated as follows (1):
D × F = R
where D is the deterioration coefficient, ranging from 0.1 to 1 as reported in Table 1, where the higher the coefficient, the higher the deterioration; F is the location coefficient, ranging from 0.1 to 1 as reported in Table 2, where the higher the coefficient, the higher the hazardous location; R is the ranking of maintenance priority; as reported in Table 3, values range from 0.01, which is equal to lowest priority, to 1, which is equal to highest priority. The ranking procedure, as well as ranges of coefficients D and F, were aimed to restrict the values of R between 0.1 and 1. In particular, the upper limit of the ranges was set in order to normalize the results of (1) and hence keep a common scale among the wide and varied spectrum of safety devices and surveyed roads. This is consistent with previous research efforts [3,61]. With regard to intervals between consecutive values, given the monitored feature and the indexing aim, i.e., ranking of maintenance needs without any further considerations about residual functionality of barriers, coefficient D range takes into account the cumulative effects of deterioration. To clarify, when D = 0.1 is assigned, the assessed barrier is supposed to be still fully operative, while higher values are due to the increasing degree of visible deterioration. Regarding coefficient F, the values were set in order to evaluate the hazard dangers that can threaten in case of road accidents both involved and external people and goods. It means that higher values are assigned to more dangerous contexts.
Due to survey typology (i.e., mostly visual and manual), both coefficients should be formulated as objectively as possible. In fact, manual inventories could be biased with the concurrent work of more than one surveyor. To achieve this, the estimation of the deterioration level per each barriers, i.e., coefficient D, was explicitly stated by considering the following three aspects: deformation, i.e., evaluating the presence of deformations in the barrier structure; status of components, i.e., a visual, overall assessment of functional operativity of barrier elements, such as profile, spacer, sigma post, with additional regards to the installation age; conformity, i.e., if the surveyed position and shape could be described as compliant with the original setting. Table 1 shows coefficient D descriptions and sample images per each value.
As briefly mentioned above, with coefficient F, location and reasons for installation were identified. The attribution of this coefficient is essential when estimating the environmental effect of degradation. In fact, due to different locations (e.g., alongside a highway, upon a bridge, etc.), the heterogeneity of road barrier age and characteristics and the presence of surrounding objects and hazards (e.g., buildings, trees, etc.) the residual overall functionality of a barrier could vary. Table 2 shows coefficient F descriptions per each value.
As a factorial product of the coefficients, R ranks the maintenance priority per each barrier. In order to facilitate priority recognition, four classes were defined. The different ranks and classes are summarized in Table 3.

2.2. Survey Methodology

The proposed methodology consists of different steps which should be considered consecutive and interrelated. Figure 1 describes the adopted workflow, which is fully compliant to the guidelines drawn by Italian laws regarding road infrastructure safety management [78]. They are based on European normative [37] and call for a cyclic activity, while the indexing procedure described in the following section is a novel attempt to improve the normative reference and achieve a synthetic and clear overview of the needed maintenance.
With regard to the case study of this work, the survey examined the entire municipality of Bologna, which is located in Emilia—Romagna Region, Northern Italy. Even if attention paid by the municipal administration of Bologna in upgrading and sharing data on public infrastructure has been constantly growing in the last years, there was no accurate cadaster about road barrier status quo. The city lies in the Po valley, in proximity to the Apennine mountains, and is well recognizable for its dense urban form. Most of the urbanized and populated areas are in plain areas, while only a residual share of the population lives on the hills. The road network within the city boundary sums 853.61 km and, as seen in Table 4, comprises both municipal roads (93% of the total amount; mostly single- or two-lane roads and some urban arterials) and other authorities’ branches (i.e., motorways, regional roads, private roads, etc.), whose lengths correspond to a residual share (7%). The extension of road network is proportional to the urbanized density. In fact, the plain area is served by 84% of the road network, while in the hill area the road length is only 16% of the total amount. Figure 2 shows the surveyed road network and study area, with the representation of terrain elevation, highlighting hills and plain zones. The calculation and visualization of terrain slopes were performed by using the Copernicus Land Monitoring Service EU-DEM (version 1.1), a 25 m spatial resolution DEM (Digital Elevation Model), freely provided by the EEA [79].
After selecting the study area and road network (i.e., municipal roads), a comprehensive and exhaustive cartography was produced in a GIS environment (QGis; version 3.16). Due to the quantity of to-be-surveyed information, a two-step survey was conducted. In the first phase, a preliminary, virtual inspection of the entire road network was performed by using Google Street View (accessed by web browser). It was needed to check the main information on the barrier locations (i.e., coordinates). In this regard, coordinates of barrier extremities were identified by pasting the coordinates from the URL visualized in the browser address bar. This information was pivotal in the planning of on-field activities, in particular in finding the shortest routes since inspections were aimed to survey as many barriers as possible per each surveying session.
As argued in [80], the time-stamped images in Google Street View could be not-updated, and hence they needed an inspection to check the correspondence of the characteristics captured by images and the ‘real’ status quo. This was performed during the second phase of the survey, which was on the field. It was completed during 10 non-consecutive sunny days from February 2022 to July 2022. Surveys were conducted without any traffic interruption. On-field inspection duties were assigning coefficients D and F discussed in Section 2.2, performing measurements (barrier length and height) and taking geotagged images. Depending on the surveyed area, on-site inspections took an amount of time ranging from a couple of hours to 4 h. The on-field survey was executed by car, and the crew was always composed of three members (a driver and two surveyors). Surveyors were declared competent after an in-depth training, which is commonly acknowledged as a major duty during surveys [81,82], so as to assign the pertinent values described in Section 2.1 in an objective manner. During the inspections, measurements were calculated by using a commercial laser scanner, which guarantees acceptable precision and accuracy. In addition, geotagged images of road barriers highlighting their characteristics (alignment, damages, missing components, etc.) were taken by smartphone high-resolution cameras and subsequently uploaded into the GIS project. Most of the barriers lacked a homologation label, so information about age was not collected. In addition, to obtain a more detailed overview from the on-field inspections as argued in [54], geotagged videos of the road network and the related safety assets were recorded by Racelogic VBOX. Cameras were installed aboard the car in order to record both sides of the road. Recorded videos were used as reference for barriers located in high-traffic roads such as urban freeways or roads with hazardous spots (i.e., lack of safety areas, inadequate visibility, etc.) where visual inspection was unfeasible. Once collected and verified, the set of information was transferred to a database formatted in spreadsheet files.
Before joining information in GIS, a detailed procedure was performed to create the geometries (terminals and transitions were symbolized as points, while barriers as lines). In fact, coordinates collected during preliminary (virtual) inspection were affected by bias, i.e., they represented the trajectory of the Google car instead of the barriers’ position, so they were geoprocessed by applying some pertinent map-matching algorithms. As previously mentioned, the survey faced a wide spectrum of circumstances, even barriers with different characteristics of degradation. It was the case of long barriers, whose status could have been affected by age deterioration, ground movements (e.g., landslides in hill areas) or crashes. To keep pursuing the main aim of the survey (i.e., indexing the priority for maintenance purposes), barriers longer than 200 m were split into segments of 100 m, with or without variations of coefficient F, and each section was given proper coefficients D and F. This measure was assessed assuming a parametric module of installation equal to 100 m. With regard to coefficient assignment, barriers made up of two or more segments were processed as if they were in continuity. In the presence of transitions, barriers were considered as separate assets. In both cases, the ID code assigned to each geometry was the main reference. In this regard, a system was proofed to always keep each geometry in the GIS project recognizable to the pertinent asset. Specifically, each asset was assigned a 7-digit code where the first digit was equal to ‘B’ in the case of a barrier and ‘T’ in the case of transition, while the subsequent 6 digits were formatted as a progressive number. A sample is reported in Figure 3. An additional 4-digit code was added to the barriers, connoting a pertinent segment. In the case of single-segment barriers, it was always ‘S0001’, while in the case of longer barriers the value was equal to the progressive order of segments. Coefficients D and F were hence assigned to each segment or barrier, and the final database was consequently formatted. In the case of short barriers, i.e., made by up to two segments, the overall values were equal to the surveyed value, while longer barriers were reported by both the surveyed coefficients and the average value of D and F. Due to this codification system, analyses are possible on both barrier and segment basis. As the last step, all the needed spatial operations were performed in QGis.

3. Results and Discussion

This section delves into the evaluation and discussion of the main survey outputs. In general, and “Asset deterioration depends on factors such as environmental conditions, design characteristics and utilization level, with immediate impacts on operating costs, as argued by [3]”, namely the diagnostic phase, during which investigations are needed to best plan the mitigating strategies. Figure 4 shows the localization of surveyed barriers within the municipal boundaries, while Table 5 reports the main characteristics of surveyed barriers. As the first, albeit presumable result, most of the barriers were surveyed outside the denser urban areas. In fact, most of them are located in the extraurban or hill zones of the municipality, where roads are less straight, although maximal speed is usually higher, and hazardous topography (i.e., slopes, cliffs, hillsides, etc.) plays a crucial role in road safety concerns. With regard to qualitative outputs, Section 3.1 describes the typological overview of barriers, while Section 3.2 focuses on indexes.

3.1. Typological Overview of Surveyed Barriers

As previously mentioned, with regard to barrier typology, the UNI EN 1317-2 standard [27] was the reference for nomenclatures. Figure 5 shows distribution in accordance with this information. A considerable share of barriers was surveyed as normal containment level devices (N2), while higher level of containment barriers (H1; H2; H3) were detected in hazardous locations such as ramps and bridges, and they usually were a recent replacement or installation. Jersey constituted a residual share of barriers. Due to road characteristics, very high-containment barriers (suitable for highways such as H4 and L4) were not found. It is worth noting that a small number of barriers (four barriers, equal to 0.65% of the entire asset; see Table 6) were not classified on the basis of UNI EN 1317 standards due to their structure (i.e., not compliant with the norm) or their age, i.e., they were installed before the standard effectiveness. Indirectly, this result acknowledges compliance with norms and standards of Bologna. Given the low share of irregular barriers and their average rank (i.e., all of them fall into Class 4, which is, with regard to Table 3, the class with lesser need of urgent maintenance), the authors argue that this anomaly does not have any practical implications in the overall survey success or consequences in safety-related policies. Nevertheless, the authors argue that higher shares of animalities could dramatically affect survey results and remark this latter assessment as a major outcome of the tested procedure. As a consequence of the above result, the surveyed material reported in Figure 6 was predominantly steel. Concrete was used for jerseys, while a residual share of roadside barrier was made of steel and wood. This predominance was similar to that of related research [83,84] and, in the authors’ experience, quite foreseeable due to the effectiveness of steel in such safety assets. With regard to installation purpose, most of them were installed to protect road users from hazardous edges (i.e., in the proximity of cliffs, slopes, rivers, etc.). This is particularly evident in hilly, less urbanized zones, where roads climb heights and run along brinks. Table 6 reports the main highlights from the typological overview of the surveyed barriers.

3.2. Location and Degradation Overview of Surveyed Barriers

Globally, eleven different recurrent hazards were surveyed: bridge edge; bridge pillar; building; cliff or slope; jumper edge; rivers or canals; road overpass or viaduct edge; road median; street lamps; trees or masting. They are represented in Figure 7. Infrequent hazards (i.e., f < 3) were surveyed as ‘other hazard’. Topography and road network characteristics affected the hazards’ protection and hence coefficient F, which is represented in Figure 8. In fact, the most hazardous areas were located and detected in the hill zones, where the roads run along ridges and gullies (‘calanchi’), a known peculiar character of Apennines in Bologna, or close to cliffs and slopes. In plain areas where most of the built areas are located, hazards are related to anthropic activities and alteration to environment, such as buildings and bridges. In particular, overpasses and viaducts over the Bologna ring road, as well as the main two-lane urban arterials such as Viale Togliatti, Via Nuova Bazzanese and Viale Pertini, were surveyed. The overview of barrier classification according to coefficient F is reported in Table 7.
Unlike coefficient F which takes into account observable and predictable aspects such as the barrier surroundings, coefficient D is affected by some unpredictable factors. It is a significant factor because it might need the requirement of a constant and effective update of collected information, even as frequent repetition of inspections, in order to keep the database as updated as possible. Figure 8 shows the thematic map of road barriers in accordance with degradation, while the main data are reported in Table 8. Despite the higher density of advanced degradation in the hill zones as shown in Figure 9, the presence of degradation spots even in the plain area is worth noting. Most of them correspond to ramps, where hazards are frequent and classified with the highest coefficients. As a consequence of the combined effects of environment and degradation, an overview of maintenance priority is traced and represented in Figure 10 and Table 9, where barriers are thematized in accordance with the class defined in Table 3. Hill zone persists as above-average ranked in maintenance priority, while the most hazardous spots are in the plain area, which are located mostly near high-traffic roads, were ranked into different classes due to the various grades of degradation. Because of the collected information, tracing a detailed ranking of the ‘most hazardous’ roads could be possible. Table 10 reports the roads where at least 1 km of barriers was detected. In general, the listed roads located in the hill zone could be labelled as urban roads, with a speed limit usually set at 50 km/h, a low share of traffic and a sharp curvilinear path, beyond the aforementioned environmental characteristics. With regard to the R coefficient, they persist as the ‘riskiest’ roads of the network. According to the two-lane urban arterials such as Via Nuova Bazzanese and Viale Pertini, despite being ranked towards the top due to the high share of kilometers of barriers, they could not be classified as ‘in need of maintenance’ roads.

4. Conclusions

In order to achieve higher safety of roads, agencies and public bodies are required to collect information about road asset characteristics. This is a key duty, usually time consuming and expensive, in the development of an effective asset management system [54]. The widespread use of technologies today, such as that of LiDAR, has played the primary role in pursuing the abovementioned task. It is apparent that the reduction in surveying is considered a panacea, but some other considerations should be kept in mind when allocating resources in data collection and surveys. First, while automatic collection of information is faster and more accurate than that performed by way of manual procedures, datasets are usually larger, and deep data processing is needed with a general increase in costs and computing efforts. Second, while information about road assets is collected during survey campaigns, interactions between road barriers and the surrounding environment are usually skipped. Third, the collected information is predominantly quantitative and cannot guarantee a clear prioritization ranking about the due-to-be-maintained or due-to-be-replaced assets, which is a combination of quantitative and qualitative aspects. Aimed to integrate and optimize the inspection methods provided by the current legislation [
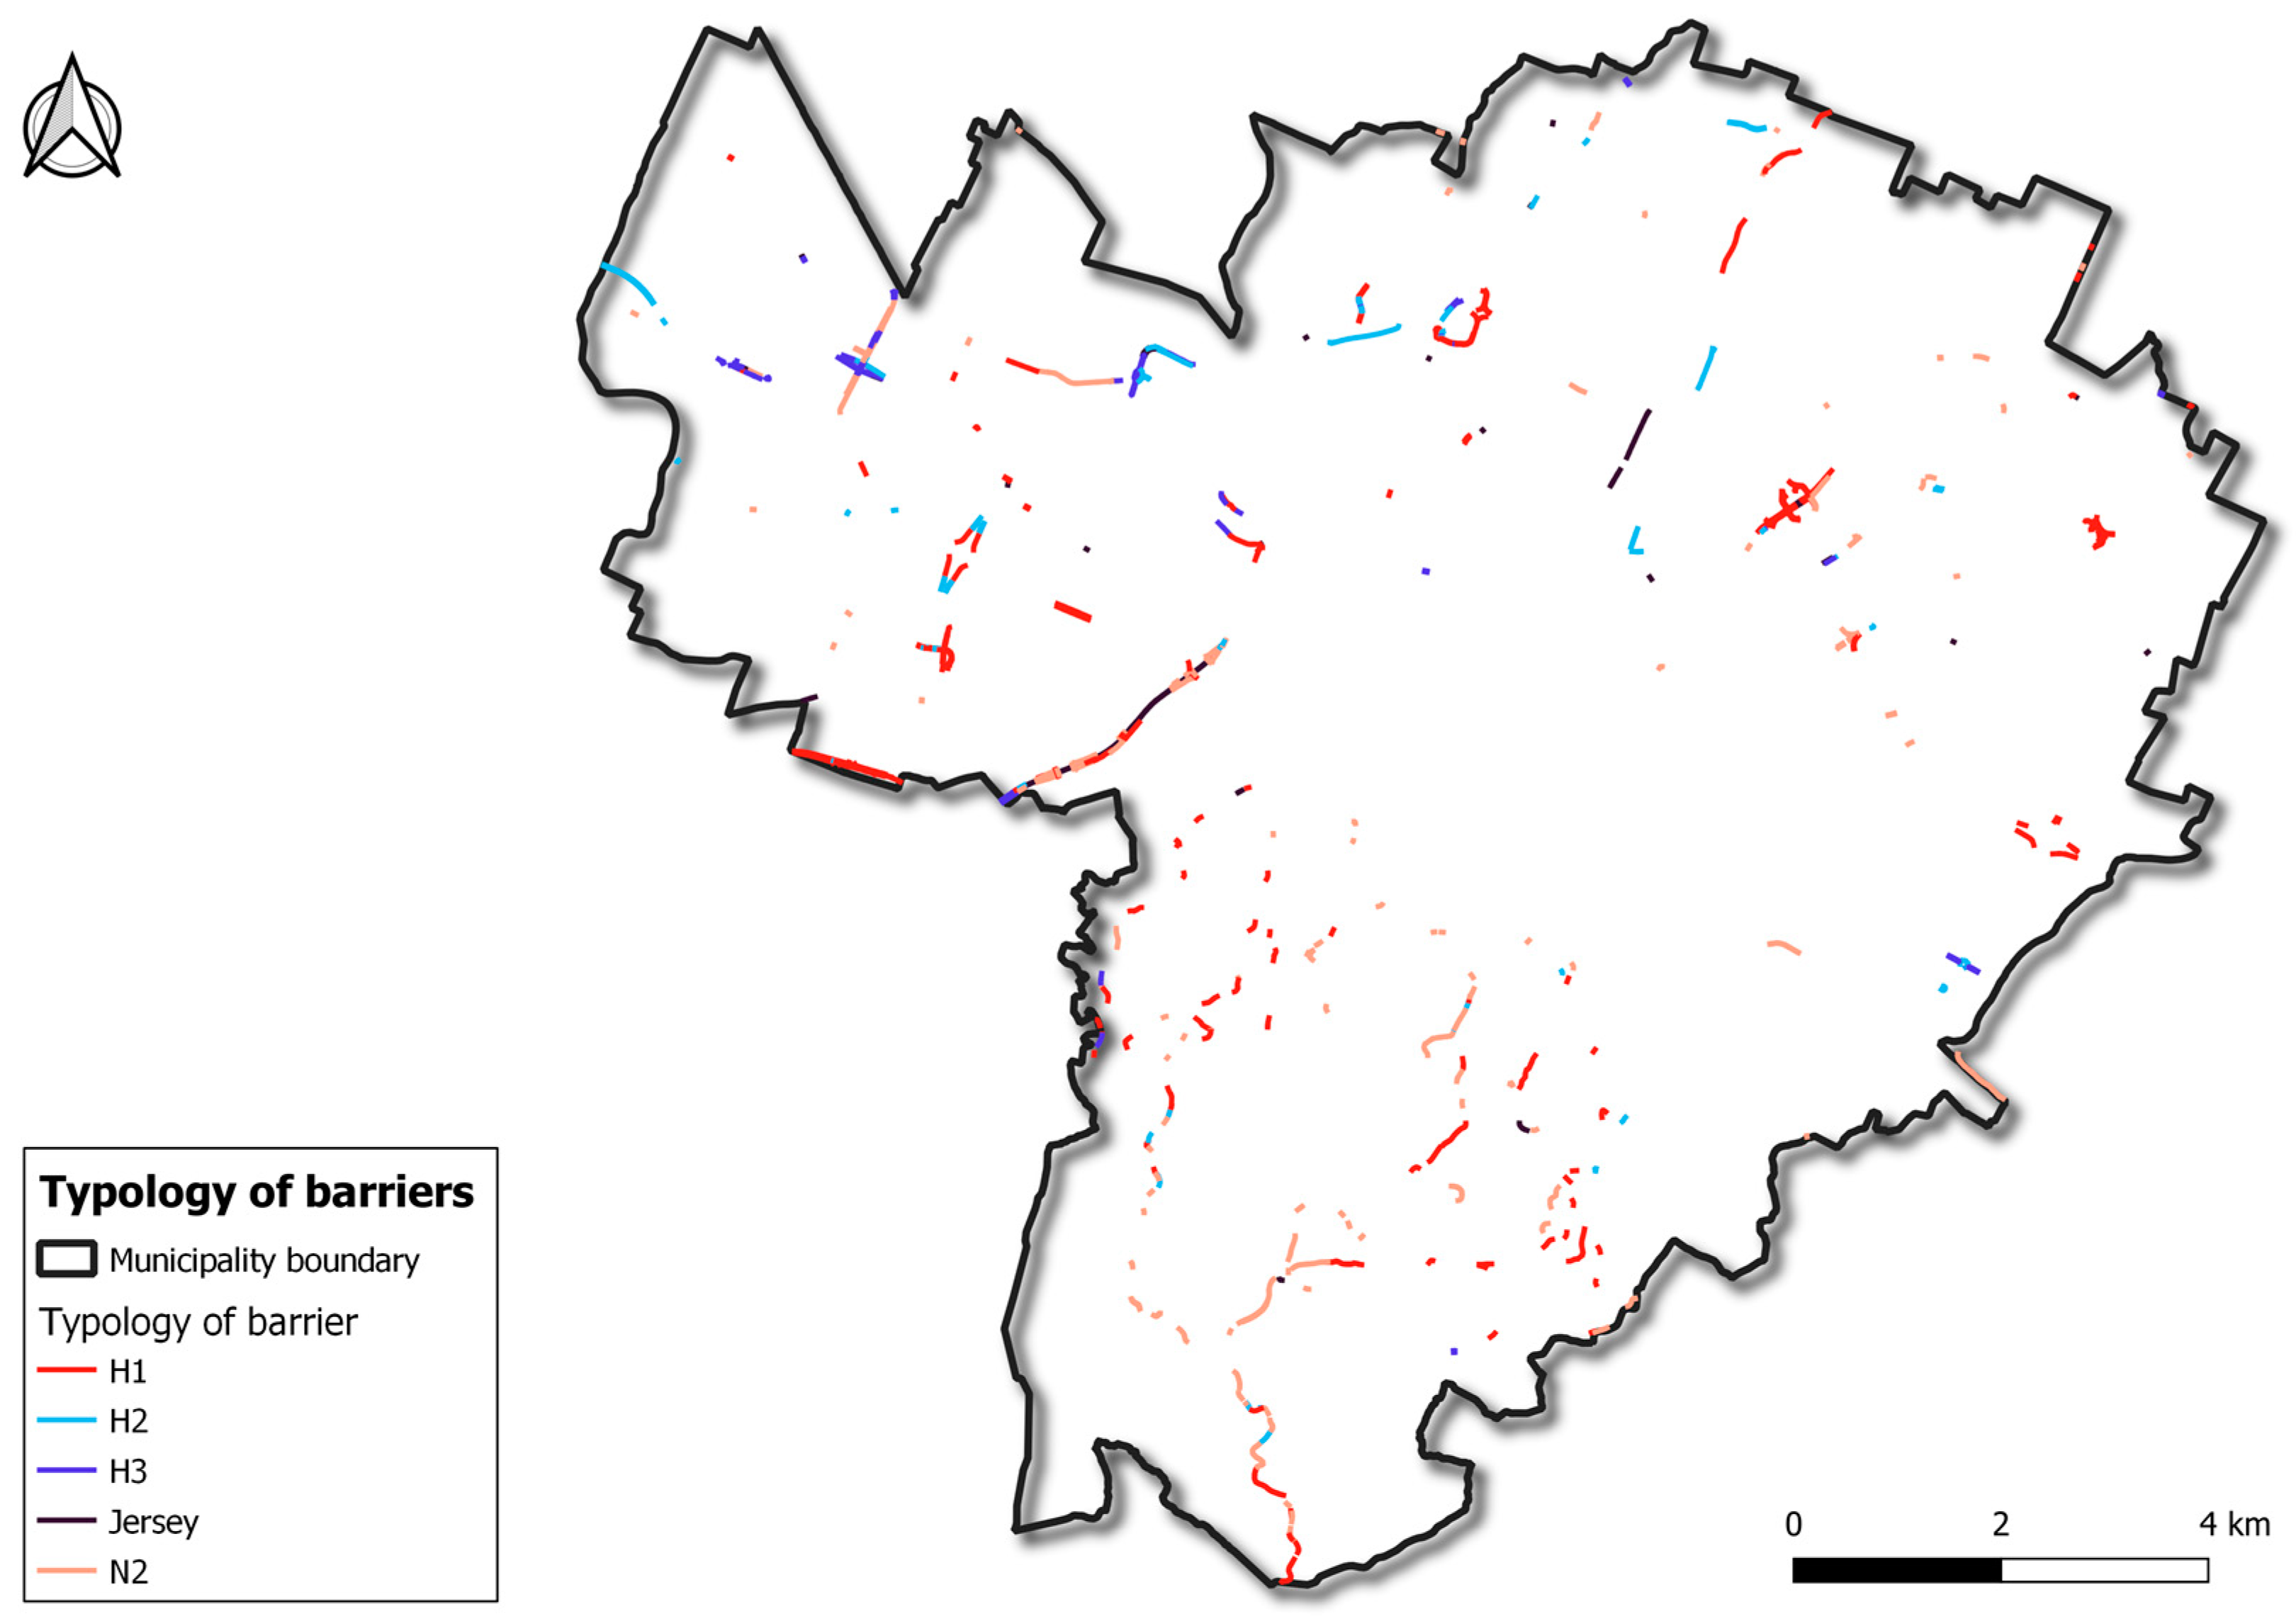
78], this research effort was designed to overlap the abovementioned limitations faced by authorities when they deal with roadside asset inventory and maintenance prioritization. The concurrent application of largely available technologies and devices, namely commercial laser scanners, smartphones equipped by high-resolution cameras and an open-source GIS, namely QGis, was preferred to expensive instruments to carry out the methodology steps and demonstrate the possible replicability even in the case of budget shortages. As previously mentioned, when some instruments and technologies are simultaneously involved during on-field activities, in-depth training should be provided to surveyors. In general, and arguing that this latter evaluation is the main challenge that the authorities could face, the authors acknowledge that devices obtainable from both the market and open-source software are a key and major strength, because their use allows a simplified dissemination and an enhanced comparability of results in both scientific and policy-related debates. Moreover, a synthetic and descriptive index was developed in order to rank information about degradation (namely deformation, status of components, compliance with the original installation setting), location of roadside barriers (namely protected hazard), and resulting maintenance priority. The ranking scale was normalized to allow comparable analyses of assets spread around the surveyed area. Methodology and index were tested in Bologna, Italy, and applied during manual survey to create the first municipal cadaster of road safety barriers. Although the test was conducted in a European country, the authors argue that this methodology, as well as the ranking index, can be easily adapted and replicated in other countries. The results described in Section 3 range from quantitative to qualitative aspects and outline a detailed overview of the typological characteristics of the road safety barriers, in compliance to the national and European norms and standards. Results highlighted in Section 3 provide a robust and cost-effective outline of the different needs of maintenance. Some possible improvements came into the authors’ minds. First, this research could be an operative basis for additional focus on road safety concerns. As widely demonstrated [4,19,24], the roadside assets and traffic conditions are interrelated, so better knowledge of roadside assets is a key factor in developing effective road safety analyses. This can drive in-depth analysis, namely a statistical model, which would take into account a wide spectrum of variables, ranging from traffic flows to events such as road accidents, Floating Car Data (FCD) or Historical Car Data (HCD). Second, due to the available technologies, a spatial DBMS can be built and integrated with real-time technologies or systems, which can be updated even on site [85]. Despite the available technologies, mobile GIS devices were not used, so tabular information was converted into a GIS project as a subsequent phase. This procedure was preferred by the authors due to the lack of suitable devices. Additionally, it is worth noting that when applied, this latter measure requires efforts in both training of surveyors and acquisition of effective instrumentation, although the authors argue that it allows the update of information with higher frequency and lower surveying costs. Reduction in costs can be achieved because real-time technologies dramatically affect information processing. Third, the application of economic parameters such as the cost of barrier components to the surveyed assets could allow a detailed overview of maintenance efforts [42] in terms of needed resources and cost/benefit ratio. As a final remark and widening the perspective on the economic side of road safety, which is widely acknowledged in Section 1, the improvement of a detailed cadaster could be highly effective in the assessment of social costs related to road accidents and the related insurance matters. In fact, the presence of degradation measurement and ranking in the synthetic index is acknowledged by the authors as a major outcome of this research effort, as it can become an effective indication of the role played by infrastructure assets.

Author Contributions

C.L. and V.V.: conceptualization and methodology; A.N.: writing—original draft; A.N.: formal analysis, data curation; C.L. and V.V.: writing—review and editing; A.N.: visualization; A.S., G.D. and U.R.: investigation; V.V.: supervision. All authors have read and agreed to the published version of the manuscript.

Funding

This research received no external funding.

Data Availability Statement

Data are contained within the article.

Acknowledgments

The authors express their gratitude to Andrea Baroncini (Bologna Strade Scarl) and the Municipality of Bologna for the help and the data provided. They also thank Leonardo Cameli, Luca Cotignoli and Marta di Febbo for their significant contribution given in surveying and data analysis.

Conflicts of Interest

The authors declare no conflict of interest.

References

  1. Ahmed, S.; Hossain, M.A.; Ray, S.K.; Bhuiyan, M.M.I.; Sabuj, S.R. A study on road accident prediction and contributing factors using explainable machine learning models: Analysis and performance. Transp. Res. Interdiscip. Perspect. 2023, 19, 100814. [Google Scholar] [CrossRef]
  2. Elvik, R. Can injury prevention efforts go too far?: Reflections on some possible implications of Vision Zero for road accident fatalities. Accid. Anal. Prev. 1999, 31, 265–286. [Google Scholar] [CrossRef] [PubMed]
  3. Cantisani, G.; Borrelli, C.C.; Del Serrone, G.; Peluso, P. Optimizing Road Safety Inspections on Rural Roads. Infrastructures 2023, 8, 30. [Google Scholar] [CrossRef]
  4. Wang, C.; Quddus, M.A.; Ison, S.G. The effect of traffic and road characteristics on road safety: A review and future research direction. Saf. Sci. 2013, 57, 264–275. [Google Scholar] [CrossRef]
  5. Yannis, G.; Weijermars, W.; Gitelman, V.; Vis, M.; Chaziris, A.; Papadimitriou, E.; Azevedo, C.L. Road safety performance indicators for the interurban road network. Accid. Anal. Prev. 2013, 60, 384–395. [Google Scholar] [CrossRef]
  6. Martins, M.A.; Garcez, T.V. A multidimensional and multi-period analysis of safety on roads. Accid. Anal. Prev. 2021, 162, 106401. [Google Scholar] [CrossRef]
  7. Acerra, E.M.; Lantieri, C.; Vignali, V.; Pazzini, M.; Andrea, S. Safety roads: The analysis of driving behaviour and the effects on the infrastructural design. Transp. Res. Procedia 2023, 69, 336–343. [Google Scholar] [CrossRef]
  8. Vignali, V.; Pazzini, M.; Ghasemi, N.; Lantieri, C.; Simone, A.; Dondi, G. The safety and conspicuity of pedestrian crossing at roundabouts: The effect of median refuge island and zebra markings. Transp. Res. Part F Traffic Psychol. Behav. 2020, 68, 94–104. [Google Scholar] [CrossRef]
  9. Battistini, R.; Lantieri, C.; Simone, A.; Dondi, G.; Vignali, V. A decision support system for the safety evaluation of urban pedestrian crossings. Transp. Res. Procedia 2023, 69, 655–662. [Google Scholar] [CrossRef]
  10. Vignali, V.; Bichicchi, A.; Simone, A.; Lantieri, C.; Dondi, G.; Costa, M. Road sign vision and driver behaviour in work zones. Transp. Res. Part F Traffic Psychol. Behav. 2019, 60, 474–484. [Google Scholar] [CrossRef]
  11. Lantieri, C.; Costa, M.; Vignali, V.; Acerra, E.M.; Marchetti, P.; Simone, A. Flashing in-curb LEDs and beacons at unsignalized crosswalks and driver’s visual attention to pedestrians during nighttime. Ergonomics 2021, 64, 330–341. [Google Scholar] [CrossRef] [PubMed]
  12. Ghasemi, N.; Acerra, E.; Vignali, V.; Lantieri, C.; Simone, A.; Imine, H. Road Safety Review update by using innovative technologies to investigate driver behaviour. Transp. Res. Procedia 2020, 45, 368–375. [Google Scholar] [CrossRef]
  13. Shoman, M.M.; Imine, H.; Acerra, E.M.; Lantieri, C. Evaluation of cycling safety and comfort in bad weather and surface conditions using an instrumented bicycle. IEEE Access 2023, 11, 15096–15108. [Google Scholar] [CrossRef]
  14. Vedernikov, A.N.; Safonov, A.A.; Gusev, S.A.; Carlone, P.; Tucci, F.; Akhatov, I.S. Spring-in experimental evaluation of L-shaped pultruded profiles. In IOP Conference Series: Materials Science and Engineering; IOP Publishing: Bristol, UK, 2020; p. 012013. [Google Scholar]
  15. Vedernikov, A.; Gemi, L.; Madenci, E.; Özkılıç, Y.O.; Yazman, Ş.; Gusev, S.; Sulimov, A.; Bondareva, J.; Evlashin, S.; Konev, S. Effects of high pulling speeds on mechanical properties and morphology of pultruded GFRP composite flat laminates. Compos. Struct. 2022, 301, 116216. [Google Scholar] [CrossRef]
  16. Johnsson, C.; Laureshyn, A.; De Ceunynck, T. In search of surrogate safety indicators for vulnerable road users: A review of surrogate safety indicators. Transp. Rev. 2018, 38, 765–785. [Google Scholar] [CrossRef]
  17. Simonetti, S.; Currà, A.; Minniti, S.; Modafferi, M. GIS Roads Cadastre, Infrastructure Management and Maintenance. In INTERNATIONAL SYMPOSIUM: New Metropolitan Perspectives; Springer: Cham, Switzerland, 2022; pp. 2045–2053. [Google Scholar]
  18. Hughes, B.P.; Newstead, S.; Anund, A.; Shu, C.C.; Falkmer, T. A review of models relevant to road safety. Accid. Anal. Prev. 2015, 74, 250–270. [Google Scholar] [CrossRef] [PubMed]
  19. Pardillo-Mayora, J.M.; Domínguez-Lira, C.A.; Jurado-Piña, R. Empirical calibration of a roadside hazardousness index for Spanish two-lane rural roads. Accid. Anal. Prev. 2010, 42, 2018–2023. [Google Scholar] [CrossRef]
  20. Vickerman, R. International Encyclopedia of Transportation; Elsevier: Amsterdam, The Netherlands, 2021. [Google Scholar]
  21. Bryden, J.E.; Fortuniewicz, J.S. Traffic barrier performance related to vehicle size and type. Transp. Res. Rec. 1986, 1065, 69–78. [Google Scholar]
  22. Michie, J.D.; Bronstad, M.E. Highway guardrails: Safety feature or roadside hazard? Transp. Res. Rec. 1994, 1468, 1–9. [Google Scholar]
  23. Elvik, R. The safety value of guardrails and crash cushions: A meta-analysis of evidence from evaluation studies. Accid. Anal. Prev. 1995, 27, 523–549. [Google Scholar] [CrossRef]
  24. Holdridge, J.M.; Shankar, V.N.; Ulfarsson, G.F. The crash severity impacts of fixed roadside objects. J. Saf. Res. 2005, 36, 139–147. [Google Scholar] [CrossRef] [PubMed]
  25. Mak, K.K. Safety effects of roadway design decisions-roadside. Transp. Res. Rec. 1995, 1512, 16–21. [Google Scholar]
  26. European Committee for Standardization Road Restraint Systems Part 1: Terminology and General Criteria for Test Methods; CEN: Brussels, Belgium, 2010.
  27. European Committee for Standardization Road Restraint Systems Part 2: Performance Classes, Impact Test Acceptance Criteria and Test Methods for Safety Barriers Including Vehicle Parapets; CEN: Brussels, Belgium, 2010.
  28. European Committee for Standardization Road Restraint Systems Part 3: Performance Classes, Impact Test Acceptance Criteria and Test Methods for Crash Cushions; CEN: Brussels, Belgium, 2010.
  29. European Committee for Standardization Road Restraint Systems Part 4: Performance Classes, Impact Test Acceptance Criteria and Test Methods for Terminals and Transitions of Safety Barriers; CEN: Brussels, Belgium, 2010.
  30. European Committee for Standardization Road Restraint Systems Part 5: Product Requirements and Evaluation of Conformity for Vehicle Restraint Systems; CEN: Brussels, Belgium, 2010.
  31. Tahmasseby, S.; Muley, D.; Wink, B.W. Performance evaluation of vehicle restraint systems in the context of design and installation. Civ. Eng. J. 2021, 7, 449–460. [Google Scholar] [CrossRef]
  32. Balado, J.; Martínez-Sánchez, J.; Arias, P.; Novo, A. Road environment semantic segmentation with deep learning from MLS point cloud data. Sensors 2019, 19, 3466. [Google Scholar] [CrossRef] [PubMed]
  33. Findley, D.J.; Cunningham, C.M.; Hummer, J.E. Comparison of mobile and manual data collection for roadway components. Transp. Res. Part C Emerg. Technol. 2011, 19, 521–540. [Google Scholar] [CrossRef]
  34. Haas, K.; Hensing, D. Why Your Agency Should Consider Asset Management Systems for Roadway Safety; Federal Highway Administration, Office of Safety Research and Development: Washington, DA, USA, 2005. [Google Scholar]
  35. Zhou, H.; Jalayer, M.; Gong, J.; Hu, S.; Grinter, M. Investigation of Methods and Approaches for Collecting and Recording Highway Inventory Data; FHWA-ICT-13-022; Illinois Department of Transportation: Springfield, IL, USA, 2013. [Google Scholar]
  36. Vaiana, R.; Perri, G.; Iuele, T.; Gallelli, V. A comprehensive approach combining regulatory procedures and accident data analysis for road safety management based on the European Directive 2019/1936/EC. Safety 2021, 7, 6. [Google Scholar] [CrossRef]
  37. EU Directive 2008/96/EC of the European Parliament and of the Council of 19 November 2008 on road infrastructure safety management. Off. J. Eur. Union 2008, 50, 59–67.
  38. Rossetti, S.; Tiboni, M.; Tira, M. Road safety in Italy: An assessment of the current situation and the priorities of intervention. Period. Polytech. Transp. Eng. 2014, 42, 159–165. [Google Scholar] [CrossRef]
  39. Weekley, J.; Barrell, J.; McCarthy, T. Developing a road safety review tool to identify design standard and safety deficits on high risk road sections. Transp. Res. Procedia 2016, 14, 4130–4139. [Google Scholar] [CrossRef]
  40. Lee, J.; Mannering, F. Impact of roadside features on the frequency and severity of run-off-roadway accidents: An empirical analysis. Accid. Anal. Prev. 2002, 34, 149–161. [Google Scholar] [CrossRef]
  41. Wolford, D.; Sicking, D.L. Guardrail need: Embankments and culverts. Transp. Res. Rec. 1997, 1599, 48–56. [Google Scholar] [CrossRef]
  42. Daniels, S.; Martensen, H.; Schoeters, A.; Van den Berghe, W.; Papadimitriou, E.; Ziakopoulos, A.; Kaiser, S.; Aigner-Breuss, E.; Soteropoulos, A.; Wijnen, W. A systematic cost-benefit analysis of 29 road safety measures. Accid. Anal. Prev. 2019, 133, 105292. [Google Scholar] [CrossRef] [PubMed]
  43. Gutierrez, S.N. Asset Management Support Tools to Assist Agencies in the Development of Guardrail Preservation Programs. Master’s Thesis, University of Texas at El Paso, El Paso, TX, USA, 2017. [Google Scholar]
  44. Pu, S.; Rutzinger, M.; Vosselman, G.; Elberink, S.O. Recognizing basic structures from mobile laser scanning data for road inventory studies. ISPRS J. Photogramm. Remote Sens. 2011, 66, S28–S39. [Google Scholar] [CrossRef]
  45. Zhang, Z.; Jin, X.; Zhang, G.; Xiao, S. A New Method of Modern Road Survey Technology and Safety Auditing. In CICTP 2019; ASCE: Reston, VA, USA, 2019; pp. 2123–2135. [Google Scholar]
  46. Hou, Q.; Ai, C.; Boudreau, N. Network-Level Guardrail Extraction Based on 3D Local Features from Mobile LiDAR Sensor. J Comput. Civ. Eng. 2022, 36, 04022035. [Google Scholar] [CrossRef]
  47. Balali, V.; Golparvar-Fard, M. Segmentation and recognition of roadway assets from car-mounted camera video streams using a scalable non-parametric image parsing method. Autom. Constr. 2015, 49, 27–39. [Google Scholar] [CrossRef]
  48. Kačan, M.; Oršić, M.; Šegvić, S.; Ševrović, M. Multi-Task Learning for iRAP Attribute Classification and Road Safety Assessment. In Proceedings of the 2020 IEEE 23rd International Conference on Intelligent Transportation Systems (ITSC), Rhodes, Greece, 1–20 September 2020; IEEE: Piscataway, NJ, USA, 2020; pp. 1–6. [Google Scholar]
  49. Kim, Y.R.; Hummer, J.E.; Gabr, M.; Johnston, D.; Underwood, B.S.; Findley, D.J.; Cunningham, C.M. Asset Management Inventory and Data Collection; Department of Transportation, Research and Analysis Group: Raleigh, NC, USA, 2009. [Google Scholar]
  50. Verma, B.; Zhang, L.; Stockwell, D. Roadside Video Data Analysis: Deep Learning; Springer: Singapore, 2017. [Google Scholar]
  51. Yi, H.; Bizon, C.; Borland, D.; Watson, M.; Satusky, M.; Rittmuller, R.; Radwan, R.; Srinivasan, R.; Krishnamurthy, A. AI Tool with Active Learning for Detection of Rural Roadside Safety Features. In Proceedings of the 2021 IEEE International Conference on Big Data (Big Data), Orlando, FL, USA, 15–18 December 2021; IEEE: Piscataway, NJ, USA, 2021; pp. 5317–5326. [Google Scholar]
  52. Sainju, A.M.; Jiang, Z. Mapping road safety features from streetview imagery: A deep learning approach. ACM Trans. Data Sci. 2020, 1, 15. [Google Scholar] [CrossRef]
  53. Jalayer, M.; Zhou, H.; Gong, J.; Hu, S.; Grinter, M. A comprehensive assessment of highway inventory data collection methods. J. Transp. Res. Forum 2014, 53, 73–92. [Google Scholar] [CrossRef]
  54. Sairam, N.; Nagarajan, S.; Ornitz, S. Development of mobile mapping system for 3D road asset inventory. Sensors 2016, 16, 367. [Google Scholar] [CrossRef]
  55. Khan, G.; Santiago-Chaparro, K.R.; Chiturri, M.; Noyce, D.A. Development of data collection and integration framework for road inventory data. Transp. Res. Rec. 2010, 2160, 29–39. [Google Scholar] [CrossRef]
  56. Beleznai, C.; Göbel, K.; Stefan, C.; Dorninger, P.; Pusica, A. Vision-based mobile analysis of roadside guardrail structures. In Proceedings of the 2023 6th International Conference on Machine Vision and Applications, Singapore, 24–26 February 2023; pp. 167–173. [Google Scholar]
  57. Alessandretti, G.; Broggi, A.; Cerri, P. Vehicle and guard rail detection using radar and vision data fusion. IEEE Trans. Intell. Transp. Syst. 2007, 8, 95–105. [Google Scholar] [CrossRef]
  58. He, Y.; Song, Z.; Liu, Z. Updating highway asset inventory using airborne LiDAR. Measurement 2017, 104, 132–141. [Google Scholar] [CrossRef]
  59. Cunningham, M.; PE, C.M.; Findley, P.D.; PE, D.J.; Hovey, K.; Foley, P.B.; Smith, J.; Fowler, T. Comparison of Mobile Asset Data Collection Vehicles to Manual Collection Methods; North Carolina Department of Transportation: Raleigh, NC, USA, 2013. [Google Scholar]
  60. Radopoulou, S.C.; Brilakis, I. Improving road asset condition monitoring. Transp. Res. Procedia 2016, 14, 3004–3012. [Google Scholar] [CrossRef]
  61. Rosolino, V.; Teresa, I.; Vittorio, A.; Carmine, F.D.; Antonio, T.; Daniele, R.; Claudio, Z. Road safety performance assessment: A new road network Risk Index for info mobility. Procedia-Soc. Behav. Sci. 2014, 111, 624–633. [Google Scholar] [CrossRef]
  62. Loprencipe, G.; Moretti, L.; Cantisani, G.; Minati, P. Prioritization methodology for roadside and guardrail improvement: Quantitative calculation of safety level and optimization of resources allocation. J. Traffic Transp. Eng. (Engl. Ed.) 2018, 5, 348–360. [Google Scholar] [CrossRef]
  63. Khademi, N.; Sheikholeslami, A. Multicriteria group decision-making technique for a low-class road maintenance program. J. Infrastruct. Syst. 2010, 16, 188–198. [Google Scholar] [CrossRef]
  64. Macorig, D.; Ristori, C.; Bertoli, V. Development of a method to evaluate the priorities of intervention on the road network of the Province of Pisa. Transp. Res. Procedia 2020, 45, 103–110. [Google Scholar] [CrossRef]
  65. Leur, P.D.; Sayed, T. Development of a road safety risk index. Transp. Res. Rec. 2002, 1784, 33–42. [Google Scholar] [CrossRef]
  66. Cafiso, S.; La Cava, G.; Montella, A. Safety index for evaluation of two-lane rural highways. Transp. Res. Rec. 2007, 2019, 136–145. [Google Scholar] [CrossRef]
  67. Lambert, J.H.; Baker, J.A.; Peterson, K.D. Decision aid for allocation of transportation funds to guardrails. Accid. Anal. Prev. 2003, 35, 47–57. [Google Scholar] [CrossRef]
  68. Persia, L.; Usami, D.S.; De Simone, F.; De La Beaumelle, V.F.; Yannis, G.; Laiou, A.; Han, S.; Machata, K.; Pennisi, L.; Marchesini, P. Management of road infrastructure safety. Transp. Res. Procedia 2016, 14, 3436–3445. [Google Scholar] [CrossRef]
  69. Shbeeb, L. Road safety performance index: A tool for crash prediction. Cogent Eng. 2022, 9, 2124637. [Google Scholar] [CrossRef]
  70. Montella, A. Safety reviews of existing roads: Quantitative safety assessment methodology. Transp. Res. Rec. 2005, 1922, 62–72. [Google Scholar] [CrossRef]
  71. Durango, P.L.; Madanat, S.M. Optimal maintenance and repair policies in infrastructure management under uncertain facility deterioration rates: An adaptive control approach. Transp. Res. Part A Policy Pract. 2002, 36, 763–778. [Google Scholar] [CrossRef]
  72. Pantha, B.R.; Yatabe, R.; Bhandary, N.P. GIS-based highway maintenance prioritization model: An integrated approach for highway maintenance in Nepal mountains. J. Transp. Geogr. 2010, 18, 426–433. [Google Scholar] [CrossRef]
  73. Battistini, R.; Nalin, A.; Simone, A.; Lantieri, C.; Vignali, V. How do University Student Cyclists Ride? The Case of University of Bologna. Appl. Sci. 2022, 12, 11569. [Google Scholar] [CrossRef]
  74. Šegvić, S.; Brkić, K.; Kalafatić, Z.; Stanisavljević, V.; Ševrović, M.; Budimir, D.; Dadić, I. A computer vision assisted geoinformation inventory for traffic infrastructure. In Proceedings of the 13th International IEEE Conference on Intelligent Transportation Systems, Funchal, Portugal, 19–22 September 2010; IEEE: Piscataway, NJ, USA, 2010; pp. 66–73. [Google Scholar]
  75. Lee, B.; Aizpuru, P.; Neely, S. Statewide Analysis of Guardrails, Curves and Crashes; University of Vermont: Burlington, VT, USA, 2015. [Google Scholar]
  76. Barrile, V.; Meduri, G.M.; Critelli, M.; Bilotta, G. MMS and GIS for Self-driving Car and Road Management. In Proceedings of the Computational Science and Its Applications–ICCSA 2017: 17th International Conference, Trieste, Italy, 3–6 July 2017; Proceedings, Part IV 17. Springer: Berlin/Heidelberg, Germany, 2017; pp. 68–80. [Google Scholar]
  77. Jalayer, M.; Gong, J.; Zhou, H.; Grinter, M. Evaluation of remote sensing technologies for collecting roadside feature data to support highway safety manual implementation. J. Transp. Saf. Secur. 2015, 7, 345–357. [Google Scholar] [CrossRef]
  78. Ministero delle Infrastrutture e dei Trasporti Linee guida per la gestione della sicurezza delle infrastrutture stradali ai sensi dell’articolo 8 del decreto legislativo 15 marzo 2011, n. 35. Gazz. Uff. Della Repubb. Ital. 2012, 35, 209.
  79. European Digital Elevation Model (EU-DEM), Version 1.1. Available online: https://land.copernicus.eu/imagery-in-situ/eu-dem/eu-dem-v1.1/view (accessed on 27 October 2023).
  80. Zou, Y.; Tarko, A.P.; Chen, E.; Romero, M.A. Effectiveness of cable barriers, guardrails, and concrete barrier walls in reducing the risk of injury. Accid. Anal. Prev. 2014, 72, 55–65. [Google Scholar] [CrossRef]
  81. Wilson, E.M.; Lipinski, M.E. Practical safety tool for local low-volume rural roads: The road safety audit review. Transp. Res. Rec. 2003, 1819, 225–230. [Google Scholar] [CrossRef]
  82. Polidori, C.; Cocu, X.; Volckaert, A.; Lemke, K.; Teichner, T. Safety prevention manual for secondary roads. In Project PILOT4SAFETY, Deliverable D2; European Commission: Brussels, Belgium, 2011. [Google Scholar]
  83. Vermont Agency of Transportation. Vermont Agency of Transportation Statewide Guardrail Inventory Field Manual; Vermont Agency of Transportation: Barre, VT, USA, 2017. [Google Scholar]
  84. VTrans Guardrail Inventory. Available online: https://geodata.vermont.gov/datasets/VTrans::vtrans-guardrail-inventory/about (accessed on 15 November 2023).
  85. Gharbi, A.; Haddadi, S. Application of the mobile GIS for the improvement of the knowledge and the management of the road network. Appl. Geomat. 2020, 12, 23–39. [Google Scholar] [CrossRef]
Figure 1. Overview of workflow.
Infrastructures 08 00181 g001
Figure 2. Overview of study area: road network, survey zones and location of Bologna with regard to Northern Italy. Orange lines represent the boundaries of survey zones.
Infrastructures 08 00181 g002
Figure 3. Sample of adopted codification system.
Infrastructures 08 00181 g003
Figure 4. Location of surveyed road barriers.
Infrastructures 08 00181 g004
Figure 5. Typology of surveyed road barriers.
Infrastructures 08 00181 g005
Figure 6. Materials of surveyed road barriers.
Infrastructures 08 00181 g006
Figure 7. Hazards protected by road barriers.
Infrastructures 08 00181 g007
Figure 8. F Coefficient overview.
Infrastructures 08 00181 g008
Figure 9. D Coefficient overview.
Infrastructures 08 00181 g009
Figure 10. R rank overview.
Infrastructures 08 00181 g010
Table 1. Coefficient D range and sample images.
Coefficient ValueCoefficient
Description
Sample
Image
1
  • Deformation level: longitudinal and/or vertical, along the entire barrier
  • Status of components: extremely degraded and presumably perished
  • Conformity to the original shape and positioning: no conformity
Infrastructures 08 00181 i001
0.85
  • Deformation level: longitudinal and/or vertical in several elements
  • Status of components: degraded, but probably still operational
  • Conformity to the original shape and positioning: limited conformity
Infrastructures 08 00181 i002
0.75
  • Deformation level: localized longitudinal and/or vertical
  • Status of components: degraded, but probably still operational
  • Conformity to the original shape and positioning: partial conformity
Infrastructures 08 00181 i003
0.65
  • Deformation level: no visible deformations
  • Status of components: degraded, but probably still operational
  • Conformity to the original shape and positioning: partial conformity
Infrastructures 08 00181 i004
0.1
  • Deformation level: no visible deformations
  • Status of components: non degraded
  • Conformity with the original shape and positioning: overall conformity
Infrastructures 08 00181 i005
Table 2. Coefficient F range and sample images.
Coefficient DescriptionCoefficient Value
The barrier is installed on decks1
The barrier is installed in protection of sidewalks or cycle paths0.90
The barrier is installed on cliffs/slopes 0.60
The barrier is installed in protection of edges whose height is >1 m above the ground level0.30
The barrier is installed in protection of edges whose height is ≤1 m above the ground level0.10
Table 3. Maintenance priority. Description of R classes.
Coefficient DescriptionCoefficient Range
Class 1—Urgent reparation or replacements are needed0.7 < R < 1
Class 2—Short-term repair or replacements are required0.5 < R < 0.7
Class 3—Medium-term reparative interventions must be planned0.2 < R < 0.5
Class 4—Some minor interventions should be evaluated0.01 < R < 0.2
Table 4. Road network overview.
Road TypologyLength (km)
Municipal roads800.61
Other authorities’ roads29.48
Private roads23.52
Total853.61
Table 5. Main characteristics of surveyed barriers.
Survey OutputUnitsValue
Total number of barriers 609 (100%)
Total length of barrierskm79.06 (100%)
Number of barriers in Zone ‘Eastern plain’ 160 (26.27%)
Length of barriers in Zone ‘Eastern plain’km17.76 (22.46%)
Number of barriers in Zone ‘Hills’ 166 (27.25%)
Length of barriers in Zone ‘Hills’km16.91 (21.38%)
Number of barriers in Zone ‘Western plain’ 283 (46.46%)
Length of barriers in Zone ‘Western plain’km44.39 (56.14%)
Number of geotagged photos 736
Table 6. Typological overview of surveyed barriers (number of barriers and length).
Survey OutputUnitsValue
Total number of barriers, N2 207
Total length of barriers, N2km19.56
Total number of barriers, H1 204
Total length of barriers, H1km32.08
Total number of barriers, H2 82
Total length of barriers, H2km9.55
Total number of barriers, H3 204
Total length of barriers, H3km32.09
Total number of barriers, Jersey 46
Total length of barriers, Jerseykm9.37
Total number of unclassifiable barriers 4
Total length of unclassifiable barrierskm0.34
Total number of barriers made of steel 553
Total length of barriers made of steelkm69.01
Total number of barriers made of steel and wood 9
Total length of barriers made of steel and woodkm0.75
Total number of barriers made of concrete 46
Total length of barriers made of concretekm9.30
Table 7. F Coefficient overview (number of barriers and length).
Survey OutputUnitsValue
Total number of barriers ranked F = 0.10 229
Total length of barriers ranked F = 0.10km31.99
Total number of barriers ranked F = 0.30 39
Total length of barriers ranked F = 0.30km7.32
Total number of barriers ranked F = 0.60 131
Total length of barriers ranked F = 0.60km18.57
Total number of barriers ranked F = 0.90 107
Total length of barriers ranked F = 0.90km11.68
Total number of barriers ranked F = 1 109
Total length of barriers ranked F = 1km9.13
Average F coefficient detected in zone ‘Eastern plain’ 0.43
Average F coefficient detected in zone ‘Hills’km0.66
Average F coefficient detected in zone ‘Western plain’ 0.36
Table 8. D Coefficient overview (number of barriers and length).
Survey OutputUnitsValue
Total number of barriers ranked D = 0.10 178
Total length of barriers ranked D = 0.10Km17.25
Total number of barriers ranked D = 0.65 173
Total length of barriers ranked D = 0.65Km28.19
Total number of barriers ranked D = 0.75 113
Total length of barriers ranked D = 0.75Km15.33
Total number of barriers ranked D = 0.85 96
Total length of barriers ranked D = 0.85Km11.56
Total number of barriers ranked D = 1 75
Total length of barriers ranked D = 1Km6.37
Average D coefficient detected in zone ‘Eastern plain’ 0.62
Average D coefficient detected in zone ‘Hills’Km0.70
Average D coefficient detected in zone ‘Western plain’ 0.54
Table 9. R class overview (number of barriers and length).
Survey OutputUnitsValue
Total number of barriers falling into Class 4 (0.01 < R < 0.2) 377
Total length of barriers falling into Class 4 (0.01 < R < 0.2)km48.46
Total number of barriers falling into Class 3 (0.2 < R < 0.5) 58
Total length of barriers falling into Class 3 (0.2 < R < 0.5)km8.95
Total number of barriers falling into Class 2 (0.5 < R < 0.7) 136
Total length of barriers falling into Class 2 (0.5 < R < 0.7)km15.59
Total number of barriers falling into Class 1 (0.7 < R < 1) 56
Total length of barriers falling into Class 1 (0.7 < R < 1)km6.07
Average R coefficient detected in zone ‘Eastern plain’ 0.20
Average R coefficient detected in zone ‘Hills’km0.48
Average R coefficient detected in zone ‘Western plain’ 0.21
Table 10. R classes overview (number of barriers and length).
OdonymZoneKm of
Barriers
Av. D Coeff.Av. F Coeff.Av. R Coeff.
Viale Sandro PertiniWestern plain9.570.580.300.16
Via Nuova BazzaneseWestern plain4.270.690.150.11
Via di SabbiunoHills3.040.700.750.51
Via dei ColliHills2.840.800.630.50
Via PersicetanaWestern plain2.830.680.670.45
Via del TriumviratoWestern plain2.540.220.800.12
Via FerrareseEastern plain2.470.460.570.16
Via di CasagliaHills2.150.570.610.37
Via CasteldeboleWestern plain1.940.520.640.28
Via Umbro LorenziniWestern plain1.720.650.300.20
Viale Europa (bridge)Eastern plain1.570.800.460.37
Ring road exit ramp 8Eastern plain1.550.730.420.29
Ring road entry ramp 5Western plain1.450.590.360.20
Via di RoncrioHills1.400.800.290.23
Ring road entry ramp 8Eastern plain1.280.790.280.27
Borgo Panigale linkWestern plain1.270.100.530.05
Via delle LastreHills1.210.820.860.70
Via di Monte AlbanoHills1.160.540.830.44
Via Emilio LepidoWestern plain1.130.320.400.15
Via BenazzaWestern plain1.100.520.620.32
Via ColomboWestern plain1.090.280.350.06
Via dell’AeroportoWestern plain1.090.630.160.07
Ring road entry ramp 2Western plain1.080.590.100.06
Via StalingradoEastern plain1.040.410.100.04
Bacchelli BridgeWestern plain1.010.751.000.75
Disclaimer/Publisher’s Note: The statements, opinions and data contained in all publications are solely those of the individual author(s) and contributor(s) and not of MDPI and/or the editor(s). MDPI and/or the editor(s) disclaim responsibility for any injury to people or property resulting from any ideas, methods, instructions or products referred to in the content.

