Article

Fast Neutron Scintillator Screens for Neutron Imaging Using a Layered Polymer-Phosphor Architecture

1
Idaho National Laboratory, MS 6000, Idaho Falls, ID 83415, USA
2
Heinz Maier-Leibnitz Zentrum (FRM II) Technische Universität München, 85748 Garching, Germany
3
Colorado School of Mines, 1500 Illinois St., Golden, CO 80401, USA
4
DMI/Reading Imaging, Reading, MA 01867, USA
*
Author to whom correspondence should be addressed.
Quantum Beam Sci. 2022, 6(2), 14; https://doi.org/10.3390/qubs6020014
Submission received: 16 February 2022 / Revised: 15 March 2022 / Accepted: 17 March 2022 / Published: 1 April 2022
(This article belongs to the Special Issue New Trends in Neutron Instrumentation, 2nd Edition)

Abstract

:
Fast neutrons enable a nondestructive examination of dense, large, and highly attenuating samples due to their lower interaction probability compared to thermal neutrons. However, this also creates a challenge in fast neutron imaging, as the thicker sensors necessary to detect fast neutrons degrade an image’s spatial resolution due to scattering within the sensor and the indeterminate depth of interaction in the sensor. This work explores the advantages of a fast neutron imaging screen with a layered polymer-phosphor screen approach as opposed to a mixed polymer-phosphor screen typically used in fast neutron imaging. Proton recoil is the primary conversion mechanism for fast neutron imaging. Simulations showed that the recoil proton range of typical fast neutrons is approximately 200 µm, however, tests at Idaho National Laboratory revealed that the light output of these screens increased at much greater polymer thicknesses. The NECTAR fast neutron beamline at FRM II was used to test the imaging performance of layered fast neutron imaging screens. Distinguishing between the fast-neutron and γ-ray signals is a major challenge in fast neutron imaging because all fast neutron sources also produce γ-rays. A relative comparison between a control plate and the fast neutron screen was made to distinguish between a γ-ray and fast neutron signals. MCNP modeling quantified the γ-ray and fast neutron contributions to the images measured at NECTAR, which were approximately a 75% γ-ray image.

1. Introduction

1.1. Background

Deeper penetration of fast neutrons and their interaction probability with materials which is lower than for thermal neutrons make them useful for examining large or highly attenuating samples that cannot be penetrated by thermal neutrons or X-rays. However, fast neutrons’ low interaction probability causes low neutron detection efficiency for relatively thin scintillators (<1 mm in thickness), which creates challenges in engineering fast neutron imaging systems. The need to examine dense and large samples has stimulated interest in developing improved fast neutron scintillators that offer higher spatial resolution and detection efficiency. Applications for fast neutron imaging include a nondestructive examination of nuclear fuel without removing it from biological shielding [1,2,3] and utilizing portable neutron generators in active investigations of cargo [4,5,6]. Fast neutron imaging can be performed with a variety of neutron sources, such as neutron generators, accelerators, spallation neutron sources, and nuclear reactor beamlines with a direct line-of-sight to the core [7].
Neutrons are not directly detectable by digital imaging sensors and must always be converted to ionizing radiation that can be detected by a sensor. For thermal and cold neutron detection, 6Li or gadolinium are often used as a neutron converter via absorption and consecutive emission of alpha particles (for 6Li) or conversion electrons (for Gd), in conjunction with an imaging sensor that detects photons produced by the charged particles within the scintillator. In contrast, the primary mechanism for fast neutron imaging utilizes a proton recoil reaction to mobilize charged particles, which then interact with the scintillator, producing photons [8,9,10]. Fast neutron sensors have traditionally consisted of a hydrogenous material (e.g., polymer) and a scintillator material, mixed to create a plastic scintillator. Generally, fast neutron imaging research has been primarily focused on developing scintillator screens that provide high neutron detection efficiency while also retaining sufficient spatial resolution performance for features to be clearly depicted.
All neutron sources also inherently produce γ-rays, which create unique challenges for fast neutron imaging because fast neutron detectors are to some extent also sensitive to γ-rays. Therefore, γ-ray contributions to the image must be distinguished from the fast neutron signal [11] in applications where material quantities are determined from particle attenuation. Many single-event fast neutron detectors rely on pulse-shape discrimination techniques to separate the γ-ray and fast neutron signals [12,13,14,15], but such techniques are usually impractical or challenging to apply for imaging. Another challenge of fast neutron imaging is finding a test specimen that will produce a sharp edge for spatial resolution measurements. While there are materials with high thermal neutron attenuation cross-sections that make good edge specimens for thermal neutron imaging (e.g., gadolinium), there are no such strong attenuating materials for fast neutrons. Scattering is the primary mechanism for fast neutron interactions which, when coupled with their low absorption cross-sections, makes it difficult to produce a sharp edge in fast neutron radiographs.
While current fast neutron imaging screens are comprised of homogeneously mixed polymer and scintillator materials, this work explores fast neutron scintillator screens consisting of separate polymer converter and scintillator phosphor materials in adjacent layers. This study investigated the effects on image quality of both converter and phosphor thicknesses using a single screen consisting of a continuous wedge-shaped polymer converter perpendicular to a stepped wedge of scintillator phosphor. This study also explored a method for differentiating between fast neutron and γ-ray signals.

1.2. Theory

A neutron scintillator requires a converter material, which interacts with neutrons to produce charged particles, and a scintillator phosphor, which produces photons when exposed to charged particles. Layered fast neutron scintillator screens consist of separate converter and scintillator materials. A layer of converter material, usually a hydrogenous material, such as high-density polyethylene (HDPE) for fast neutrons, is placed into contact with a phosphor material like ZnS:Cu (zinc sulfide activated with copper). Fast neutrons interact with the converter material through an elastic scattering mechanism with the nuclei of the converter material’s atoms. This collision transfers the neutron’s energy to a proton, which is ejected from the nucleus. For hydrogen, the proton is the nucleus, and the recoil proton is stripped of its electron. The proton, through its electric charge, undergoes electromagnetic interactions with the scintillator material and produces photons.
Layered fast neutron scintillator screens offer the potential for improved spatial resolution because both the polymer converter and scintillation layers can be thinner than homogeneous plastic scintillators. While thinner detectors decrease the chance of a fast neutron interaction, they also provide less attenuation and scattering of the photons that are produced. Scattered photons create a blurred image as they are dispersed from the original interaction location. This theoretical basis for fast neutron scintillator screens offering improved spatial resolution has been evaluated [16]. Some optimization of layered fast neutron scintillator screens [17] and phosphors have also been conducted [18]. Initial testing of layered fast neutron scintillator screens has recently been studied [19,20]. Contrary to assumptions made in these previous studies, Zboray et al. have shown the range of a 5 MeV proton recoil to be approximately 300 µm in a mixture of polypropylene and ZnS [21], implying layered screens thicker than 300 µm degrade resolution without improving light output. This effort sought to examine fast neutron scintillator screens to measure image quality for a range of converter and phosphor thicknesses.

2. Materials and Methods

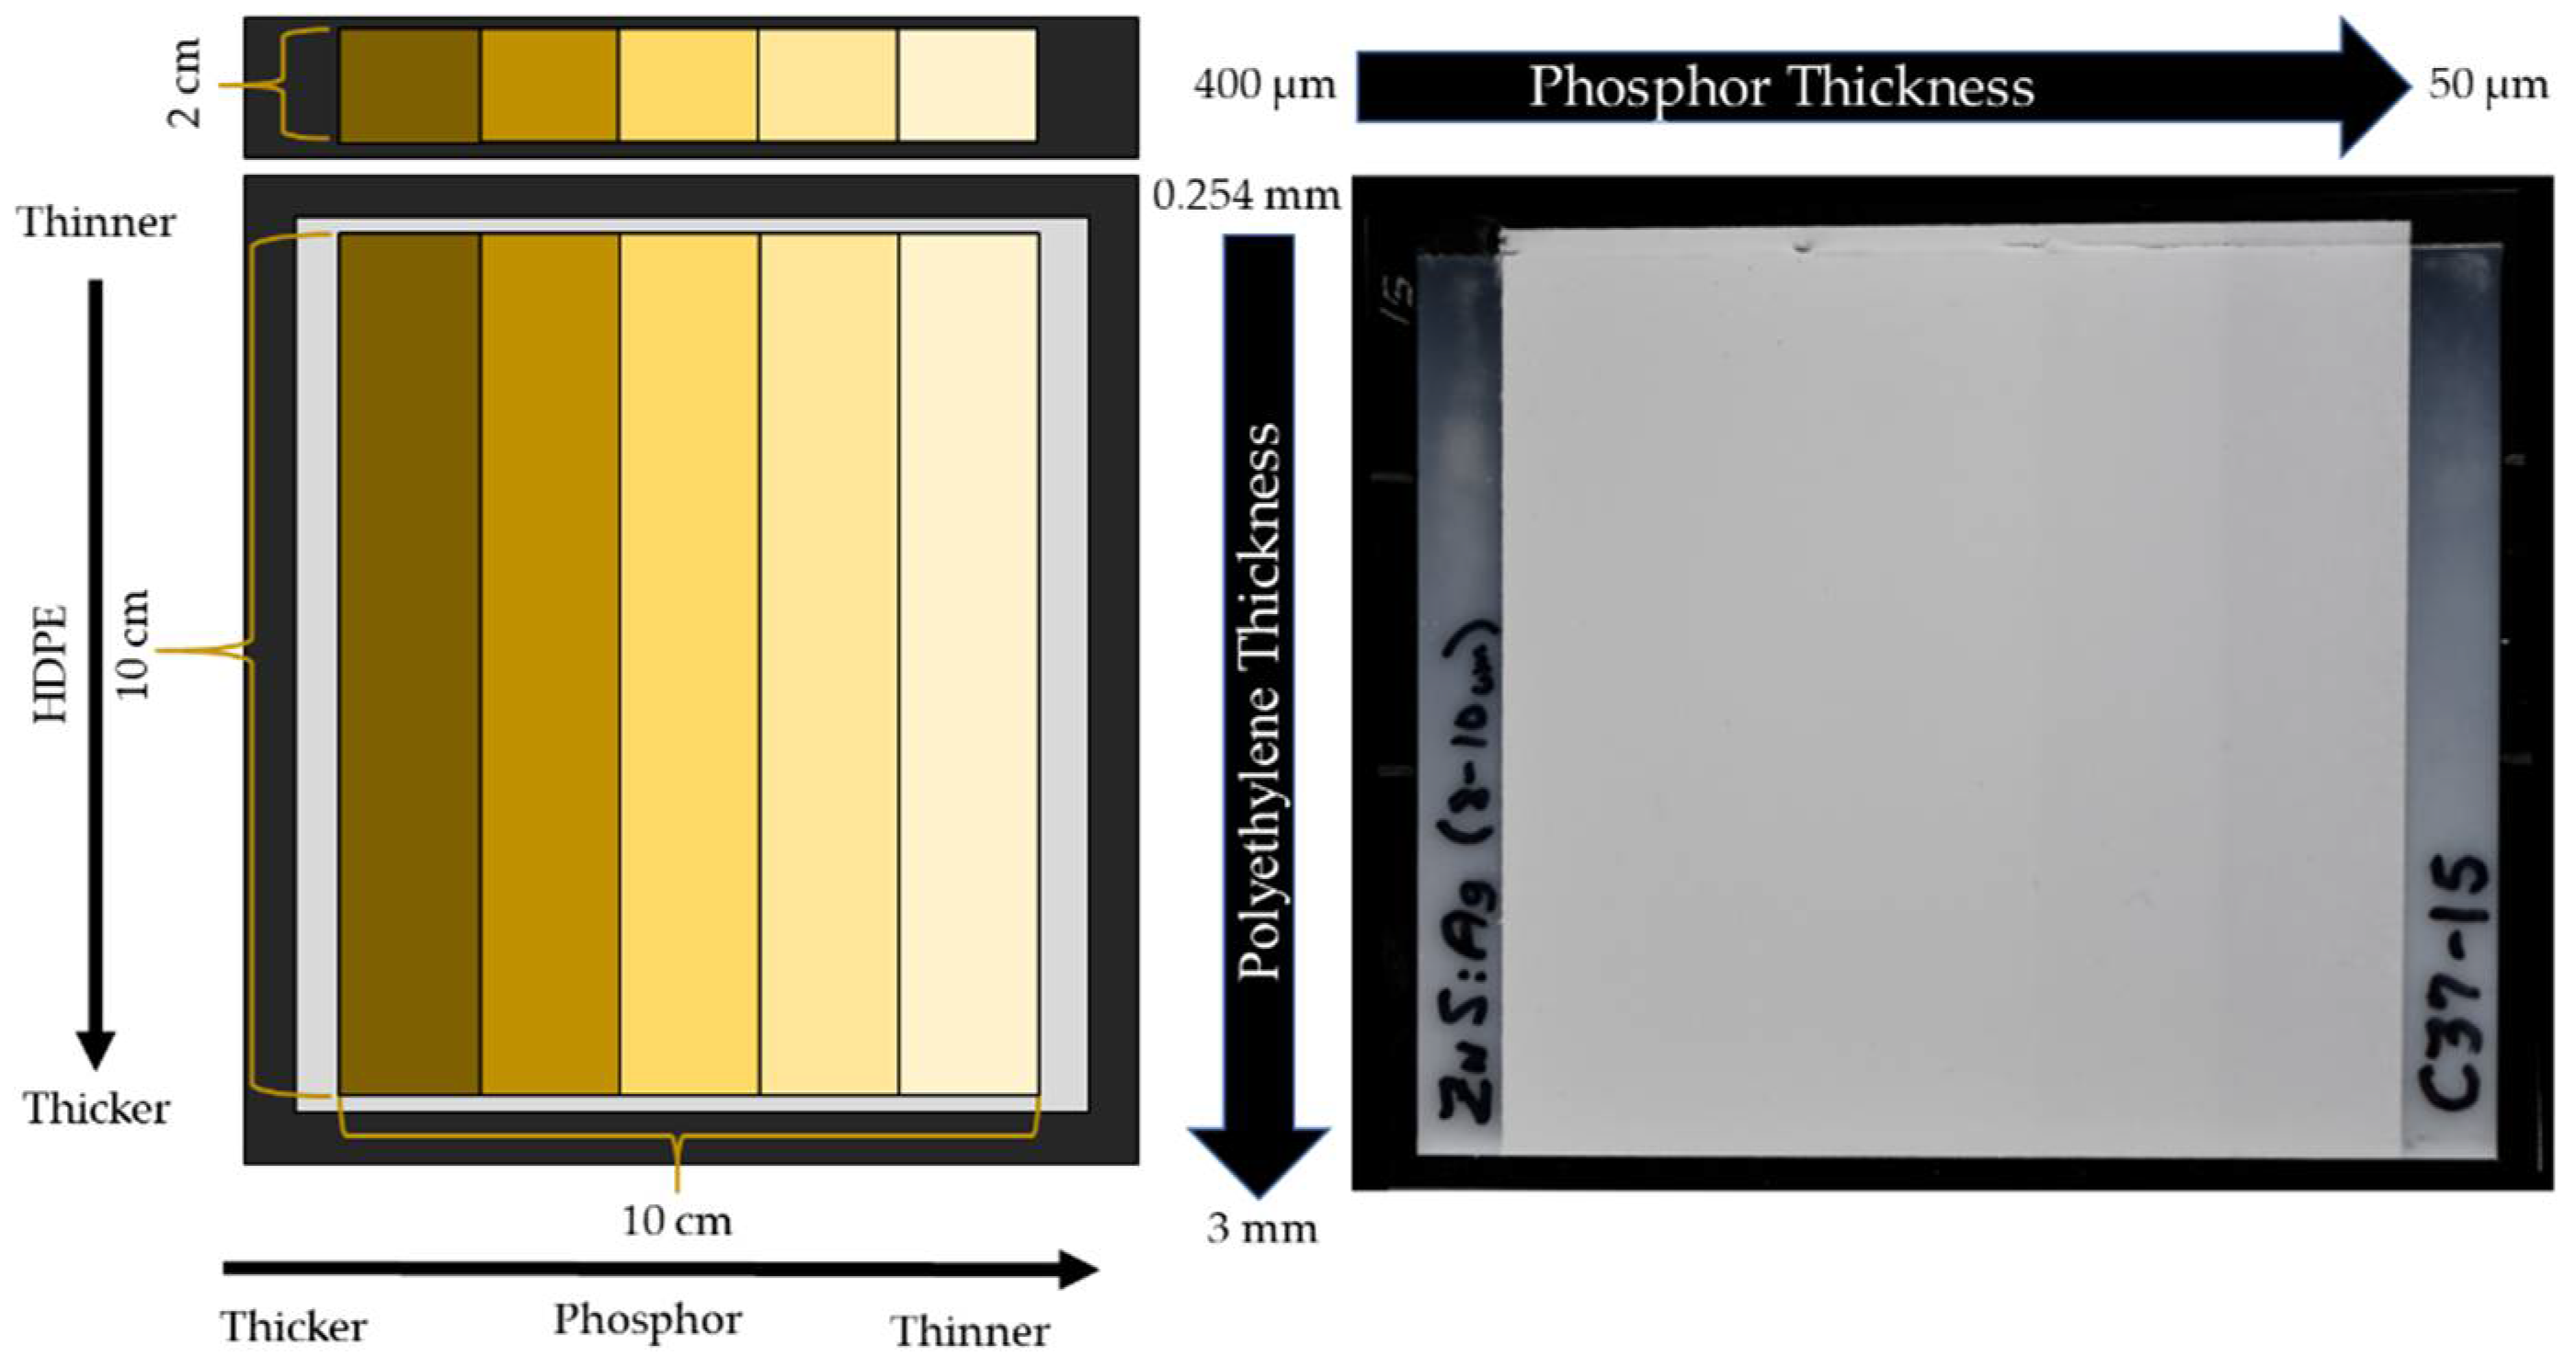
2.1. Layered Scintillator Screens

This study utilized a “double wedge” fast neutron scintillator screen [22] to measure the performance of layered screens for a range of phosphor thicknesses and HDPE thicknesses with a single screen. A wedge of HDPE, ranging continuously in thickness from 3 mm to 0.254 mm, served as the converter material. Scintillator material was placed in strips of discrete thicknesses (400 µm, 300 µm, 200 µm, 100 µm, and 50 µm) perpendicular to the HDPE converter wedge. The HDPE was attached to an aluminum substrate for structural support and the scintillator material was coated directly onto the HDPE. Figure 1 shows a schematic and photograph of a double wedge fast neutron scintillator screen. The goal of the double-wedged approach to scintillator screen optimization is to simultaneously evaluate a wide range of converter and scintillator material thicknesses without requiring hundreds of screens with discrete layer thicknesses. The neutron radiograph generates a two-dimensional light output profile to determine the combination of converter and scintillator material thicknesses that produce the highest light output.

2.2. Neutron Sources

Two neutron beamlines, Idaho National Laboratory’s (INL) Neutron Radiography Reactor’s (NRAD) north beamline [2], and the Technical University of Munich’s Heinz Maier-Leibnitz Zentrum (MLZ) Reactor’s (Forschungsreaktor München II or FRM II) NECTAR beamline [23] were utilized in this work. Initial scoping studies occurred at NRAD, and the NECTAR beamline was used because it is well characterized and is user-friendly.

2.2.1. Idaho National Laboratory’s Neutron Radiography Reactor

INL’s NRAD reactor is a 250 kW TRIGA reactor that has two radial beamlines with a direct line-of-sight to the reactor core, creating a large fast neutron and γ-ray content in the beamline. The North Radiography Station (NRS) beamline, which has an average thermal-equivalent flux of 4.5 × 10⁶ n/cm2s as measured by gold foil activation, was utilized in this work. A 1 mm thick cadmium sheet was placed in the beamline to filter thermal neutrons during this experiment. The cadmium ratio, determined by an MCNP simulation, was 1.97 and the collimation ratio, L/D, for this work was set to 185. A ZWO ASI178MM-Cool CMOS digital camera, which has an IMX178 sensor that is 7.4 × 5.0 mm² with an array of 3096 × 2080 pixels, was optically coupled to the fast neutron screen to acquire radiographs. The camera was cooled to approximately −20 °C to reduce thermal noise.

2.2.2. Technical University of Munich’s Heinz Maier-Leibnitz Zentrum Reactor

The FRM II Reactor, located in Garching, Germany, is a 20 MW reactor. FRM II has two beamlines dedicated to neutron imaging: ANTARES, which is a cold neutron beamline [24], and NECTAR, which has a unique removable uranium converter plate that can be moved onto the beginning of the beam tube to produce an unmoderated fission spectrum. When removed, the beamline can also be used for thermal neutron imaging [23,25]. NECTAR’s beamline has a calculated fast fission neutron flux of 1.05 × 10⁶ n/cm2/s and dimensions of 35 cm × 35 cm at the image plane. The beamline is relatively homogeneous but loses uniformity near the edges. However, the beam was collimated and scraped to a 20 cm × 20 cm area for this work, encompassing the 10 cm × 10 cm active area of the screen and the additional 2 cm active area of the control plate located at the center of the beam. Images in this work were obtained using an L/D of 200 and a 0.5 mm thick cadmium sheet placed in the beamline to filter thermal neutrons. Radiographs were captured using an ANDOR iKon-L 936 CCD camera, which was cooled to −90 °C to reduce thermal noise.

3. Results

3.1. SRIM Simulation Results

The spatial resolution of a layered scintillator screen is inherently limited by the thickness of the HDPE (or other high-hydrogen content material) converter due to proton and neutron scattering, as well as the self-attenuation of protons and generated photons. The Stopping and Range of Ions in Matter (SRIM) simulation package of the Transport of Ions in Matter (TRIM) software was used to simulate the penetration depth of protons into an HDPE substrate for neutrons of various energies, assuming a perfectly elastic collision between the neutrons and protons [26]. The results, shown in Figure 2, show that protons with less than 3 MeV energy travel less than 200 µm into HDPE. Therefore, HDPE substrates greater than 200 µm thick will prevent some protons from reaching the scintillator material, implying that an HDPE converter layer thicker than 200 µm will have reduced spatial resolution with no benefit of increased light output when exposed to neutrons ≤3 MeV, assuming exponential attenuation of the neutron beam. Additionally, the penetration depth of protons in a ZnS scintillator material with an assumed density of 60% of theoretically calculated density was simulated in SRIM.
Figure 2 also shows the Bragg curve describing an energy deposition for 3 MeV protons in a ZnS scintillator with 60% of theoretical density. For energies <3 MeV, protons travel less than 200 µm into the HDPE material and 110 µm into the ZnS scintillator. These calculations demonstrate that after some thicknesses of HDPE converter and ZnS scintillator material, self-attenuation will occur in the materials, preventing the protons from creating scintillation photons and potentially degrading the image quality.

3.2. Experimental Results

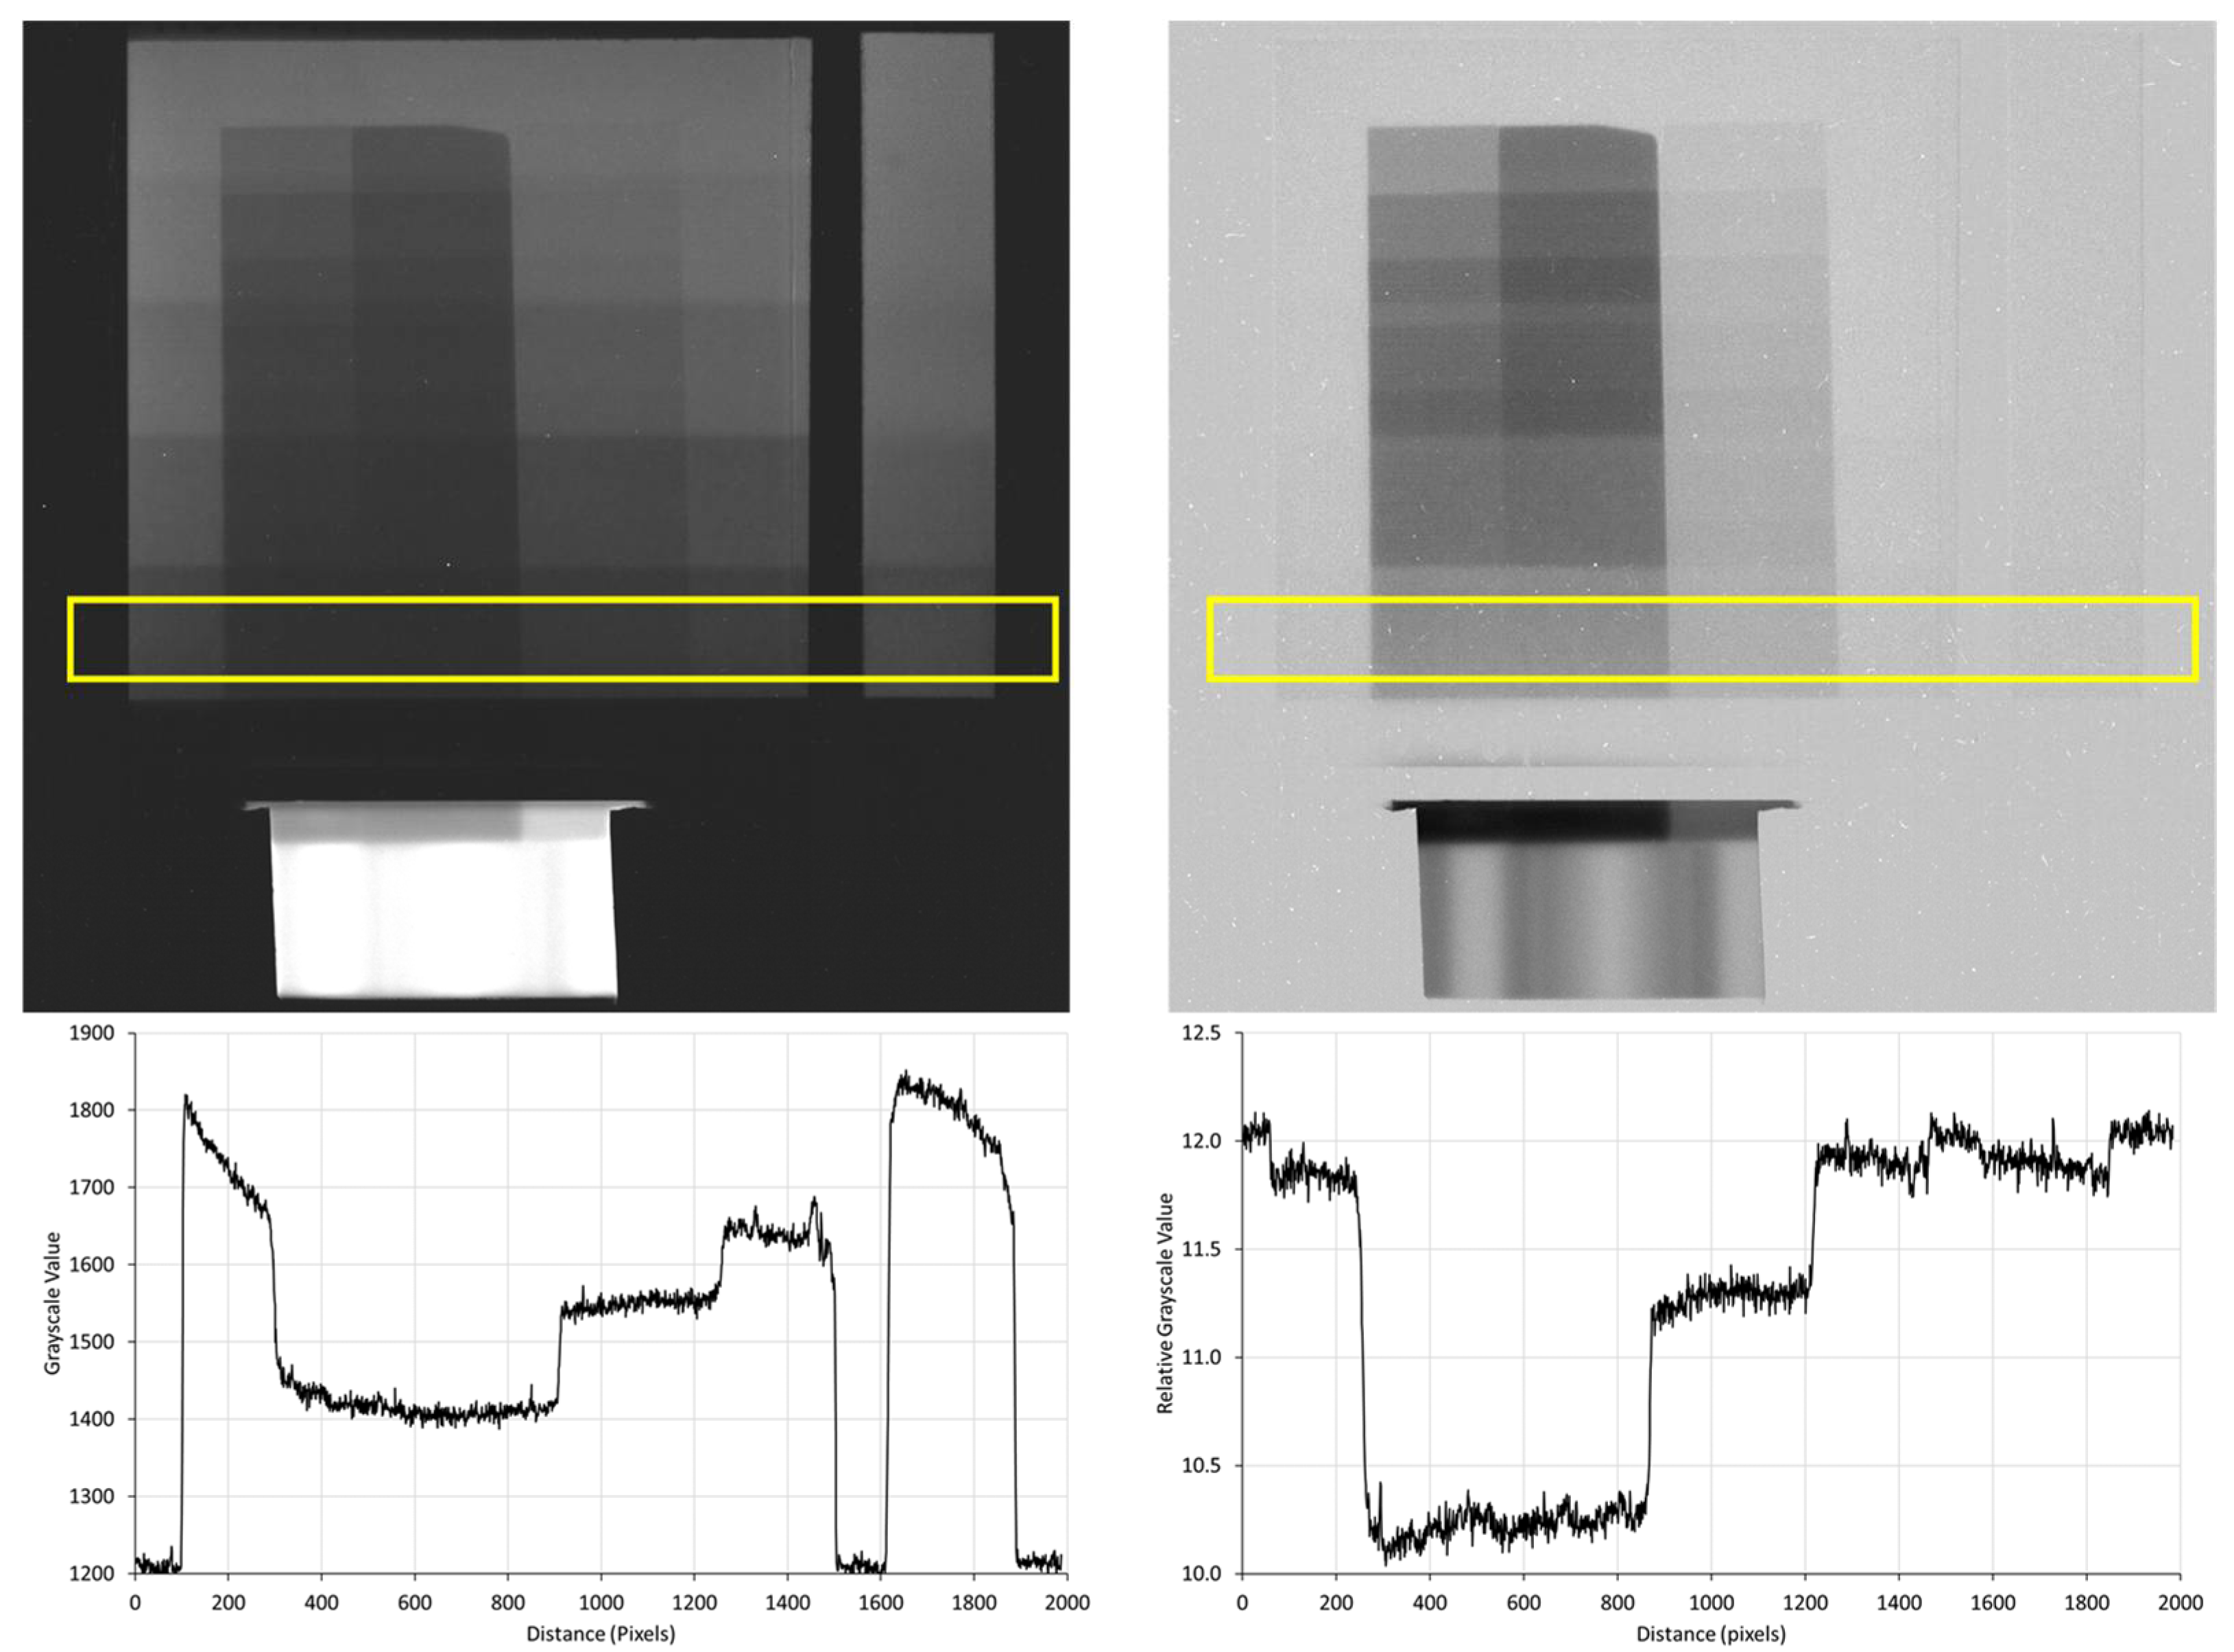
3.2.1. Determination of the Fast Neutron Signal

In a fast neutron beamline, γ-rays are ever-present, which creates a challenge when distinguishing between scintillation photons created by fast neutrons and those created by γ-rays. In this study, a fast neutron signal was observed by utilizing a control plate which consisted of the same scintillator material and thicknesses as on the fast neutron scintillator screen but coated directly on an aluminum substrate without an HDPE neutron converter. The control plate’s lack of HDPE converter causes scintillation photons to be produced by γ-rays only, as opposed to neutrons. After performing open beam and dark image corrections to the radiograph, subtracting the grayscale value of the control plate (γ-ray signal) from the grayscale value measured in the scintillator screen (fast neutron and γ-ray signal) yields the fast neutron signal.
Figure 3 shows an image of the scintillator screen and its corresponding control screen that was taken at NRAD’s NRS neutron beamline. These results indicate a fast neutron signal is present in addition to the γ-ray response for certain scintillator phosphor thicknesses because the layered screen has a higher light output than the control screen. The light outputs of the control and layered screens are also shown, illustrating that the layered screen produces a greater light output for certain thicknesses than the control. At thinner scintillator thicknesses, the fast neutron signal is stronger than the γ-ray signal because the addition of an HDPE converter causes a proton recoil effect in the HDPE layer that produces more photons in the scintillator layer. Thicker scintillator layers provide enough interaction volume for γ-rays, causing the light output from the control screen to be greater than the layered scintillator screen’s light output due to the thicker HDPE attenuating more γ-rays than it produces proton recoils. As the HDPE thickness increases, the light output also increases because either more proton recoils occur, or neutrons are scattered and subsequently produce additional proton recoil interactions.
The proton recoil range for neutrons <3 MeV is ≤200 μm, so HDPE thicknesses greater than this should theoretically produce a diminished signal because the HDPE causes self-attenuation of the recoil protons produced in the front of the HDPE layer. However, results in Figure 3c suggest that light output continues to increase in HDPE layers greater than 200 μm, even through 3 mm, and at an increasing rate. Additional study is necessary to determine if this additional light output is caused by a buildup of scattered neutrons, subsequent recoil protons, and ionization. This buildup effect could be a source of unsharpness in the image.

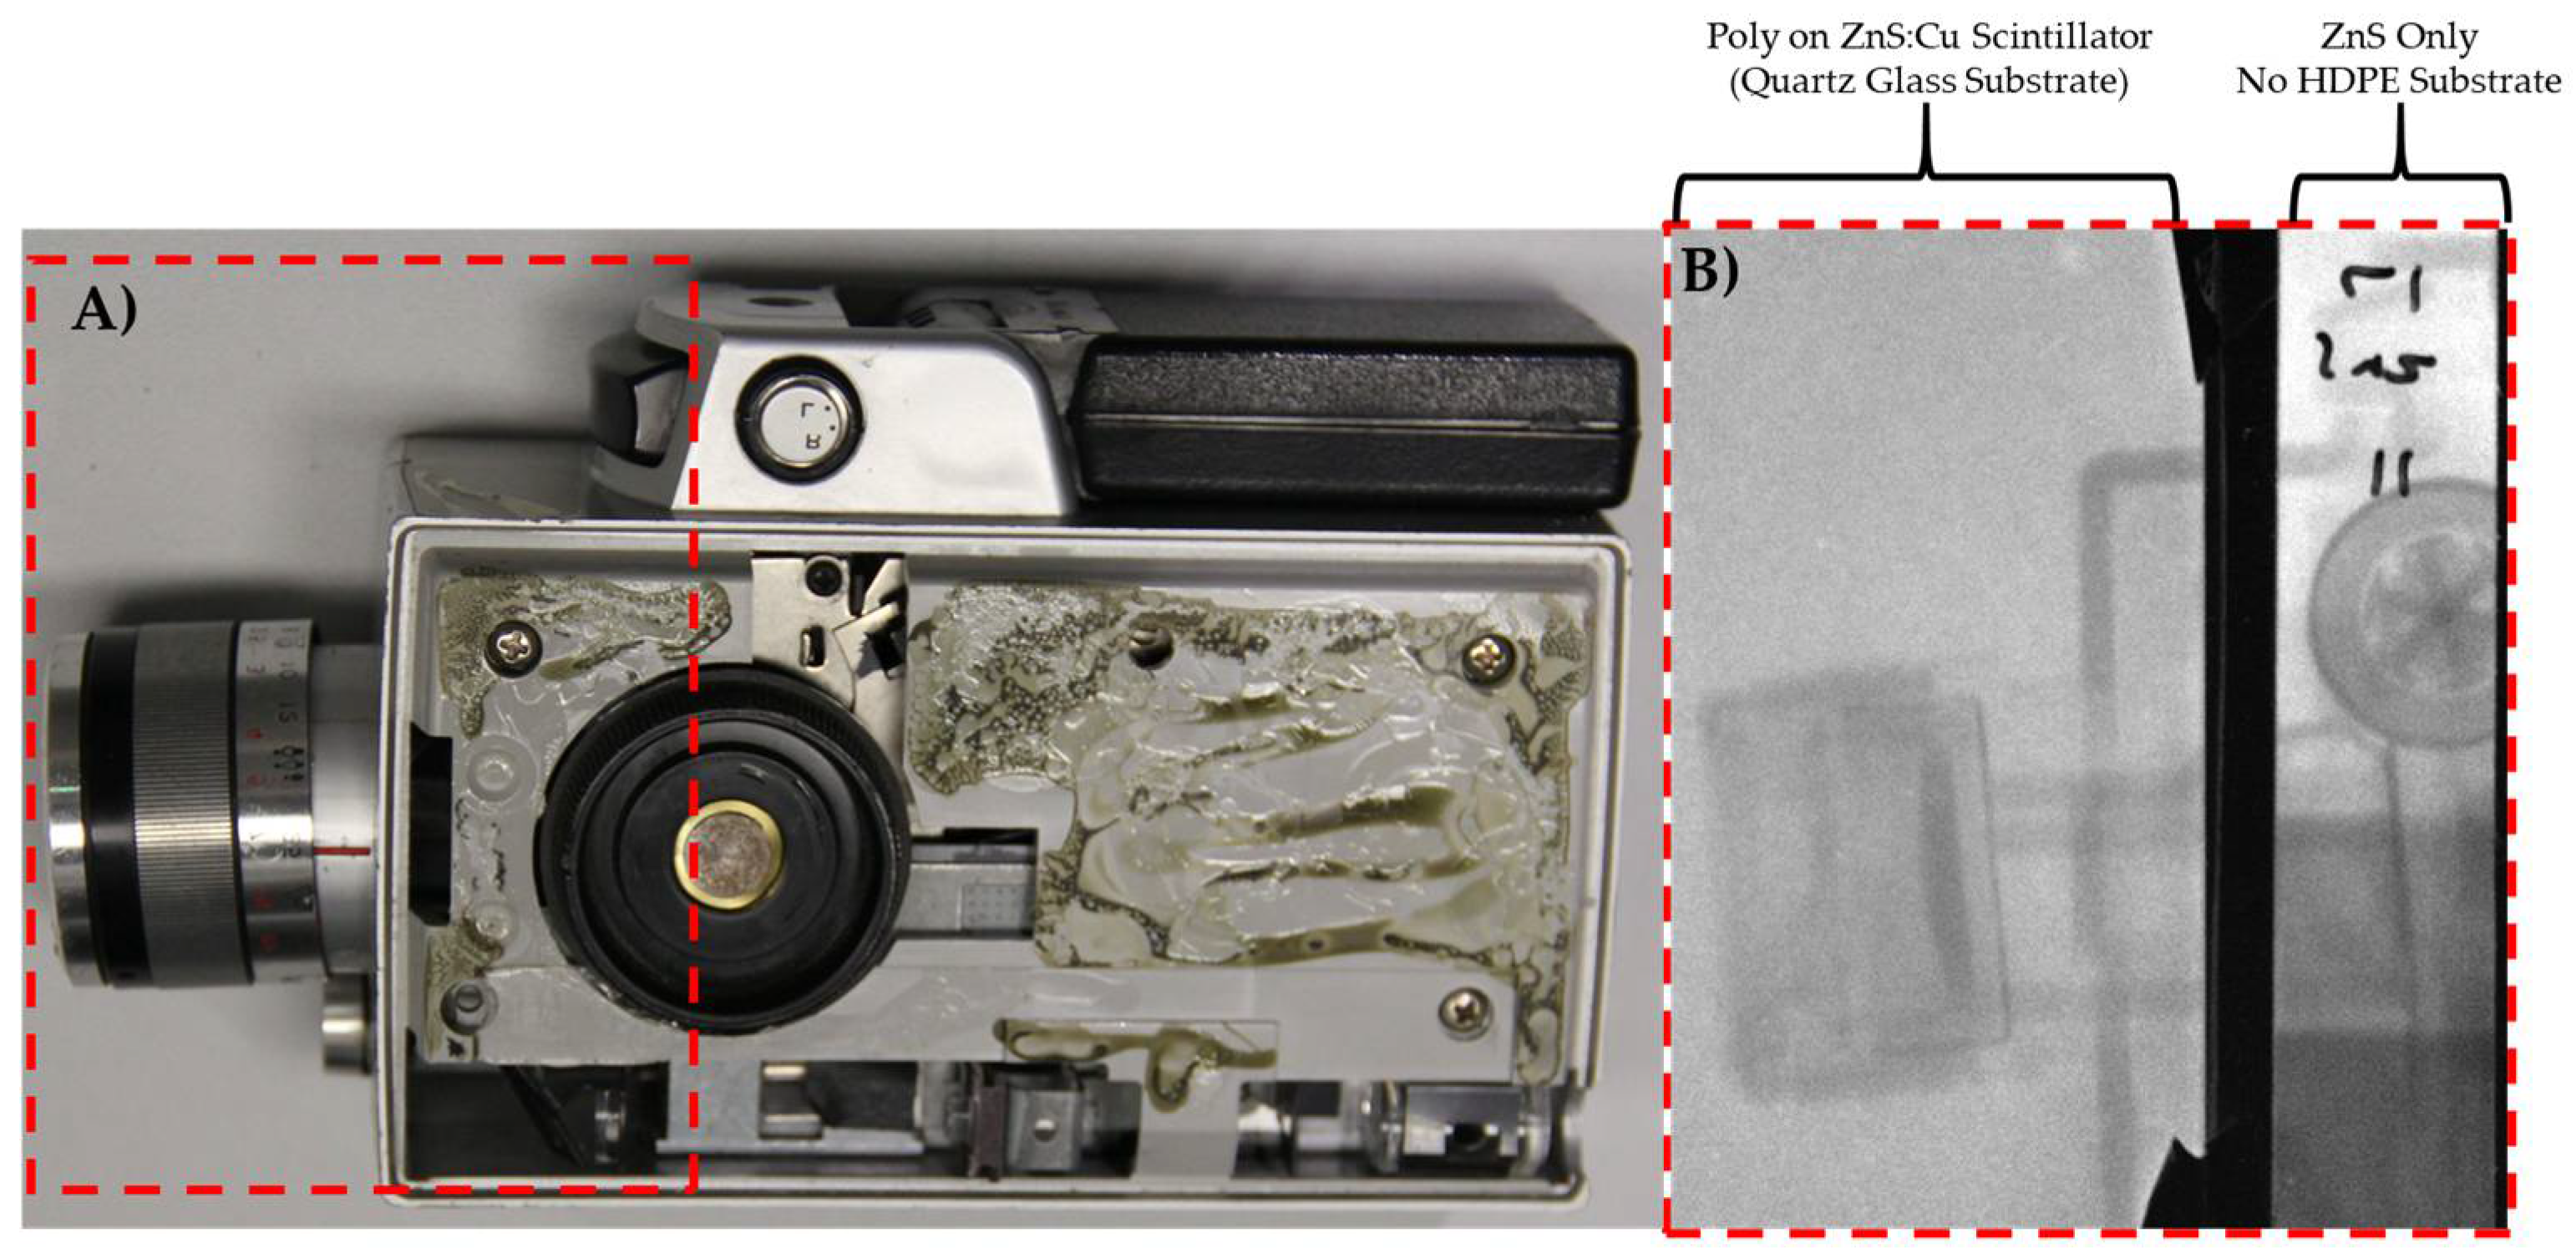
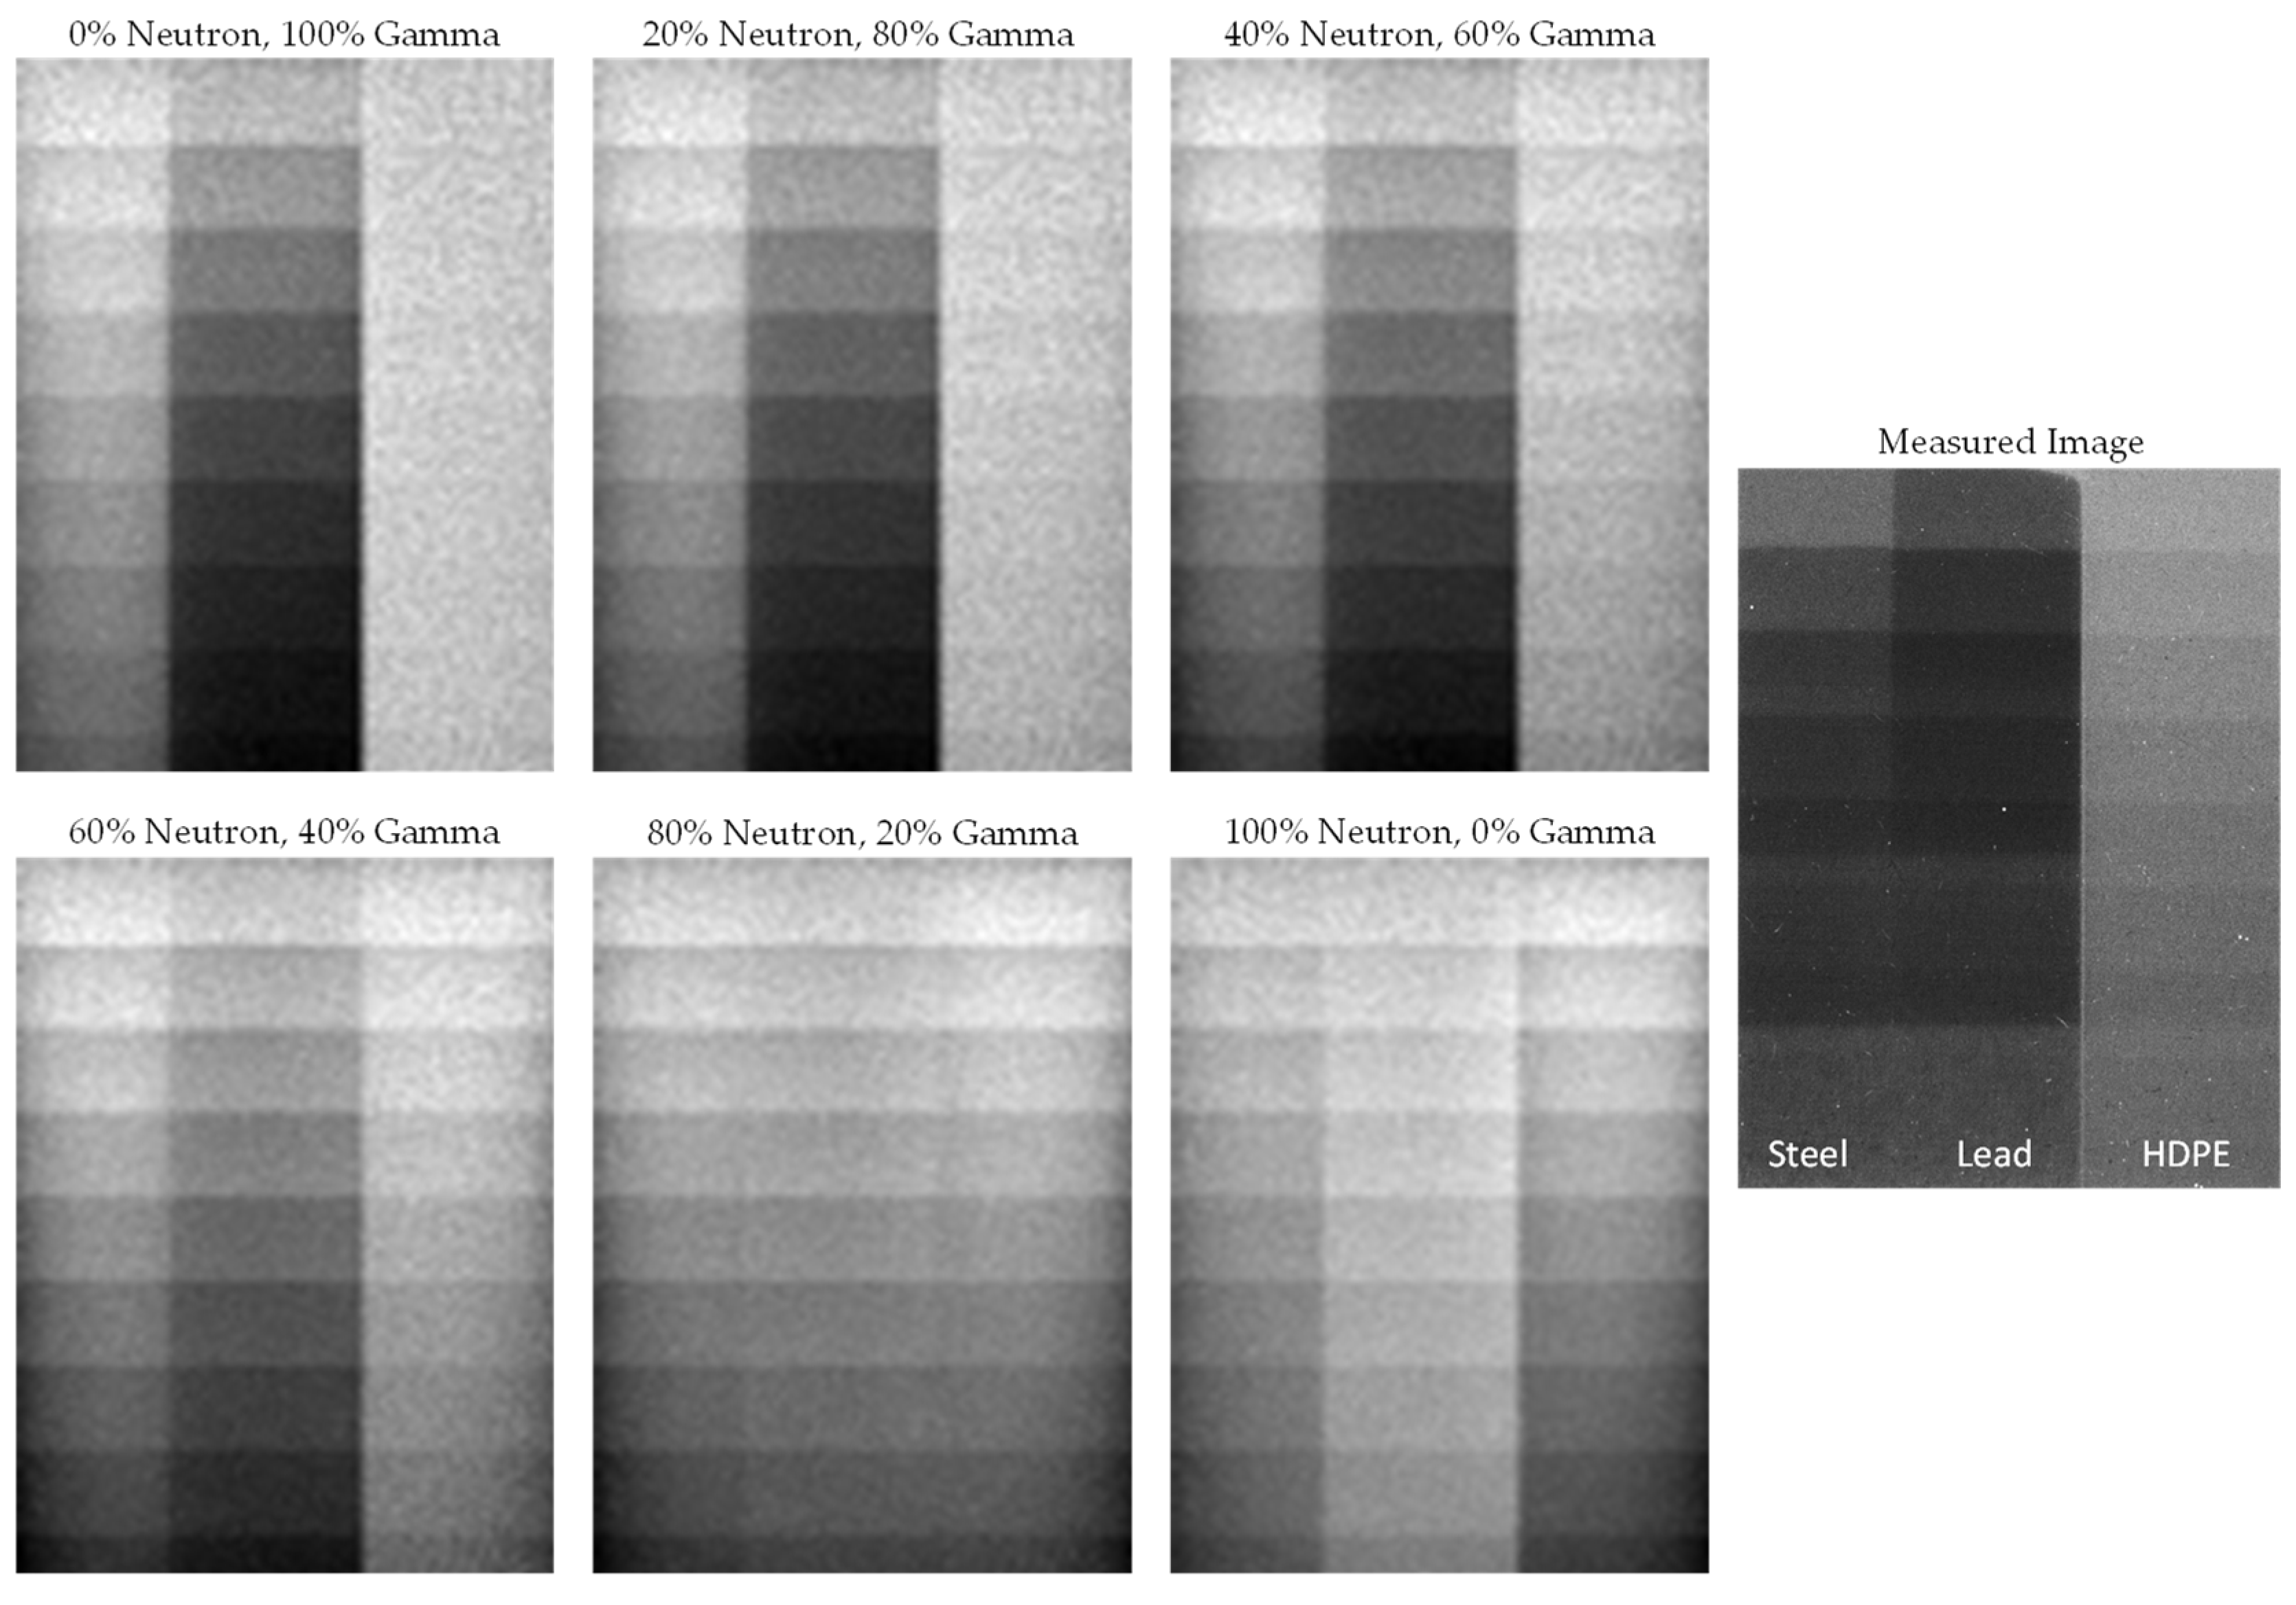
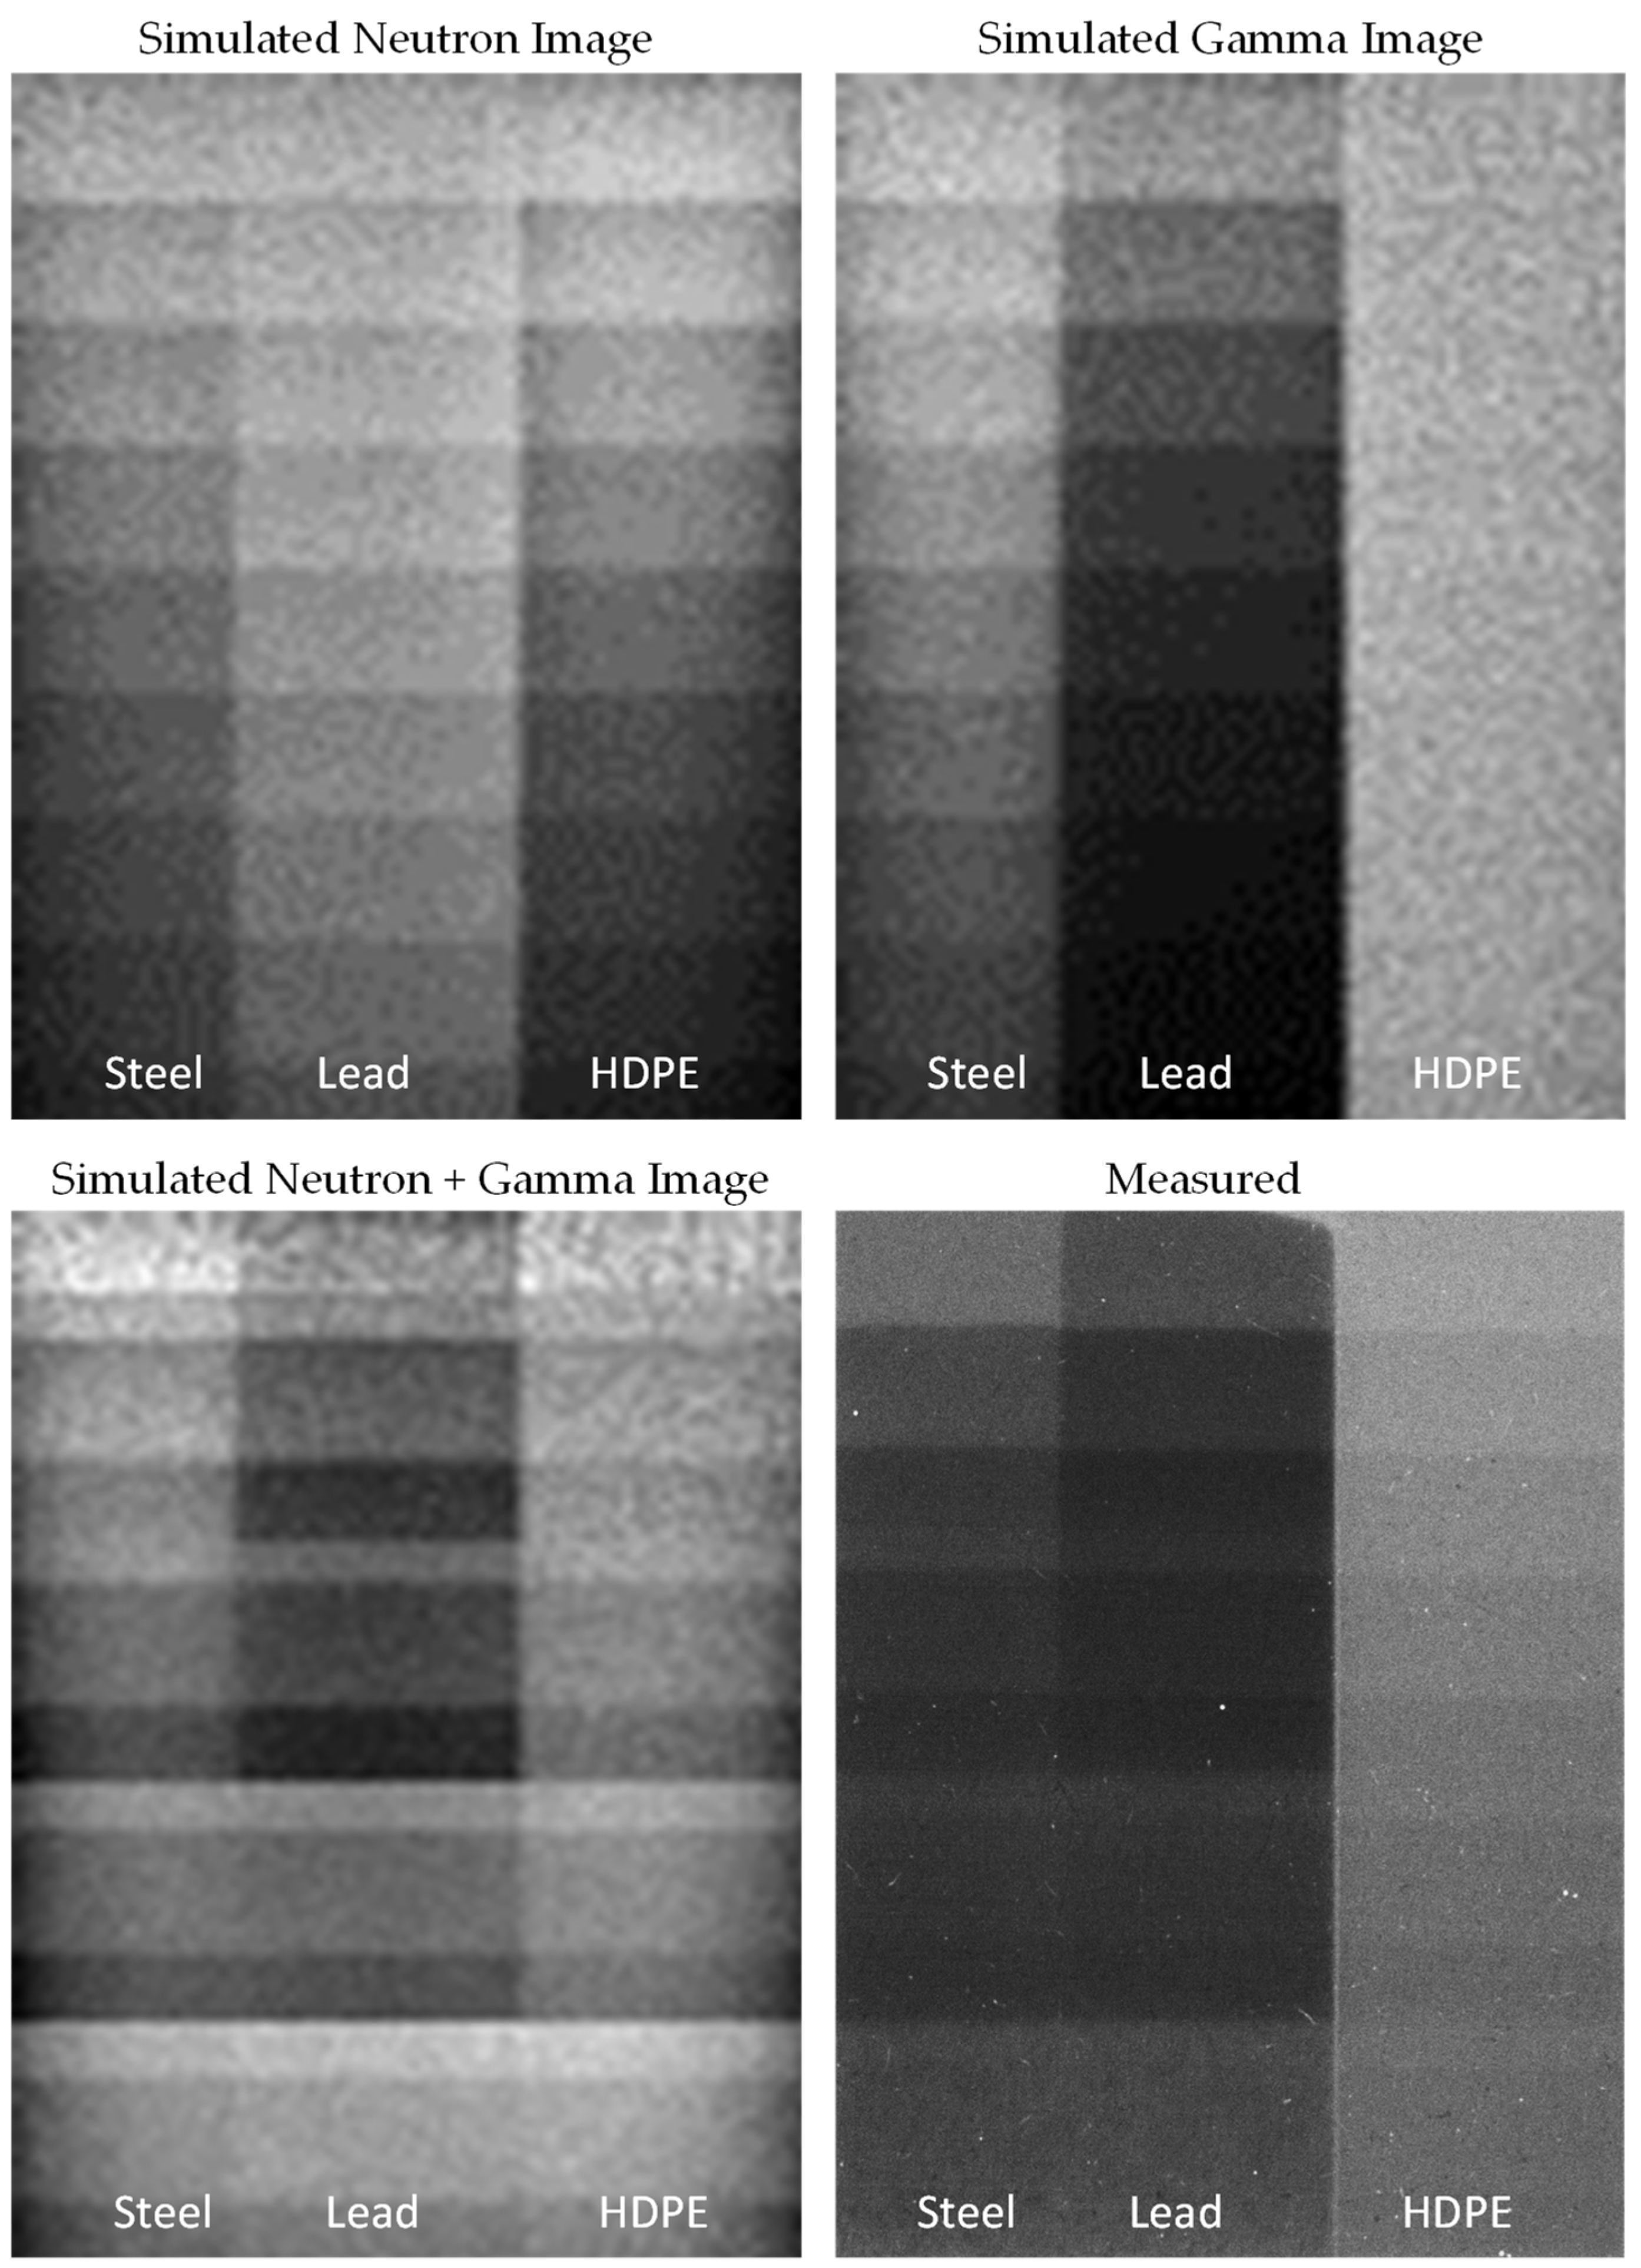
3.2.2. Imaging with Layered Fast Neutron Screens

Neutron radiographs were taken with the double-wedged fast neutron scintillator screens at FRM II’s NECTAR beamline. As has been done previously to test fast neutrons [25], step wedges of steel, lead, and polyethylene were used to differentiate between photons created by γ-rays and those produced from fast neutrons, as each element attenuates fast neutrons and γ-rays differently. A common homogeneous fast neutron plastic scintillator screen was included in the field of view to allow for a comparison with the layered scintillator screen.
Figure 4 shows a radiograph of steel, lead, and polyethylene step wedges taken with the layered fast neutron scintillator screen. The control screen, which contains no HDPE converter material, is visible on the right side of the field of view (FOV). A 4-mm thick common plastic (mixed converter and scintillator) fast neutron scintillator was placed at the bottom of the FOV. The plot at the bottom of the figure shows the grayscale values of a selection of the radiograph. The control plate displays the highest light output, suggesting that there is a considerable γ-ray content in the beamline. This makes it challenging to differentiate between a neutron image and a γ-ray image.
A scintillator screen consisting of an HDPE layer placed in contact with ZnS phosphor deposited on quartz glass was used to image a sample object (analog Super-8 film camera). The quartz substrate was used instead of aluminum because it is optically clear, allowing this layered setup to be viewed through the substrate. A control screen consisting of only scintillator material deposited on the quartz glass was also used to quantify the γ-ray contribution to the image. The resulting radiograph is displayed in Figure 5. The sample is clearly visible in both the fast neutron scintillator and the control screen. This implies that there is a large γ-ray component in the radiograph and that this radiograph includes contributions from both fast neutrons and γ-rays present in the beam.

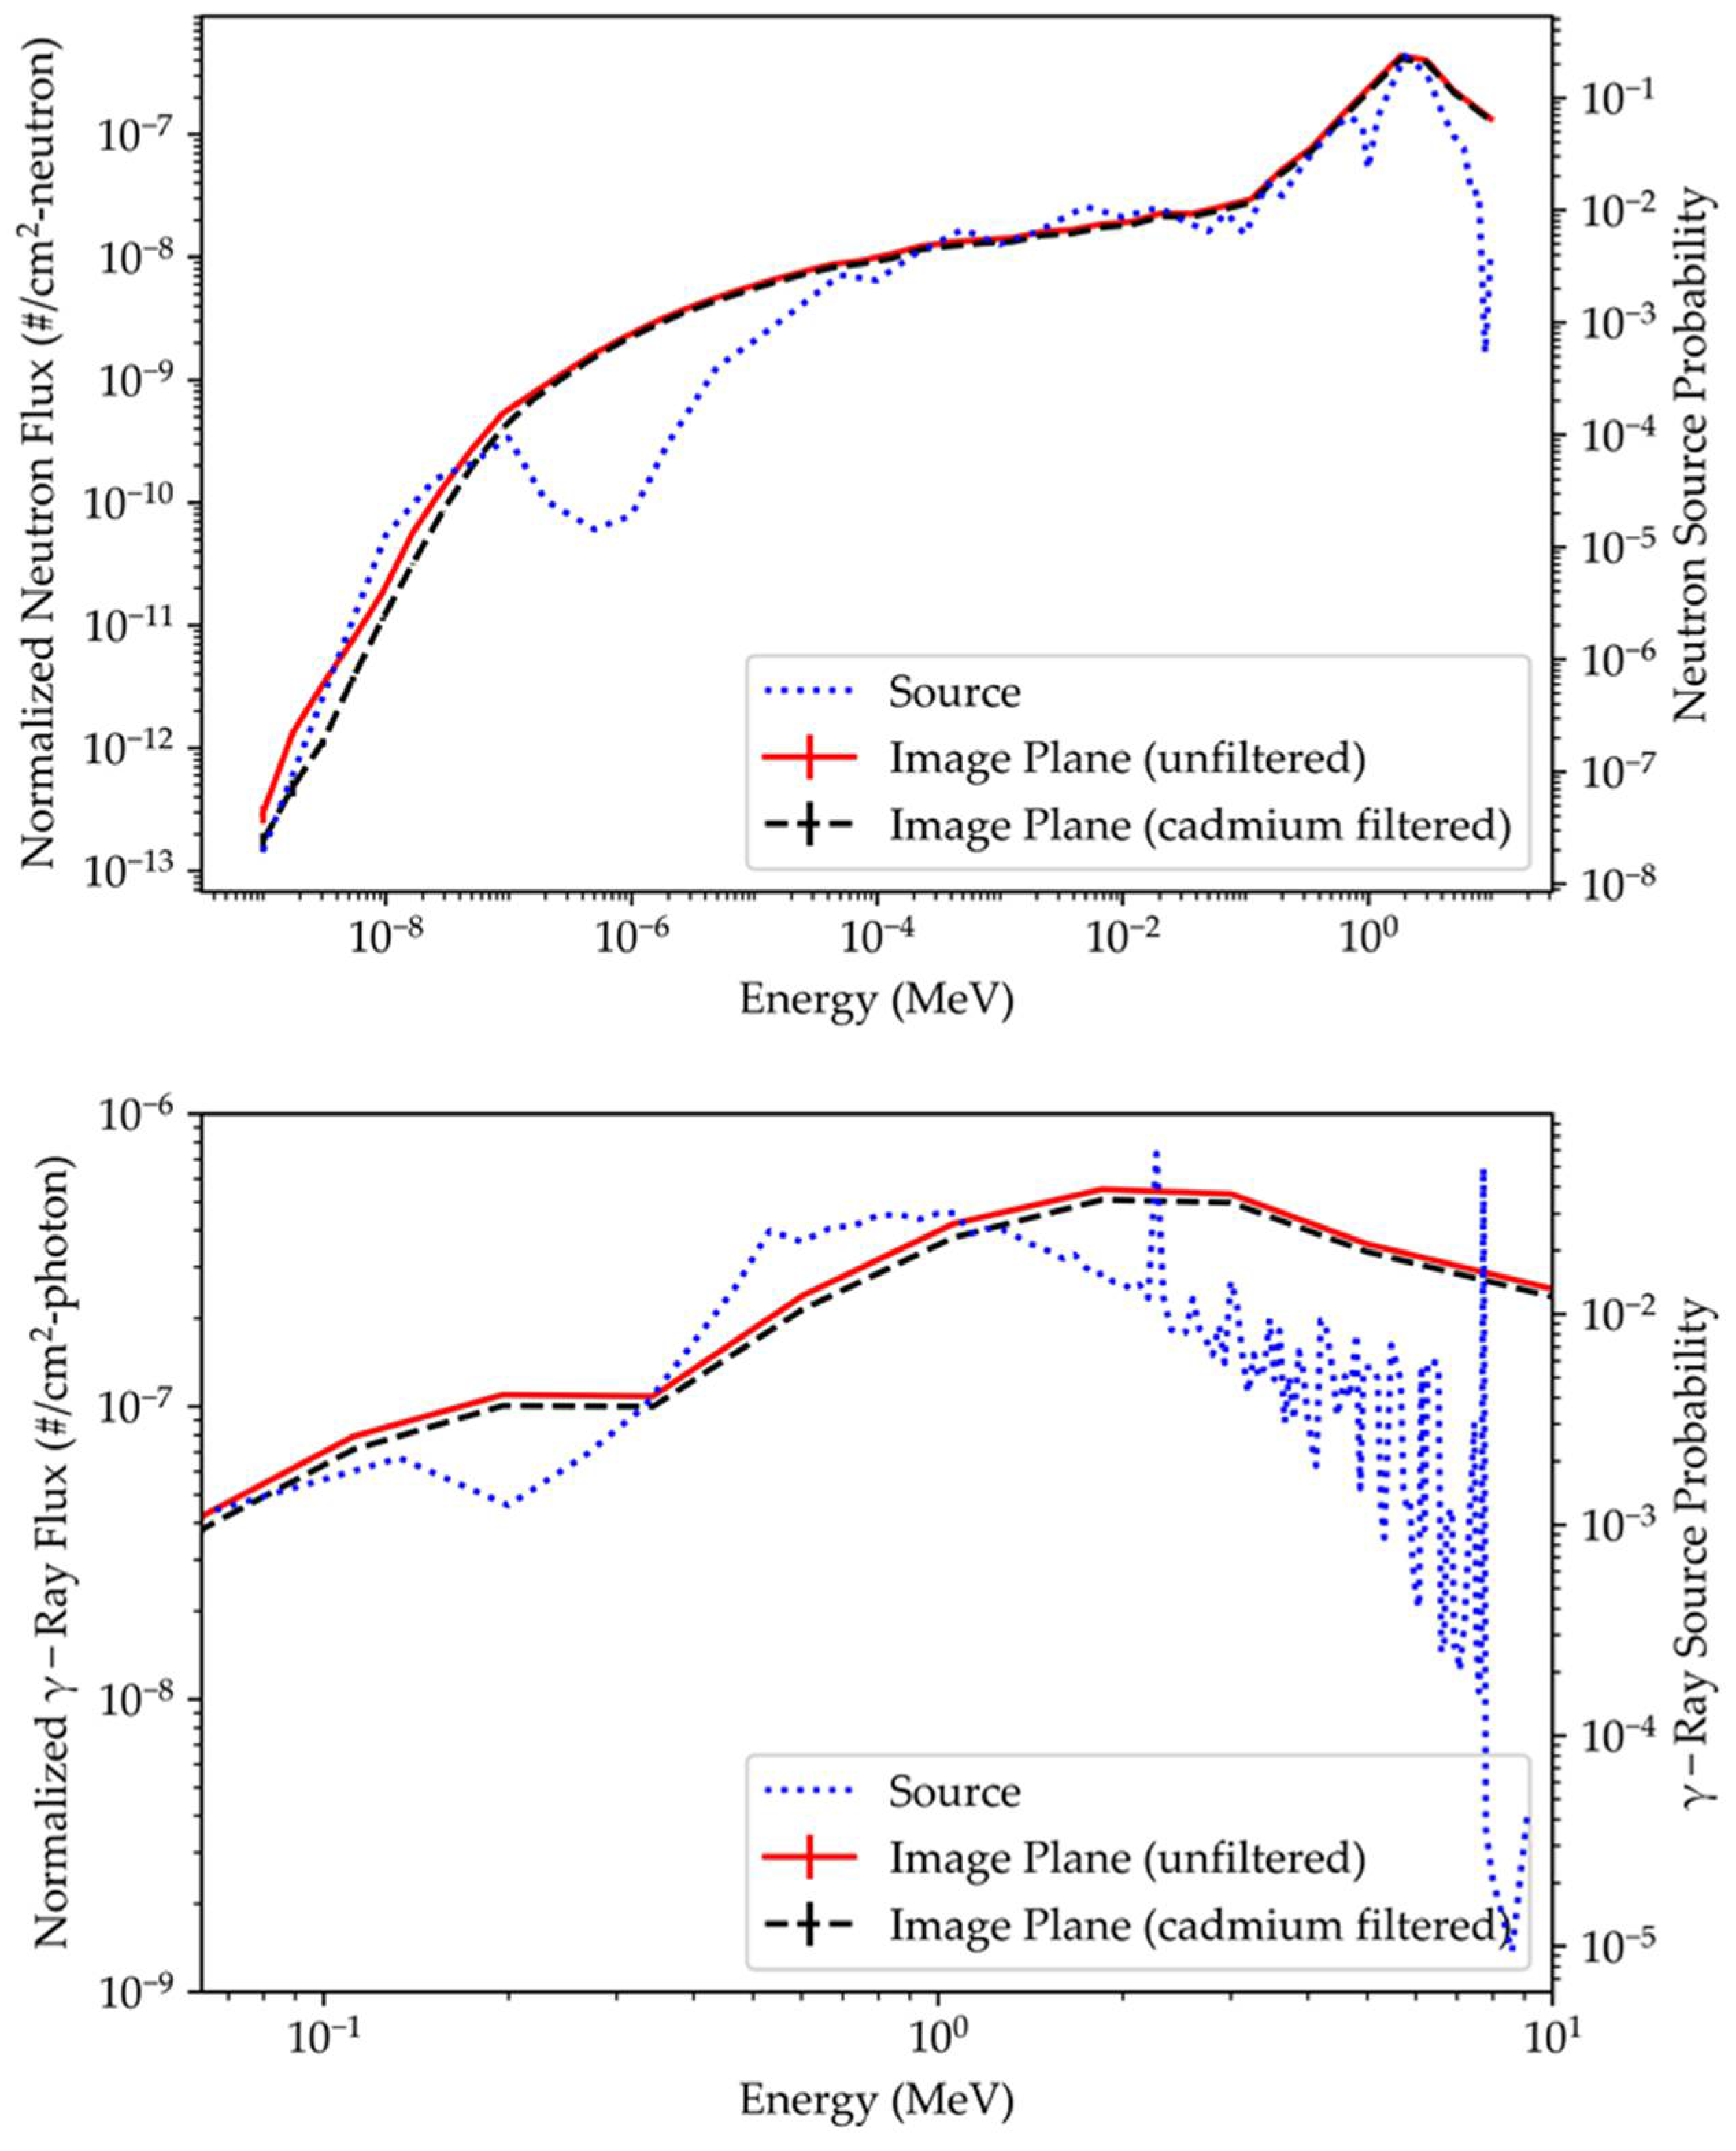
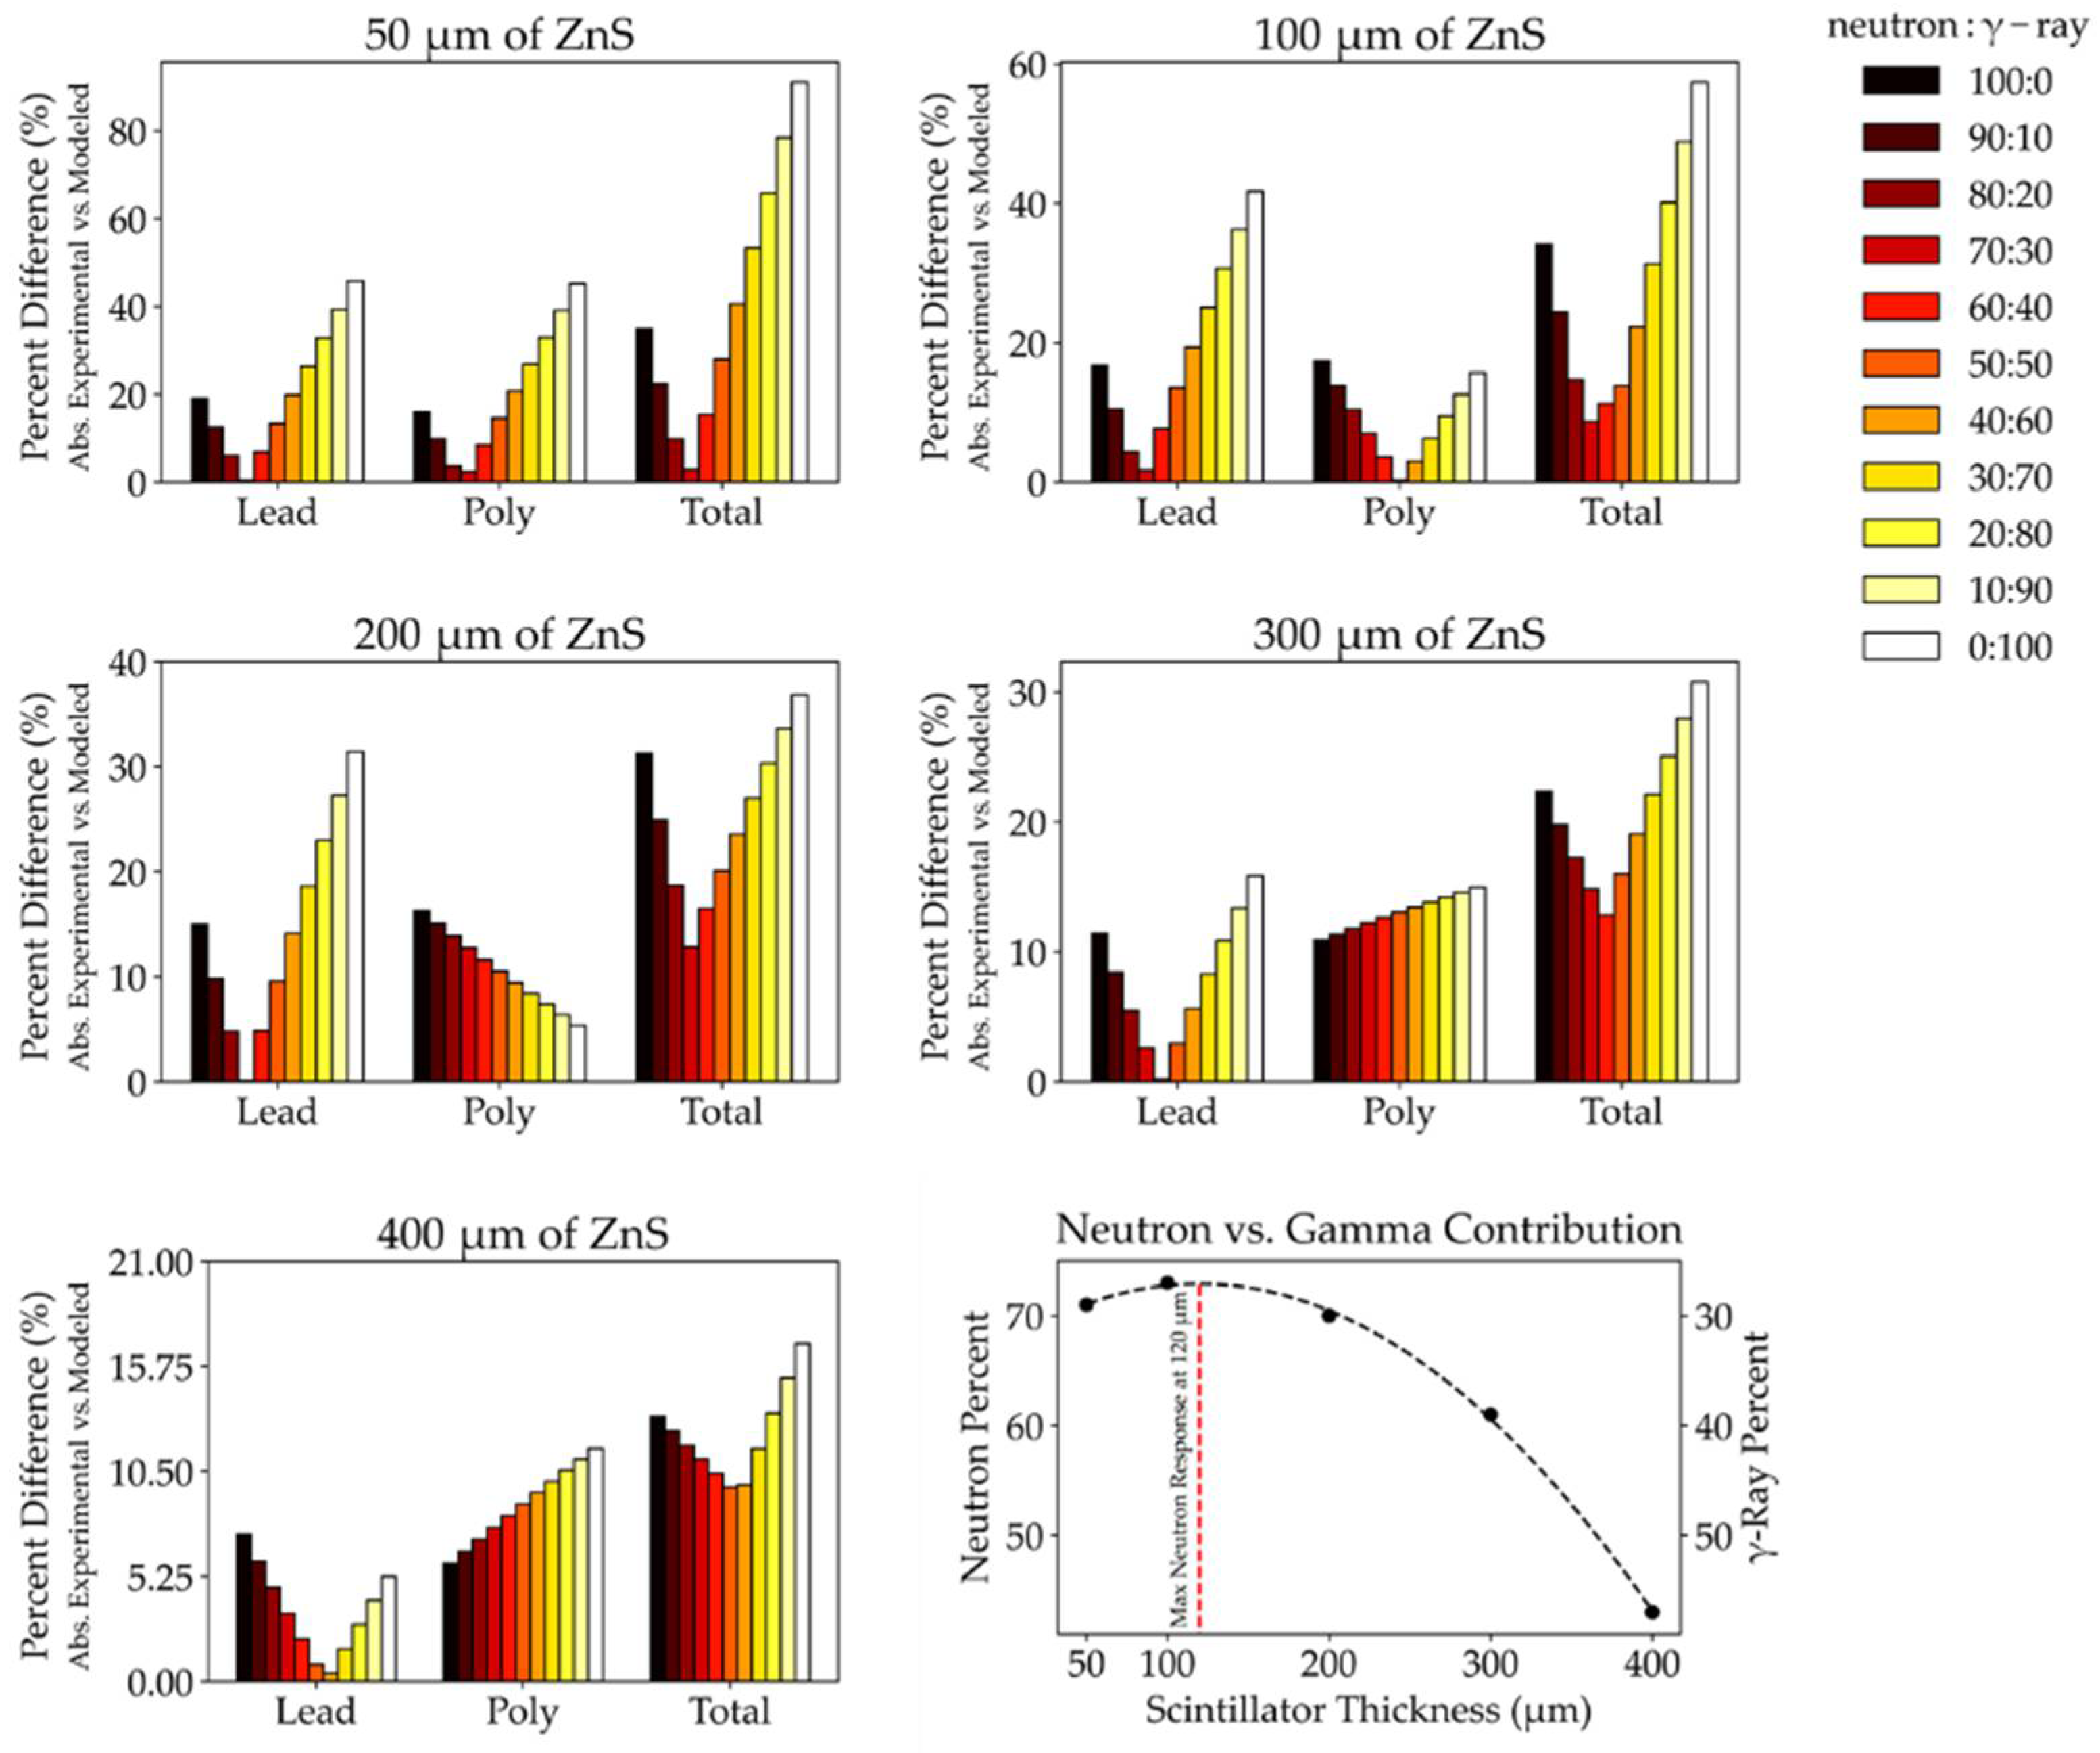
3.3. MCNP Simulation Results

Experimental results exhibit strong contributions from both neutrons and γ-rays. However, the neutron and γ-ray contributions and their effects on the resulting contrast cannot be separated and directly quantified from experimentally measured radiographs. For both neutrons and γ-rays, there are multiple conversion factors for each reaction between particles impinging on the scintillator screen and the assignment of grayscale values produced by the camera. These factors include, among others, detection efficiency as a function of energy, conversion into charged particles, deposition of these particles into the ZnS phosphor, conversion of this energy deposition into light, light emission from the phosphor, and light collection by the camera sensor. These are all different for neutrons and γ-rays, and some of these factors are energy-dependent. Furthermore, some of these factors change for each screen arrangement (e.g., compositions, thicknesses), which further complicates experimental determination.
Therefore, for a given scintillator screen and measurement setup (e.g., HDPE thickness, ZnS thickness), the factors from neutron or γ-ray flux at the image plane to grayscale values of a final image can be represented as an unknown scalar quantity, one for neutrons and another for γ-rays. Radiation transport simulations can be employed to attempt to determine these factors by comparing the contrast exhibited for different materials between experimentally measured radiographs with unknown γ-ray and neutron components to simulated radiographs with known γ-ray and neutron components. First, we have an experimentally measured radiograph of a sample (e.g., step wedges of three materials). Second, the neutron and γ-ray components of the NECTAR beam and the sample are modeled with MCNP to calculate separate simulated radiographs from the γ-rays and neutrons. The simulated radiographs are then combined with various ratios of the two. The correct ratio of simulated neutron and γ-ray radiographs is the ratio that exhibits similar contrast to the experimental measurement.
MCNP 6.2 simulations modeled the performance of the fast neutron scintillator screens and approximated the respective γ-ray and fast neutron contributions to the images obtained at the NECTAR beamline. A range of simulated radiographs was produced with the neutron and γ-ray contributions varying between 0% and 100% for each. The resulting simulated radiographs were then qualitatively and quantitatively compared to the experimentally measured radiographs.
The beamline model, provided by FRM II, was modified to include three step wedges, one each of medium carbon steel (composition from (PNNL-15870, Rev. 2/200-DMAMC-128170)), lead, and polyethylene. The material definitions used ENDF B-VII (.70c) cross-section libraries. Simulated radiographs were derived from FMESH tallies with 1 mm by 1 mm bin size, with separate tallies for both neutrons and γ-rays (photons). The photon tally counted particles with energies above 5.304 eV because this is the work function energy of zinc sulfide and accounts for the minimum energy needed for electrons to be taken in by the material. The ionization energy of hydrogen, 13.6 eV, was set as the cutoff for neutrons. INL’s high performance computing (HPC) resources were used to execute the MCNP simulations. The simulations ran more than 1 × 10¹⁰ particles, which produced a maximum uncertainty of 6.7% for the neutron and photon FMESH tallies. The experimentally measured image was scaled to match the resolution (109 × 82 bins) of the simulated image by averaging neighboring pixels to enable comparison. Figure 6 shows the simulated neutron (cadmium filtered and bare) and γ-ray fluxes at the image plane.
Neutron and γ-ray step-wedge images and open beam images were simulated separately to determine the contribution each would have to the observed experimental image, and a combined image resulted from a sum of the neutron and γ-ray images with an MCNP simulated open beam correction. The method for this is shown in Equation (1) where the neutron and γ-ray portions are open beam corrected individually. The scaling factor (SF) is included to change the proportions of the neutron and γ-ray components to determine how much of each component is needed to best match the experimental image.
Modeled   Image = Neutron Open   Beam Neutron + SF γ Open   Beam γ  
The proportion of γ-ray and neutron components of the simulated image was adjusted to match the contrast between the three materials exhibited in the experimentally measured radiograph. The histograms of the resulting simulated radiographs were scaled to enable a comparison with the measured radiograph. The initial scaling matched the mean gray values of the experimental and modeled images. A secondary scaling factor was applied to match the steel portion of the images for each tested neutron: γ-ray ratio since it attenuates both neutron and γ-rays, whereas the lead strongly attenuates γ-rays and polyethylene strongly attenuates neutrons. The neutron and γ-ray response of each scintillator varied with the thickness of the ZnS scintillator, which prompted gray value scaling of individual steps (steps 1, 2, 4, 6, and 8 for the scintillator thicknesses of 400, 300, 200, 100, and 50 μm, respectively).
Simulated images were first qualitatively compared to the measured image by simulating images consisting of both neutron and γ-ray components. The simulated images, varying in 20% increments from 0:100 to 100:0 (%neutron:%γ-ray), were compared with the measured image. This comparison, shown in Figure 7, allows for a visual determination of the amount of neutron and γ-ray contributions to the measured image.
Different portions of the screen will vary in their response to neutrons and γ-rays due to the different thicknesses of the ZnS scintillator and HDPE substrate throughout the screen. Therefore, each region of the screen must be assessed individually.
The results were also quantitatively analyzed to confirm the qualitative analysis. Plots of the absolute value of the percent differences with various neutron:γ-ray proportions for each of the scintillator thicknesses are displayed in Figure 8. Using the total percent difference as the metric for modeled image accuracy, as the scintillator thickness increased, the γ-ray portion of the image increased. The 50 μm thick scintillator portion showed a mostly neutron image and the 400 μm thick scintillator portion showed a combined neutron:γ-ray image comprised of a 55% γ-ray response. Plotting the minimum total percent difference as a function of scintillator thickness (Figure 8) shows that the maximum neutron response occurs in a scintillator of 120 μm thickness.
The MCNP results are displayed in Figure 9 along with the experimental data. While the combined neutron/γ-ray modeled radiograph looks similar to the experimental image, the plots in Figure 8 demonstrate that the primary contributor (neutrons or γ-rays) to the image is dependent on the thickness of the scintillator. The simulated neutron and γ-ray radiographs show that neither one matches the experimental radiograph separately, but rather that the experimentally measured radiograph is a mixture of both γ-ray and neutron signals. However, the grayscale values in the simulated and measured radiographs do not show as strong of a correlation between the HDPE thickness as they do for the scintillator thickness.

4. Discussion

The work explores the possibility of using a layered fast neutron scintillator screen to improve spatial resolution at the cost of light output when compared to homogeneously-mixed plastic scintillators. The double-wedged screen approach allows for the optimum thickness of scintillator phosphor and neutron converter layers to be determined in a single measurement. As mentioned previously, experimental results showed that light yield increases beyond the theoretically predicted range of a recoil proton, suggesting that an incident fast neutron and initial recoil proton may be causing a buildup of scattered neutrons, subsequent recoil protons, and ionization. The ZnS scintillator layer contains less than 5 wt% organic binder, which could be a source of additional proton recoil reactions within the scintillator layer itself. However, at less than 5 wt%, proton recoil reactions within the scintillator layer would be minor compared with those generated within the HDPE substrate. The image of the Super-8 film camera suggests that some neutron interactions may be occurring in the ZnS scintillator material itself, without an HDPE substrate as a converter layer. Additional testing is necessary to discern if the ZnS scintillator material contributes a significant neutron signal to the radiograph.
Both experimentally measured and simulated results indicate a large γ-ray component in the radiographs. Modeling work approximates the γ-ray contribution to comprise the majority of the image, which is contrary to previous work. Future fast neutron imaging experiments must carefully quantify the γ-ray component of the radiation source and separate its image contribution from that of the fast neutrons. This may be done by either filtering the source appropriately to maximize fast neutron content and minimize γ-ray content of the beam, or by separating the fast neutron and γ-ray components in post-processing, such as with event-mode imaging [27].
Once γ-ray and neutron components can be discriminated, the methodology presented in this work can be used to further study the fundamental relationship between recoil protons and layered fast neutron scintillator screen light output. Ultimately, this will enable screen layer thickness optimization, which may improve spatial resolution.

Author Contributions

Conceptualization, W.C., A.C., B.S., S.C. and A.L.; methodology, W.C., A.C. and B.S.; formal analysis, W.C., A.C. and J.M.; investigation, W.C. and B.S.; writing—original draft preparation, W.C.; writing—review and editing, W.C., A.C., B.S., J.M., A.L. and S.C.; project administration, A.C.; funding acquisition, W.C. and A.C.; sensor fabrication, S.C. All authors have read and agreed to the published version of the manuscript.

Funding

Work funded through the INL Laboratory Directed Research & Development (LDRD) Program under DOE Idaho Operations Office Contract DE-AC07-05ID14517. LDRD Project ID# 20A1047-029FP. This research made use of Idaho National Laboratory computing resources, which are supported by the Office of Nuclear Energy of the U.S. Department of Energy and the Nuclear Science User Facilities under Contract No. DE-AC07-05ID14517.

Institutional Review Board Statement

Not applicable.

Informed Consent Statement

Not applicable.

Data Availability Statement

Not applicable.

Acknowledgments

The authors would like to thank the staff of Idaho National Laboratory’s Neutron Radiography (NRAD) Reactor and Technical University of Munich’s Heinz Maier-Leibnitz Zentrum (FRM II) Reactor for their help in operating the neutron beamlines. Special thanks to Rudolf Schuetz for his support of the authors while working with FRM II’s NECTAR instrument. This work is based upon experiments performed with the NECTAR instrument operated by FRM II at the Heinz Maier-Leibnitz Zentrum (MLZ), Garching, Germany. This research made use of the High Performance Computing Center resources at Idaho National Laboratory, which is supported by the Office of Nuclear Energy of the U.S. Department of Energy and the Nuclear Science User Facilities under Contract No. DE-AC07-05ID14517.

Conflicts of Interest

The authors declare no conflict of interest.

References

  1. Österlund, M.; Blomgren, J.; Donnard, J.; Flodin, A.; Gustafsson, J.; Hayashi, M.; Mermod, P.; Nilsson, L.; Pomp, S.; Wallin, L.; et al. Tomography of canisters for spent nuclear fuel. Proc. Sci. 2006, 25, 030. [Google Scholar] [CrossRef] [Green Version]
  2. Craft, A.E.; Wachs, D.M.; Okuniewski, M.A.; Chichester, D.L.; Williams, W.J.; Papaioannou, G.C.; Smolinski, A.T. Neutron Radiography of Irradiated Nuclear Fuel at Idaho National Laboratory. Phys. Procedia 2015, 69, 483–490. [Google Scholar] [CrossRef] [Green Version]
  3. Craft, A.E.; Barton, J.P. Applications of Neutron Radiography for the Nuclear Power Industry. Phys. Procedia 2017, 88, 73–80. [Google Scholar] [CrossRef]
  4. Eberhardt, J.E.; Rainey, S.; Stevens, R.J.; Sowerby, B.D.; Tickner, J.R. Fast neutron radiography scanner for the detection of contraband in air cargo containers. Appl. Radiat. Isot. 2005, 63, 179–188. [Google Scholar] [CrossRef]
  5. Buffler, A.; Tickner, J. Detecting contraband using neutrons: Challenges and future directions. Radiat. Meas. 2010, 45, 1186–1192. [Google Scholar] [CrossRef]
  6. Dangendorf, V.; Kersten, C.; Laczko, G.; Vartsky, D.; Mor, I.; Goldberg, M.B.; Feldman, G.; Breskin, A.; Chechik, R.; Jagutzkyd, O.; et al. Detectors for energy-resolved fast-neutron imaging. Nucl. Instrum. Methods Phys. Res. Sect. A Accel. Spectrometers Detect. Assoc. Equip. 2004, 535, 93–97. [Google Scholar] [CrossRef]
  7. MacGillivray, G.M. Imaging with neutrons: The other penetrating radiation. Penetrating Radiat. Syst. Appl. II 2000, 4142, 48. [Google Scholar]
  8. Fujine, S.; Yoneda, K.; Yoshii, K.; Kamata, M.; Tamaki, M.; Ohkubo, K.; Ikeda, Y.; Kobayashi, H. Development of imaging techniques for fast neutron radiography in Japan. Nucl. Instrum. Methods Phys. Res. Sect. A Accel. Spectrometers Detect. Assoc. Equip. 1999, 424, 190–199. [Google Scholar] [CrossRef]
  9. Bravar, U.; Bruillard, P.J.; Flückiger, E.O.; Macri, J.R.; McConnell, M.L.; Moser, M.R.; Ryan, J.M.; Woolf, R.S. Design and testing of a position-sensitive plastic scintillator detector for fast neutron imaging. IEEE Trans. Nucl. Sci. 2006, 53, 3894–3903. [Google Scholar] [CrossRef]
  10. Seki, Y.; Taketani, A.; Hashiguchi, T.; Wang, S.; Mizuta, M.; Wakabayashi, Y.; Otake, Y.; Yamagata, Y.; Baba, H.; Kino, K.; et al. Fast neutron transmission imaging of the interior of large-scale concrete structures using a newly developed pixel-type detector. Nucl. Instrum. Methods Phys. Res. Sect. A Accel. Spectrometers Detect. Assoc. Equip. 2017, 870, 148–155. [Google Scholar] [CrossRef]
  11. Bertrand, G.H.V.; Hamel, M.; Normand, S.; Sguerra, F. Pulse shape discrimination between (fast or thermal) neutrons and gamma rays with plastic scintillators: State of the art. Nucl. Instrum. Methods Phys. Res. Sect. A Accel. Spectrometers Detect. Assoc. Equip. 2015, 776, 114–128. [Google Scholar] [CrossRef]
  12. Brooks, F.D. A scintillation counter with neutron and gamma-ray discriminators. Nucl. Instrum. Methods 1959, 4, 151–163. [Google Scholar] [CrossRef]
  13. Normand, S.; Mouanda, B.; Haan, S.; Louvel, M. Discrimination methods between neutron and gamma rays for boron loaded plastic scintillators. Nucl. Instrum. Methods Phys. Res. Sect. A Accel. Spectrometers Detect. Assoc. Equip. 2002, 484, 342–350. [Google Scholar] [CrossRef]
  14. Feng, P.L.; Villone, J.; Hattar, K.; Mrowka, S.; Wong, B.M.; Allendorf, M.D.; Patrick Doty, F. Spectral-and pulse-shape discrimination in triplet-harvesting plastic scintillators. IEEE Trans. Nucl. Sci. 2012, 59, 3312–3319. [Google Scholar] [CrossRef]
  15. Lim, A.; Mahl, A.; Latta, J.; Yemam, H.A.; Greife, U.; Sellinger, A. Plastic scintillators with efficient light output and pulse shape discrimination produced via photoinitiated polymerization. J. Appl. Polym. Sci. 2019, 136, 47381. [Google Scholar] [CrossRef]
  16. Rahmanian, H.; Ambrosi, R.M.; Watterson, J.I.W. Optimisation of resolution in accelerator-based fast neutron radiography. Nucl. Instrum. Methods Phys. Res. A 2002, 477, 378–382. [Google Scholar] [CrossRef]
  17. Rahmanian, H.; Watterson, J.I.W. Optimisation of light output from zinc sulphide scintillators for fast neutron radiography. Nucl. Instrum. Methods Phys. Res. A 1998, 139, 466–470. [Google Scholar] [CrossRef]
  18. Zou, Y.; Guo, Z.; Tang, G.; Guo, J.; Bu, T. Comparison of the performance of different converters for neutron radiography and tomography using fission neutrons. Nucl. Instrum. Methods Phys. Res. A 2009, 605, 69–72. [Google Scholar]
  19. Chuirazzi, W.C. Combinatorial Optimization of Scintillator Screens for Digital Neutron Imaging; The Ohio State University: Columbus, OH, USA, 2020. [Google Scholar]
  20. Lehmann, E.H.; Mannes, D.; Strobl, M.; Walfort, B.; Losko, A.; Schillinger, B.; Schulz, M.; Vogel, S.C.; Schaper, D.C.; Gautier, D.C.; et al. Improvement in the spatial resolution for imaging with fast neutrons. Nucl. Instrum. Methods Phys. Res. Sect. A Accel. Spectrometers Detect. Assoc. Equip. 2021, 988, 164809. [Google Scholar] [CrossRef]
  21. Zboray, R.; Adams, R.; Morgano, M.; Kis, Z. Qualification and development of fast neutron imaging scintillator screens. Nucl. Instrum. Methods Phys. Res. Sect. A Accel. Spectrometers Detect. Assoc. Equip. 2019, 930, 142–150. [Google Scholar] [CrossRef]
  22. Chuirazzi, W.; Craft, A. Measuring Thickness-Dependent Relative Light Yield and Detection Efficiency of Scintillator Screens. J. Imaging 2020, 6, 56. [Google Scholar] [CrossRef] [PubMed]
  23. Mühlbauer, M.J.; Bücherl, T.; Kellermeier, M.; Knapp, M.; Makowska, M.; Schulz, M.; Zimnik, S.; Ehrenberg, H. Neutron imaging with fission and thermal neutrons at NECTAR at MLZ. Phys. B Condens. Matter 2018, 551, 359–363. [Google Scholar] [CrossRef]
  24. Schulz, M.; Schillinger, B. ANTARES: Cold neutron radiography and tomography facility. J. Large-Scale Res. Facil. 2015, 1, 8–11. [Google Scholar] [CrossRef] [Green Version]
  25. Bücherl, T.; Von Gostomski, C.L. Radiography using fission neutrons. Proc. Sci. 2006. [Google Scholar] [CrossRef] [Green Version]
  26. Ziegler, J.F.; Ziegler, M.D.; Biersack, J.P. SRIM-The stopping and range of ions in matter (2010). Nucl. Instrum. Methods Phys. Res. Sect. B Beam Interact. Mater. Atoms 2010, 268, 1818–1823. [Google Scholar] [CrossRef] [Green Version]
  27. Losko, A.S.; Han, Y.; Schillinger, B.; Tartaglione, A.; Morgano, M.; Strobl, M.; Long, J.; Tremsin, A.S.; Schulz, M. New perspectives for neutron imaging through advanced event-mode data acquisition. Sci. Rep. 2021, 11, 21360. [Google Scholar]
Figure 1. (Left) Diagram of the double-wedged scintillator screen. (Right) Photograph of a double-wedged screen. The phosphor gets incrementally thinner from left to right, while the HDPE converter gets continuously thicker from top to bottom. The control screen has no HDPE converter and thus measures the scintillator’s γ-ray response.
Qubs 06 00014 g001
Figure 2. (Left) Plot showing the penetration depth of protons into HDPE and ZnS as a function of neutron recoil proton energy. (Right) A Bragg curve describing the energy deposition of a 3 MeV proton in ZnS.
Qubs 06 00014 g002
Figure 3. (a) A radiograph of the layered fast neutron scintillator screen taken at NRAD. The colored rectangles represent the positions of the line profiles used to generate the light output data with (b) constant HDPE thickness and various scintillator thicknesses and (c) constant scintillator thickness and varying HDPE thickness.
Qubs 06 00014 g003
Figure 4. (Top, Left) A raw and (Top, Right) open beam corrected neutron radiograph of steel, lead, and HDPE step wedges taken with the fast neutron layered screen. The control screen is shown on the right and a standard plastic fast neutron scintillator is at the bottom of the radiograph. A plot of the grayscale values for a selection of (Bottom, Right) the raw and (Bottom, Left) open beam corrected radiographs (denoted with a yellow box). The control screen shows a higher signal, indicating high γ-ray content in the neutron beam.
Qubs 06 00014 g004
Figure 5. (A) An optical image of the analog Super-8 film camera used as a sample. (B) (Left) A radiograph of an analog Super-8 film camera, taken with both a fast neutron scintillator screen and (Right) a control screen with no neutron converter material.
Qubs 06 00014 g005
Figure 6. (Top) Neutron and (Bottom) γ-ray energy spectra of the NECTAR neutron beam used in the MCNP model, including the source definition, and at the image plane. The image plane energy spectra are shown both with and without a 0.5 mm thick cadmium filter.
Qubs 06 00014 g006
Figure 7. Comparison between simulated images with various neutron and γ-ray components and an experimentally measured radiograph. The qualitative visual comparison suggests that approximately 60% of the measured radiograph is contributed by γ-rays.
Qubs 06 00014 g007
Figure 8. Gray value differences between MCNP modeled image and experimental image for the different neutron to γ-ray ratios and different scintillator thicknesses. Note the different scales on the y-axis. The bottom right plot shows the neutron and γ-ray contributions as a function of scintillator thickness. The maximum neutron response occurs at 120 μm of scintillator thickness. The 120 μm calculation is similar to the 110 μm predicted by the SRIM simulation of the Bragg curve predicting the energy deposition in Figure 2.
Qubs 06 00014 g008
Figure 9. A comparison of the simulated neutron, γ-ray, combined neutron and γ-ray, and measured radiographs. The additional horizontal segments appear in the simulated neutron and γ-ray image because of the misalignment between the step-wedge steps and the different thickness layers of the ZnS scintillator.
Qubs 06 00014 g009
Publisher’s Note: MDPI stays neutral with regard to jurisdictional claims in published maps and institutional affiliations.

