Next Article in Journal
The Structure of Liquid and Glassy Carbamazepine
Next Article in Special Issue
Supervised Machine Learning for Refractive Index Structure Parameter Modeling
Previous Article in Journal
Instantaneous Quantum Description of Photonic Wavefronts and Applications
Previous Article in Special Issue
Experimental Setup for Irradiation of Cell Cultures at L2A2
 
 
qubs-logo
Article Menu
Article

The ELIMAIA Laser–Plasma Ion Accelerator: Technological Commissioning and Perspectives

by
Francesco Schillaci
1,*,
Lorenzo Giuffrida
1,
Maksym Tryus
1,
Filip Grepl
1,2,
Stanislav Stancek
1,3,
Andriy Velyhan
1,
Valeriia Istokskaia
1,2,
Tadzio Levato
1,†,
Giada Petringa
1,4,
Giuseppe A. P. Cirrone
1,4,
Josef Cupal
1,2,
Lucia Koubiková
1,
Davorin Peceli
1,
Jeffrey Alan Jarboe
1,
Tarcio de Castro Silva
1,
Martin Cuhra
1,
Timofej Chagovets
1,
Vasiliki Kantarelou
1,
Marco Tosca
1,5,
Vahagn Ivanyan
1,
Martina Greplová Žáková
1,2,
Jan Psikal
1,2,
Roman Truneček
1,
Anna Cimmino
1,
Roberto Versaci
1,
Veronika Olšovlcová
1,
Daniel Kramer
1,
Pavel Bakule
1,
Jan Ridky
1,
Georg Korn
1,
Bedrich Rus
1 and
Daniele Margarone
1,6
add Show full author list remove Hide full author list
1
Czech Academy of Sciences, ELI–Beamlines Center, Institute of Physics, 252 41 Dolní Břežany, Czech Republic
2
Faculty of Nuclear Sciences and Physical Engineering, Czech Technical University in Prague, 115 19 Prague, Czech Republic
3
Joint Laboratory of Optics of Palacky University, Institute of Physics of Academy of Sciences of the Czech Republic, Faculty of Science, Palacky University, 772 07 Olomouc, Czech Republic
4
Laboratori Nazionali del Sud, INFN, 95 123 Catania, Italy
5
Department of Macromolecular Physics, Faculty of Mathematics and Physics, Charles University, 121 16 Prague, Czech Republic
6
Centre for Plasma Physics, School of Mathematics and Physics, Queen’s University Belfast, Belfast BT7 1NN, UK
*
Author to whom correspondence should be addressed.
Current address: Advanced Material Research Center, Technology Innovation Institute, Abu Dhabi P.O. Box 9639, United Arab Emirates.
Quantum Beam Sci. 2022, 6(4), 30; https://doi.org/10.3390/qubs6040030
Submission received: 7 September 2022 / Revised: 27 September 2022 / Accepted: 29 September 2022 / Published: 9 October 2022
(This article belongs to the Special Issue Laser-Assisted Facilities)

Abstract

:
We report on the technological commissioning of the Laser–Plasma Ion Accelerator section of the ELIMAIA user beamline at the ELI Beamlines facility in the Czech Republic. The high-peak, high-average power L3-HAPLS laser system was used with an energy of ~10 J and pulse duration of ~30 fs on target, both in single-pulse and high repetition-rate (~0.5 Hz) mode. The laser pulse was tightly focused to reach ultrahigh intensity on target (~1021 W/cm2) and sustain such laser–plasma interaction regime during high repetition-rate operations. The laser beam, ion beam, and laser–plasma emission were monitored on a shot-to-shot basis, and online data analysis at 0.5 Hz was demonstrated through the full set of used diagnostics (e.g., far and near field, laser temporal diagnostics, X- and gamma-ray detectors, Thomson Parabola ion spectrometer, time-of-flight ion detectors, plasma imaging, etc.). The capability and reliability of the ELIMAIA Ion Accelerator was successfully demonstrated at a repetition rate of 0.5 Hz for several hundreds of consecutive laser shots.

1. Introduction

Laser–plasma-driven particle acceleration is a new and rapidly evolving field of physics thanks to the fast development of high-power laser technologies, thus enabling researchers to explore innovative regimes of ultrahigh intensity (>1020 W/cm2) laser–matter interaction. Extremely high electric and magnetic fields can be generated in a laser-produced plasma, thus enabling efficient acceleration of ions (up to ~100 MeV for protons) in extremely short distances (~1 μm) [1,2,3]. Such a non-conventional acceleration technique has been actively investigated in the last two decades both for fundamental and applied research [4,5,6,7,8,9]; however, this effort is still confined to the relatively small laser–plasma community given the fact that laser-driven ion sources are mostly not mature for societal applications, especially in terms of particle beam quality and reliability.
ELI (Extreme Light Infrastructure) is the largest international photonic project worldwide and currently in its commissioning and initial user operation phases. The ELI facilities aim at offering primary (ultrahigh-intensity laser pulses) and secondary (photons and particles generated by laser–matter interaction) sources to a broad user community for basic and applied scientific research. ELI will not only explore innovative laser–plasma interaction regimes but also operate cutting-edge laser technologies in terms of peak and average power and deliver secondary sources, thus promising a strong impact in industrial and societal applications, including potential medical ones [10].
ELI Beamlines is the ELI pillar operating in the Czech Republic. Its main mission is to provide secondary plasma-based sources (ions, electrons, and X-rays) to users from various disciplines (physics, biology, medicine, material science, chemistry, etc.) and, in addition, to offer advanced experimental platforms to the plasma community interested in exploiting the available unique laser beams [11,12,13,14]. The L3-HAPLS laser system can provide pulses with a peak power of 1 PW (30 J/30 fs) at an unprecedented repetition rate (10 Hz), while the L4-ATON system can reach a peak power of 10 PW (1.5 kJ/150 fs) at a rate of one shot every 3 min, with an additional capability of delivering uncompressed pulses (~3 ns with temporal shaping capability) [11,15,16]. Optimization of the secondary source quality and reproducibility (energy, flux, divergence, spatial pointing, and homogeneity) is a key aspect, especially for applied research in the biomedical field [11].
ELIMAIA (ELI Multidisciplinary Applications of laser–Ion Acceleration) is the ion beamline aiming at offering proton/ion beams with unique features to a broad range of multidisciplinary users and also at exploring innovative laser–plasma acceleration regimes exploiting the advanced capabilities currently offered by the PW-class L3-HAPLS (ultrahigh intensity and high repetition rate) and, in the future, by the 10PW-class L4-ATON (kJ-class) laser systems. In the following, the basic commissioning of the Ion Accelerator section of ELIMAIA will be presented along with the related technological solutions available to users.
The ELIMAIA Ion Accelerator is driven by the L3-HAPLS laser, which is a Ti:sapphire-based chirped pulse amplification system with an 8-pass preamplifier and 4-pass main amplifier, currently providing energy of about 12 J (with maximum energy above 30 J foreseen in the near future) [15,16]. The system delivers pulses of sub-30 fs duration (FWHM) at a center wavelength of 813 nm (with 88 nm bandwidth) and repetition rate up to 3.3 Hz (single-shot mode is also available). The squared beam with super-Gaussian spatial intensity profile (214 mm in FWHM) is focused onto a target by an f/1.5 off-axis parabolic mirror to a ~2 μm spot (FWHM) resulting in an irradiance exceeding 1021 W/cm2. The first commissioning phase of the Ion Accelerator was carried out in 2021 with the goal of demonstrating the functionality and robustness of the developed technologies for future user operations. The main technological achievement is the demonstration of our capability to provide a fully automated laser-driven end-station, not limited to the target technology [17,18,19,20], capable of working at high repetition rate and provide online data from a full set of diagnostics devices. Here, the discussion is limited to the 0.5 Hz repetition rate; however, the ELIMAIA technology (in terms of operation, data acquisition, transfer, and analysis) has been successfully tested in simulation mode up to 1 Hz.

2. The Laser–Plasma Ion Accelerator in the E4 Hall

The Laser–Plasma Ion Accelerator section of the ELIMAIA beamline is located in the experimental hall E4 (27 m × 36 m large) of ELI Beamlines. The target area is a bunker hall with 1.6 m concrete walls to ensure safe operation of the beamline from the local control room. Detailed Monte Carlo simulations reported elsewhere [21,22] demonstrate that the Ion Accelerator can be operated for several millions of shots per year, both in terms of prompt radiation and potential activation of the experimental equipment, under the assumption of a broad proton energy distribution with cutoff energy of about 250 MeV. The hall is equipped with main services (such as central vacuum, electricity, radiation monitoring systems, machine, and personal safety systems) to ensure the correct and safe operation of the target area and the workers. The hall also hosts the ELIMED (ELI MEDical application) section of the ELIMAIA beamline. ELIMED contains customized ion beam transport, dosimetry, and sample irradiation solutions to enable applied research in multidisciplinary fields, especially the biomedical one, benefitting from the unique features (e.g., ultrashort pulse duration and ultrahigh dose rate) of laser-accelerated ion beams [11,23,24,25]. The operators and the users can control the technology in the E4 hall from an adjacent, dedicated local control room (see Figure 1). Safe operations from the control room are guaranteed by the concrete walls and the above-mentioned radiation monitoring system. This is based on commercial detectors for environmental monitoring of gamma and neutron dose rates for pulsed radiation (Berthold LB 6419 [26,27]), nuclear activation monitors VF Nuclear Smart dose rate meters type MDG [28], and custom-made emergency indicators, which are installed in the critical points, e.g., around the Ion Accelerator (interaction chamber) and ELIMED.
The ELIMAIA Ion Accelerator is connected to the L3-HAPLS laser system through an 80 m long highly stable laser beam transport system (see Figure 2) consisting of a set of DN500 vacuum pipes and a set of chambers equipped with dielectric coated mirrors to deliver the laser beam to the E4 hall with s-polarization on target. Figure 3 shows a detail of the last section of the L3 Beam Transport (L3BT in the following) and an overview of the ELIMAIA accelerator. After the L3BT periscope, the beam is first injected into the ECU-D1 (Experimental Chamber Unit D1) Plasma Mirror chamber. This has a vacuum volume of about 8 cubic meters capable of reaching a pressure of 6 × 10⁻⁶ mbar in ~30 minutes (air-to-vacuum transition time); the vacuum level reaches a stable regime of ~8 × 10⁻⁷ mbar after one night of continuous pumping. In the next future, the ECU-D1 chamber will be equipped with a double-plasma mirror dedicated optical setup [29] to further improve the L3 intensity contrast if required by the users. During the Ion Accelerator technological commissioning reported here, the chamber was equipped with a turning mirror required to deliver the beam into a second vacuum chamber (CH60) and finally into the ECU-D2 Interaction chamber, where the laser–plasma ion acceleration process takes place. A detailed view of the optical setup in the interaction chamber is shown in Figure 4. The vacuum volume of ECU-D2 is about 9 cubic meters and the chamber can reach a pressure of 3 × 10⁻⁵ mbar in ~40 min (the steady vacuum level is ~3 × 10⁻⁶ mbar after one night of continuous pumping). Both ECU chambers are equipped with a 130 mm thick aluminum breadboard decoupled from the vacuum vessel and sitting on independent and decoupled supports to improve the stability of the structures hosting the optical setup.
The following paragraphs provide an overview of the technological commissioning (sometimes referred as “basic commissioning” in the following) of the experimental systems of the ELIMAIA Ion Accelerator that is propaedeutic to the following phase of “advanced commissioning”, discussed elsewhere [30], and ultimately to user operations.

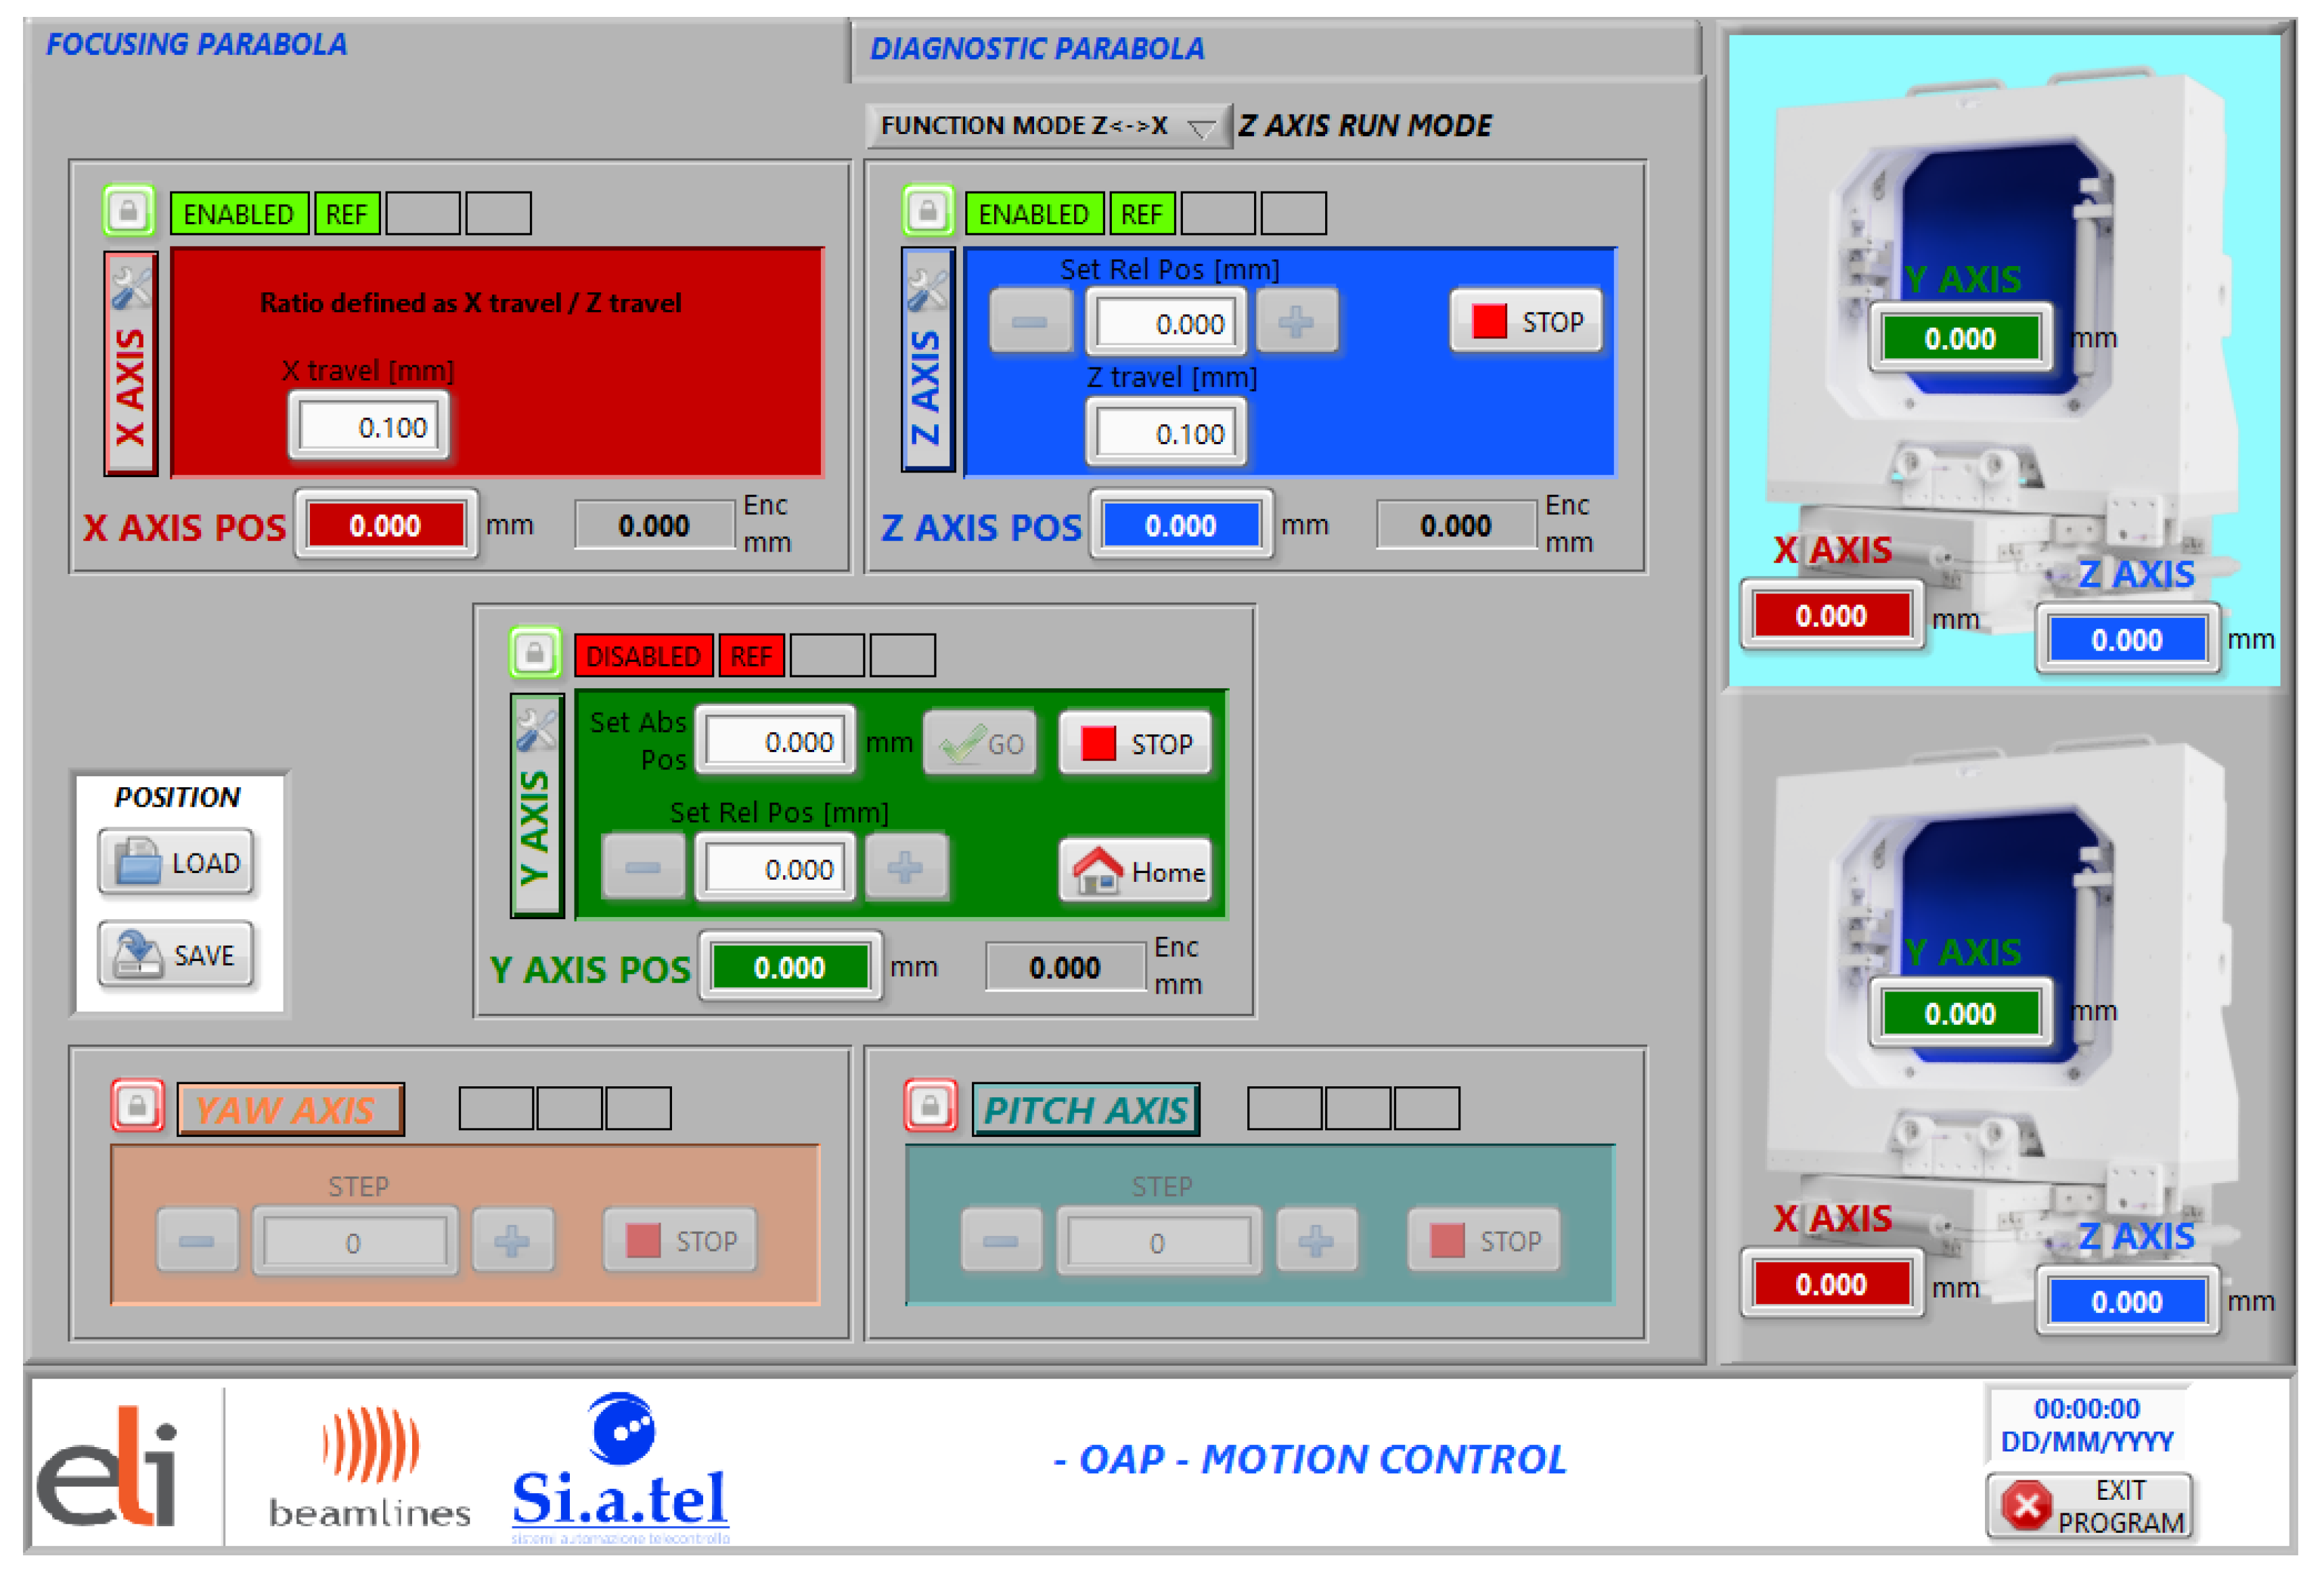
2.1. Alignment System

The L3 laser fine alignment along the pre-aligned optical path of the ELIMAIA Ion Accelerator is a routine operation performed every day to use the L3 high-power beam for laser–plasma ion acceleration experiments. The procedure takes less than an hour and includes the alignment check of all mirrors along the L3 Beam Transport (L3 BT), the off-axis parabola (OAP), and the optical path in the Beam Diagnostics Station (BDS).
The alignment technique is based on the use of the apodised (circular) L3 front-end beam operating at 100 Hz (25 mm diameter, ~20 μJ). Each mirror in the Ion Accelerator system shown in Figure 4 is equipped with a reference cross on a mechanical arm (see Figure 5A). The reference crosses can be elevated in front of a mirror marking the reference beam position. The alignment beam is then extracted right after the reflection in the last LMo6 (acronym of Laser Mirror, the number indicates the position of the mirror in the local optical chain) mirror; this is carried out by using a small pickup mirror mounted on another identical mechanical arm and sent to the alignment station after passing through a viewport installed on the interaction chamber allowing, then, the performance of the alignment with the full system under vacuum. The alignment station consists of a telescope with adjustable focus. The different object planes correspond to the position of each reference cross in front of each mirror. An example of the cross image after the alignment of a mirror is shown in Figure 5B. The crosshair in the picture is not straight; in fact, every reference cross has a different rotation angle allowing for an almost simultaneous alignment of all the mirrors. This technique applies to all mirrors but those preceding the ECU D1 chamber, as the optomechanics of those mirrors is equipped with a fixed reference cross on the back side, and a camera box installed directly on a viewport behind the mirror is used to visualize the beam position (see Figure 5C,D and [31]).
After the alignment of all mirrors is completed, the low-power full-aperture L3 is used to optimize the focus of the main OAP. The image of the focal spot is acquired with a 20× microscope objective onto a CCD camera. The OAP optomechanics, which is provided with five fully controllable axes (both in single mode and in gearing mode with the longitudinal axis motion linked to the horizontal axis according to a certain ratio), allows for the optimization of the focal spot, namely reaching minimum size and maximum energy within its FWHM. The image of the focal spot is acquired and processed several times during the optimization procedure in order to reach optimal performance. Finally, the processed image is scaled for 10 J of laser energy in order to estimate the laser parameters on target during high-power operations. An example of raw focal spot image and the corresponding processed image is shown in Figure 6. As it can be seen in Figure 6B, the resulting focal spot in this particular case has an FWHM size of 2.7 × 1.9 μm, and the estimated mean intensity is above 1021 W/cm2 (FWHM). The energy within FWHM is calculated as the ratio of integral over FWHM and the integral of the whole image, and it normally reaches 20–25%. The OAP control interface is shown in Figure 6. The same interface allows switching between the control of the focusing OAP in the D2 chamber and the diagnostic OAP in the L3 BDS that will be described in the next section. The OAP control interface is shown in Figure 7. The same interface allows switching between the control of the focusing OAP in the D2 chamber and the diagnostic OAP in the L3 BDS that will be described in the next section.
Once the main OAP is aligned, the image of the focal spot is acquired and processed to verify the beam spot size and intensity distribution. An example of focal spot image and corresponding processed image is shown in Figure 8. As it can be seen in Figure 8B, the resulting focal spot has an FWHM size of 2.7 × 1.9 μm. The estimated mean intensity is above 1021 W/cm2, calculated at FWHM for ~10 J of incident laser energy on target. No deformable mirror (DFM) has been used to correct the laser wavefront thus far; however, two deformable mirrors are available and planned to be used in two locations: before the L3-HAPLS compressor and in the ELIMAIA interaction chamber. This would allow enhancing the encircled energy in the focal spot.
The whole alignment process is performed in a vacuum and remotely from the E4 control room for the full optical beam path (from the L3 compressor to the ELIMAIA interaction chamber). Some specific cases might require having the full ELIMAIA Ion Accelerator at atmospheric pressure during the alignment, such as for installation and alignment of additional optics or specialized optical diagnostic lines based on user requirements.
The L3 beam from the first stage of amplification (namely the Alpha-amplifier) was used to verify the pulse duration at the ELIMAIA End Station. The beam was sent outside the ELIMAIA interaction chamber through a glass window. The spectral phase introduced by the glass window in the vacuum chamber was dominated by the second-order dispersion, or Group Delay Dispersion (GDD). The measured value of GDD in the glass window was 253 fs2; thus, the pulse duration measurement was adjusted accordingly. The energy of the beam was around 100 µJ within a diameter of about 50 mm. The calculated B integral in the window was 0.01; therefore, the nonlinear spectral phase contribution can be considered negligible. The laser beam was down-collimated with two telescopes from 50 mm to 3 mm.
The pulse duration was measured using an FC SPIDER from APE [32]. The L3 pulse duration measurement at ELIMAIA was compared with the simultaneous SPIDER measurement at the L3 hall for calibration purposes. The difference between the pulse duration at the laser hall and at ELIMAIA was around 2 fs and thus comparable with the accuracy of the measurement method itself. The shortest achievable pulse duration measured at the ELIMAIA target position was about 28.5 ± 0.5 fs, as shown in Figure 8.

2.2. Beam Diagnostic Station

The Beam Diagnostic Station (BDS) at the ELIMAIA beamline was initially designed for the adoption of a deformable mirror [12], but it is currently used to perform shot-to-shot measurements and to monitor the key spatial and temporal features of the L3 laser beam at full-power close to the laser–target interaction point. The analyzed beam is the L3 leak of mirror LMo4, shown in Figure 4, extracted from the chamber through a DN 400 viewport. The beam is then downsized on a dedicated optical table using a telescope consisting of OAP with a focal length of 4400 mm (detailed simulation on focusing capability are in [12]) and a lens with a focal length of 125 mm. The beam size of the telescope reaches approximately 7 mm in FWHM.
The optical setup is shown in Figure 9. After the focal point, the size of the beam is kept small and, using 2” optics, it is divided by a beam splitter (BS) into the four branches of the BDS, where the near field (NF) and far field (FF) are monitored on a shot-by-shot basis during full-power operation using cameras equipped with ND filters, while the nanosecond-level intensity contrast of the beam is monitored using two fast photodiodes. The setup is extremely versatile and can be extended to additional branches to include other diagnostics, such as a wave-front sensor coupled with a deformable mirror inside D2 [12] or others.
As the beam passes through the leak mirror and the optical window, it may cumulate linear and non-linear spectral phases, which may destroy the laser pulse beam quality. In general, the total on-axis nonlinear phase shift accumulated by a femtosecond compressed pulse can be expressed as its B-integral [33]. The leak mirror transmits a very small fraction of the energy, and then the B-integral (estimated for both leak mirror and window) is very small (<0.22 rad), and nonlinear effects do not distort the leaked beam [34,35,36].
An example of near-field and far-field data acquired during high-power operation with the L3 laser (pulse energy ~10 J) is shown in Figure 10. A processed far-field image is presented together with the corresponding data acquired for the near field. The far-field image is processed using the same analysis technique employed for the OAP focal image processing.
The near-field images are mostly used to monitor the beam profile uniformity: emerging hot spots might be indicative of induced optical damage. The far-field images are analyzed to retrieve information about the shot-to-shot changes in the intensity distribution and in spot size in the focal plane of the Diagnostics OAP, as well as fluctuation of the focus position, which corresponds to the pointing stability of the L3 beam. The data processing routine was executed online during an experiment at repetition rates up to 0.5 Hz. This allowed performing a quantitative accurate study of the long-term L3 laser beam pointing stability both at low and full power and over a series of hundreds of consecutive shots at 0.5 Hz. The results for the two series of 100 consecutive shots are shown in Figure 11, demonstrating an extremely high transverse pointing stability with fluctuation statistically smaller than 3 µrad with respect to the reference position. Figure 11 also shows that the pointing stability has slightly higher fluctuations at high power. This probably is due to the opening/closing of a safety mechanical shutter in the L3 system beam path before the compressor that causes vibration. The results in Figure 11 demonstrate the robustness of the L3 laser system (including the large compressor), the long beam transport section (~80 m of beam path), and the plasma mirror and interaction chambers, along with all the large-size optomechanical systems used in the entire chain up to the final laser–target interaction point.
The photodiode measurements are aimed at the temporal characterization of the laser emission in a nanosecond-scale time window prior to the arrival of the main ultra-intense pulse. This allows for evaluating the laser pulse intensity contrast conditions during the laser–target (or laser–plasma) interaction. One photodiode is set to record the presence of early-stage pre-pulses (typically femtosecond ones coming from the laser front end) on a time scale of about 100 ns, while the other is focused on a shorter time window of about 10 ns, which is dominated by the rapidly growing ASE (Amplified Spontaneous Emission) background.
A typical example of a photodiode signal acquired in the early stage of the Ion Accelerator’s technological commissioning is reported in Figure 12. The two photodiodes are equipped with different ND filters; hence (despite the scale used in the plot), the vertical signal amplitude of the left plot is three orders of magnitude smaller than the one in the right plot. The main pulse signal is strongly saturated in both cases in order to resolve the weak signals in the pre-pulse region. The effect of the ASE was perceived as the limiting factor for the ultra-relativistic laser–target interaction, with substantial efforts being dedicated to its reduction. Using the BDS, in particular the two temporal characterization branches, an important improvement in the laser pre-pulses and ASE pedestal was possible. The ASE laser intensity contrast was then enhanced step by step from an initial value of ~10−9 to a final value of ~10−10 (about one order of magnitude), as shown in Figure 12 (C). The picture shows the latest intensity contrast measurements associated with higher energy protons that are not reported in this manuscript (details will be presented in a dedicated paper).

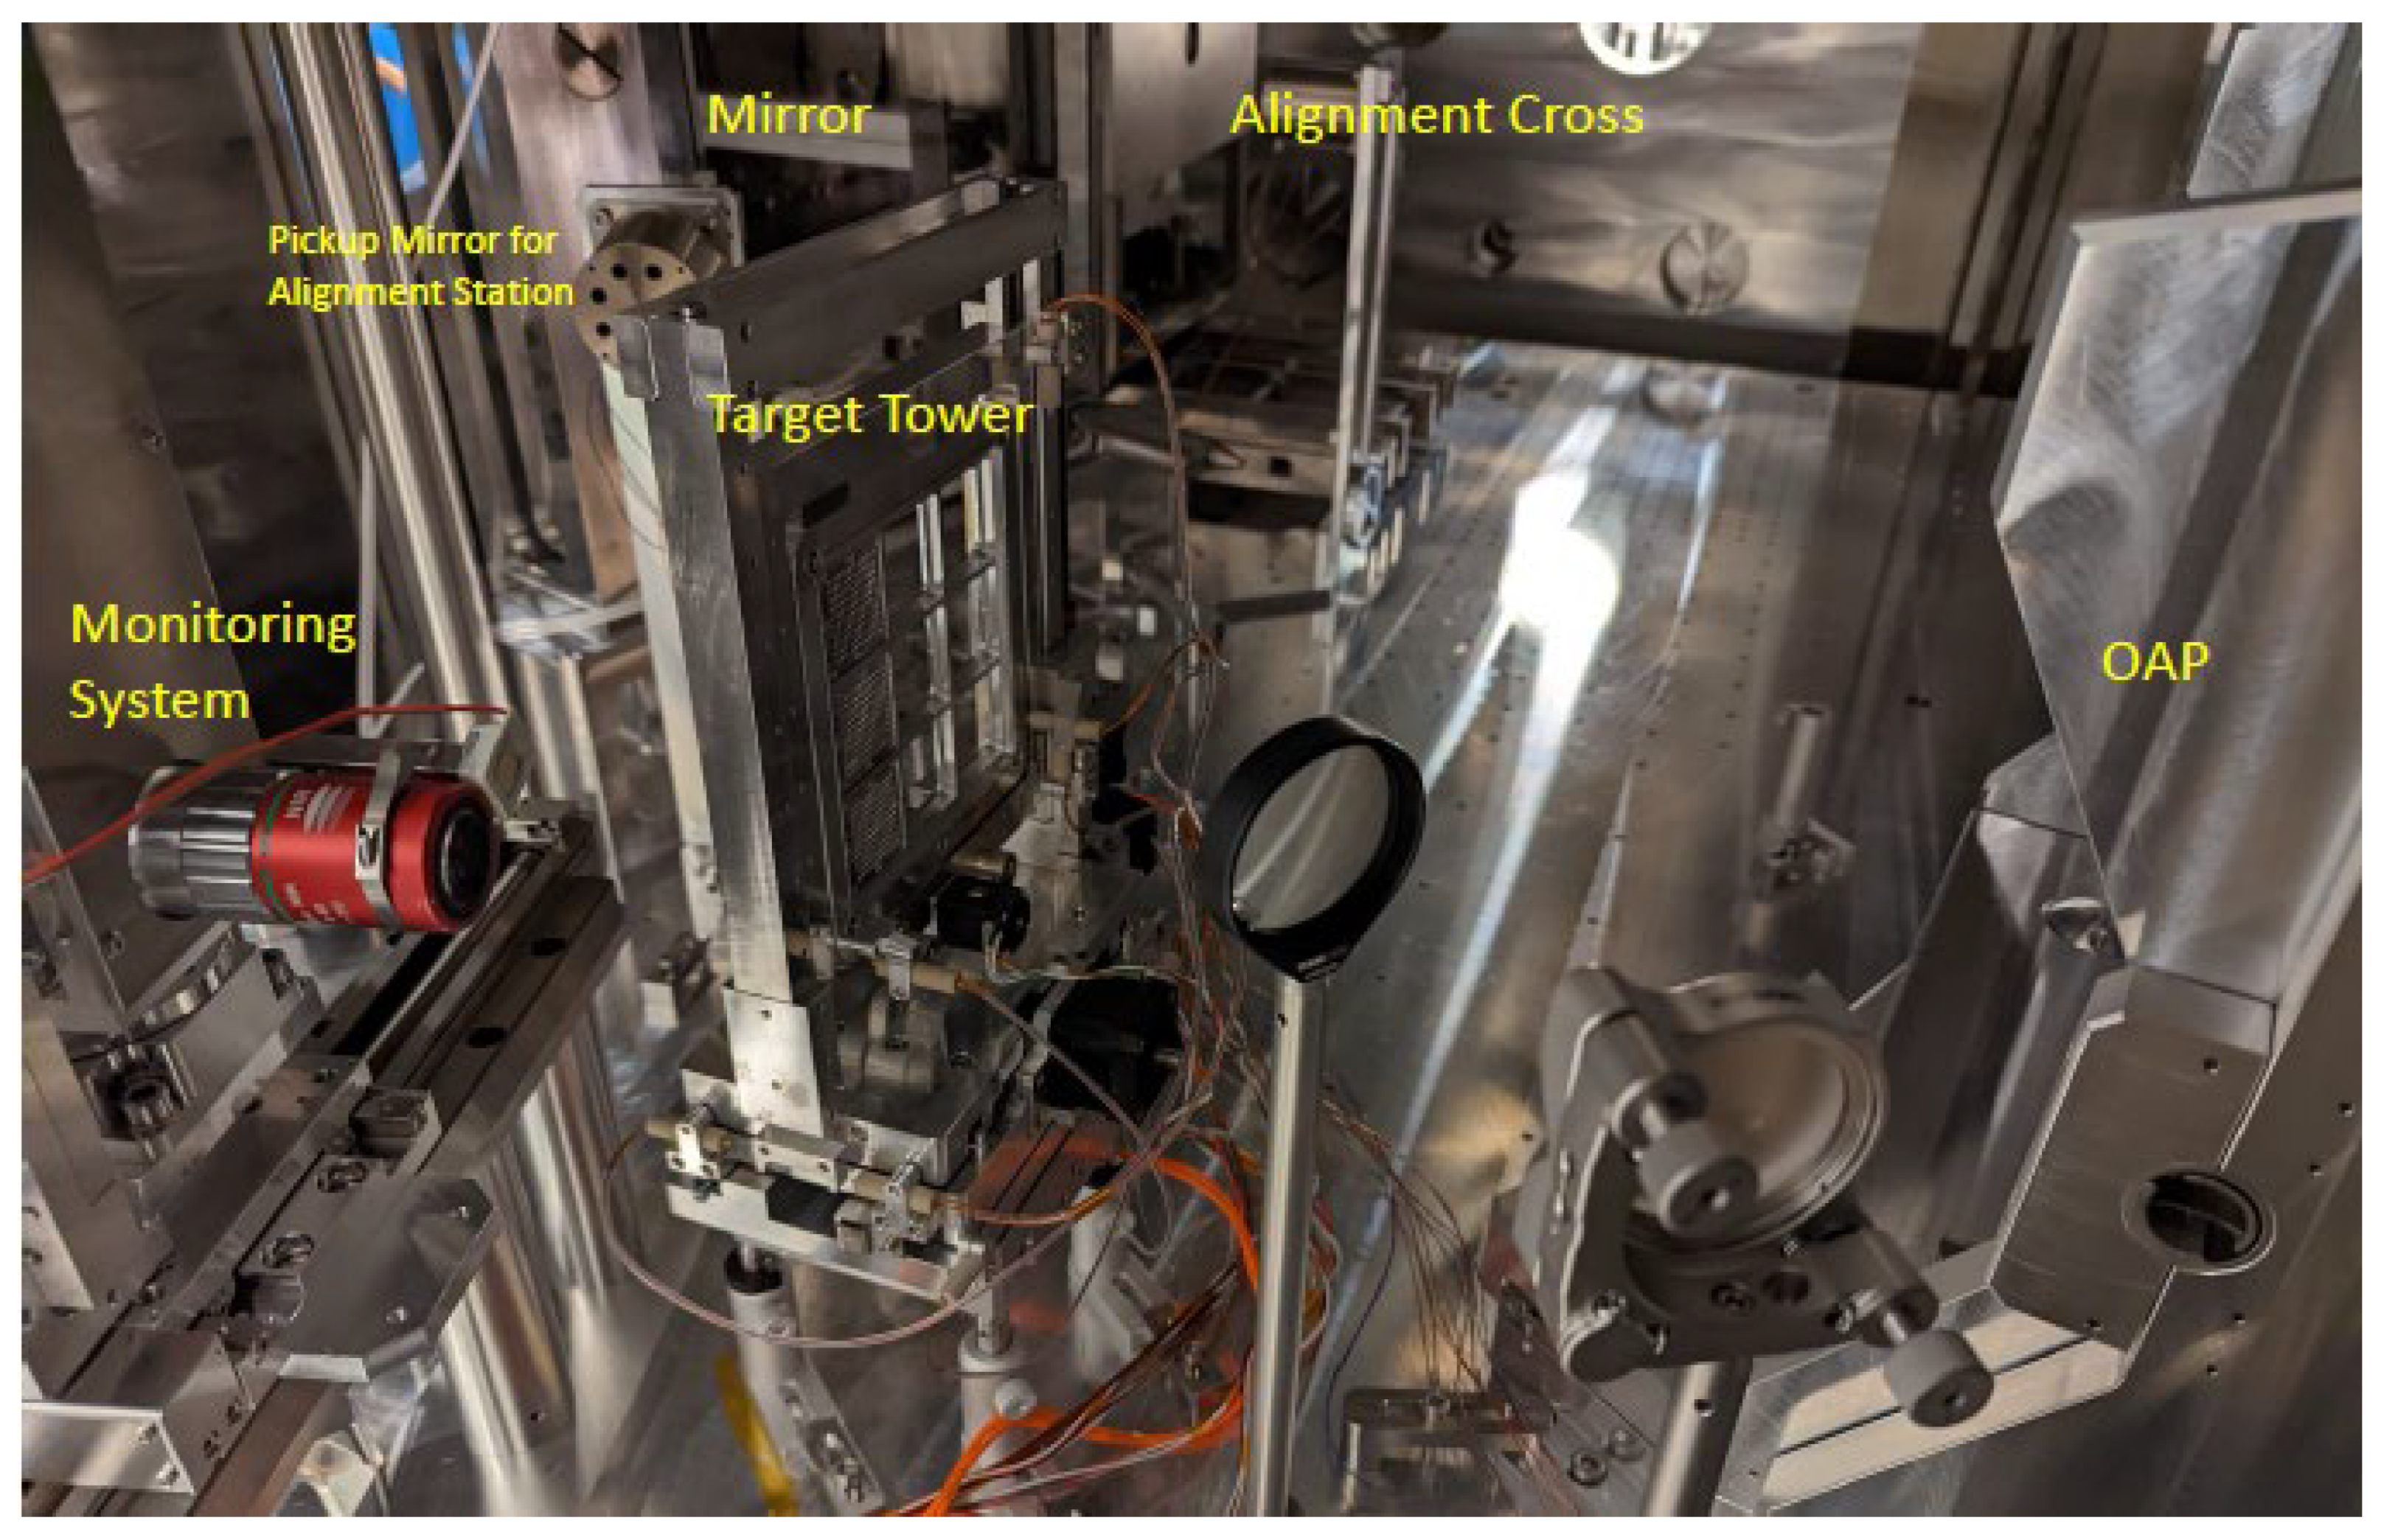
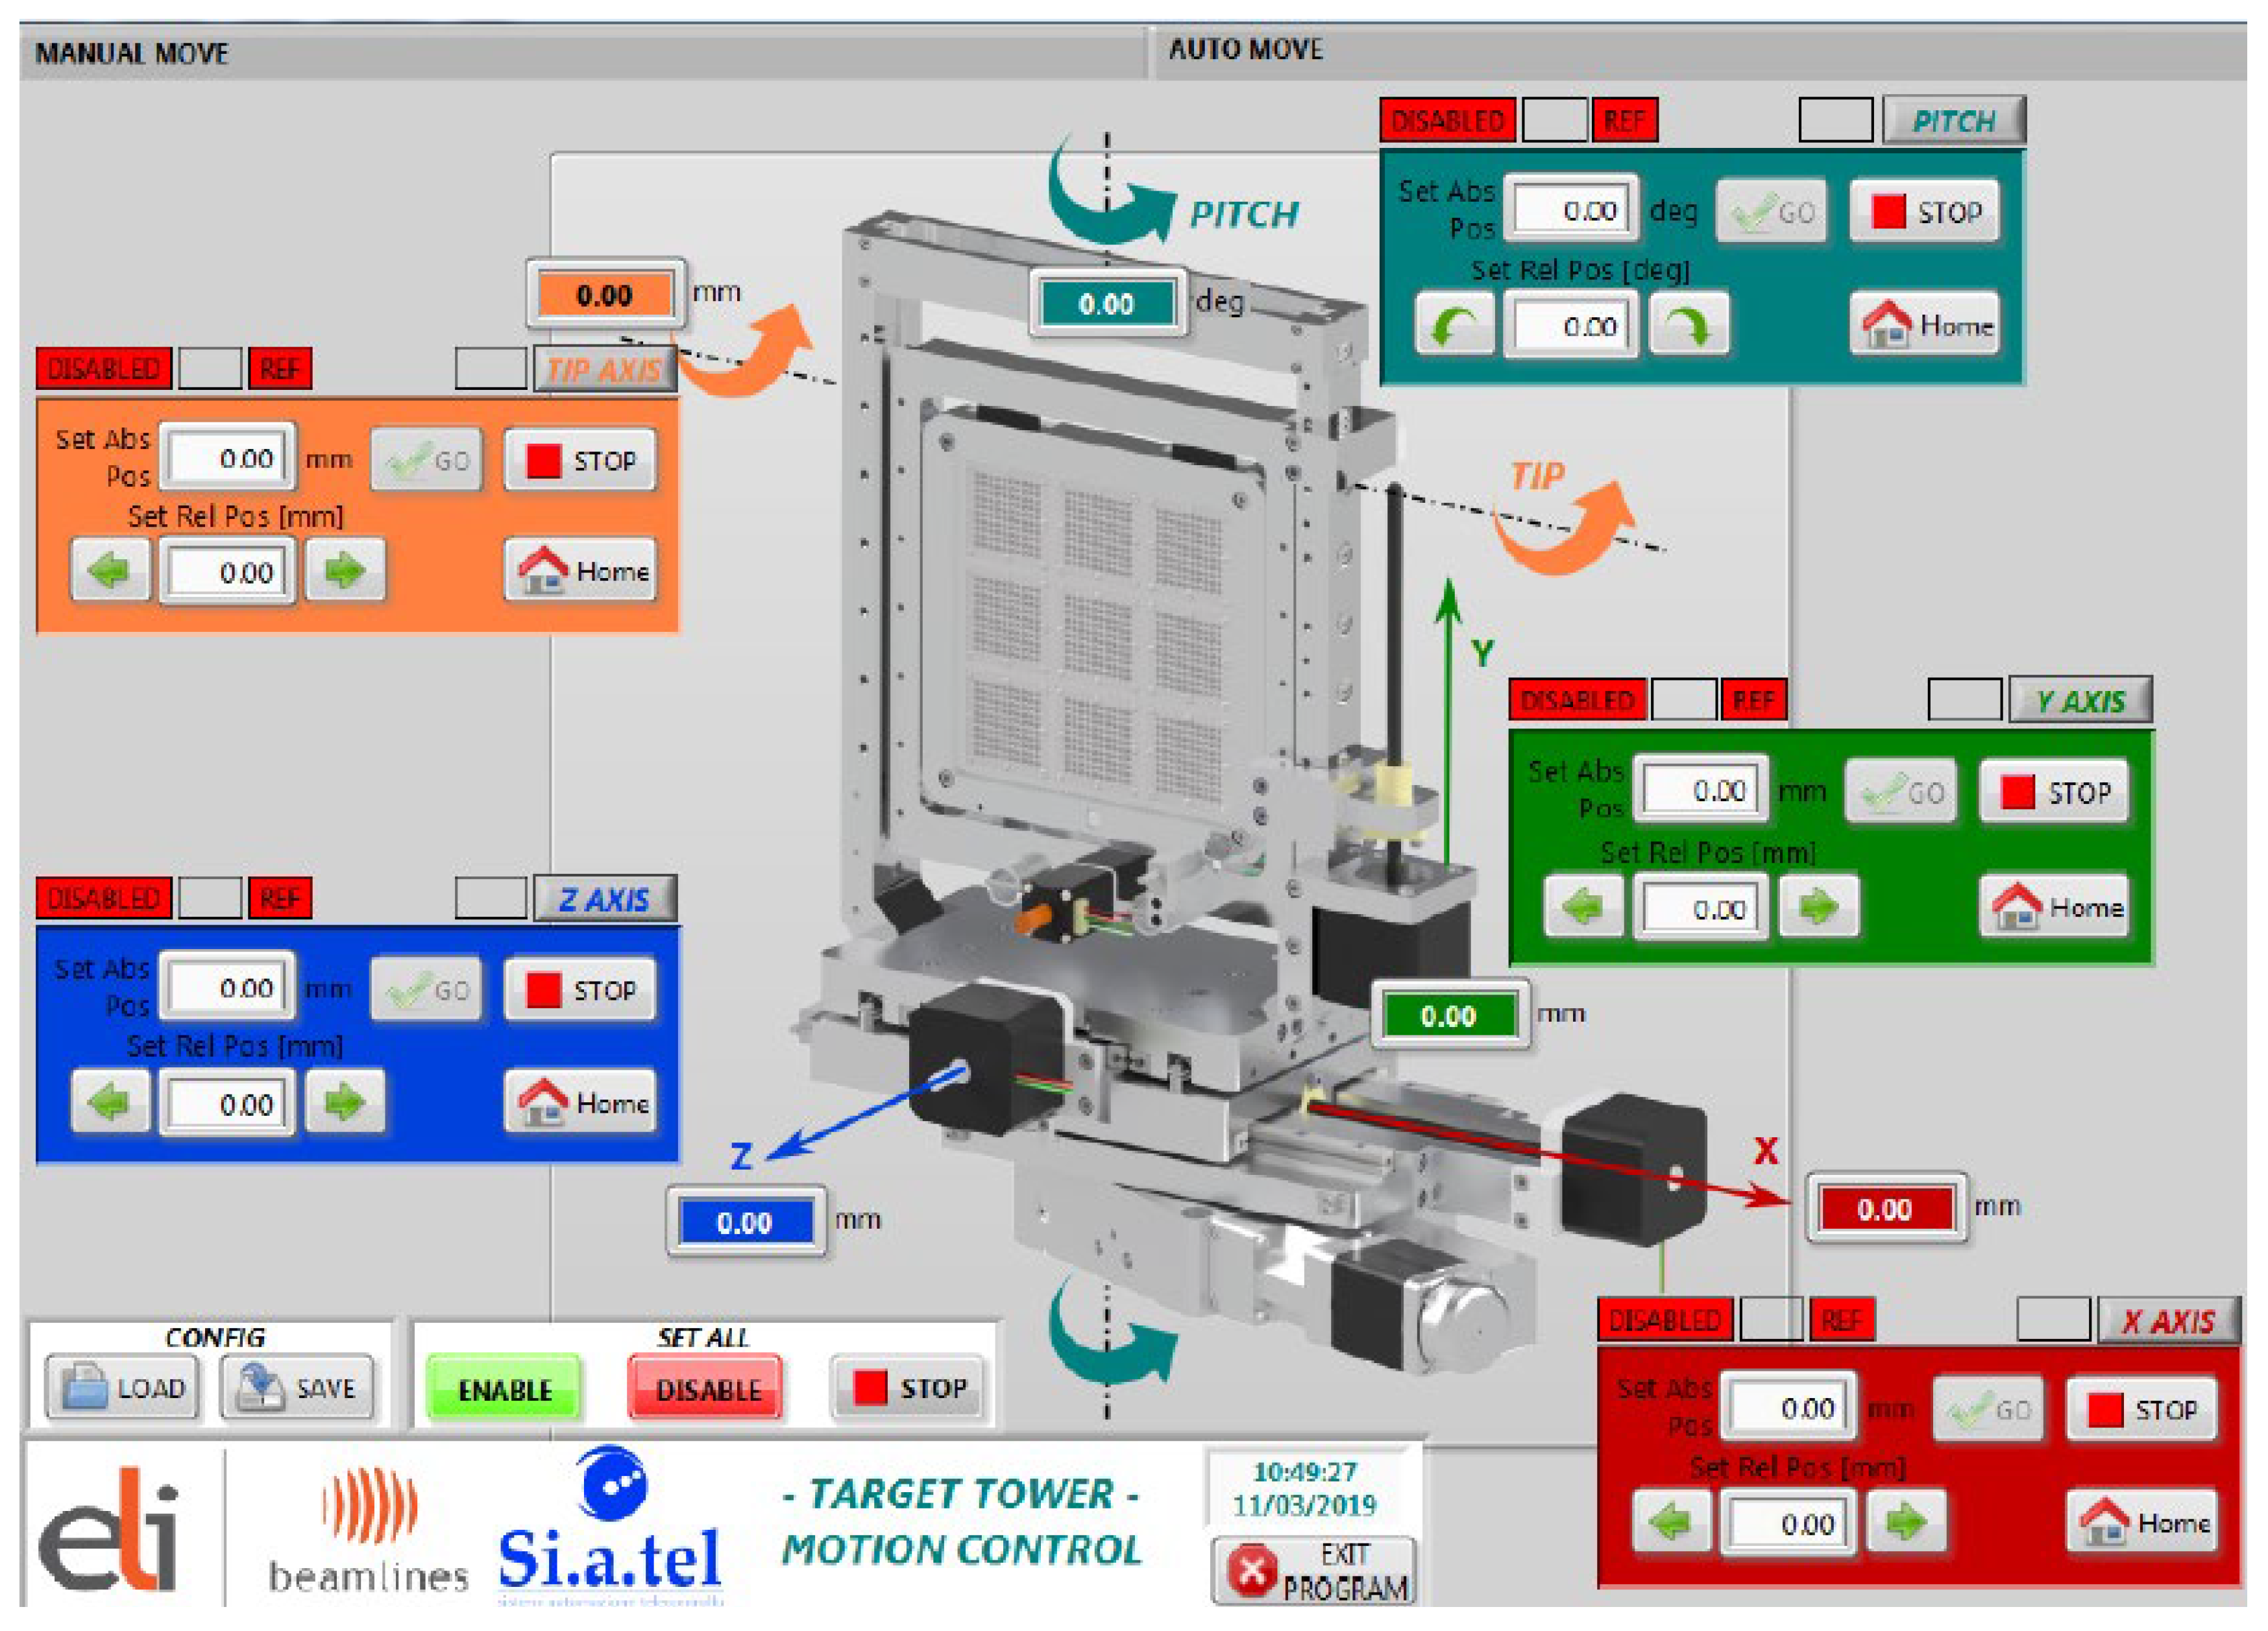
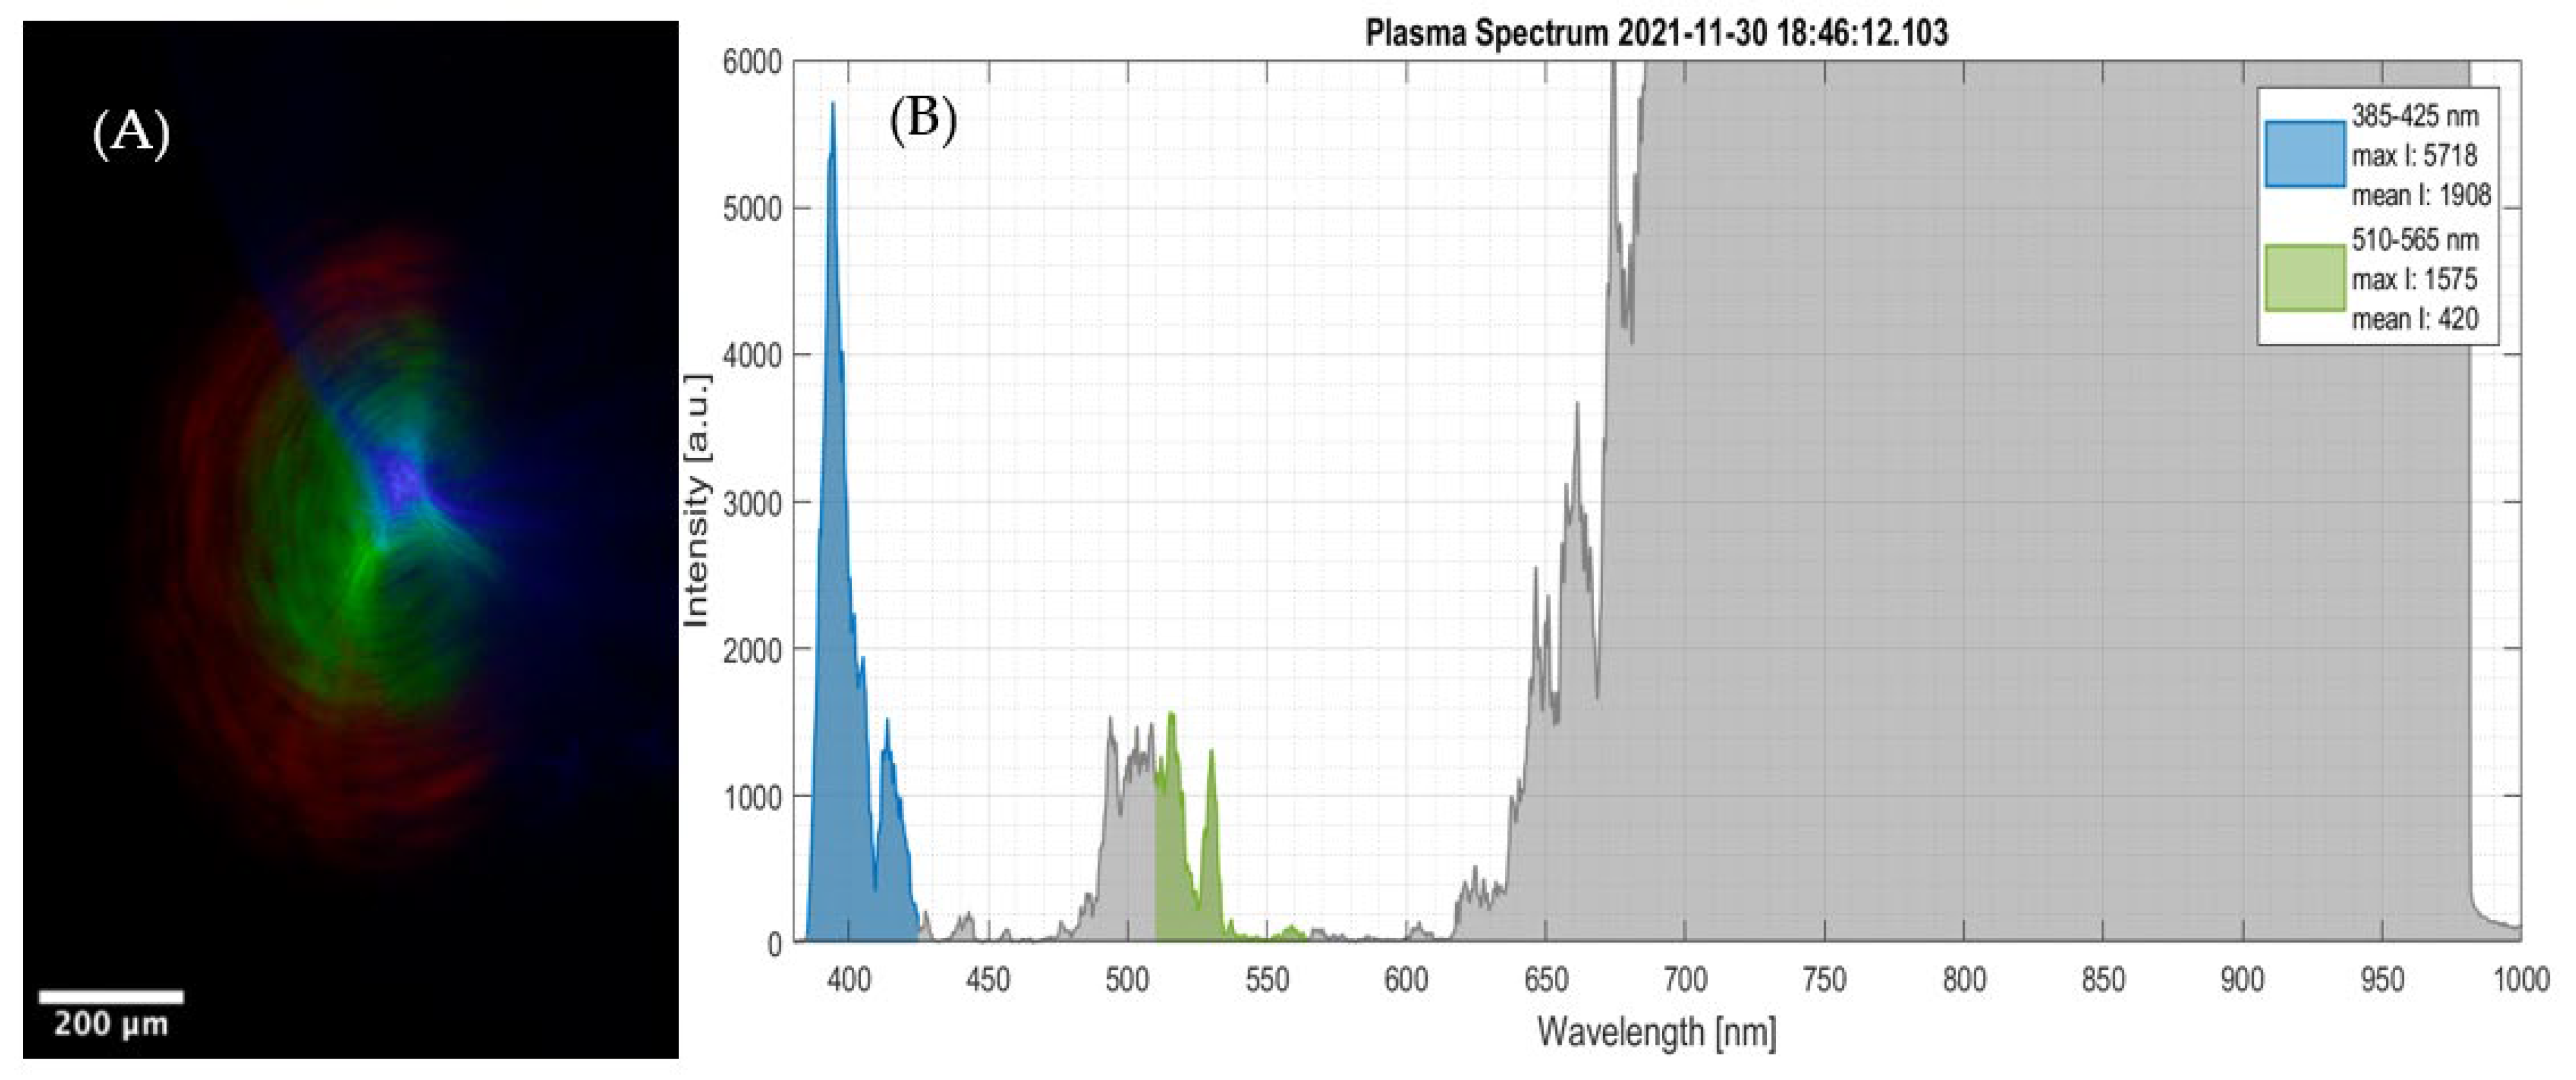
2.3. Targetry and Interaction Diagnostics

After the main OAP is aligned and the focal spot is optimized, the monitoring system is used as a reference to set the positions of individual targets in the OAP’s focus. Solid targets (usually thin metallic or plastic foils) are mounted in special holders that protect adjacent targets from heat transfer and shockwave damages induced by laser–plasma interaction. Each holder represents a square matrix and contains up to 100 targets of a single type. The main frame of the target tower supports nine target holders (Figure 13), which allows making up to 900 shots in one pumping cycle. The target tower is equipped with five motorized axes, controlled by a dedicated positioning system (interface is shown in Figure 14). The motion software allows using tables to store the target positions defined during the alignment and recalls them during the operational (laser shooting) phase; it is hence possible to pre-align the whole set of nine frames. The system can be also externally triggered, and in this state, it moves from one shot target to the neighboring fresh one at a repetition rate of 1 Hz with accuracy and repeatability better than 10 μm [37]. The main interface of the control software is shown in Figure 14. The automation of the target tower has been tested, during the basic commissioning campaign, for five consecutive series of 100 shots, each at about 0.5 Hz, resulting in reliable and robust operations.
The laser–target/laser–plasma interaction is routinely monitored using several detectors, such as plasma imaging and spectroscopy systems for the study of the plasma emission, gamma-ray detectors, and a calorimeter for the Bremsstrahlung emission.
The plasma imaging and spectroscopy diagnostics operate in the visible range and are aimed at detection and characterization of the second harmonic emission (blue light in Figure 15A) from the target under laser irradiation and of the two-plasmon decay effect at its quarter-critical surface (green light in Figure 15A) related to pre-plasma formation. A two-lens optical system creates a magnified image of the target, collecting light in the specular reflection direction of the laser, which is then captured by a CMOS camera for the plasma imaging and a fiber-coupled visible (VIS) spectrometer placed outside the interaction chamber. An example of acquired spectra is shown in Figure 15B. The blue and green components represent the second harmonic emission and the two-plasmon decay.
The XUV spectroscopy is a supplementary diagnostic that allows studying the laser–target interaction by analyzing high harmonics generation and plasma emission processes. We use the commercial spectrometer maxLIGHT pro [38] (see Figure 16). The spectrometer can operate in two modes: as an XUV beam profiler and as a source-imaging spectrometer with tunable range from 7 nm to 80 nm, based on a flat-field concave reflective grating. It is equipped with an MCP (micro-channel plate) detector assembly and an additional HV pulser, which allows gating of the MCP in under 10 ns (rise/fall time) for time-resolved measurements. Full optimization of this device is still in progress.
The gamma detector is a standard plastic scintillator (dimension 40 × 10 × 3.5 mm) coupled to a photomultiplier in a light-proof package. The scintillator is used to convert the gamma photons into visible light, and the photomultiplier’s (1 × 1 × 0.2 mm3) solid-state electronic photo-sensor is used to detect low-intensity visible-light signals. An example of gamma-ray signal acquired for different types of targets during the ELIMAIA Ion Accelerator basic commissioning is shown in Figure 17. The measured signal shows a typical output of the scintillator, i.e., a main peak with a typical exponential decay response. The amplitude of the signal corresponds to the total energy received by the detector in a given shot, which means the sum of energies of all gamma photons received in that shot. This information is then related to the overall energy converted into photons during the laser target interaction and hence its stability. As shown in Figure 17, the signal is stable and presents only small variations, demonstrating also the stability of the laser–matter interaction during the commissioning run, except in the case of a plastic target (low electron density, hence low gamma-ray flux emitted in the target bulk).
The calorimeter’s design is based on the use of two different scintillating materials in a stack configuration (scintillator array) and a CCD camera with an 8 mm focal length objective to acquire the emitted light. The reason for this choice is due to the fact that the Bremsstrahlung emission is the dominant radiation process generated in the laser–plasma interaction for laser intensities below 1022 W/cm2 [39], and it has been experimentally observed that such Bremsstrahlung spectrum may consist of at least two Maxwell–Boltzmann (MB) energy distributions [40,41] caused by separate populations of accelerated electrons. The layout of the detector allows for measuring the high- and low-energy components of the emitted photons (more details are reported in [42,43]). An example of raw data recorded during the Ion Accelerator technological commissioning is presented in Figure 18A, where the corresponding processed image is also shown in false color. The plot in Figure 18B returns the signal amplitude detected by each crystal of the scintillator array (blue) and the reconstructed signal using the unfolding technique (red).
An IR FLIR SC7300L camera equipped with an MCL sensor (320 × 256 pixels and 30 μm pitch) is also installed in the interaction chamber and points at the target. This is useful for monitoring the thermal response of the target and its surroundings due to laser–target energy transfer during operations at high repetition rate.

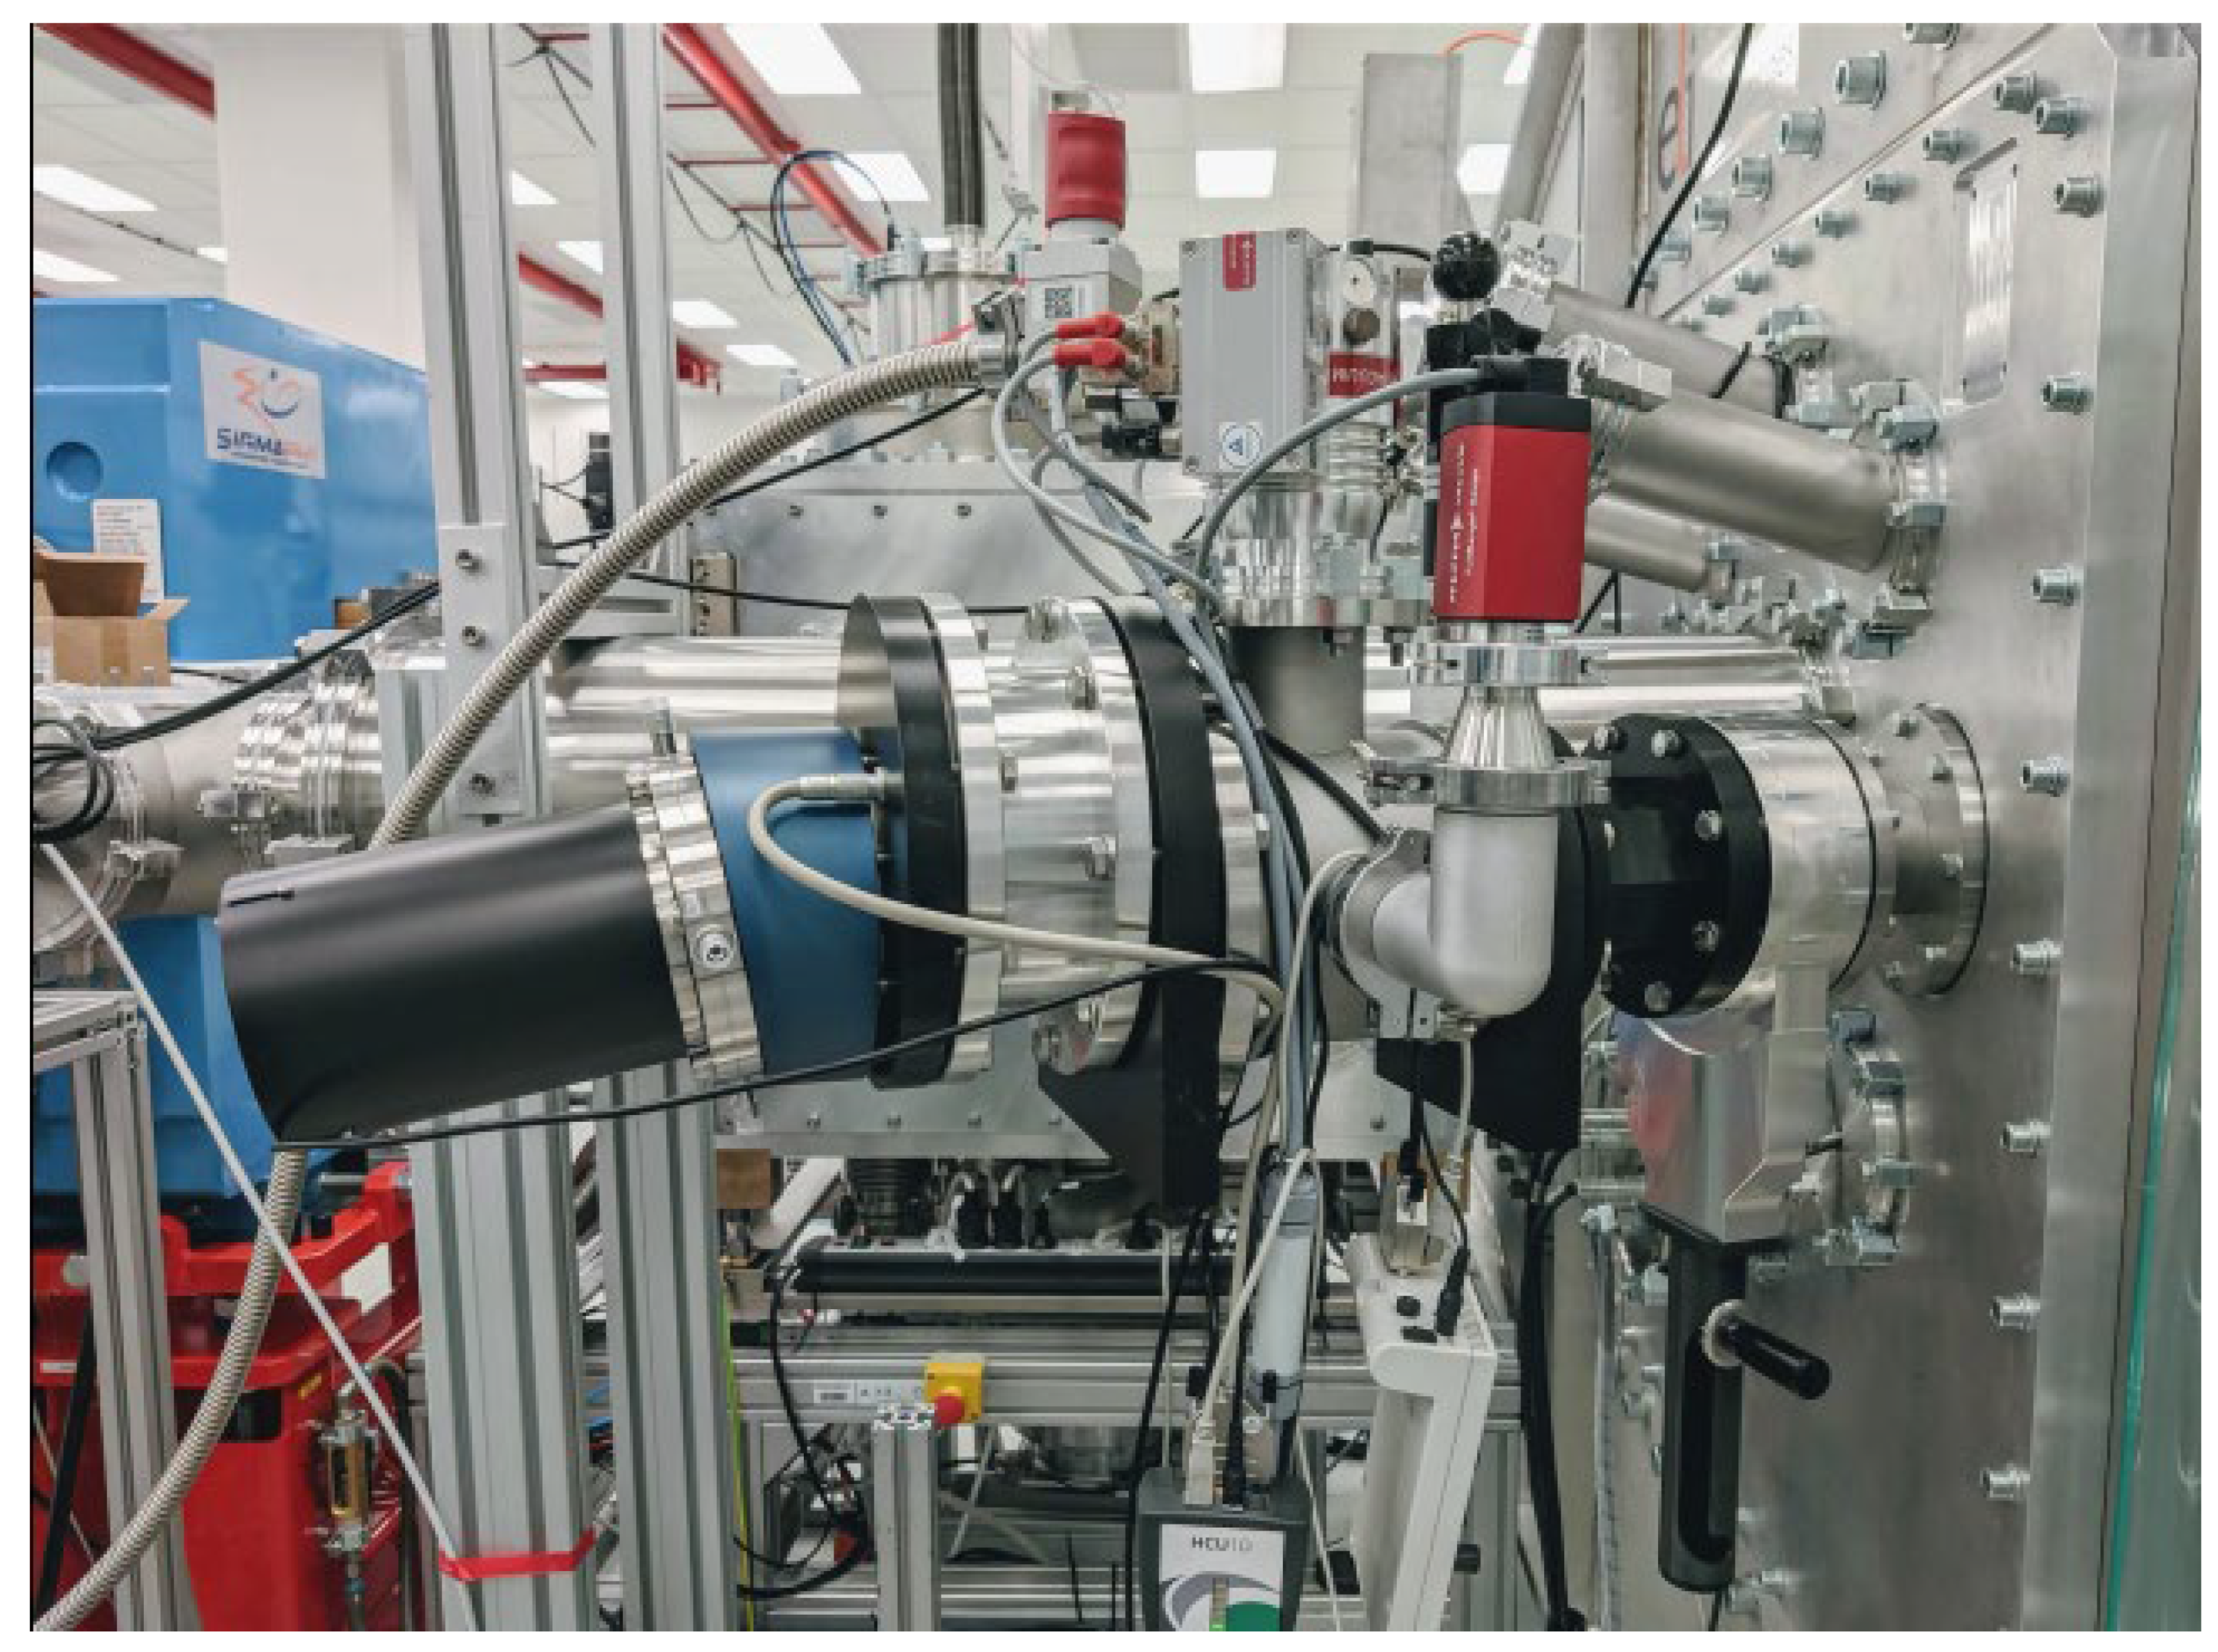
2.4. Ion Diagnostics

The ion diagnostic station consists of a series of active and passive detectors that are placed at different angles and distances around the interaction point, providing a full characterization of the accelerated proton beam in terms of energy and spatial distributions.
The passive devices are nuclear track detectors (polyallyldiglycol carbonate, commonly known as CR39), allowing the retrieval of the particle flux and energy spectrum after the etching process. Radio-chromic films (RCF) were also used in a stack configuration, retrieving the total ion dose within a given energy range and the particle beam spatial profile with high lateral resolution. These detectors are placed on a motorized system capable of handling nine sets of passive detectors and moving them in/out of the beam axis position according to the user requirements. The mechanics has a similar control system as the one shown for the target tower and can be eventually triggered to automatically change the detector to be irradiated after a certain number of shots.
The active ion diagnostic devices are the most important for a user beamline such as ELIMAIA to be able to provide online shot-to-shot feedback to the users. Two single-stage diamond detectors (DD), a double-stage diamond detector working as a telescope (DDT) in dE/E configuration, two silicon-carbide (SiC) detectors, and two ion collectors were used during the technical commissioning phase of the Ion Accelerator. These detectors are used in time-of-flight geometry and are able to acquire and process signals at 1Hz [37,44,45]. They are usually distributed around the interaction point, as in the scheme of Figure 19. Some detectors were set in the backward direction, and the majority of them were placed around the main proton beam axis (target normal) and in a dedicated diagnostics section to increase the distance from the target and hence the corresponding time/energy resolution. An ion collector with ring geometry was set along the target normal (0deg) and used in conjunction with a Thomson Parabola Spectrometer at the end of the ion diagnostic line [46,47,48,49]. A photo of the ion diagnostics line is shown in Figure 20. A detailed description of these detectors and of the methodology used to process the experimental data and the ion spectrum reconstruction is presented in [50,51].
The Thomson Parabola Spectrometer (TPS) is a compact device with parallel electric and magnetic fields that allow discriminating the different laser–plasma ion species and reconstructing their energy spectrum on a shot-to-shot basis. The main features of the TPS used are described in the introduction of [46]. The ELIMAIA TPS is equipped with a permanent magnetic dipole that can be reassembled with modular magnetic blocks to increase/decrease the dispersion of ions and hence the detection performances. The electrostatic dipole has a wedged shape with a variable aperture (smaller gap at the entrance and bigger at the output) to reduce losses of information in the lowest energy range. The TPS is coupled with a Chevron MCP coupled with a phosphor screen and a CCD camera for the image acquisition. Examples of raw data from the TPS and from some of the TOF detectors are shown in Figure 21.
The use of passive detectors usually implies long processing times before any analysis can be carried out. Moreover, a calibration curve is necessary to evaluate the response, in fact, specific calibration curves for different ion species are useful for precise analyses. The CR39 detectors need to be etched in NaOH or KOH base solution in order to increase the track’s size before analysis under a microscope (see Figure 22A). The radio-chromic films need to be digitalized with a high-resolution scanner and then analyzed with accurate unfolding procedures. An example of a set of RCF irradiated in a stack configuration is shown in Figure 22B. The yellow shape marks the ROI (region of interest) used for dose estimation, the results of which span from 3205 cGy in the first film of the stack (top left) to 10 cGy for the one before the last irradiated film (middle bottom). No dose was recorded on the sixth film, thus returning a cutoff energy of about 14 MeV for this particular laser shot.
Because of the long processing time, these passive detectors are not suitable for high repetition-rate acquisition and online feedback; however, they are important for data validation.
On the other hand, active detectors are suitable for high repetition-rate operation modes as the data are acquired and transferred almost simultaneously from the oscilloscope, or from the CCD camera, to a dedicate MATLAB program that analyzes them in real time and provides the first set of information, such as cutoff energy of protons and corresponding spectrum. An example of proton energy distributions reconstructed online during a set of 100 consecutive laser shots at 0.5 Hz repetition rate is shown in Figure 23. The laser energy and its fluctuations have been monitored during this sequence, and they result in being 10.4 J ± 1.5%. Details on the data analysis and their correlation with the laser parameters and fluctuations are reported in [30].

3. Main Outputs of the Ion Accelerator Technological Commissioning and Conclusions

The ELIMAIA Laser–Plasma Ion Accelerator was tested for the first time in 2021, and its technical (basic) commissioning was successfully completed. This phase was propaedeutic to start the advanced commissioning phase (results will be reported elsewhere [30]). A total number of 2200 shots were successfully delivered on target at laser intensities around 1021 W/cm2 in a net time of 13 days, with the longest sequence being of 487 shots on target at a 0.5 Hz repetition rate. Several target materials with different thicknesses and in different irradiation conditions were tested. The pie chart in Figure 24 shows the number of shots per different target material.
During the ELIMAIA technical commissioning, several activities were carried out to optimize and improve the whole accelerator technology, including procedures necessary to align and deliver the L3 laser with high intensity onto a target. Additionally, data acquisition and analyses in real time were tested with the goal to provide reliable and unique feedback in terms of laser, plasma, and ion diagnostics to future ELIMAIA users. Besides debugging the sophisticated Ion Accelerator equipment and laser/plasma diagnostics available at ELIMAIA, a special effort was put into the improvement and optimization of the temporal quality (i.e., intensity contrast) of the L3-HAPLS laser beam on target and of its focusability to reach an ultra-relativistic laser intensity regime exceeding 1021 W/cm2.
The L3’s performances at full power (in single shot and ~0.5 Hz) were monitored on target by means of the newly developed L3 Beam Diagnostics Station (BDS) of ELIMAIA, and its experimental outputs were benchmarked with those measured directly at the L3 laser hall, i.e., after ~100 m of laser beam transport. Such an iterative process, which also included other plasma/ion diagnostics, allowed a daily improvement and fine-tuning of the laser’s performances on target. In fact, this approach has led to a substantial intensity reduction of various laser pre-pulses and, ultimately, of the ns-ASE laser pedestal. As a consequence, the laser-accelerated proton beam’s performances were drastically enhanced both in terms of maximum energy and flux (these results will be reported elsewhere [30]).
Currently, an advanced commissioning campaign of the ELIMAIA Laser–Plasma Ion Accelerator is ongoing to demonstrate the readiness of this section for open-access user experiments within the newly established ELI-ERIC consortium [52]. In parallel, the technological commissioning of the ELIMED (ion beam transport and dosimetry) section is planned for the end of 2022. This will enable a broad range of users to exploit the full capabilities of the ELIMAIA beamline, e.g., both advanced schemes of laser–plasma acceleration and multidisciplinary applications of the laser’s accelerated ion beams with unique features [11].

Author Contributions

ELIMAIA Accelerator: conceptualization, D.M. and L.G.; methodology, L.G., F.G., M.T. (Maksym Tryusand) and T.L.; software, S.S., A.V., J.P. and M.G.Ž.; validation, M.T. (Maksym Tryusand), F.G., F.S. and S.S.; operation: F.S., M.T. (Maksym Tryusand), F.G., L.G., V.I. (Valeriia Istokskaia), A.V., S.S. and V.I. (Vahagn Ivanyan); formal analysis, A.V., V.I. (Valeriia Istokskaia), G.P., G.A.P.C., D.P., V.K., M.T. (Marco Tosca) and J.R.; investigation, D.M. and L.G.; writing—original draft preparation, F.S., L.G. and D.M.; writing—review and editing, all authors; writing—final editing, F.S. and D.M.; supervision, D.M.; project administration, D.M.; funding acquisition, D.M. and G.K.; L3 HALPS and L3BT: conceptualization: B.R., J.C., D.K. and P.B.; formal analysis, D.P.; operation, J.C., L.K., J.A.J., T.C., T.d.C.S. and M.C.; radioprotection: conceptualization, V.O.; supervision, operation, and analysis, R.T. and A.C.; validation, R.V. All authors have read and agreed to the published version of the manuscript.

Funding

This research was funded by the Ministry of Education, Youth and Sports of the Czech Republic by the project “Advanced Research Using High Intensity Laser Produced Photons and Particles” (CZ.02.1.01/0.0/0.0/16_019/0000789) and the IMPULSE project by the European Union Framework Program for Research and Innovation Horizon 2020 under grant agreement no. 871161. M. Tosca also acknowledges the support of Charles University through the student grant SVV 260 579-2021.

Institutional Review Board Statement

Not applicable.

Informed Consent Statement

Not applicable.

Data Availability Statement

Reference [30].

Acknowledgments

The authors would like to thank all the technical teams of ELI Beamlines (vacuum, mechanical design, control systems, and installation) for the support provided in the realization and installation of the ELIMAIA technology. We specially acknowledge Si.a.tel (Eng. Paolo Nicotra and Eng. Sandra Di Martino) for their professional and friendly support constantly provided, which led to an improvement of the ELIMAIA control system.

Conflicts of Interest

The authors declare no conflict of interest. The funders had no role in the design of the study; in the collection, analyses, or interpretation of data; in the writing of the manuscript; or in the decision to publish the results.

References

  1. Macchi, A.; Borghesi, M.; Passoni, M. Ion acceleration by superintense laser-plasma interaction. Rev. Mod. Phys. 2013, 85, 751–793. [Google Scholar] [CrossRef] [Green Version]
  2. Wilks, S.C.; Langdon, A.B.; Cowan, T.E.; Roth, M.; Singh, M.; Hatchett, S.; Key, M.H.; Pennington, D.; MacKinnon, A.; Snavely, R.A. Energetic proton generation in ultra-intense laser-solid interactions. Phys. Plasmas 2001, 8, 542–549. [Google Scholar] [CrossRef]
  3. Higginson, A.; Gray, R.; King, M.; Dance, R.J.; Williamson, S.D.R.; Butler, N.M.H.; Wilson, R.; Capdessus, R.; Armstrong, C.D.; Green, J.S.; et al. Near-100 MeV protons via a laser-driven transparency-enhanced hybrid acceleration scheme. Nat. Commun. 2018, 9, 724. [Google Scholar] [CrossRef] [Green Version]
  4. Bulanov, S.V.; Khoroshkov, V.S. Feasibility of using laser ion accelerators in proton therapy. Plasma Phys. Rep. 2020, 28, 453–456. [Google Scholar] [CrossRef]
  5. Yogo, A.; Maeda, T.; Hori, T.; Sakaki, H.; Ogura, K.; Nishiuchi, M.; Sagisaka, A.; Kiriyama, H.; Okada, H.; Kanazawa, S.; et al. Measurement of relative biological effectiveness of protons in human cancer cells using a laser-driven quasi mono energetic proton beamline. Appl. Phys. Lett. 2011, 98, 053701. [Google Scholar] [CrossRef]
  6. Roth, M.; Cowan, T.E.; Key, M.H.; Hatchett, S.P.; Brown, C.; Fountain, W.; Johnson, J.; Pennington, D.M.; Snavely, R.A.; Wilks, S.C.; et al. Fast Ignition by Intense Laser-Accelerated Proton Beams. Phys. Rev. Lett. 2001, 86, 436–439. [Google Scholar] [CrossRef] [PubMed]
  7. Giuffrida, L.; Belloni, F.; Margarone, D.; Petringa, G.; Milluzzo, G.; Scuderi, V.; Velyhan, A.; Rosinski, M.; Picciotto, A.; Kucharik, M.; et al. High-current stream of energetic α particles from laser-driven proton-boron fusion. Phys. Rev. 2020, 28, 013204. [Google Scholar] [CrossRef] [PubMed] [Green Version]
  8. Krása, J.; Klir, D.; Velyhan, A.; Rezac, K.; Cikhardt, J.; Ryć, L.; Krouský, E.; Pfeifer, M.; De Marco, M.; Skala, J.; et al. Generation of fast neutrons through deuteron acceleration at the PALS laser facility. JINST 2016, 11, C03050. [Google Scholar] [CrossRef]
  9. Barberio, M.; Veltri, S.; Scisciò, M.; Antici, P. Laser-Accelerated Proton Beams as Diagnostics for Cultural Heritage. Sci. Rep. 2017, 7, 40415. [Google Scholar] [CrossRef] [PubMed]
  10. Mourou, G.A.; Korn, G.; Sandner, W.; Collier, J.L. ELI—Extreme Light Infrastructure Whitebook: Science and Technology with Ultra-Intense Lasers; THOSS Media GmbH: Berlin, Germany, 2011. [Google Scholar]
  11. Margarone, D.; Cirrone, G.A.P.; Cuttone, G.; Amico, A.; Andò, L.; Borghesi, M.; Bulanov, S.S.; Bulanov, S.V.; Chatain, D.; Fajstavr, A.; et al. ELIMAIA: A Laser-Driven Ion Accelerator for Multidisciplinary Applications. Quantum Beam Sci. 2018, 2, 8. [Google Scholar] [CrossRef]
  12. Levato, T.; Bonora, S.; Grittani, G.M.; Lazzarini, C.M.; Nawaz, M.F.; Nevrkla, M.; Villanova, L.; Ziano, R.; Bassanese, S.; Bobrova, N.; et al. HELL: High-Energy Electrons by Laser Light, a User-Oriented Experimental Platform at ELI Beamlines. Appl. Sci. 2018, 8, 1565. [Google Scholar] [CrossRef] [Green Version]
  13. Weber, S.; Bechet, S.; Borneis, S.; Brabec, L.; Bučka, M.; Chacon-Golcher, E.; Ciappina, M.; DeMarco, M.; Fajstavr, A.; Falk, K.; et al. P3: An installation for high-energy density plasma physics and ultra-high intensity laser–matter interaction at ELI-Beamlines. Matter Radiat. Extrem. 2017, 2, 149–176. [Google Scholar] [CrossRef] [Green Version]
  14. Nejdl, J.; Chaulagain, U.; Mai, D.; Hort, O.; Lamač, M.; Raclavský, M.; Albrecht, M.; Jurkovič, M.; Finke, O.; Vábek, J.; et al. Update on Laser-driven X-ray Sources at ELI Beamlines. In Compact EUV & X-ray Light Sources; Optica Publishing Group: Washington, DC, USA, 2020; p. Eth5A.6. [Google Scholar] [CrossRef]
  15. Rus, B.; Batysta, F.; Čáp, J.; Divoký, M.; Fibrich, M.; Griffiths, M.; Haley, R.; Havlíček, T.; Hlavác, M.; Hřebíček, J.; et al. Outline of the ELI-Beamlines Facility. In Proc. SPIE 8080, Diode-Pumped High Energy and High Power Lasers; ELI: Ultrarelativistic Laser-Matter Interactions and Petawatt Photonics; and HiPER: The European Pathway to Laser Energy; Optica Publishing Group: Washington, DC, USA, 2011. [Google Scholar] [CrossRef]
  16. Sistrunk, E.F.; Spinka, T.; Bayramian, A.; Betts, S.; Bopp, D.; Buck, S.; Charron, K.; Cupal, J.; Deri, R.; Drouin, M.; et al. All Diode-Pumped, High-repetition-rate Advanced Petawatt Laser System (HAPLS). In CLEO: Science and Innovations; Optica Publishing Group: Hong Kong, China, 2020; p. STh1L.2. [Google Scholar] [CrossRef]
  17. Gauthier, M.; Curry, C.B.; Göde, S.; Brack, F.-E.; Kim, J.B.; MacDonald, M.; Metzkes-Ng, J.; Obst, L.; Rehwald, M.; Rödel, C.; et al. High repetition rate, multi-MeV proton source from cryogenic hydrogen jets. Appl. Phys. Lett. 2017, 111, 114102. [Google Scholar] [CrossRef] [Green Version]
  18. Noaman-Ul-Haq, M.; Ahmed, H.; Sokollik, T.; Yu, L.; Liu, Z.; Yuan, X.; Yuan, F.; Mirzaie, M.; Ge, X.; Chen, L.; et al. Statistical analysis of laser driven protons using a high-repetition-rate tape drive target system. Phys. Rev. Accel. Beams 2017, 20, 041301. [Google Scholar] [CrossRef] [Green Version]
  19. Morrison, J.T.; Feister, S.; Frische, K.D.; Austin, D.R.; Ngirmang, G.K.; Murphy, N.R.; Orban, C.; A Chowdhury, E.; Roquemore, W.M. MeV proton acceleration at kHz repetition rate from ultra-intense laser liquid interaction. New J. Phys. 2018, 20, 069501. [Google Scholar] [CrossRef]
  20. Valdes, P.P.; de Luis, D.; Hernandez, J.; Apiñaniz, J.; Curcio, A.; Henares, J.L.; Huault, M.; Perez-Hernandez, J.A.; Roso, L.; Gatti, G.; et al. Implementation of a thin, flat water target capable of high-repetition-rate MeV-range proton acceleration in a high-power laser at the CLPU. Plasma Phys. Control. Fusion 2022, 64, 054003. [Google Scholar] [CrossRef]
  21. Ferrari, A.; Amato, E.; Margarone, D.; Cowan, T.; Korn, G. Radiation field characterization and shielding studies for the ELI Beamlines facility. Appl. Surf. Sci. 2013, 272, 138–144. [Google Scholar] [CrossRef]
  22. Bechet, S.; Versaci, R.; Rollet, S.; Olšovcová, V.; Fajstavr, A.; Zakova, M.; Margarone, D. Radiation protection of a proton beamline at ELI-Beamlines. JINST 2016, 11, C12019. [Google Scholar] [CrossRef]
  23. Schillaci, F.; Cirrone, G.; Cuttone, G.; Maggiore, M.; Andó, L.; Amato, A.; Costa, M.; Gallo, G.; Korn, G.; LaRosa, G.; et al. Design of the ELIMAIA ion collection system. JINST 2015, 10, T12001. [Google Scholar] [CrossRef]
  24. Schillaci, F.; Maggiore, M.; Andó, L.; Cirrone, G.; Cuttone, G.; Romano, F.; Scuderi, V.; Allegra, L.; Amato, A.; Gallo, G.; et al. Design of a large acceptance, high efficiency energy selection system for the ELIMAIA beam-line. JINST 2016, 11, P08022. [Google Scholar] [CrossRef]
  25. Scuderi, V.; Amato, A.; Amico, A.G.; Borghesi, M.; Cirrone, G.A.P.; Cuttone, G.; Fajstavr, A.; Giuffrida, L.; Grepl, F.; Korn, G.; et al. Diagnostics and Dosimetry Solutions for Multidisciplinary Applications at the ELIMAIA Beamline. Appl. Sci. 2018, 8, 1415. [Google Scholar] [CrossRef] [Green Version]
  26. Berthold LB 6419. Available online: https://www.berthold.com/en/radiation-protection/products/dose-and-dose-rate/neutron-and-gamma-dose-rate-monitor-lb-6419/ (accessed on 1 September 2022).
  27. Klett, A.; Leuschner, A.; Tesch, N. A dose meter for pulsed neutron fields. Radiat. Meas. 2010, 45, 1242–1244. [Google Scholar] [CrossRef] [Green Version]
  28. VF Nuclear MDG Dose Rate Meteres. Available online: https://www.vfnuclear.com/en/products/dose-rate-meters-mdg-0x (accessed on 1 September 2022).
  29. Lévy, A.; Ceccotti, T.; D’Oliveira, P.; Réau, F.; Perdrix, M.; Quéré, F.; Monot, P.; Bougeard, M.; Lagadec, H.; Martin, P.; et al. Double plasma mirror for ultrahigh temporal contrast ultraintense laser pulses. Opt. Lett. 2007, 32, 310–312. [Google Scholar] [CrossRef]
  30. Giuffrida, L.; Chagovets, T.; Cirrone, G.A.P.; Cuhra, M.; Cupal1, J.; de Castro Silva, T.; Grepl, F.; Greplova Zakova, M.; Hadjikyriacou, A.; Horálek, R.; et al. Basic Commissioning of the Laser-Plasma Ion accelerator at the ELIMAIA user beamline. Nature Comms. Phys. 2022; submitted for publication. [Google Scholar]
  31. Borneis, S.; Laštovička, T.; Sokol, M.; Jeong, T.-M.; Condamine, F.; Renner, O.; Tikhonchuk, V.; Bohlin, H.; Fajstavr, A.; Hernandez, J.-C.; et al. Design, installation and commissioning of the ELI-Beamlines high-power, high-repetition rate HAPLS laser beam transport system to P3. High Power Laser Sci. Eng. 2021, 9, E30. [Google Scholar] [CrossRef]
  32. APE FC Spider. Available online: https://www.ape-berlin.de/en/spider-spectral-phase-interferometry-for-direct-electric-field-reconstruction/fc-spider/ (accessed on 1 September 2022).
  33. Seigman, A. Lasers; Publisher University Science Books: Herndon, VA, USA, 1990; ISBN 100935702113. [Google Scholar]
  34. Perry, M.D.; Ditmire, T.; Stuart, B.C. Self-phase modulation in chirped-pulse amplification. Opt. Lett. 1994, 19, 2149–2151. [Google Scholar] [CrossRef]
  35. Askar’yan, G.A. Cerenkov Radiation and Transition Radiation from Electromagnetic Waves. J. Exp. Theor. Phys. 1962, 15, 943–946. [Google Scholar]
  36. Chiao, R.Y.; Garmire, E.; Townes, C.H. Self-Trapping of Optical Beams. Phys. Rev. Lett. 1964, 13, 479. [Google Scholar] [CrossRef]
  37. Chagovets, T.; Stanček, S.; Giuffrida, L.; Velyhan, A.; Tryus, M.; Grepl, F.; Istokskaia, V.; Kantarelou, V.; Wiste, T.; Martin, J.H.; et al. Automation of target delivery and diagnostic systems for high repetition rate laser-plasma acceleration and applications. Appl. Sci. 2021, 11, 1680. [Google Scholar] [CrossRef]
  38. Hp-Spectroscopy, maxLIGHT Pro. Available online: https://www.hp-spectroscopy.com/maxlight (accessed on 1 September 2022).
  39. Phuoc, K.T.; Corde, S.; Thaury, C.; Malka, V.; Tafzi, A.; Goddet, J.-P.; Shah, R.C.; Sebban, S.; Rousse, A. All-optical Compton gamma-ray source. Nat. Photon 2016, 6, 308–311. [Google Scholar] [CrossRef]
  40. Rosmej, O.N.; Samsonova, Z.; Höfer, S.; Kartashov, D.; Arda, C.; Khaghani, D.; Schoenlein, A.; Zähter, S.; Hoffmann, A.; Loetzsch, R.; et al. Generation of keV hot near-solid density plasma states at high contrastlaser-matter interaction. Phys. Plasmas 2018, 25, 083103. [Google Scholar] [CrossRef] [Green Version]
  41. Zulick, C.; Hou, B.; Dollar, F.; Maksimchuk, A.; Nees, J.; Thomas, A.; Zhao, Z.; Krushelnick, K. High resolution bremsstrahlung and fast electron characterization in ultrafast intense laser-solid interactions. New J. Phys. 2013, 15, 123038. [Google Scholar] [CrossRef] [Green Version]
  42. Istokskaia, V.; Stránský, V.; Giuffrida, L.; Versaci, R.; Grepl, F.; Tryus, M.; Velyhan, A.; Dudžák, R.; Krása, J.; Krupka, M.; et al. Experimental tests and signal unfolding of a scintillator calorimeter for laser-plasma characterization. JINST 2021, 16, T02006. [Google Scholar] [CrossRef]
  43. Stránský, V.; Istokskaia, V.; Versaci, R.; Giuffrida, L.; Cimmino, A.; Margarone, D.; Olšovcová, V. Development, optimization, and calibration of an active electromagnetic calorimeter for pulsed radiation spectrometry. JINST 2021, 16, P08060. [Google Scholar] [CrossRef]
  44. Margarone, D.; Krása, J.; Giuffrida, L.; Picciotto, A.; Torrisi, L.; Nowak, T.; Musumeci, P.; Velyhan, A.; Prokůpek, J.; Láska, L.; et al. Full characterization of laser-accelerated ion beams using Faraday cup, silicon carbide, and single-crystal diamond detectors. J. Appl. Phys. 2011, 109, 103302. [Google Scholar] [CrossRef]
  45. Scuderi, V.; Milluzzo, G.; Doria, D.; Alejo, A.; Amico, A.; Booth, N.; Cuttone, G.; Green, J.; Kar, S.; Korn, G.; et al. TOF diagnosis of laser accelerated, high-energy protons. NIMA 2020, 978, 164364. [Google Scholar] [CrossRef]
  46. Schillaci, F.; Nevrkla, M.; Maggiore, M.; Goncalves, L.; Cirrone, G.; Velyhan, A.; Margarone, D. Design of a high energy Thomson Parabola ion spectrometer for the ELIMAIA beamline. JINST 2019, 14, T06004. [Google Scholar] [CrossRef]
  47. Thomson, J.J. Rays of positive electricity. Phil. Mag. 1911, 21, 225. [Google Scholar] [CrossRef] [Green Version]
  48. Harres, K.; Schollmeier, M.; Brambrink, E.; Audebert, P.; Blažević, A.; Flippo, K.; Gautier, D.C.; Geißel, M.; Hegelich, B.M.; Nürnberg, F.; et al. Development and calibration of a Thomson parabola with microchannel plate for the detection of laser-accelerated MeV ions. Rev. Sci. Instrum. 2008, 79, 093306. [Google Scholar] [CrossRef]
  49. Rhee, M.J. Compact Thomson spectrometer. Rev. Sci. Instrum. 1984, 55, 1229. [Google Scholar] [CrossRef]
  50. Scuderi, V.; Milluzzo, G.; Alejo, A.; Amico, A.; Booth, N.; Cirrone, G.; Doria, D.; Green, J.; Kar, S.; LaRosa, G.; et al. Time of Flight based diagnostics for high energy laser driven ion beams. JINST 2017, 12, C03086. [Google Scholar] [CrossRef]
  51. Milluzzo, G.; Scuderi, V.; Alejo, A.; Amico, A.G.; Booth, N.; Borghesi, M.; Cirrone, G.A.P.; Cuttone, G.; Doria, D.; Green, J.; et al. A new energy spectrum reconstruction method for time-of-flight diagnostics of high-energy laser-driven protons. Rev. Sci. Instrum. 2019, 90, 083303. [Google Scholar] [CrossRef] [PubMed]
  52. ELI ERIC. Available online: https://eli-laser.eu/ (accessed on 1 September 2022).
Figure 1. Photo of the E4 local control room. The screens show some key control software (central vacuum and mechanics). The dose rate monitor LB 6419 is visible next to the second large screen on the wall. The E4 hall access is interlocked and has EMP shielding. The graphic interfaces for some of the ELIMAIA controls are detailed in the next sections.
Qubs 06 00030 g001
Figure 2. Overview of the L3 Beam Transport (BT) system. CH10 is the first chamber underneath the L3 compressor; CH26 is a switchyard chamber used to deliver the L3 beam to the E3 hall. SGV504 is the Safety Gate Valve isolating the L3 BT path leading to the E4 Hall.
Qubs 06 00030 g002
Figure 3. Details of the final L3BT section before the injection of the L3 beam into the ELIMAIA plasma accelerator. The BT Periscope redirects the L3 beam down and injects it into the ECU-D1 Plasma Mirror Chamber. The valve EGV502 (equipped with 100 mm window) allows operation with the following vacuum section in air, or in vacuum, as it is equipped with a glass window. In the current configuration, the ECU-D1 chamber is equipped with a turning mirror (no plasma mirror is used), and the laser beam is sent into the next turning chamber (CH060) and finally into the ECU-D2 Interaction Chamber. The optical setup in the Interaction Chamber can be arranged symmetrically in two configurations using the same optical elements. The ion beams can be either accelerated along the ELIMED or the Ion Diagnostics axes (both setups are visible in the schematic). A leak mirror in ECU-D2 sends the beam to the Beam Diagnostic Station for online, full-power laser characterization. A detailed view of the optical setup is shown in Figure 4.
Qubs 06 00030 g003
Figure 4. Detailed view of the optical setup arranged to accelerate the ion beams towards the Ion Diagnostics line (Ion Accelerator commissioning setup), including the position of the L3 laser beam, ion diagnostics, and alignment station. The angle of incidence of each mirror in the optical setup is specified. The mirror LMo4 (15°) is a leak mirror and transmits a fraction of the laser energy towards the BDS for online analysis. The last mirror LMo6 (17.5°) is installed to send the beam towards the OAP set on the main axis of the Ion Diagnostics Chamber, but it can be turned by 90deg to send the beam in the opposite direction (assuming that the OAP would be installed on the main axis of ELIMED).
Qubs 06 00030 g004
Figure 5. Three-dimensional model of alignment crosses (A), picture of the beam at the position of an alignment cross (B), L3BT mirror mount with reference cross (C), and corresponding camera box and image of the cross in the small insert (D).
Qubs 06 00030 g005
Figure 6. Typical example of focal spot at the ELIMAIA interaction chamber (A) and processed image for the calculation of the laser intensity on target (B). In this case, the energy at FWHM is 21.1%.
Qubs 06 00030 g006
Figure 7. Graphic interface for OAP motion control. The same interface allows controlling both the Focusing OAP in the ECU-D2 and the Diagnostic OAP in the BSD.
Qubs 06 00030 g007
Figure 8. (A) Spectral intensity and spectral phase and (B) transform limited and temporal pulse shape of L3 measured at the ELIMAIA Beamline.
Qubs 06 00030 g008
Figure 9. BDS optical setup. The laser beam is sent to the long focal-length OAP through a high-quality window available in the D2 vacuum chamber. After the focal point, the size of the beam is kept small, and it is split using a 2” beam splitter (BS) into four branches of the BDS: near field (NF), far field (FF) equipped with cameras and ND filters, and the two branches for the nanosecond-level intensity contrast of the beam, which is monitored using two fast photodiodes.
Qubs 06 00030 g009
Figure 10. Processed far-field image measured at high power on the BDS table (A) and corresponding raw near-field image (B) of the L3 laser beam.
Qubs 06 00030 g010
Figure 11. Pointing stability in μrad measured at the ELIMAIA BDS using L3 at low power (upper plot) and at full power (lower plot) during a series of 100 consecutive shots at about 1Hz.
Qubs 06 00030 g011
Figure 12. L3 temporal profile measured at the ELIMAIA BDS for (A) pre-pulse analysis in the long time scale and (B) short time scale for intensity contrast estimation with respect to the main ultra-intense pulse. ASE reduction plot, associated to an increase of the L3 contrast (C).
Qubs 06 00030 g012
Figure 13. Photo showing details of the interaction area in the ECU D2 interaction chamber.
Qubs 06 00030 g013
Figure 14. Target tower motion system main user interface.
Qubs 06 00030 g014
Figure 15. Example of plasma imaging raw picture (A) with 3.1 magnification where the laser beam is in the right/left direction and (B) example of plasma optical spectrum. The blue and green components represent the second harmonic emission and the two-plasmon decay.
Qubs 06 00030 g015
Figure 16. XUV spectrometer installed on the ECU D2 chamber and pointing at the interaction point.
Qubs 06 00030 g016
Figure 17. Gamma detector scintillation signal for different target materials.
Qubs 06 00030 g017
Figure 18. (A) Raw image of the scintillator emission and corresponding processed image. (B) Analyzed data showing the signal amplitude emitted by each crystal.
Qubs 06 00030 g018
Figure 19. Typical setup for the ion diagnostics around the interaction point.
Qubs 06 00030 g019
Figure 20. Photograph of the ion diagnostics station connected to the ECU-D2 chamber (the blue electromagnets of the ELIMED Beamline are also visible).
Qubs 06 00030 g020
Figure 21. A typical TPS spectrogram (A) and TOF spectra (B).
Qubs 06 00030 g021
Figure 22. Detailed view of a CR-39 after a partial etching process (A) where the ion tracks are visible, and a set of radio-chromic films (B) are irradiated in stack configuration (the yellow squared region marks the ROI used for dose calculation).
Qubs 06 00030 g022
Figure 23. Processed data for a high repetition-rate (0.5 Hz) series of 100 shots on 12 μm aluminum target. The plot provides the proton energy distributions online in terms of particle flux (color bar) and cutoff energy for each shot in the series.
Qubs 06 00030 g023
Figure 24. Pie chart showing the total number of shots fired per target material.
Qubs 06 00030 g024
Publisher’s Note: MDPI stays neutral with regard to jurisdictional claims in published maps and institutional affiliations.

